

CaptainAltcoin
27.3k Posts

CaptainAltcoin
Report
Block User
Ahoy, crypto sailors! Navigate the stormy seas of the digital world with CaptainAltcoin, your trusty compass for crypto guides, reviews, and news.
7 Following
101.4K+ Followers
94.7K+ Liked
1 Badges
Posts
Article
Cardano Price Prediction: Analyst Warns ADA Could Fall Toward…Cardano price is back under heavy pressure, and one of the analysts we regularly follow is not convinced the correction is finished.
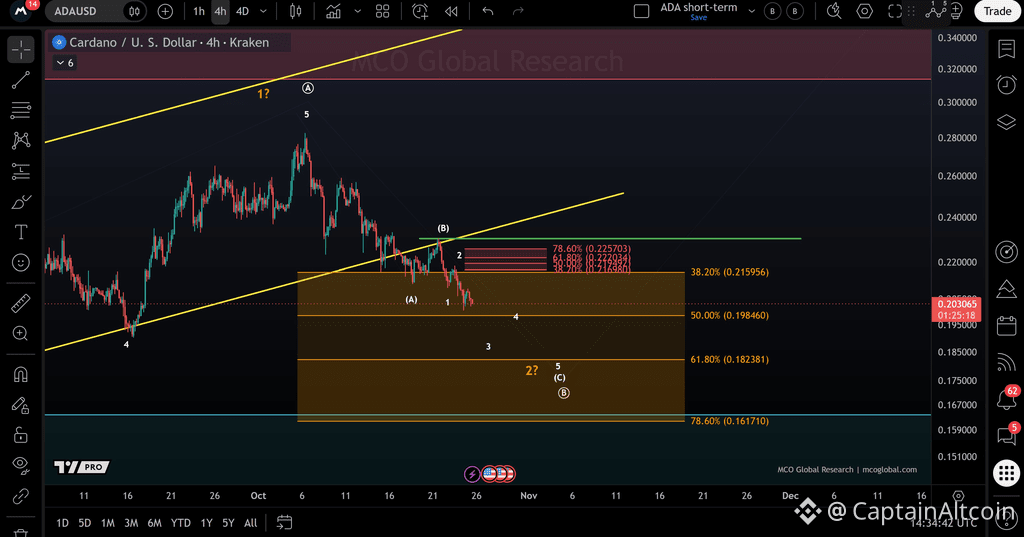
More Crypto Online, whose Elliott Wave work tends to map both the bullish and bearish paths rather than force a single outcome, says the ADA price remains weak in the short term. His latest four-hour Kraken chart leaves room for another decline toward roughly $0.18, with an even deeper level near $0.162 if sellers stay in control.
ADA is currently around $0.203, already below several levels that previously supported the recovery.
More Crypto Online Maps a Deeper Wave 2
The chart treats the current decline as part of a possible larger Wave 2 correction.
ADA previously rallied toward roughly $0.28 before beginning the latest decline. The recovery attempt around $0.225 then failed, and price has since moved back below $0.21.
More Crypto Online marks several Fibonacci levels that define the downside path:
38.2% near $0.21596
50% near $0.19846
61.8% near $0.18238
78.6% near $0.16171
Source: X/@Morecryptoonl
ADA has already lost the 38.2% level and is now hovering just above the 50% retracement around $0.1985.
That makes the next few closes important.
If $0.198-$0.20 gives way, the chart naturally shifts attention toward $0.182. That would put ADA about 10% below its current price.
The more severe version of the correction reaches roughly $0.162, where the 78.6% retracement is located.
The analyst’s wave labels also show a possible five-wave move lower completing somewhere inside this broader retracement zone. In other words, he is not necessarily calling for a collapse. He is mapping where this correction could finish before a larger recovery attempt begins.
What ADA Needs to Do to Change the Setup
The upside levels are much closer than the larger downside targets.
More Crypto Online marks a cluster between roughly $0.217 and $0.226:
$0.21698
$0.21949
$0.22203
$0.22570
That area acted as resistance during the latest bounce.
For me, ADA getting back above $0.225 would be the first useful sign that the current bearish structure is losing control.
Until then, rallies into the low-$0.22s can still be treated as corrective moves inside the larger decline.
The ADA chart also shows a broader rising trend structure overhead, but ADA has already moved well below its former lower boundary. Bulls therefore need more than a one-day bounce to repair the damage.
Read also: This Analyst’s Cardano Price Prediction Could Surprise ADA Holders
Cardano Has Had Some Positive News, but Price Has Ignored It
The weakness does not appear to come from one new Cardano-specific shock.
Recent reporting has instead described ADA’s decline as part of weaker altcoin conditions and technical selling.
There have actually been some constructive ecosystem developments.
One recent proposal asks Cardano governance participants to approve roughly 22 million ADA from the treasury for a tokenized copper reserve. The vote runs into November, although the proposal is controversial because the economics depend heavily on future copper prices.
Cardano has also continued its push into regulated assets. Recent developments around the CIP-0113 programmable-token standard included Veridian tokenizing company shares on Cardano, giving the network a live example of how compliant securities could potentially be issued as native assets.
Those developments help the longer-term ecosystem story, but ADA traders are clearly prioritizing price structure and broader market conditions right now.
That is why I would not assume positive project news alone will stop the current correction.
My Cardano Price Outlook
I think More Crypto Online’s $0.18 area is realistic if ADA loses $0.198 decisively.
The chart gives us a fairly clean sequence:
$0.20 holds → another attempt toward $0.217-$0.226.
$0.198 breaks → approximately $0.182 becomes the next technical destination.
$0.182 fails → the deeper $0.162 region comes into view.
Personally, I would view $0.18 as the more interesting area before jumping straight to the worst-case target. It lines up with the 61.8% retracement and could offer a logical place for the current corrective structure to finish.
For now, though, ADA has not shown enough to say the bottom is in.
For more crypto news and price predictions, click here.
Subscribe to our YouTube channel for daily crypto updates, market insights, and expert analysis.
The post Cardano Price Prediction: Analyst Warns ADA Could Fall Toward… appeared first on CaptainAltcoin.
Cardano Price Prediction: Analyst Warns ADA Could Fall Toward…
Cardano price is back under heavy pressure, and one of the analysts we regularly follow is not convinced the correction is finished.
More Crypto Online, whose Elliott Wave work tends to map both the bullish and bearish paths rather than force a single outcome, says the ADA price remains weak in the short term. His latest four-hour Kraken chart leaves room for another decline toward roughly $0.18, with an even deeper level near $0.162 if sellers stay in control.
ADA is currently around $0.203, already below several levels that previously supported the recovery.
More Crypto Online Maps a Deeper Wave 2
The chart treats the current decline as part of a possible larger Wave 2 correction.
ADA previously rallied toward roughly $0.28 before beginning the latest decline. The recovery attempt around $0.225 then failed, and price has since moved back below $0.21.
More Crypto Online marks several Fibonacci levels that define the downside path:
38.2% near $0.21596
50% near $0.19846
61.8% near $0.18238
78.6% near $0.16171
Source: X/@Morecryptoonl
ADA has already lost the 38.2% level and is now hovering just above the 50% retracement around $0.1985.
That makes the next few closes important.
If $0.198-$0.20 gives way, the chart naturally shifts attention toward $0.182. That would put ADA about 10% below its current price.
The more severe version of the correction reaches roughly $0.162, where the 78.6% retracement is located.
The analyst’s wave labels also show a possible five-wave move lower completing somewhere inside this broader retracement zone. In other words, he is not necessarily calling for a collapse. He is mapping where this correction could finish before a larger recovery attempt begins.
What ADA Needs to Do to Change the Setup
The upside levels are much closer than the larger downside targets.
More Crypto Online marks a cluster between roughly $0.217 and $0.226:
$0.21698
$0.21949
$0.22203
$0.22570
That area acted as resistance during the latest bounce.
For me, ADA getting back above $0.225 would be the first useful sign that the current bearish structure is losing control.
Until then, rallies into the low-$0.22s can still be treated as corrective moves inside the larger decline.
The ADA chart also shows a broader rising trend structure overhead, but ADA has already moved well below its former lower boundary. Bulls therefore need more than a one-day bounce to repair the damage.
Read also: This Analyst’s Cardano Price Prediction Could Surprise ADA Holders
Cardano Has Had Some Positive News, but Price Has Ignored It
The weakness does not appear to come from one new Cardano-specific shock.
Recent reporting has instead described ADA’s decline as part of weaker altcoin conditions and technical selling.
There have actually been some constructive ecosystem developments.
One recent proposal asks Cardano governance participants to approve roughly 22 million ADA from the treasury for a tokenized copper reserve. The vote runs into November, although the proposal is controversial because the economics depend heavily on future copper prices.
Cardano has also continued its push into regulated assets. Recent developments around the CIP-0113 programmable-token standard included Veridian tokenizing company shares on Cardano, giving the network a live example of how compliant securities could potentially be issued as native assets.
Those developments help the longer-term ecosystem story, but ADA traders are clearly prioritizing price structure and broader market conditions right now.
That is why I would not assume positive project news alone will stop the current correction.
My Cardano Price Outlook
I think More Crypto Online’s $0.18 area is realistic if ADA loses $0.198 decisively.
The chart gives us a fairly clean sequence:
$0.20 holds → another attempt toward $0.217-$0.226.
$0.198 breaks → approximately $0.182 becomes the next technical destination.
$0.182 fails → the deeper $0.162 region comes into view.
Personally, I would view $0.18 as the more interesting area before jumping straight to the worst-case target. It lines up with the 61.8% retracement and could offer a logical place for the current corrective structure to finish.
For now, though, ADA has not shown enough to say the bottom is in.
For more crypto news and price predictions, click here.
Subscribe to our YouTube channel for daily crypto updates, market insights, and expert analysis.
The post Cardano Price Prediction: Analyst Warns ADA Could Fall Toward… appeared first on CaptainAltcoin.
More Crypto Online, whose Elliott Wave work tends to map both the bullish and bearish paths rather than force a single outcome, says the ADA price remains weak in the short term. His latest four-hour Kraken chart leaves room for another decline toward roughly $0.18, with an even deeper level near $0.162 if sellers stay in control.
ADA is currently around $0.203, already below several levels that previously supported the recovery.
More Crypto Online Maps a Deeper Wave 2
The chart treats the current decline as part of a possible larger Wave 2 correction.
ADA previously rallied toward roughly $0.28 before beginning the latest decline. The recovery attempt around $0.225 then failed, and price has since moved back below $0.21.
More Crypto Online marks several Fibonacci levels that define the downside path:
38.2% near $0.21596
50% near $0.19846
61.8% near $0.18238
78.6% near $0.16171
Source: X/@Morecryptoonl
ADA has already lost the 38.2% level and is now hovering just above the 50% retracement around $0.1985.
That makes the next few closes important.
If $0.198-$0.20 gives way, the chart naturally shifts attention toward $0.182. That would put ADA about 10% below its current price.
The more severe version of the correction reaches roughly $0.162, where the 78.6% retracement is located.
The analyst’s wave labels also show a possible five-wave move lower completing somewhere inside this broader retracement zone. In other words, he is not necessarily calling for a collapse. He is mapping where this correction could finish before a larger recovery attempt begins.
What ADA Needs to Do to Change the Setup
The upside levels are much closer than the larger downside targets.
More Crypto Online marks a cluster between roughly $0.217 and $0.226:
$0.21698
$0.21949
$0.22203
$0.22570
That area acted as resistance during the latest bounce.
For me, ADA getting back above $0.225 would be the first useful sign that the current bearish structure is losing control.
Until then, rallies into the low-$0.22s can still be treated as corrective moves inside the larger decline.
The ADA chart also shows a broader rising trend structure overhead, but ADA has already moved well below its former lower boundary. Bulls therefore need more than a one-day bounce to repair the damage.
Read also: This Analyst’s Cardano Price Prediction Could Surprise ADA Holders
Cardano Has Had Some Positive News, but Price Has Ignored It
The weakness does not appear to come from one new Cardano-specific shock.
Recent reporting has instead described ADA’s decline as part of weaker altcoin conditions and technical selling.
There have actually been some constructive ecosystem developments.
One recent proposal asks Cardano governance participants to approve roughly 22 million ADA from the treasury for a tokenized copper reserve. The vote runs into November, although the proposal is controversial because the economics depend heavily on future copper prices.
Cardano has also continued its push into regulated assets. Recent developments around the CIP-0113 programmable-token standard included Veridian tokenizing company shares on Cardano, giving the network a live example of how compliant securities could potentially be issued as native assets.
Those developments help the longer-term ecosystem story, but ADA traders are clearly prioritizing price structure and broader market conditions right now.
That is why I would not assume positive project news alone will stop the current correction.
My Cardano Price Outlook
I think More Crypto Online’s $0.18 area is realistic if ADA loses $0.198 decisively.
The chart gives us a fairly clean sequence:
$0.20 holds → another attempt toward $0.217-$0.226.
$0.198 breaks → approximately $0.182 becomes the next technical destination.
$0.182 fails → the deeper $0.162 region comes into view.
Personally, I would view $0.18 as the more interesting area before jumping straight to the worst-case target. It lines up with the 61.8% retracement and could offer a logical place for the current corrective structure to finish.
For now, though, ADA has not shown enough to say the bottom is in.
For more crypto news and price predictions, click here.
Subscribe to our YouTube channel for daily crypto updates, market insights, and expert analysis.
The post Cardano Price Prediction: Analyst Warns ADA Could Fall Toward… appeared first on CaptainAltcoin.
86
URGENT: PancakeSwap Advises CAKE Holders to Bridge Tokens Before Nov. 23PancakeSwap is urging CAKE holders on opBNB to move their tokens before November 23 as LayerZero prepares to end support for the network.
The decentralized exchange said CAKE bridging out of opBNB through LayerZero will stop on November 23 at 00:00 UTC.
Users who still hold CAKE on opBNB are being advised to bridge their tokens to BNB Chain before the deadline.
PancakeSwap Shares Bridging Instructions
PancakeSwap outlined four steps for affected users:
Open PancakeSwap’s bridge page.
Connect the wallet holding CAKE on opBNB.
Select opBNB as the source network and BNB Chain as the destination.
Choose CAKE, enter the amount and confirm the transaction.
The team also warned users to be careful with phishing attempts and to verify links before connecting a wallet.
The notice does not mean CAKE itself is being discontinued. The change specifically affects the LayerZero route used to bridge CAKE out of opBNB.
For holders who still have CAKE on opBNB, the main point is the deadline: after November 23 at 00:00 UTC, the current LayerZero-based bridging option will no longer be available.
For more crypto news and price predictions, click here.
Subscribe to our YouTube channel for daily crypto updates, market insights, and expert analysis.
The post URGENT: PancakeSwap Advises CAKE Holders to Bridge Tokens Before Nov. 23 appeared first on CaptainAltcoin.
URGENT: PancakeSwap Advises CAKE Holders to Bridge Tokens Before Nov. 23
PancakeSwap is urging CAKE holders on opBNB to move their tokens before November 23 as LayerZero prepares to end support for the network.
The decentralized exchange said CAKE bridging out of opBNB through LayerZero will stop on November 23 at 00:00 UTC.
Users who still hold CAKE on opBNB are being advised to bridge their tokens to BNB Chain before the deadline.
PancakeSwap Shares Bridging Instructions
PancakeSwap outlined four steps for affected users:
Open PancakeSwap’s bridge page.
Connect the wallet holding CAKE on opBNB.
Select opBNB as the source network and BNB Chain as the destination.
Choose CAKE, enter the amount and confirm the transaction.
The team also warned users to be careful with phishing attempts and to verify links before connecting a wallet.
The notice does not mean CAKE itself is being discontinued. The change specifically affects the LayerZero route used to bridge CAKE out of opBNB.
For holders who still have CAKE on opBNB, the main point is the deadline: after November 23 at 00:00 UTC, the current LayerZero-based bridging option will no longer be available.
For more crypto news and price predictions, click here.
Subscribe to our YouTube channel for daily crypto updates, market insights, and expert analysis.
The post URGENT: PancakeSwap Advises CAKE Holders to Bridge Tokens Before Nov. 23 appeared first on CaptainAltcoin.
The decentralized exchange said CAKE bridging out of opBNB through LayerZero will stop on November 23 at 00:00 UTC.
Users who still hold CAKE on opBNB are being advised to bridge their tokens to BNB Chain before the deadline.
PancakeSwap Shares Bridging Instructions
PancakeSwap outlined four steps for affected users:
Open PancakeSwap’s bridge page.
Connect the wallet holding CAKE on opBNB.
Select opBNB as the source network and BNB Chain as the destination.
Choose CAKE, enter the amount and confirm the transaction.
The team also warned users to be careful with phishing attempts and to verify links before connecting a wallet.
The notice does not mean CAKE itself is being discontinued. The change specifically affects the LayerZero route used to bridge CAKE out of opBNB.
For holders who still have CAKE on opBNB, the main point is the deadline: after November 23 at 00:00 UTC, the current LayerZero-based bridging option will no longer be available.
For more crypto news and price predictions, click here.
Subscribe to our YouTube channel for daily crypto updates, market insights, and expert analysis.
The post URGENT: PancakeSwap Advises CAKE Holders to Bridge Tokens Before Nov. 23 appeared first on CaptainAltcoin.
183
Gold Price Prediction: Analyst Warns Late Buyers Could Get TrappedGold’s long-term story may still be bullish, but one analyst believes investors buying after the huge 2026 run could be walking into a painful correction first.
Analyst Danny Crypton argues that gold is entering a dangerous phase of its cycle. His view is not that the broader bull market is finished. He expects one large selloff before another substantial rally begins.
His case combines high Treasury yields, expensive oil, dollar strength, institutional selling and an old market-cycle model that marks 2026 as a possible selling period.
I think the basic idea is interesting, even if I would not treat the historical cycle model as a reliable forecasting tool on its own.
High Rates Are Still a Problem for Gold
The first part of Danny’s argument is straightforward.
U.S. Treasury yields remain extremely high, with the 30-year above 5.5% and the 10-year near 5.2% in the figures he cites.
Gold produces no yield.
When investors can earn around 5% from U.S. government debt, holding gold becomes less attractive for some portfolios, especially when the market expects interest rates to stay high.
Oil adds another complication.
Crude trading above $100 keeps inflation fears alive. If expensive energy keeps inflation elevated, the Federal Reserve has less room to lower rates and could keep monetary policy restrictive for longer.
GOLD INVESTORS ARE NOT READY FOR WHAT COMES NEXT!
Everyone is watching gold near its highs and expecting another massive rally.
But I see something completely different.
I believe gold is approaching one of the most dangerous phases of this cycle.
And here are 6 reasons why:
INTEREST RATES ARE BECOMING A MASSIVE PROBLEM:
The U.S. 30-year Treasury yield is above 5.5%, while the 10-year is approaching 5.2%.
Gold pays no interest.
As yields climb, investors have more reasons to move their money into interest-paying assets.
And that’s bad news for gold.
OIL PRICES ARE MAKING EVERYTHING WORSE:
Oil above $100 is bringing inflation fears back.
And higher inflation means the Fed faces even more pressure to keep rates elevated or raise them again.
That’s another major headwind for gold.
THE U.S. DOLLAR COULD GET MUCH STRONGER:
Higher Treasury yields can attract more capital into dollar-denominated assets.
A stronger dollar makes gold more expensive for international buyers.
And that puts additional pressure on demand.
INSTITUTIONAL SELLING IS A SERIOUS WARNING:
Gold ETF outflows can create significant selling pressure.
When large investors start reducing their exposure, even a strong market can reverse quickly.
A GLOBAL MARKET CRASH WON’T NECESSARILY SAVE GOLD:
This is what most investors don’t understand.
During a liquidity crisis, investors sell whatever they can to raise cash.
Stocks, crypto, and even gold can fall together.
Gold isn’t immune to forced liquidations.
THE RALLY IS SHOWING SIGNS OF EXHAUSTION:
Gold has already experienced an extraordinary run.
And the more aggressively an asset rises, the more dangerous the eventual correction becomes.
Even the historical Benner Cycle identifies 2026 as a potential selling period.
NOW HERE’S THE MOST IMPORTANT PART!
I’M NOT SAYING THE LONG-TERM GOLD BULL MARKET IS OVER!
Central banks are still buying gold, and long-term demand remains strong.
But that doesn’t mean prices can’t experience a brutal correction first.
My expectation is simple:
ONE MAJOR SELLOFF BEFORE THE NEXT BIG RALLY!
Late buyers will panic.
Leveraged positions will get wiped out.
And the investors who waited patiently will get another opportunity.
I’M NOT CHASING GOLD AT THESE LEVELS!
I’m waiting for the correction.
Follow and turn on notifications.
I’ll share the levels I’m watching before the next major move.
SAVE THIS POST! WE’LL COME BACK TO IT BEFORE 2026 ENDS!— DANNY (@Danny_Crypton) October 25, 2026
Danny also believes this could support the U.S. dollar. A stronger dollar generally creates another obstacle for gold because XAU becomes more expensive for buyers using other currencies.
Why a Market Crash Might Not Save Gold
One of the more interesting parts of his thesis is the warning about a broader market selloff.
Gold is commonly treated as a safe-haven asset, but that does not mean it always rises when stocks fall.
During a liquidity crisis, investors sometimes sell whatever they can turn into cash quickly.
That includes gold.
We have already seen this dynamic recently, with gold falling alongside risk assets as funds reduced positions and raised cash.
So I agree with Danny on this point. A stock-market crash would not automatically mean gold goes higher immediately.
There could easily be an initial liquidation phase before safe-haven demand returns.
Read also: Could Lab-Grown Gold Crash Prices Like Lab-Grown Diamonds Did?
Is the Gold Rally Exhausted?
Danny also points to the size of gold’s previous rally.
The metal has already had an exceptional run, and late buyers are now entering at prices far above where the move began.
His chart references the Benner Cycle, an old market-cycle model that labels 2026 as a possible period for selling assets.
I would be careful with this part.
Historical cycle models can be interesting, but I would never use one calendar pattern as evidence that gold must fall. Economic conditions, rates, central-bank demand and positioning carry much more weight for me.
Still, the broader idea of a correction after such a large advance is reasonable.
No market goes vertically higher forever.
My Gold Price Prediction
I believe the analyst’s strongest argument is not the cycle chart. It is the macro setup.
High Treasury yields, expensive oil and a potentially strong dollar can all create trouble for gold in the short term.
At the same time, I do not believe the long-term gold story has disappeared.
Central banks continue to treat gold as a reserve asset, government debt remains enormous and long-term concerns around currency purchasing power are still there.
That leaves me somewhere between the two extremes.
I would not chase gold after a huge rally, but I also would not interpret a deep correction as proof that the bull market is finished.
If the gold price loses the $4,000 region and cannot reclaim it, I would watch roughly $3,950-$3,900 next. A deeper liquidation could take price further into the upper-$3,000s.
On the other hand, a recovery above $4,100-$4,200 would tell me buyers are returning and the correction may already be losing strength.
My preferred scenario would actually be a deeper reset followed by stabilization.
That would remove some late leverage, cool sentiment and potentially create a healthier base for the next large move.
So I agree with Danny’s core warning: late buyers should not assume gold can only go higher from here.
One major correction before the next bull leg is a completely realistic scenario.
For more financial news and price predictions, click here.
Subscribe to our YouTube channel for daily crypto updates, market insights, and expert analysis.
The post Gold Price Prediction: Analyst Warns Late Buyers Could Get Trapped appeared first on CaptainAltcoin.
Gold Price Prediction: Analyst Warns Late Buyers Could Get Trapped
Gold’s long-term story may still be bullish, but one analyst believes investors buying after the huge 2026 run could be walking into a painful correction first.
Analyst Danny Crypton argues that gold is entering a dangerous phase of its cycle. His view is not that the broader bull market is finished. He expects one large selloff before another substantial rally begins.
His case combines high Treasury yields, expensive oil, dollar strength, institutional selling and an old market-cycle model that marks 2026 as a possible selling period.
I think the basic idea is interesting, even if I would not treat the historical cycle model as a reliable forecasting tool on its own.
High Rates Are Still a Problem for Gold
The first part of Danny’s argument is straightforward.
U.S. Treasury yields remain extremely high, with the 30-year above 5.5% and the 10-year near 5.2% in the figures he cites.
Gold produces no yield.
When investors can earn around 5% from U.S. government debt, holding gold becomes less attractive for some portfolios, especially when the market expects interest rates to stay high.
Oil adds another complication.
Crude trading above $100 keeps inflation fears alive. If expensive energy keeps inflation elevated, the Federal Reserve has less room to lower rates and could keep monetary policy restrictive for longer.
GOLD INVESTORS ARE NOT READY FOR WHAT COMES NEXT!
Everyone is watching gold near its highs and expecting another massive rally.
But I see something completely different.
I believe gold is approaching one of the most dangerous phases of this cycle.
And here are 6 reasons why:
INTEREST RATES ARE BECOMING A MASSIVE PROBLEM:
The U.S. 30-year Treasury yield is above 5.5%, while the 10-year is approaching 5.2%.
Gold pays no interest.
As yields climb, investors have more reasons to move their money into interest-paying assets.
And that’s bad news for gold.
OIL PRICES ARE MAKING EVERYTHING WORSE:
Oil above $100 is bringing inflation fears back.
And higher inflation means the Fed faces even more pressure to keep rates elevated or raise them again.
That’s another major headwind for gold.
THE U.S. DOLLAR COULD GET MUCH STRONGER:
Higher Treasury yields can attract more capital into dollar-denominated assets.
A stronger dollar makes gold more expensive for international buyers.
And that puts additional pressure on demand.
INSTITUTIONAL SELLING IS A SERIOUS WARNING:
Gold ETF outflows can create significant selling pressure.
When large investors start reducing their exposure, even a strong market can reverse quickly.
A GLOBAL MARKET CRASH WON’T NECESSARILY SAVE GOLD:
This is what most investors don’t understand.
During a liquidity crisis, investors sell whatever they can to raise cash.
Stocks, crypto, and even gold can fall together.
Gold isn’t immune to forced liquidations.
THE RALLY IS SHOWING SIGNS OF EXHAUSTION:
Gold has already experienced an extraordinary run.
And the more aggressively an asset rises, the more dangerous the eventual correction becomes.
Even the historical Benner Cycle identifies 2026 as a potential selling period.
NOW HERE’S THE MOST IMPORTANT PART!
I’M NOT SAYING THE LONG-TERM GOLD BULL MARKET IS OVER!
Central banks are still buying gold, and long-term demand remains strong.
But that doesn’t mean prices can’t experience a brutal correction first.
My expectation is simple:
ONE MAJOR SELLOFF BEFORE THE NEXT BIG RALLY!
Late buyers will panic.
Leveraged positions will get wiped out.
And the investors who waited patiently will get another opportunity.
I’M NOT CHASING GOLD AT THESE LEVELS!
I’m waiting for the correction.
Follow and turn on notifications.
I’ll share the levels I’m watching before the next major move.
SAVE THIS POST! WE’LL COME BACK TO IT BEFORE 2026 ENDS!— DANNY (@Danny_Crypton) October 25, 2026
Danny also believes this could support the U.S. dollar. A stronger dollar generally creates another obstacle for gold because XAU becomes more expensive for buyers using other currencies.
Why a Market Crash Might Not Save Gold
One of the more interesting parts of his thesis is the warning about a broader market selloff.
Gold is commonly treated as a safe-haven asset, but that does not mean it always rises when stocks fall.
During a liquidity crisis, investors sometimes sell whatever they can turn into cash quickly.
That includes gold.
We have already seen this dynamic recently, with gold falling alongside risk assets as funds reduced positions and raised cash.
So I agree with Danny on this point. A stock-market crash would not automatically mean gold goes higher immediately.
There could easily be an initial liquidation phase before safe-haven demand returns.
Read also: Could Lab-Grown Gold Crash Prices Like Lab-Grown Diamonds Did?
Is the Gold Rally Exhausted?
Danny also points to the size of gold’s previous rally.
The metal has already had an exceptional run, and late buyers are now entering at prices far above where the move began.
His chart references the Benner Cycle, an old market-cycle model that labels 2026 as a possible period for selling assets.
I would be careful with this part.
Historical cycle models can be interesting, but I would never use one calendar pattern as evidence that gold must fall. Economic conditions, rates, central-bank demand and positioning carry much more weight for me.
Still, the broader idea of a correction after such a large advance is reasonable.
No market goes vertically higher forever.
My Gold Price Prediction
I believe the analyst’s strongest argument is not the cycle chart. It is the macro setup.
High Treasury yields, expensive oil and a potentially strong dollar can all create trouble for gold in the short term.
At the same time, I do not believe the long-term gold story has disappeared.
Central banks continue to treat gold as a reserve asset, government debt remains enormous and long-term concerns around currency purchasing power are still there.
That leaves me somewhere between the two extremes.
I would not chase gold after a huge rally, but I also would not interpret a deep correction as proof that the bull market is finished.
If the gold price loses the $4,000 region and cannot reclaim it, I would watch roughly $3,950-$3,900 next. A deeper liquidation could take price further into the upper-$3,000s.
On the other hand, a recovery above $4,100-$4,200 would tell me buyers are returning and the correction may already be losing strength.
My preferred scenario would actually be a deeper reset followed by stabilization.
That would remove some late leverage, cool sentiment and potentially create a healthier base for the next large move.
So I agree with Danny’s core warning: late buyers should not assume gold can only go higher from here.
One major correction before the next bull leg is a completely realistic scenario.
For more financial news and price predictions, click here.
Subscribe to our YouTube channel for daily crypto updates, market insights, and expert analysis.
The post Gold Price Prediction: Analyst Warns Late Buyers Could Get Trapped appeared first on CaptainAltcoin.
Analyst Danny Crypton argues that gold is entering a dangerous phase of its cycle. His view is not that the broader bull market is finished. He expects one large selloff before another substantial rally begins.
His case combines high Treasury yields, expensive oil, dollar strength, institutional selling and an old market-cycle model that marks 2026 as a possible selling period.
I think the basic idea is interesting, even if I would not treat the historical cycle model as a reliable forecasting tool on its own.
High Rates Are Still a Problem for Gold
The first part of Danny’s argument is straightforward.
U.S. Treasury yields remain extremely high, with the 30-year above 5.5% and the 10-year near 5.2% in the figures he cites.
Gold produces no yield.
When investors can earn around 5% from U.S. government debt, holding gold becomes less attractive for some portfolios, especially when the market expects interest rates to stay high.
Oil adds another complication.
Crude trading above $100 keeps inflation fears alive. If expensive energy keeps inflation elevated, the Federal Reserve has less room to lower rates and could keep monetary policy restrictive for longer.
GOLD INVESTORS ARE NOT READY FOR WHAT COMES NEXT!
Everyone is watching gold near its highs and expecting another massive rally.
But I see something completely different.
I believe gold is approaching one of the most dangerous phases of this cycle.
And here are 6 reasons why:
INTEREST RATES ARE BECOMING A MASSIVE PROBLEM:
The U.S. 30-year Treasury yield is above 5.5%, while the 10-year is approaching 5.2%.
Gold pays no interest.
As yields climb, investors have more reasons to move their money into interest-paying assets.
And that’s bad news for gold.
OIL PRICES ARE MAKING EVERYTHING WORSE:
Oil above $100 is bringing inflation fears back.
And higher inflation means the Fed faces even more pressure to keep rates elevated or raise them again.
That’s another major headwind for gold.
THE U.S. DOLLAR COULD GET MUCH STRONGER:
Higher Treasury yields can attract more capital into dollar-denominated assets.
A stronger dollar makes gold more expensive for international buyers.
And that puts additional pressure on demand.
INSTITUTIONAL SELLING IS A SERIOUS WARNING:
Gold ETF outflows can create significant selling pressure.
When large investors start reducing their exposure, even a strong market can reverse quickly.
A GLOBAL MARKET CRASH WON’T NECESSARILY SAVE GOLD:
This is what most investors don’t understand.
During a liquidity crisis, investors sell whatever they can to raise cash.
Stocks, crypto, and even gold can fall together.
Gold isn’t immune to forced liquidations.
THE RALLY IS SHOWING SIGNS OF EXHAUSTION:
Gold has already experienced an extraordinary run.
And the more aggressively an asset rises, the more dangerous the eventual correction becomes.
Even the historical Benner Cycle identifies 2026 as a potential selling period.
NOW HERE’S THE MOST IMPORTANT PART!
I’M NOT SAYING THE LONG-TERM GOLD BULL MARKET IS OVER!
Central banks are still buying gold, and long-term demand remains strong.
But that doesn’t mean prices can’t experience a brutal correction first.
My expectation is simple:
ONE MAJOR SELLOFF BEFORE THE NEXT BIG RALLY!
Late buyers will panic.
Leveraged positions will get wiped out.
And the investors who waited patiently will get another opportunity.
I’M NOT CHASING GOLD AT THESE LEVELS!
I’m waiting for the correction.
Follow and turn on notifications.
I’ll share the levels I’m watching before the next major move.
SAVE THIS POST! WE’LL COME BACK TO IT BEFORE 2026 ENDS!— DANNY (@Danny_Crypton) October 25, 2026
Danny also believes this could support the U.S. dollar. A stronger dollar generally creates another obstacle for gold because XAU becomes more expensive for buyers using other currencies.
Why a Market Crash Might Not Save Gold
One of the more interesting parts of his thesis is the warning about a broader market selloff.
Gold is commonly treated as a safe-haven asset, but that does not mean it always rises when stocks fall.
During a liquidity crisis, investors sometimes sell whatever they can turn into cash quickly.
That includes gold.
We have already seen this dynamic recently, with gold falling alongside risk assets as funds reduced positions and raised cash.
So I agree with Danny on this point. A stock-market crash would not automatically mean gold goes higher immediately.
There could easily be an initial liquidation phase before safe-haven demand returns.
Read also: Could Lab-Grown Gold Crash Prices Like Lab-Grown Diamonds Did?
Is the Gold Rally Exhausted?
Danny also points to the size of gold’s previous rally.
The metal has already had an exceptional run, and late buyers are now entering at prices far above where the move began.
His chart references the Benner Cycle, an old market-cycle model that labels 2026 as a possible period for selling assets.
I would be careful with this part.
Historical cycle models can be interesting, but I would never use one calendar pattern as evidence that gold must fall. Economic conditions, rates, central-bank demand and positioning carry much more weight for me.
Still, the broader idea of a correction after such a large advance is reasonable.
No market goes vertically higher forever.
My Gold Price Prediction
I believe the analyst’s strongest argument is not the cycle chart. It is the macro setup.
High Treasury yields, expensive oil and a potentially strong dollar can all create trouble for gold in the short term.
At the same time, I do not believe the long-term gold story has disappeared.
Central banks continue to treat gold as a reserve asset, government debt remains enormous and long-term concerns around currency purchasing power are still there.
That leaves me somewhere between the two extremes.
I would not chase gold after a huge rally, but I also would not interpret a deep correction as proof that the bull market is finished.
If the gold price loses the $4,000 region and cannot reclaim it, I would watch roughly $3,950-$3,900 next. A deeper liquidation could take price further into the upper-$3,000s.
On the other hand, a recovery above $4,100-$4,200 would tell me buyers are returning and the correction may already be losing strength.
My preferred scenario would actually be a deeper reset followed by stabilization.
That would remove some late leverage, cool sentiment and potentially create a healthier base for the next large move.
So I agree with Danny’s core warning: late buyers should not assume gold can only go higher from here.
One major correction before the next bull leg is a completely realistic scenario.
For more financial news and price predictions, click here.
Subscribe to our YouTube channel for daily crypto updates, market insights, and expert analysis.
The post Gold Price Prediction: Analyst Warns Late Buyers Could Get Trapped appeared first on CaptainAltcoin.
360
XRP Price Will Drop Below $1.00 If This Happens, Analyst WarnsXRP price is close to a level that could decide whether the current weakness stays manageable or turns into something much worse.
Analyst Ali Martinez says the bearish case now rests on three things happening together: fewer large XRP holders, more tokens sitting on exchanges, and a clean break below $1.26.
If that support gives way, Martinez says the XRP price could first fall toward $1.11, with the broader channel structure pointing to roughly $0.98.
That would put XRP back below the $1 mark.
XRP Whales Are Cutting Exposure
Martinez points to the number of wallets holding between 10 million and 100 million XRP.
That group has fallen from 351 wallets to 339 over the past few weeks.
The change is not huge in absolute terms, but these are very large holders, so even a relatively small drop in wallet count can matter.
At the same time, XRP balances on exchanges have moved from roughly 11.003 billion to around 11.05 billion.
That is about 50 million additional XRP sitting on trading platforms.
2/5 Some of the largest whales on the XRP Ledger appear to be reducing their exposure. The number of wallets holding between 10 million and 100 million $XRP has fallen from 351 to 339 over the past few weeks. That decline raises the possibility of growing selling pressure. https://t.co/xgh8WVtJrD
— Ali Charts (@alicharts) October 25, 2026
More XRP on exchanges does not prove those tokens will be sold.
But when exchange balances rise at the same time large-holder counts fall, the combination is worth watching because more supply may be available to hit the market.
XRP Price: $1.26 Is the Level That Could Break the Structure
Martinez’s technical argument is much cleaner than the whale data.
He identifies $1.26 as the lower boundary of a channel the XRP price has been building since August.
As long as that level holds, the bearish scenario is not confirmed.
If XRP breaks below it, Martinez maps $1.11 as the first downside target.
The larger channel structure then points toward $0.98.
From $1.26, that would be a decline of roughly 22%.
So the sequence is crucial:
$1.26 holds → bearish target remains unconfirmed.
$1.26 breaks → $1.11 comes into focus.
$1.11 fails → $0.98 becomes much more realistic.
Why Is the Whale Data More Important than Near Support
The whale data on its own would not be enough to call for sub-$1 XRP.
The technical break is what would make the setup more dangerous.
If large holders keep reducing exposure and exchange balances remain high while XRP loses $1.26, the market would have both a supply problem and a technical breakdown at the same time.
That is the scenario Martinez is warning about.
On the other hand, if XRP continues holding $1.26 and exchange balances stop rising, the bearish case weakens.
For now, $1.26 is the line that matters most.
The whale data may be adding pressure, but the chart still needs to confirm the move before $1.11 or $0.98 become serious targets.
For more crypto news and price predictions, click here.
Subscribe to our YouTube channel for daily crypto updates, market insights, and expert analysis.
The post XRP Price Will Drop Below $1.00 If This Happens, Analyst Warns appeared first on CaptainAltcoin.
XRP Price Will Drop Below $1.00 If This Happens, Analyst Warns
XRP price is close to a level that could decide whether the current weakness stays manageable or turns into something much worse.
Analyst Ali Martinez says the bearish case now rests on three things happening together: fewer large XRP holders, more tokens sitting on exchanges, and a clean break below $1.26.
If that support gives way, Martinez says the XRP price could first fall toward $1.11, with the broader channel structure pointing to roughly $0.98.
That would put XRP back below the $1 mark.
XRP Whales Are Cutting Exposure
Martinez points to the number of wallets holding between 10 million and 100 million XRP.
That group has fallen from 351 wallets to 339 over the past few weeks.
The change is not huge in absolute terms, but these are very large holders, so even a relatively small drop in wallet count can matter.
At the same time, XRP balances on exchanges have moved from roughly 11.003 billion to around 11.05 billion.
That is about 50 million additional XRP sitting on trading platforms.
2/5 Some of the largest whales on the XRP Ledger appear to be reducing their exposure. The number of wallets holding between 10 million and 100 million $XRP has fallen from 351 to 339 over the past few weeks. That decline raises the possibility of growing selling pressure. https://t.co/xgh8WVtJrD
— Ali Charts (@alicharts) October 25, 2026
More XRP on exchanges does not prove those tokens will be sold.
But when exchange balances rise at the same time large-holder counts fall, the combination is worth watching because more supply may be available to hit the market.
XRP Price: $1.26 Is the Level That Could Break the Structure
Martinez’s technical argument is much cleaner than the whale data.
He identifies $1.26 as the lower boundary of a channel the XRP price has been building since August.
As long as that level holds, the bearish scenario is not confirmed.
If XRP breaks below it, Martinez maps $1.11 as the first downside target.
The larger channel structure then points toward $0.98.
From $1.26, that would be a decline of roughly 22%.
So the sequence is crucial:
$1.26 holds → bearish target remains unconfirmed.
$1.26 breaks → $1.11 comes into focus.
$1.11 fails → $0.98 becomes much more realistic.
Why Is the Whale Data More Important than Near Support
The whale data on its own would not be enough to call for sub-$1 XRP.
The technical break is what would make the setup more dangerous.
If large holders keep reducing exposure and exchange balances remain high while XRP loses $1.26, the market would have both a supply problem and a technical breakdown at the same time.
That is the scenario Martinez is warning about.
On the other hand, if XRP continues holding $1.26 and exchange balances stop rising, the bearish case weakens.
For now, $1.26 is the line that matters most.
The whale data may be adding pressure, but the chart still needs to confirm the move before $1.11 or $0.98 become serious targets.
For more crypto news and price predictions, click here.
Subscribe to our YouTube channel for daily crypto updates, market insights, and expert analysis.
The post XRP Price Will Drop Below $1.00 If This Happens, Analyst Warns appeared first on CaptainAltcoin.
Analyst Ali Martinez says the bearish case now rests on three things happening together: fewer large XRP holders, more tokens sitting on exchanges, and a clean break below $1.26.
If that support gives way, Martinez says the XRP price could first fall toward $1.11, with the broader channel structure pointing to roughly $0.98.
That would put XRP back below the $1 mark.
XRP Whales Are Cutting Exposure
Martinez points to the number of wallets holding between 10 million and 100 million XRP.
That group has fallen from 351 wallets to 339 over the past few weeks.
The change is not huge in absolute terms, but these are very large holders, so even a relatively small drop in wallet count can matter.
At the same time, XRP balances on exchanges have moved from roughly 11.003 billion to around 11.05 billion.
That is about 50 million additional XRP sitting on trading platforms.
2/5 Some of the largest whales on the XRP Ledger appear to be reducing their exposure. The number of wallets holding between 10 million and 100 million $XRP has fallen from 351 to 339 over the past few weeks. That decline raises the possibility of growing selling pressure. https://t.co/xgh8WVtJrD
— Ali Charts (@alicharts) October 25, 2026
More XRP on exchanges does not prove those tokens will be sold.
But when exchange balances rise at the same time large-holder counts fall, the combination is worth watching because more supply may be available to hit the market.
XRP Price: $1.26 Is the Level That Could Break the Structure
Martinez’s technical argument is much cleaner than the whale data.
He identifies $1.26 as the lower boundary of a channel the XRP price has been building since August.
As long as that level holds, the bearish scenario is not confirmed.
If XRP breaks below it, Martinez maps $1.11 as the first downside target.
The larger channel structure then points toward $0.98.
From $1.26, that would be a decline of roughly 22%.
So the sequence is crucial:
$1.26 holds → bearish target remains unconfirmed.
$1.26 breaks → $1.11 comes into focus.
$1.11 fails → $0.98 becomes much more realistic.
Why Is the Whale Data More Important than Near Support
The whale data on its own would not be enough to call for sub-$1 XRP.
The technical break is what would make the setup more dangerous.
If large holders keep reducing exposure and exchange balances remain high while XRP loses $1.26, the market would have both a supply problem and a technical breakdown at the same time.
That is the scenario Martinez is warning about.
On the other hand, if XRP continues holding $1.26 and exchange balances stop rising, the bearish case weakens.
For now, $1.26 is the line that matters most.
The whale data may be adding pressure, but the chart still needs to confirm the move before $1.11 or $0.98 become serious targets.
For more crypto news and price predictions, click here.
Subscribe to our YouTube channel for daily crypto updates, market insights, and expert analysis.
The post XRP Price Will Drop Below $1.00 If This Happens, Analyst Warns appeared first on CaptainAltcoin.
1
241
Hedera Price Prediction: Analyst Maps 72% UpsideHBAR has spent months moving lower, but analyst Lana Valentis believes the current pullback could be setting up one of the cleaner retest opportunities on the daily chart.
Her thesis is simple: Hedera is back near a support zone around $0.070-$0.076, and if buyers defend it, the next recovery could target $0.085, $0.095, $0.110 and eventually $0.131.
From the current area, that last target would represent roughly 70%-72% upside.
That sounds aggressive, but the chart does not assume HBAR goes straight there. It maps a staged recovery through several resistance levels first.
The Entire Setup Depends on the $0.070-$0.076 Zone
The most important part of the chart is the green support band.
HBAR has returned to an area that previously acted as demand, and the analyst marks the latest low directly inside that region.
This is what makes the setup interesting.
The bullish case does not start at $0.131.
It starts with HBAR proving that buyers still care about the $0.070-$0.076 zone.
If price holds there, $0.085 becomes the first real test. That is close enough to act as a realistic short-term recovery level.
Above $0.085, the next checkpoints are $0.095 and $0.110.
Only after those levels are reclaimed does the larger $0.131 target start to make sense.
$HBAR Retest Opportunity
Hedera is holding near the support zone, setting up a textbook retest entry on the daily chart.
Google, IBM, and Boeing each run a consensus node on #HBAR and hold an equal vote on its governing council.
Developer activity has surged 57% in seven days, with repo watchers up over 300%.
Target levels: $0.085 $0.095 $0.110 $0.131— Lana Valentis (@LanaValentis) October 25, 2026
If the support zone fails, however, the entire retest idea weakens quickly.
HBAR Has More Than Just a Chart Narrative
Valentis also points to Hedera’s network structure and recent developer data.
Google and IBM remain part of Hedera’s governing framework, and Hedera’s own documentation says council members have equal voting rights. Google and IBM also operate consensus nodes on the network. Boeing has also been part of Hedera’s broader council history, although it does not appear on the latest public council overview.
Developer activity has also picked up.
Recent Chainspect data showed the number of Hedera developers up more than 57% over seven days, with repository watchers rising more than 300%. One important caveat is that watchers measure attention to repositories, not necessarily new code being shipped.
That does not guarantee a price recovery, but it gives the retest a better fundamental backdrop than a purely technical bounce.
Read also: Analyst Bets 10,000 HBAR That Hedera Price Will Hit $0.26 by November 26
What Would Make the $0.131 Target Realistic?
I would not focus on $0.131 yet.
For me, the cleaner path is:
$0.070-$0.076 holds → $0.085 → $0.095 → $0.110 → $0.131.
Each level needs to be reclaimed before the next one becomes relevant.
The first real confirmation would be a daily close back above $0.085.
A move through $0.095 would improve the structure further and tell us the retest is doing more than producing a temporary bounce.
Then $0.110 becomes the level that separates a recovery from a much larger trend shift.
The analyst’s $0.131 target is ambitious, but it is not random. It lines up with prior structure and the measured move shown on the chart.
So the setup is not “HBAR is about to rally 72%.”
It is a support test with a clear ladder of resistance above it.
If HBAR holds the green zone, the reward side of the setup becomes interesting.
If it loses that area, the bullish thesis needs to be reassessed.
For more crypto news and price predictions, click here.
Subscribe to our YouTube channel for daily crypto updates, market insights, and expert analysis.
The post Hedera Price Prediction: Analyst Maps 72% Upside appeared first on CaptainAltcoin.
Hedera Price Prediction: Analyst Maps 72% Upside
HBAR has spent months moving lower, but analyst Lana Valentis believes the current pullback could be setting up one of the cleaner retest opportunities on the daily chart.
Her thesis is simple: Hedera is back near a support zone around $0.070-$0.076, and if buyers defend it, the next recovery could target $0.085, $0.095, $0.110 and eventually $0.131.
From the current area, that last target would represent roughly 70%-72% upside.
That sounds aggressive, but the chart does not assume HBAR goes straight there. It maps a staged recovery through several resistance levels first.
The Entire Setup Depends on the $0.070-$0.076 Zone
The most important part of the chart is the green support band.
HBAR has returned to an area that previously acted as demand, and the analyst marks the latest low directly inside that region.
This is what makes the setup interesting.
The bullish case does not start at $0.131.
It starts with HBAR proving that buyers still care about the $0.070-$0.076 zone.
If price holds there, $0.085 becomes the first real test. That is close enough to act as a realistic short-term recovery level.
Above $0.085, the next checkpoints are $0.095 and $0.110.
Only after those levels are reclaimed does the larger $0.131 target start to make sense.
$HBAR Retest Opportunity
Hedera is holding near the support zone, setting up a textbook retest entry on the daily chart.
Google, IBM, and Boeing each run a consensus node on #HBAR and hold an equal vote on its governing council.
Developer activity has surged 57% in seven days, with repo watchers up over 300%.
Target levels: $0.085 $0.095 $0.110 $0.131— Lana Valentis (@LanaValentis) October 25, 2026
If the support zone fails, however, the entire retest idea weakens quickly.
HBAR Has More Than Just a Chart Narrative
Valentis also points to Hedera’s network structure and recent developer data.
Google and IBM remain part of Hedera’s governing framework, and Hedera’s own documentation says council members have equal voting rights. Google and IBM also operate consensus nodes on the network. Boeing has also been part of Hedera’s broader council history, although it does not appear on the latest public council overview.
Developer activity has also picked up.
Recent Chainspect data showed the number of Hedera developers up more than 57% over seven days, with repository watchers rising more than 300%. One important caveat is that watchers measure attention to repositories, not necessarily new code being shipped.
That does not guarantee a price recovery, but it gives the retest a better fundamental backdrop than a purely technical bounce.
Read also: Analyst Bets 10,000 HBAR That Hedera Price Will Hit $0.26 by November 26
What Would Make the $0.131 Target Realistic?
I would not focus on $0.131 yet.
For me, the cleaner path is:
$0.070-$0.076 holds → $0.085 → $0.095 → $0.110 → $0.131.
Each level needs to be reclaimed before the next one becomes relevant.
The first real confirmation would be a daily close back above $0.085.
A move through $0.095 would improve the structure further and tell us the retest is doing more than producing a temporary bounce.
Then $0.110 becomes the level that separates a recovery from a much larger trend shift.
The analyst’s $0.131 target is ambitious, but it is not random. It lines up with prior structure and the measured move shown on the chart.
So the setup is not “HBAR is about to rally 72%.”
It is a support test with a clear ladder of resistance above it.
If HBAR holds the green zone, the reward side of the setup becomes interesting.
If it loses that area, the bullish thesis needs to be reassessed.
For more crypto news and price predictions, click here.
Subscribe to our YouTube channel for daily crypto updates, market insights, and expert analysis.
The post Hedera Price Prediction: Analyst Maps 72% Upside appeared first on CaptainAltcoin.
Her thesis is simple: Hedera is back near a support zone around $0.070-$0.076, and if buyers defend it, the next recovery could target $0.085, $0.095, $0.110 and eventually $0.131.
From the current area, that last target would represent roughly 70%-72% upside.
That sounds aggressive, but the chart does not assume HBAR goes straight there. It maps a staged recovery through several resistance levels first.
The Entire Setup Depends on the $0.070-$0.076 Zone
The most important part of the chart is the green support band.
HBAR has returned to an area that previously acted as demand, and the analyst marks the latest low directly inside that region.
This is what makes the setup interesting.
The bullish case does not start at $0.131.
It starts with HBAR proving that buyers still care about the $0.070-$0.076 zone.
If price holds there, $0.085 becomes the first real test. That is close enough to act as a realistic short-term recovery level.
Above $0.085, the next checkpoints are $0.095 and $0.110.
Only after those levels are reclaimed does the larger $0.131 target start to make sense.
$HBAR Retest Opportunity
Hedera is holding near the support zone, setting up a textbook retest entry on the daily chart.
Google, IBM, and Boeing each run a consensus node on #HBAR and hold an equal vote on its governing council.
Developer activity has surged 57% in seven days, with repo watchers up over 300%.
Target levels: $0.085 $0.095 $0.110 $0.131— Lana Valentis (@LanaValentis) October 25, 2026
If the support zone fails, however, the entire retest idea weakens quickly.
HBAR Has More Than Just a Chart Narrative
Valentis also points to Hedera’s network structure and recent developer data.
Google and IBM remain part of Hedera’s governing framework, and Hedera’s own documentation says council members have equal voting rights. Google and IBM also operate consensus nodes on the network. Boeing has also been part of Hedera’s broader council history, although it does not appear on the latest public council overview.
Developer activity has also picked up.
Recent Chainspect data showed the number of Hedera developers up more than 57% over seven days, with repository watchers rising more than 300%. One important caveat is that watchers measure attention to repositories, not necessarily new code being shipped.
That does not guarantee a price recovery, but it gives the retest a better fundamental backdrop than a purely technical bounce.
Read also: Analyst Bets 10,000 HBAR That Hedera Price Will Hit $0.26 by November 26
What Would Make the $0.131 Target Realistic?
I would not focus on $0.131 yet.
For me, the cleaner path is:
$0.070-$0.076 holds → $0.085 → $0.095 → $0.110 → $0.131.
Each level needs to be reclaimed before the next one becomes relevant.
The first real confirmation would be a daily close back above $0.085.
A move through $0.095 would improve the structure further and tell us the retest is doing more than producing a temporary bounce.
Then $0.110 becomes the level that separates a recovery from a much larger trend shift.
The analyst’s $0.131 target is ambitious, but it is not random. It lines up with prior structure and the measured move shown on the chart.
So the setup is not “HBAR is about to rally 72%.”
It is a support test with a clear ladder of resistance above it.
If HBAR holds the green zone, the reward side of the setup becomes interesting.
If it loses that area, the bullish thesis needs to be reassessed.
For more crypto news and price predictions, click here.
Subscribe to our YouTube channel for daily crypto updates, market insights, and expert analysis.
The post Hedera Price Prediction: Analyst Maps 72% Upside appeared first on CaptainAltcoin.
2
565
Article
Bitcoin and Ethereum Price Prediction for This Week (October 26 – November 1)Bitcoin and Ethereum enter the final week of October in a difficult position.
Bitcoin is trading around $80,400 after briefly slipping below $80,000, while Ethereum has fallen toward $2,330 after touching approximately $2,281 during the latest session.
Neither asset is showing a confirmed reversal yet.
The good news for bulls is that momentum indicators are no longer far from oversold conditions. The bad news is that both BTC and ETH continue to make weak recovery attempts, and the macro calendar becomes much more important this week.
The Federal Reserve meets on October 27-28, oil remains above $110, and large U.S. technology companies report earnings. Those three factors could set the direction for crypto through November 1.
Bitcoin Price Is Back Near $80,000
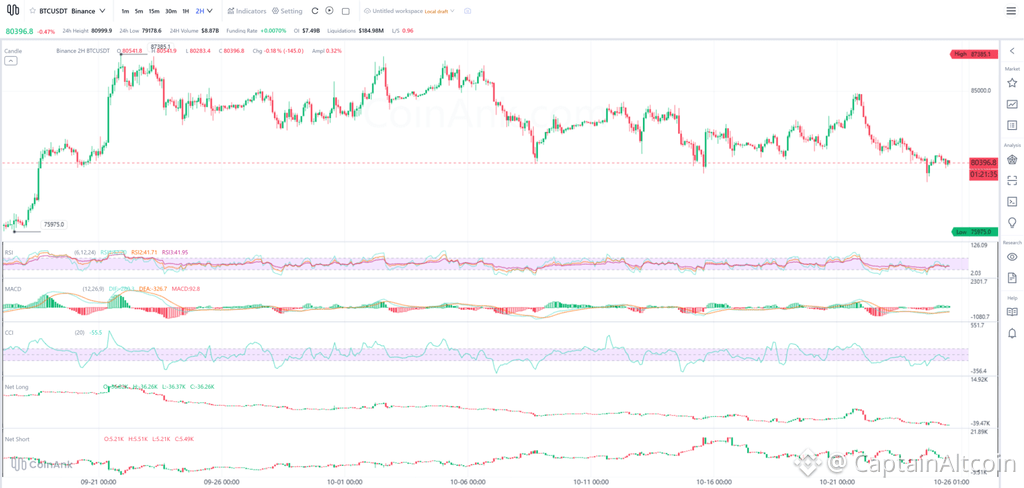
The Binance two-hour BTC chart shows Bitcoin around $80,397 after trading between roughly $79,179 and $81,000 over the latest 24 hours.
The larger structure has weakened considerably since BTC traded near $87,400 earlier in October.
The first level I would watch is $79,000-$80,000.
Bitcoin has already reacted from this region several times, so another defense would keep the current range alive.
Momentum remains weak.
Source: CoinAnk
The medium and longer RSI readings are both close to 42, which means Bitcoin is below neutral but not deeply oversold.
MACD is more interesting.
The MACD lines remain below zero, but the histogram has turned positive at roughly 92.8. That can happen when bearish momentum begins losing strength even though the broader trend has not yet turned bullish.
CCI around -55 tells a similar story. Bitcoin remains weak, but the latest selling wave has cooled somewhat.
There is also plenty of leverage still in the market. BTC liquidations were close to $185 million over the latest 24-hour period, and the long/short ratio near 0.96 shows positioning is relatively balanced but still slightly tilted toward shorts.
For me, $82,000-$82,500 is the first meaningful recovery test.
Above that, $84,000-$85,000 becomes possible again.
If Bitcoin loses $79,000, however, the recent low around $75,975 becomes the next major downside reference.
Ethereum Looks Weaker Than Bitcoin
Ethereum is trading around $2,331, with the latest 24-hour range stretching from approximately $2,281 to $2,372.
The ETH chart remains weaker than BTC.
Price has been producing lower highs since the October recovery toward $2,500, and the latest bounce from $2,281 has struggled to gain traction.
The RSI readings are around 37, 38 and 40 across the short, medium and longer settings.
That puts Ethereum closer to oversold conditions than Bitcoin.
Source: CoinAnk
MACD remains below zero, with DIF near -15.92 and DEA around -16.08. The positive histogram is very small, around 0.32, which indicates that bearish momentum may be easing, but there is still no strong bullish signal.
CCI around -79 also keeps ETH on the weak side of the range.
The most important support is $2,280-$2,300.
If that region holds, ETH could attempt a recovery toward $2,400.
Above there, $2,450-$2,500 becomes the next zone.
If $2,280 fails, I would watch roughly $2,200 first, followed by $2,100.
Ethereum also has a weaker institutional-flow backdrop than Bitcoin. U.S. spot ETH ETFs have lost roughly $350 million over the past seven days, and broader October flows have remained poor. Bitcoin ETFs, by comparison, still finished the latest week with roughly $300 million of net inflows despite heavy withdrawals on Thursday and Friday.
The Fed, Oil and Tech Earnings Could Decide the Week
The biggest event is Wednesday’s Federal Reserve decision.
A Reuters poll found that 94 of 100 economists expect the Fed to hold rates at 3.75%-4.00% on October 28. However, all 100 economists in the survey expect another rate hike in December.
That means the rate decision itself may not move crypto as much as Fed Chair Kevin Warsh’s comments afterward.
If the Fed sounds comfortable waiting longer before another hike, Bitcoin and Ethereum could get some relief.
If Warsh stresses inflation risks and keeps December tightening firmly on the table, crypto could stay under pressure.
Oil is another problem.
Brent finished Friday around $116.72 after gaining more than 3% in one session as attacks on Saudi energy infrastructure raised fears of supply disruption. High oil feeds inflation concerns and makes the Fed’s job harder.
Then there is the stock market.
Alphabet, Microsoft and Amazon report earnings this week. Crypto has traded closely with risk appetite during the recent AI-stock selloff, so another bad reaction to technology spending could spill into BTC and ETH.
Bitcoin and Ethereum Price Prediction for October 26-November 1
My base case is that both assets remain volatile around current support until the Fed meeting gives the market a clearer direction.
Asset Bullish scenario Base case Bearish scenario Bitcoin Hold $79K-$80K → $82.5K → $84K-$85K $79K-$83K Lose $79K → $77K → ~$76K Ethereum Hold $2,280-$2,300 → $2,400 → $2,450-$2,500 $2,280-$2,420 Lose $2,280 → $2,200 → $2,100
Bitcoin looks slightly stronger than Ethereum because institutional flows have held up better and BTC is still GETTING capital relative to altcoins.
Ethereum, on the other hand, is closer to oversold territory and could produce a stronger percentage rebound if the macro environment improves.
For this week, I would watch four levels above everything else:
BTC: $79,000 and $82,500.
ETH: $2,280 and $2,400.
A break of either side should tell us whether this is another week of consolidation or the start of the next larger move.
For more crypto news and price predictions, click here.
Subscribe to our YouTube channel for daily crypto updates, market insights, and expert analysis.
The post Bitcoin and Ethereum Price Prediction for This Week (October 26 – November 1) appeared first on CaptainAltcoin.
Bitcoin and Ethereum Price Prediction for This Week (October 26 – November 1)
Bitcoin and Ethereum enter the final week of October in a difficult position.
Bitcoin is trading around $80,400 after briefly slipping below $80,000, while Ethereum has fallen toward $2,330 after touching approximately $2,281 during the latest session.
Neither asset is showing a confirmed reversal yet.
The good news for bulls is that momentum indicators are no longer far from oversold conditions. The bad news is that both BTC and ETH continue to make weak recovery attempts, and the macro calendar becomes much more important this week.
The Federal Reserve meets on October 27-28, oil remains above $110, and large U.S. technology companies report earnings. Those three factors could set the direction for crypto through November 1.
Bitcoin Price Is Back Near $80,000
The Binance two-hour BTC chart shows Bitcoin around $80,397 after trading between roughly $79,179 and $81,000 over the latest 24 hours.
The larger structure has weakened considerably since BTC traded near $87,400 earlier in October.
The first level I would watch is $79,000-$80,000.
Bitcoin has already reacted from this region several times, so another defense would keep the current range alive.
Momentum remains weak.
Source: CoinAnk
The medium and longer RSI readings are both close to 42, which means Bitcoin is below neutral but not deeply oversold.
MACD is more interesting.
The MACD lines remain below zero, but the histogram has turned positive at roughly 92.8. That can happen when bearish momentum begins losing strength even though the broader trend has not yet turned bullish.
CCI around -55 tells a similar story. Bitcoin remains weak, but the latest selling wave has cooled somewhat.
There is also plenty of leverage still in the market. BTC liquidations were close to $185 million over the latest 24-hour period, and the long/short ratio near 0.96 shows positioning is relatively balanced but still slightly tilted toward shorts.
For me, $82,000-$82,500 is the first meaningful recovery test.
Above that, $84,000-$85,000 becomes possible again.
If Bitcoin loses $79,000, however, the recent low around $75,975 becomes the next major downside reference.
Ethereum Looks Weaker Than Bitcoin
Ethereum is trading around $2,331, with the latest 24-hour range stretching from approximately $2,281 to $2,372.
The ETH chart remains weaker than BTC.
Price has been producing lower highs since the October recovery toward $2,500, and the latest bounce from $2,281 has struggled to gain traction.
The RSI readings are around 37, 38 and 40 across the short, medium and longer settings.
That puts Ethereum closer to oversold conditions than Bitcoin.
Source: CoinAnk
MACD remains below zero, with DIF near -15.92 and DEA around -16.08. The positive histogram is very small, around 0.32, which indicates that bearish momentum may be easing, but there is still no strong bullish signal.
CCI around -79 also keeps ETH on the weak side of the range.
The most important support is $2,280-$2,300.
If that region holds, ETH could attempt a recovery toward $2,400.
Above there, $2,450-$2,500 becomes the next zone.
If $2,280 fails, I would watch roughly $2,200 first, followed by $2,100.
Ethereum also has a weaker institutional-flow backdrop than Bitcoin. U.S. spot ETH ETFs have lost roughly $350 million over the past seven days, and broader October flows have remained poor. Bitcoin ETFs, by comparison, still finished the latest week with roughly $300 million of net inflows despite heavy withdrawals on Thursday and Friday.
The Fed, Oil and Tech Earnings Could Decide the Week
The biggest event is Wednesday’s Federal Reserve decision.
A Reuters poll found that 94 of 100 economists expect the Fed to hold rates at 3.75%-4.00% on October 28. However, all 100 economists in the survey expect another rate hike in December.
That means the rate decision itself may not move crypto as much as Fed Chair Kevin Warsh’s comments afterward.
If the Fed sounds comfortable waiting longer before another hike, Bitcoin and Ethereum could get some relief.
If Warsh stresses inflation risks and keeps December tightening firmly on the table, crypto could stay under pressure.
Oil is another problem.
Brent finished Friday around $116.72 after gaining more than 3% in one session as attacks on Saudi energy infrastructure raised fears of supply disruption. High oil feeds inflation concerns and makes the Fed’s job harder.
Then there is the stock market.
Alphabet, Microsoft and Amazon report earnings this week. Crypto has traded closely with risk appetite during the recent AI-stock selloff, so another bad reaction to technology spending could spill into BTC and ETH.
Bitcoin and Ethereum Price Prediction for October 26-November 1
My base case is that both assets remain volatile around current support until the Fed meeting gives the market a clearer direction.
Asset Bullish scenario Base case Bearish scenario Bitcoin Hold $79K-$80K → $82.5K → $84K-$85K $79K-$83K Lose $79K → $77K → ~$76K Ethereum Hold $2,280-$2,300 → $2,400 → $2,450-$2,500 $2,280-$2,420 Lose $2,280 → $2,200 → $2,100
Bitcoin looks slightly stronger than Ethereum because institutional flows have held up better and BTC is still GETTING capital relative to altcoins.
Ethereum, on the other hand, is closer to oversold territory and could produce a stronger percentage rebound if the macro environment improves.
For this week, I would watch four levels above everything else:
BTC: $79,000 and $82,500.
ETH: $2,280 and $2,400.
A break of either side should tell us whether this is another week of consolidation or the start of the next larger move.
For more crypto news and price predictions, click here.
Subscribe to our YouTube channel for daily crypto updates, market insights, and expert analysis.
The post Bitcoin and Ethereum Price Prediction for This Week (October 26 – November 1) appeared first on CaptainAltcoin.
Bitcoin is trading around $80,400 after briefly slipping below $80,000, while Ethereum has fallen toward $2,330 after touching approximately $2,281 during the latest session.
Neither asset is showing a confirmed reversal yet.
The good news for bulls is that momentum indicators are no longer far from oversold conditions. The bad news is that both BTC and ETH continue to make weak recovery attempts, and the macro calendar becomes much more important this week.
The Federal Reserve meets on October 27-28, oil remains above $110, and large U.S. technology companies report earnings. Those three factors could set the direction for crypto through November 1.
Bitcoin Price Is Back Near $80,000
The Binance two-hour BTC chart shows Bitcoin around $80,397 after trading between roughly $79,179 and $81,000 over the latest 24 hours.
The larger structure has weakened considerably since BTC traded near $87,400 earlier in October.
The first level I would watch is $79,000-$80,000.
Bitcoin has already reacted from this region several times, so another defense would keep the current range alive.
Momentum remains weak.
Source: CoinAnk
The medium and longer RSI readings are both close to 42, which means Bitcoin is below neutral but not deeply oversold.
MACD is more interesting.
The MACD lines remain below zero, but the histogram has turned positive at roughly 92.8. That can happen when bearish momentum begins losing strength even though the broader trend has not yet turned bullish.
CCI around -55 tells a similar story. Bitcoin remains weak, but the latest selling wave has cooled somewhat.
There is also plenty of leverage still in the market. BTC liquidations were close to $185 million over the latest 24-hour period, and the long/short ratio near 0.96 shows positioning is relatively balanced but still slightly tilted toward shorts.
For me, $82,000-$82,500 is the first meaningful recovery test.
Above that, $84,000-$85,000 becomes possible again.
If Bitcoin loses $79,000, however, the recent low around $75,975 becomes the next major downside reference.
Ethereum Looks Weaker Than Bitcoin
Ethereum is trading around $2,331, with the latest 24-hour range stretching from approximately $2,281 to $2,372.
The ETH chart remains weaker than BTC.
Price has been producing lower highs since the October recovery toward $2,500, and the latest bounce from $2,281 has struggled to gain traction.
The RSI readings are around 37, 38 and 40 across the short, medium and longer settings.
That puts Ethereum closer to oversold conditions than Bitcoin.
Source: CoinAnk
MACD remains below zero, with DIF near -15.92 and DEA around -16.08. The positive histogram is very small, around 0.32, which indicates that bearish momentum may be easing, but there is still no strong bullish signal.
CCI around -79 also keeps ETH on the weak side of the range.
The most important support is $2,280-$2,300.
If that region holds, ETH could attempt a recovery toward $2,400.
Above there, $2,450-$2,500 becomes the next zone.
If $2,280 fails, I would watch roughly $2,200 first, followed by $2,100.
Ethereum also has a weaker institutional-flow backdrop than Bitcoin. U.S. spot ETH ETFs have lost roughly $350 million over the past seven days, and broader October flows have remained poor. Bitcoin ETFs, by comparison, still finished the latest week with roughly $300 million of net inflows despite heavy withdrawals on Thursday and Friday.
The Fed, Oil and Tech Earnings Could Decide the Week
The biggest event is Wednesday’s Federal Reserve decision.
A Reuters poll found that 94 of 100 economists expect the Fed to hold rates at 3.75%-4.00% on October 28. However, all 100 economists in the survey expect another rate hike in December.
That means the rate decision itself may not move crypto as much as Fed Chair Kevin Warsh’s comments afterward.
If the Fed sounds comfortable waiting longer before another hike, Bitcoin and Ethereum could get some relief.
If Warsh stresses inflation risks and keeps December tightening firmly on the table, crypto could stay under pressure.
Oil is another problem.
Brent finished Friday around $116.72 after gaining more than 3% in one session as attacks on Saudi energy infrastructure raised fears of supply disruption. High oil feeds inflation concerns and makes the Fed’s job harder.
Then there is the stock market.
Alphabet, Microsoft and Amazon report earnings this week. Crypto has traded closely with risk appetite during the recent AI-stock selloff, so another bad reaction to technology spending could spill into BTC and ETH.
Bitcoin and Ethereum Price Prediction for October 26-November 1
My base case is that both assets remain volatile around current support until the Fed meeting gives the market a clearer direction.
Asset Bullish scenario Base case Bearish scenario Bitcoin Hold $79K-$80K → $82.5K → $84K-$85K $79K-$83K Lose $79K → $77K → ~$76K Ethereum Hold $2,280-$2,300 → $2,400 → $2,450-$2,500 $2,280-$2,420 Lose $2,280 → $2,200 → $2,100
Bitcoin looks slightly stronger than Ethereum because institutional flows have held up better and BTC is still GETTING capital relative to altcoins.
Ethereum, on the other hand, is closer to oversold territory and could produce a stronger percentage rebound if the macro environment improves.
For this week, I would watch four levels above everything else:
BTC: $79,000 and $82,500.
ETH: $2,280 and $2,400.
A break of either side should tell us whether this is another week of consolidation or the start of the next larger move.
For more crypto news and price predictions, click here.
Subscribe to our YouTube channel for daily crypto updates, market insights, and expert analysis.
The post Bitcoin and Ethereum Price Prediction for This Week (October 26 – November 1) appeared first on CaptainAltcoin.
162
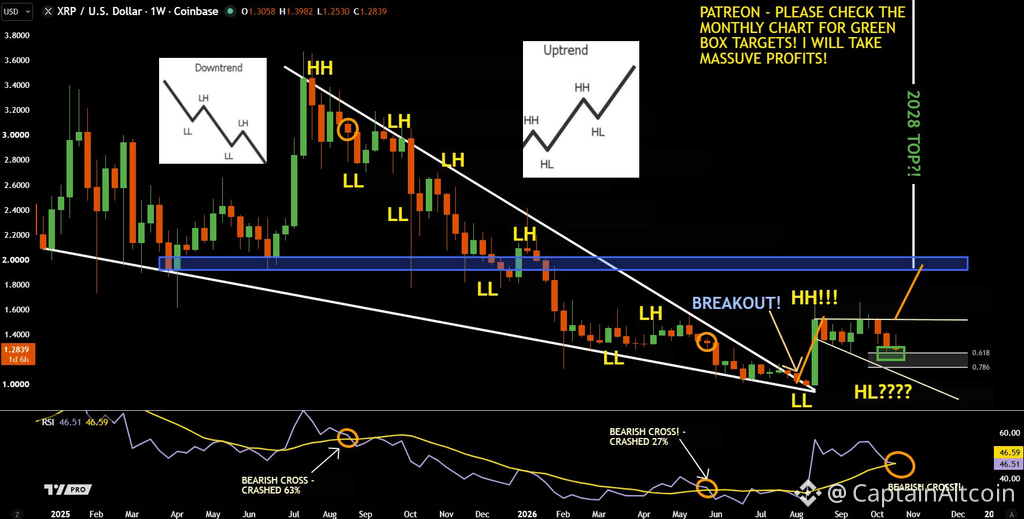
Article
XRP Price Could Be Entering a New Structure!XRP price may finally be trying to leave its long downtrend behind.
A new weekly chart shared by an analyst shows XRP breaking above the descending structure that had defined price action for months. The analyst’s main point is that XRP has already created a higher high, but the next pullback now needs to form a higher low if bulls want to confirm a genuine trend change.
That makes the current move much more interesting than a normal bounce.
XRP Has Finally Broken the Lower-High Structure
The XRP chart shows a long sequence of lower highs and lower lows from the 2025 peak near $3.40.
That pattern is the textbook definition of a downtrend.
Each rally failed below the previous high, and each selloff eventually produced another lower low.
The structure changed after XRP bottomed near the $1 area.
From there, price broke above the long descending trendline and rallied toward roughly $1.50.
The analyst labels that move as the first higher high.
That is the key change.
Source: X/@jaydee_757
A downtrend does not become bullish just because price bounces. What matters is whether the market stops printing lower highs and lower lows.
XRP has now done the first part.
The second part is still missing.
The Higher Low Could Decide the Next Move
The analyst is now watching for a higher low.
The XRP chart marks a support area around the low-$1.20s, with Fibonacci levels near the 0.618 and 0.786 retracement zones.
XRP is currently around $1.28, which places price directly above that area.
If buyers defend this region and XRP turns higher, that would create the higher low the analyst wants to see.
That would give the market a much cleaner bullish structure:
higher high → higher low → another push higher.
The next clear resistance on the chart is around $1.50.
Above that, the larger blue resistance zone near $1.90-$2.00 becomes important.
The analyst also draws a path from a possible higher low toward that region.
That does not mean $2 is guaranteed.
It means the chart would become far more constructive if XRP holds the current support and then reclaims the $1.50 area.
Read also: How High Could XRP Price Go? These Setups Are Looking Beyond $5
RSI Sends a Warning
There is one part of the chart that bulls should not ignore.
Weekly RSI is around 46.5 and is close to crossing below its moving average.
The analyst marks this as a possible bearish cross.
Previous bearish RSI crosses on the chart were followed by notable declines, including one move labeled around 27% and another much larger drop.
That does not mean history has to repeat.
But it does mean XRP is not getting a clean bullish signal from momentum yet.
For me, this creates a very clear setup.
Price structure has improved, but momentum still needs to confirm it.
If XRP holds the low-$1.20s and RSI stabilizes, the bullish case gets much stronger.
If support fails and RSI rolls over further, the breakout could turn into another failed recovery.
My XRP Price Outlook
I would split the setup into three scenarios.
Scenario XRP price path Bullish Hold $1.20-$1.25 → reclaim $1.50 → $1.90-$2.00 Neutral Consolidation between $1.20 and $1.50 Bearish Lose $1.20 → risk of a deeper retest toward $1.00
For more crypto news and price predictions, click here.
Subscribe to our YouTube channel for daily crypto updates, market insights, and expert analysis.
The post XRP Price Could Be Entering a New Structure! appeared first on CaptainAltcoin.
XRP Price Could Be Entering a New Structure!
XRP price may finally be trying to leave its long downtrend behind.
A new weekly chart shared by an analyst shows XRP breaking above the descending structure that had defined price action for months. The analyst’s main point is that XRP has already created a higher high, but the next pullback now needs to form a higher low if bulls want to confirm a genuine trend change.
That makes the current move much more interesting than a normal bounce.
XRP Has Finally Broken the Lower-High Structure
The XRP chart shows a long sequence of lower highs and lower lows from the 2025 peak near $3.40.
That pattern is the textbook definition of a downtrend.
Each rally failed below the previous high, and each selloff eventually produced another lower low.
The structure changed after XRP bottomed near the $1 area.
From there, price broke above the long descending trendline and rallied toward roughly $1.50.
The analyst labels that move as the first higher high.
That is the key change.
Source: X/@jaydee_757
A downtrend does not become bullish just because price bounces. What matters is whether the market stops printing lower highs and lower lows.
XRP has now done the first part.
The second part is still missing.
The Higher Low Could Decide the Next Move
The analyst is now watching for a higher low.
The XRP chart marks a support area around the low-$1.20s, with Fibonacci levels near the 0.618 and 0.786 retracement zones.
XRP is currently around $1.28, which places price directly above that area.
If buyers defend this region and XRP turns higher, that would create the higher low the analyst wants to see.
That would give the market a much cleaner bullish structure:
higher high → higher low → another push higher.
The next clear resistance on the chart is around $1.50.
Above that, the larger blue resistance zone near $1.90-$2.00 becomes important.
The analyst also draws a path from a possible higher low toward that region.
That does not mean $2 is guaranteed.
It means the chart would become far more constructive if XRP holds the current support and then reclaims the $1.50 area.
Read also: How High Could XRP Price Go? These Setups Are Looking Beyond $5
RSI Sends a Warning
There is one part of the chart that bulls should not ignore.
Weekly RSI is around 46.5 and is close to crossing below its moving average.
The analyst marks this as a possible bearish cross.
Previous bearish RSI crosses on the chart were followed by notable declines, including one move labeled around 27% and another much larger drop.
That does not mean history has to repeat.
But it does mean XRP is not getting a clean bullish signal from momentum yet.
For me, this creates a very clear setup.
Price structure has improved, but momentum still needs to confirm it.
If XRP holds the low-$1.20s and RSI stabilizes, the bullish case gets much stronger.
If support fails and RSI rolls over further, the breakout could turn into another failed recovery.
My XRP Price Outlook
I would split the setup into three scenarios.
Scenario XRP price path Bullish Hold $1.20-$1.25 → reclaim $1.50 → $1.90-$2.00 Neutral Consolidation between $1.20 and $1.50 Bearish Lose $1.20 → risk of a deeper retest toward $1.00
For more crypto news and price predictions, click here.
Subscribe to our YouTube channel for daily crypto updates, market insights, and expert analysis.
The post XRP Price Could Be Entering a New Structure! appeared first on CaptainAltcoin.
A new weekly chart shared by an analyst shows XRP breaking above the descending structure that had defined price action for months. The analyst’s main point is that XRP has already created a higher high, but the next pullback now needs to form a higher low if bulls want to confirm a genuine trend change.
That makes the current move much more interesting than a normal bounce.
XRP Has Finally Broken the Lower-High Structure
The XRP chart shows a long sequence of lower highs and lower lows from the 2025 peak near $3.40.
That pattern is the textbook definition of a downtrend.
Each rally failed below the previous high, and each selloff eventually produced another lower low.
The structure changed after XRP bottomed near the $1 area.
From there, price broke above the long descending trendline and rallied toward roughly $1.50.
The analyst labels that move as the first higher high.
That is the key change.
Source: X/@jaydee_757
A downtrend does not become bullish just because price bounces. What matters is whether the market stops printing lower highs and lower lows.
XRP has now done the first part.
The second part is still missing.
The Higher Low Could Decide the Next Move
The analyst is now watching for a higher low.
The XRP chart marks a support area around the low-$1.20s, with Fibonacci levels near the 0.618 and 0.786 retracement zones.
XRP is currently around $1.28, which places price directly above that area.
If buyers defend this region and XRP turns higher, that would create the higher low the analyst wants to see.
That would give the market a much cleaner bullish structure:
higher high → higher low → another push higher.
The next clear resistance on the chart is around $1.50.
Above that, the larger blue resistance zone near $1.90-$2.00 becomes important.
The analyst also draws a path from a possible higher low toward that region.
That does not mean $2 is guaranteed.
It means the chart would become far more constructive if XRP holds the current support and then reclaims the $1.50 area.
Read also: How High Could XRP Price Go? These Setups Are Looking Beyond $5
RSI Sends a Warning
There is one part of the chart that bulls should not ignore.
Weekly RSI is around 46.5 and is close to crossing below its moving average.
The analyst marks this as a possible bearish cross.
Previous bearish RSI crosses on the chart were followed by notable declines, including one move labeled around 27% and another much larger drop.
That does not mean history has to repeat.
But it does mean XRP is not getting a clean bullish signal from momentum yet.
For me, this creates a very clear setup.
Price structure has improved, but momentum still needs to confirm it.
If XRP holds the low-$1.20s and RSI stabilizes, the bullish case gets much stronger.
If support fails and RSI rolls over further, the breakout could turn into another failed recovery.
My XRP Price Outlook
I would split the setup into three scenarios.
Scenario XRP price path Bullish Hold $1.20-$1.25 → reclaim $1.50 → $1.90-$2.00 Neutral Consolidation between $1.20 and $1.50 Bearish Lose $1.20 → risk of a deeper retest toward $1.00
For more crypto news and price predictions, click here.
Subscribe to our YouTube channel for daily crypto updates, market insights, and expert analysis.
The post XRP Price Could Be Entering a New Structure! appeared first on CaptainAltcoin.
2
9
2.6k
Could Lab-Grown Gold Crash Prices Like Lab-Grown Diamonds Did?The diamond industry offers a warning about what can happen when something built around scarcity becomes easier to manufacture.
Natural one-carat diamond prices have fallen from roughly $8,007 in 2021 to about $3,898 in 2026, a decline of 51%. Lab-grown diamonds have played a role alongside excess supply and weaker demand, with De Beers reporting that wholesale prices for synthetic diamonds have fallen about 93% since 2020.
Now there is an unusual question for gold investors.
Could the same thing eventually happen to gold?
A Fusion Startup Wants to Turn Mercury Into Gold
San Francisco-based Marathon Fusion has developed a method that it says could use fusion neutrons to convert mercury-198 into stable gold-197.
Its research paper estimates that a commercial fusion plant could potentially produce around two tonnes of gold per gigawatt of thermal power each year.
The idea is real enough to have attracted serious investors.
In 2024, Marathon raised a $5.9 million seed round led by 1517 Fund and Anglo American, the mining group that owns most of De Beers. De Beers itself was not the investor.
That connection is interesting given what happened in diamonds, but the technology is nowhere close to replacing mined gold.
IS GOLD NEXT?
Natural diamond prices have CRASHED 51% since their 2021 peak.
Now, De Beers’ parent company is BACKING a U.S. startup exploring lab-made GOLD.
De Beers, the company behind “A Diamond Is Forever,” once controlled 85% of global rough diamond supply.
But DIAMOND prices have PLUMMETED.
Natural diamonds fell from an average of $8,007 per 1-carat stone in 2021 to $3,898 in 2026, according to CNBC.
Lab-grown diamonds saw wholesale prices plunge 90%–95% since 2015, according to Euronews.
De Beers suffered as parent company Anglo American recorded $6.8 BILLION in write-downs between 2023 and 2025.
Anglo American, which owns 85% of De Beers, invested in Marathon Fusion’s $5.9 MILLION funding round in 2024. De Beers itself was NOT the investor.
Marathon Fusion claims it has successfully converted mercury into STABLE GOLD.
But major challenges remain, per FT:
Artificial gold could require 14–18 YEARS of storage due to radioactive impurities.
Commercial-scale fusion production remains unproven.
Marathon itself expects the gold market could absorb future production without significantly affecting prices.
The breakthrough also remains independently UNVERIFIED.
Lab-grown diamonds disrupted an industry built on scarcity.
Diamonds weren’t forever. Could GOLD eventually face the same disruption?— Coin Bureau (@coinbureau) October 25, 2026
Marathon’s own proposal still depends on commercial-scale fusion power, which itself remains a developing industry.
There is also a practical problem with the product.
The company’s paper says newly produced gold could contain radioactive impurities. Depending on the safety threshold used, the material could need years of cooling. Under the most conservative standard in the paper, it would take about 17.7 years before the radioactivity fell below the level of a banana equivalent per troy ounce.
Read also: Gold Price Today: Why $4,000 Is the Level Everyone Is Watching
Could Artificial Gold Actually Hurt Gold Prices?
Probably not anytime soon.
The numbers explain why.
Marathon’s proposed output is around two tonnes per GWth per year. Global gold mines produced roughly 3,672 tonnes in 2025, and more than 220,000 tonnes of gold already existed above ground by 2026.
So even if the technology works exactly as planned, early production would be tiny compared with the existing gold market.
The more interesting question is what happens decades from now if fusion becomes commercial and gold production scales with it.
Gold’s investment appeal partly depends on scarcity. If technology eventually makes new supply much easier to create, that scarcity argument could weaken.
This is where the diamond comparison becomes useful.
Lab-grown diamonds did not destroy natural diamonds overnight. They changed the economics gradually by creating a cheaper substitute and altering how consumers thought about scarcity.
Gold could face a similar debate if fusion-made gold ever reaches meaningful scale.
But there is one big difference.
Gold is not only jewelry. It is also held by central banks, investors and institutions as a monetary and reserve asset. That gives it a much broader demand base than diamonds.
For now, fusion-made gold is more of a fascinating long-term risk to watch than a threat to today’s gold price.
The technology still needs commercial fusion, scalable production and a solution to the radioactive cooldown problem.
But if those hurdles are ever solved, the idea that gold supply is permanently limited may become a little harder to defend.
For more financial news and price predictions, click here.
Subscribe to our YouTube channel for daily crypto updates, market insights, and expert analysis.
The post Could Lab-Grown Gold Crash Prices Like Lab-Grown Diamonds Did? appeared first on CaptainAltcoin.
Could Lab-Grown Gold Crash Prices Like Lab-Grown Diamonds Did?
The diamond industry offers a warning about what can happen when something built around scarcity becomes easier to manufacture.
Natural one-carat diamond prices have fallen from roughly $8,007 in 2021 to about $3,898 in 2026, a decline of 51%. Lab-grown diamonds have played a role alongside excess supply and weaker demand, with De Beers reporting that wholesale prices for synthetic diamonds have fallen about 93% since 2020.
Now there is an unusual question for gold investors.
Could the same thing eventually happen to gold?
A Fusion Startup Wants to Turn Mercury Into Gold
San Francisco-based Marathon Fusion has developed a method that it says could use fusion neutrons to convert mercury-198 into stable gold-197.
Its research paper estimates that a commercial fusion plant could potentially produce around two tonnes of gold per gigawatt of thermal power each year.
The idea is real enough to have attracted serious investors.
In 2024, Marathon raised a $5.9 million seed round led by 1517 Fund and Anglo American, the mining group that owns most of De Beers. De Beers itself was not the investor.
That connection is interesting given what happened in diamonds, but the technology is nowhere close to replacing mined gold.
IS GOLD NEXT?
Natural diamond prices have CRASHED 51% since their 2021 peak.
Now, De Beers’ parent company is BACKING a U.S. startup exploring lab-made GOLD.
De Beers, the company behind “A Diamond Is Forever,” once controlled 85% of global rough diamond supply.
But DIAMOND prices have PLUMMETED.
Natural diamonds fell from an average of $8,007 per 1-carat stone in 2021 to $3,898 in 2026, according to CNBC.
Lab-grown diamonds saw wholesale prices plunge 90%–95% since 2015, according to Euronews.
De Beers suffered as parent company Anglo American recorded $6.8 BILLION in write-downs between 2023 and 2025.
Anglo American, which owns 85% of De Beers, invested in Marathon Fusion’s $5.9 MILLION funding round in 2024. De Beers itself was NOT the investor.
Marathon Fusion claims it has successfully converted mercury into STABLE GOLD.
But major challenges remain, per FT:
Artificial gold could require 14–18 YEARS of storage due to radioactive impurities.
Commercial-scale fusion production remains unproven.
Marathon itself expects the gold market could absorb future production without significantly affecting prices.
The breakthrough also remains independently UNVERIFIED.
Lab-grown diamonds disrupted an industry built on scarcity.
Diamonds weren’t forever. Could GOLD eventually face the same disruption?— Coin Bureau (@coinbureau) October 25, 2026
Marathon’s own proposal still depends on commercial-scale fusion power, which itself remains a developing industry.
There is also a practical problem with the product.
The company’s paper says newly produced gold could contain radioactive impurities. Depending on the safety threshold used, the material could need years of cooling. Under the most conservative standard in the paper, it would take about 17.7 years before the radioactivity fell below the level of a banana equivalent per troy ounce.
Read also: Gold Price Today: Why $4,000 Is the Level Everyone Is Watching
Could Artificial Gold Actually Hurt Gold Prices?
Probably not anytime soon.
The numbers explain why.
Marathon’s proposed output is around two tonnes per GWth per year. Global gold mines produced roughly 3,672 tonnes in 2025, and more than 220,000 tonnes of gold already existed above ground by 2026.
So even if the technology works exactly as planned, early production would be tiny compared with the existing gold market.
The more interesting question is what happens decades from now if fusion becomes commercial and gold production scales with it.
Gold’s investment appeal partly depends on scarcity. If technology eventually makes new supply much easier to create, that scarcity argument could weaken.
This is where the diamond comparison becomes useful.
Lab-grown diamonds did not destroy natural diamonds overnight. They changed the economics gradually by creating a cheaper substitute and altering how consumers thought about scarcity.
Gold could face a similar debate if fusion-made gold ever reaches meaningful scale.
But there is one big difference.
Gold is not only jewelry. It is also held by central banks, investors and institutions as a monetary and reserve asset. That gives it a much broader demand base than diamonds.
For now, fusion-made gold is more of a fascinating long-term risk to watch than a threat to today’s gold price.
The technology still needs commercial fusion, scalable production and a solution to the radioactive cooldown problem.
But if those hurdles are ever solved, the idea that gold supply is permanently limited may become a little harder to defend.
For more financial news and price predictions, click here.
Subscribe to our YouTube channel for daily crypto updates, market insights, and expert analysis.
The post Could Lab-Grown Gold Crash Prices Like Lab-Grown Diamonds Did? appeared first on CaptainAltcoin.
Natural one-carat diamond prices have fallen from roughly $8,007 in 2021 to about $3,898 in 2026, a decline of 51%. Lab-grown diamonds have played a role alongside excess supply and weaker demand, with De Beers reporting that wholesale prices for synthetic diamonds have fallen about 93% since 2020.
Now there is an unusual question for gold investors.
Could the same thing eventually happen to gold?
A Fusion Startup Wants to Turn Mercury Into Gold
San Francisco-based Marathon Fusion has developed a method that it says could use fusion neutrons to convert mercury-198 into stable gold-197.
Its research paper estimates that a commercial fusion plant could potentially produce around two tonnes of gold per gigawatt of thermal power each year.
The idea is real enough to have attracted serious investors.
In 2024, Marathon raised a $5.9 million seed round led by 1517 Fund and Anglo American, the mining group that owns most of De Beers. De Beers itself was not the investor.
That connection is interesting given what happened in diamonds, but the technology is nowhere close to replacing mined gold.
IS GOLD NEXT?
Natural diamond prices have CRASHED 51% since their 2021 peak.
Now, De Beers’ parent company is BACKING a U.S. startup exploring lab-made GOLD.
De Beers, the company behind “A Diamond Is Forever,” once controlled 85% of global rough diamond supply.
But DIAMOND prices have PLUMMETED.
Natural diamonds fell from an average of $8,007 per 1-carat stone in 2021 to $3,898 in 2026, according to CNBC.
Lab-grown diamonds saw wholesale prices plunge 90%–95% since 2015, according to Euronews.
De Beers suffered as parent company Anglo American recorded $6.8 BILLION in write-downs between 2023 and 2025.
Anglo American, which owns 85% of De Beers, invested in Marathon Fusion’s $5.9 MILLION funding round in 2024. De Beers itself was NOT the investor.
Marathon Fusion claims it has successfully converted mercury into STABLE GOLD.
But major challenges remain, per FT:
Artificial gold could require 14–18 YEARS of storage due to radioactive impurities.
Commercial-scale fusion production remains unproven.
Marathon itself expects the gold market could absorb future production without significantly affecting prices.
The breakthrough also remains independently UNVERIFIED.
Lab-grown diamonds disrupted an industry built on scarcity.
Diamonds weren’t forever. Could GOLD eventually face the same disruption?— Coin Bureau (@coinbureau) October 25, 2026
Marathon’s own proposal still depends on commercial-scale fusion power, which itself remains a developing industry.
There is also a practical problem with the product.
The company’s paper says newly produced gold could contain radioactive impurities. Depending on the safety threshold used, the material could need years of cooling. Under the most conservative standard in the paper, it would take about 17.7 years before the radioactivity fell below the level of a banana equivalent per troy ounce.
Read also: Gold Price Today: Why $4,000 Is the Level Everyone Is Watching
Could Artificial Gold Actually Hurt Gold Prices?
Probably not anytime soon.
The numbers explain why.
Marathon’s proposed output is around two tonnes per GWth per year. Global gold mines produced roughly 3,672 tonnes in 2025, and more than 220,000 tonnes of gold already existed above ground by 2026.
So even if the technology works exactly as planned, early production would be tiny compared with the existing gold market.
The more interesting question is what happens decades from now if fusion becomes commercial and gold production scales with it.
Gold’s investment appeal partly depends on scarcity. If technology eventually makes new supply much easier to create, that scarcity argument could weaken.
This is where the diamond comparison becomes useful.
Lab-grown diamonds did not destroy natural diamonds overnight. They changed the economics gradually by creating a cheaper substitute and altering how consumers thought about scarcity.
Gold could face a similar debate if fusion-made gold ever reaches meaningful scale.
But there is one big difference.
Gold is not only jewelry. It is also held by central banks, investors and institutions as a monetary and reserve asset. That gives it a much broader demand base than diamonds.
For now, fusion-made gold is more of a fascinating long-term risk to watch than a threat to today’s gold price.
The technology still needs commercial fusion, scalable production and a solution to the radioactive cooldown problem.
But if those hurdles are ever solved, the idea that gold supply is permanently limited may become a little harder to defend.
For more financial news and price predictions, click here.
Subscribe to our YouTube channel for daily crypto updates, market insights, and expert analysis.
The post Could Lab-Grown Gold Crash Prices Like Lab-Grown Diamonds Did? appeared first on CaptainAltcoin.
359
Bitcoin Midterm Election Curse Returns!Bitcoin is approaching another U.S. midterm election, and an old market pattern is worth talking about again.
A chart shared by analyst Ali Martinez shows large BTC drawdowns around the previous four midterm cycles:
2010: -72%
2014: -65%
2018: -52%
2022: -27%
The pattern looks ugly at first glance, but it needs some context.
The chart does not explain the exact measurement window used for each decline, so these numbers should be treated as a historical comparison rather than proof that midterm elections caused the selloffs.
Broader crypto cycles, liquidity conditions and macro stress also played large roles.
Bitcoin Has Struggled Around Midterm Cycles
The broader record is mixed but still worth watching.
Bitcoin price posted negative fourth-quarter returns in 2014, 2018 and 2022, losing roughly 16.7%, 42.2% and 14.8% in those periods.
There is also a timing pattern around post-election lows. Bitcoin bottomed after the 2014, 2018 and 2022 midterms, although the gap between election day and the eventual low varied significantly.
That means the so-called “midterm curse” is better viewed as a recurring period of stress than a reliable trading rule.
BITCOIN MIDTERM ELECTION CURSE
Look at what happened to $BTC around the previous four US midterm election cycles:
2010: Bitcoin fell 72%.
2014: Bitcoin fell 65%.
2018: Bitcoin fell 52%.
2022: Bitcoin fell 27%.
Four consecutive cycles of significant downside. https://t.co/WOIBBYz18C— Ali Charts (@alicharts) October 24, 2026
For 2026, Bitcoin is already under pressure before the November 3 election, with macro uncertainty, expensive oil and restrictive financial conditions all weighing on risk assets.
A Practical Risk Framework for Bitcoin Traders
Instead of assuming history will repeat exactly, traders can use the midterm pattern as a risk-management signal.
The first thing to watch is whether Bitcoin keeps making lower lows into the election. If BTC loses recent support and selling volume expands, that would give the historical pattern more weight.
The second is macro confirmation. High oil, rising Treasury yields and a more hawkish Federal Reserve would make the bearish setup more credible.
On the other hand, if Bitcoin holds support, reclaims recent resistance and macro conditions improve, the midterm pattern becomes much less useful.
A simple framework would be:
Signal What it could mean BTC loses recent support Downside risk remains active Oil and yields stay high Macro pressure continues BTC holds support into election Historical pattern may weaken BTC reclaims key resistance Recovery case improves
The main point is not to trade the election date itself.
The better approach is to use the historical pattern as one part of a broader setup and wait for price, volume and macro conditions to confirm it.
So history is worth keeping in mind, but the election itself is unlikely to be the only thing deciding Bitcoin’s next move.
For more crypto news and price predictions, click here.
Subscribe to our YouTube channel for daily crypto updates, market insights, and expert analysis.
The post Bitcoin Midterm Election Curse Returns! appeared first on CaptainAltcoin.
Bitcoin Midterm Election Curse Returns!
Bitcoin is approaching another U.S. midterm election, and an old market pattern is worth talking about again.
A chart shared by analyst Ali Martinez shows large BTC drawdowns around the previous four midterm cycles:
2010: -72%
2014: -65%
2018: -52%
2022: -27%
The pattern looks ugly at first glance, but it needs some context.
The chart does not explain the exact measurement window used for each decline, so these numbers should be treated as a historical comparison rather than proof that midterm elections caused the selloffs.
Broader crypto cycles, liquidity conditions and macro stress also played large roles.
Bitcoin Has Struggled Around Midterm Cycles
The broader record is mixed but still worth watching.
Bitcoin price posted negative fourth-quarter returns in 2014, 2018 and 2022, losing roughly 16.7%, 42.2% and 14.8% in those periods.
There is also a timing pattern around post-election lows. Bitcoin bottomed after the 2014, 2018 and 2022 midterms, although the gap between election day and the eventual low varied significantly.
That means the so-called “midterm curse” is better viewed as a recurring period of stress than a reliable trading rule.
BITCOIN MIDTERM ELECTION CURSE
Look at what happened to $BTC around the previous four US midterm election cycles:
2010: Bitcoin fell 72%.
2014: Bitcoin fell 65%.
2018: Bitcoin fell 52%.
2022: Bitcoin fell 27%.
Four consecutive cycles of significant downside. https://t.co/WOIBBYz18C— Ali Charts (@alicharts) October 24, 2026
For 2026, Bitcoin is already under pressure before the November 3 election, with macro uncertainty, expensive oil and restrictive financial conditions all weighing on risk assets.
A Practical Risk Framework for Bitcoin Traders
Instead of assuming history will repeat exactly, traders can use the midterm pattern as a risk-management signal.
The first thing to watch is whether Bitcoin keeps making lower lows into the election. If BTC loses recent support and selling volume expands, that would give the historical pattern more weight.
The second is macro confirmation. High oil, rising Treasury yields and a more hawkish Federal Reserve would make the bearish setup more credible.
On the other hand, if Bitcoin holds support, reclaims recent resistance and macro conditions improve, the midterm pattern becomes much less useful.
A simple framework would be:
Signal What it could mean BTC loses recent support Downside risk remains active Oil and yields stay high Macro pressure continues BTC holds support into election Historical pattern may weaken BTC reclaims key resistance Recovery case improves
The main point is not to trade the election date itself.
The better approach is to use the historical pattern as one part of a broader setup and wait for price, volume and macro conditions to confirm it.
So history is worth keeping in mind, but the election itself is unlikely to be the only thing deciding Bitcoin’s next move.
For more crypto news and price predictions, click here.
Subscribe to our YouTube channel for daily crypto updates, market insights, and expert analysis.
The post Bitcoin Midterm Election Curse Returns! appeared first on CaptainAltcoin.
A chart shared by analyst Ali Martinez shows large BTC drawdowns around the previous four midterm cycles:
2010: -72%
2014: -65%
2018: -52%
2022: -27%
The pattern looks ugly at first glance, but it needs some context.
The chart does not explain the exact measurement window used for each decline, so these numbers should be treated as a historical comparison rather than proof that midterm elections caused the selloffs.
Broader crypto cycles, liquidity conditions and macro stress also played large roles.
Bitcoin Has Struggled Around Midterm Cycles
The broader record is mixed but still worth watching.
Bitcoin price posted negative fourth-quarter returns in 2014, 2018 and 2022, losing roughly 16.7%, 42.2% and 14.8% in those periods.
There is also a timing pattern around post-election lows. Bitcoin bottomed after the 2014, 2018 and 2022 midterms, although the gap between election day and the eventual low varied significantly.
That means the so-called “midterm curse” is better viewed as a recurring period of stress than a reliable trading rule.
BITCOIN MIDTERM ELECTION CURSE
Look at what happened to $BTC around the previous four US midterm election cycles:
2010: Bitcoin fell 72%.
2014: Bitcoin fell 65%.
2018: Bitcoin fell 52%.
2022: Bitcoin fell 27%.
Four consecutive cycles of significant downside. https://t.co/WOIBBYz18C— Ali Charts (@alicharts) October 24, 2026
For 2026, Bitcoin is already under pressure before the November 3 election, with macro uncertainty, expensive oil and restrictive financial conditions all weighing on risk assets.
A Practical Risk Framework for Bitcoin Traders
Instead of assuming history will repeat exactly, traders can use the midterm pattern as a risk-management signal.
The first thing to watch is whether Bitcoin keeps making lower lows into the election. If BTC loses recent support and selling volume expands, that would give the historical pattern more weight.
The second is macro confirmation. High oil, rising Treasury yields and a more hawkish Federal Reserve would make the bearish setup more credible.
On the other hand, if Bitcoin holds support, reclaims recent resistance and macro conditions improve, the midterm pattern becomes much less useful.
A simple framework would be:
Signal What it could mean BTC loses recent support Downside risk remains active Oil and yields stay high Macro pressure continues BTC holds support into election Historical pattern may weaken BTC reclaims key resistance Recovery case improves
The main point is not to trade the election date itself.
The better approach is to use the historical pattern as one part of a broader setup and wait for price, volume and macro conditions to confirm it.
So history is worth keeping in mind, but the election itself is unlikely to be the only thing deciding Bitcoin’s next move.
For more crypto news and price predictions, click here.
Subscribe to our YouTube channel for daily crypto updates, market insights, and expert analysis.
The post Bitcoin Midterm Election Curse Returns! appeared first on CaptainAltcoin.
203
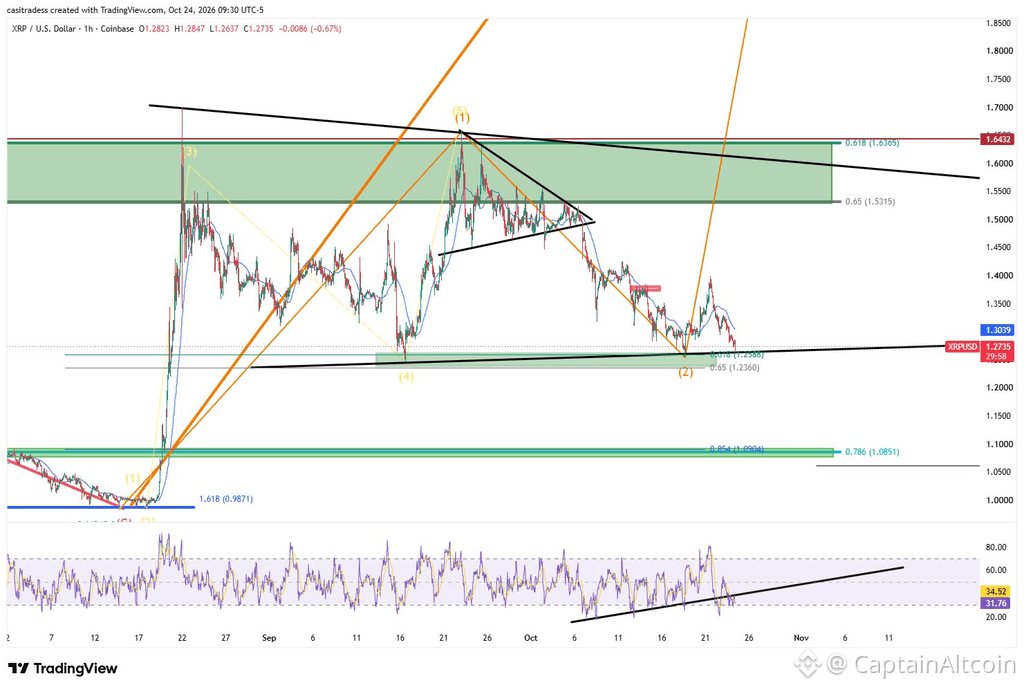
Article
XRP Price Tests Critical Support Again, Analyst Maps the Bullish CaseXRP price is back at a support zone that has already attracted buyers several times, and analyst CasiTrades is watching the reaction closely.
“XRP gets ANOTHER test of support,” she wrote alongside a new one-hour Coinbase chart.
We cover CasiTrades fairly often because her setups usually give clear levels, defined support zones and an obvious point where the bullish idea stops working. This one is no different.
XRP is trading around $1.27, almost directly on top of the support region she has been tracking.
CasiTrades’ XRP Chart Puts $1.26 at the Center
The first level on the chart is the 0.618 Fibonacci retracement around $1.2588.
That is where XRP is testing support now.
Just below it, the chart shows another level around $1.2360.
The important detail is that this area also lines up with a rising support line that has been forming since the August lows.
Source: X/@CasiTrades
So XRP is not testing one random price.
It is testing a cluster of technical support around $1.24-$1.26.
The chart also shows RSI near 31.8, with its average around 34.5. Momentum is therefore weak and close to oversold conditions.
CasiTrades also draws an upward-sloping RSI trendline beneath recent lows. If RSI keeps respecting that structure as price holds $1.26, it would add weight to the idea that sellers are losing control.
What Happens If XRP Holds?
The upside levels are clearly marked.
The first area I would watch is around $1.30-$1.31.
Above that, the XRP price would need to reclaim roughly $1.35-$1.38 before the short-term structure starts looking healthier.
The larger resistance zone on CasiTrades’ chart sits between approximately $1.53 and $1.64.
That region includes:
0.65 level near $1.5315
0.618 level near $1.6365
horizontal resistance around $1.6432
That is the area bulls would eventually need to break before talking about a much larger trend reversal.
The chart also shows a descending trendline coming directly through that zone, so $1.53-$1.64 is not an easy target.
My XRP Price Outlook
My interpretation is that XRP still has a chance to bounce, but the current support needs to hold first.
If $1.258-$1.26 survives, I would look for $1.30 first, then $1.35-$1.38.
A stronger recovery could eventually bring $1.50-$1.53 back into focus.
If $1.258 fails, however, $1.236 becomes the next level.
Below that, the chart contains a much deeper support zone around $1.09-$1.085.
Scenario XRP price path Bullish Hold $1.26 → $1.30 → $1.35-$1.38 Stronger recovery Break $1.38 → $1.50-$1.53 Bearish Lose $1.258 → $1.236 Deeper downside Lose $1.236 → $1.09-$1.085
For me, the key point is simple.
XRP is not yet bouncing.
It is testing the level from which a bounce could begin.
That makes the next reaction around $1.24-$1.26 far more important than trying to predict a large upside target too early.
For more crypto news and price predictions, click here.
Subscribe to our YouTube channel for daily crypto updates, market insights, and expert analysis.
The post XRP Price Tests Critical Support Again, Analyst Maps the Bullish Case appeared first on CaptainAltcoin.
XRP Price Tests Critical Support Again, Analyst Maps the Bullish Case
XRP price is back at a support zone that has already attracted buyers several times, and analyst CasiTrades is watching the reaction closely.
“XRP gets ANOTHER test of support,” she wrote alongside a new one-hour Coinbase chart.
We cover CasiTrades fairly often because her setups usually give clear levels, defined support zones and an obvious point where the bullish idea stops working. This one is no different.
XRP is trading around $1.27, almost directly on top of the support region she has been tracking.
CasiTrades’ XRP Chart Puts $1.26 at the Center
The first level on the chart is the 0.618 Fibonacci retracement around $1.2588.
That is where XRP is testing support now.
Just below it, the chart shows another level around $1.2360.
The important detail is that this area also lines up with a rising support line that has been forming since the August lows.
Source: X/@CasiTrades
So XRP is not testing one random price.
It is testing a cluster of technical support around $1.24-$1.26.
The chart also shows RSI near 31.8, with its average around 34.5. Momentum is therefore weak and close to oversold conditions.
CasiTrades also draws an upward-sloping RSI trendline beneath recent lows. If RSI keeps respecting that structure as price holds $1.26, it would add weight to the idea that sellers are losing control.
What Happens If XRP Holds?
The upside levels are clearly marked.
The first area I would watch is around $1.30-$1.31.
Above that, the XRP price would need to reclaim roughly $1.35-$1.38 before the short-term structure starts looking healthier.
The larger resistance zone on CasiTrades’ chart sits between approximately $1.53 and $1.64.
That region includes:
0.65 level near $1.5315
0.618 level near $1.6365
horizontal resistance around $1.6432
That is the area bulls would eventually need to break before talking about a much larger trend reversal.
The chart also shows a descending trendline coming directly through that zone, so $1.53-$1.64 is not an easy target.
My XRP Price Outlook
My interpretation is that XRP still has a chance to bounce, but the current support needs to hold first.
If $1.258-$1.26 survives, I would look for $1.30 first, then $1.35-$1.38.
A stronger recovery could eventually bring $1.50-$1.53 back into focus.
If $1.258 fails, however, $1.236 becomes the next level.
Below that, the chart contains a much deeper support zone around $1.09-$1.085.
Scenario XRP price path Bullish Hold $1.26 → $1.30 → $1.35-$1.38 Stronger recovery Break $1.38 → $1.50-$1.53 Bearish Lose $1.258 → $1.236 Deeper downside Lose $1.236 → $1.09-$1.085
For me, the key point is simple.
XRP is not yet bouncing.
It is testing the level from which a bounce could begin.
That makes the next reaction around $1.24-$1.26 far more important than trying to predict a large upside target too early.
For more crypto news and price predictions, click here.
Subscribe to our YouTube channel for daily crypto updates, market insights, and expert analysis.
The post XRP Price Tests Critical Support Again, Analyst Maps the Bullish Case appeared first on CaptainAltcoin.
“XRP gets ANOTHER test of support,” she wrote alongside a new one-hour Coinbase chart.
We cover CasiTrades fairly often because her setups usually give clear levels, defined support zones and an obvious point where the bullish idea stops working. This one is no different.
XRP is trading around $1.27, almost directly on top of the support region she has been tracking.
CasiTrades’ XRP Chart Puts $1.26 at the Center
The first level on the chart is the 0.618 Fibonacci retracement around $1.2588.
That is where XRP is testing support now.
Just below it, the chart shows another level around $1.2360.
The important detail is that this area also lines up with a rising support line that has been forming since the August lows.
Source: X/@CasiTrades
So XRP is not testing one random price.
It is testing a cluster of technical support around $1.24-$1.26.
The chart also shows RSI near 31.8, with its average around 34.5. Momentum is therefore weak and close to oversold conditions.
CasiTrades also draws an upward-sloping RSI trendline beneath recent lows. If RSI keeps respecting that structure as price holds $1.26, it would add weight to the idea that sellers are losing control.
What Happens If XRP Holds?
The upside levels are clearly marked.
The first area I would watch is around $1.30-$1.31.
Above that, the XRP price would need to reclaim roughly $1.35-$1.38 before the short-term structure starts looking healthier.
The larger resistance zone on CasiTrades’ chart sits between approximately $1.53 and $1.64.
That region includes:
0.65 level near $1.5315
0.618 level near $1.6365
horizontal resistance around $1.6432
That is the area bulls would eventually need to break before talking about a much larger trend reversal.
The chart also shows a descending trendline coming directly through that zone, so $1.53-$1.64 is not an easy target.
My XRP Price Outlook
My interpretation is that XRP still has a chance to bounce, but the current support needs to hold first.
If $1.258-$1.26 survives, I would look for $1.30 first, then $1.35-$1.38.
A stronger recovery could eventually bring $1.50-$1.53 back into focus.
If $1.258 fails, however, $1.236 becomes the next level.
Below that, the chart contains a much deeper support zone around $1.09-$1.085.
Scenario XRP price path Bullish Hold $1.26 → $1.30 → $1.35-$1.38 Stronger recovery Break $1.38 → $1.50-$1.53 Bearish Lose $1.258 → $1.236 Deeper downside Lose $1.236 → $1.09-$1.085
For me, the key point is simple.
XRP is not yet bouncing.
It is testing the level from which a bounce could begin.
That makes the next reaction around $1.24-$1.26 far more important than trying to predict a large upside target too early.
For more crypto news and price predictions, click here.
Subscribe to our YouTube channel for daily crypto updates, market insights, and expert analysis.
The post XRP Price Tests Critical Support Again, Analyst Maps the Bullish Case appeared first on CaptainAltcoin.
1
2
967
Partly True
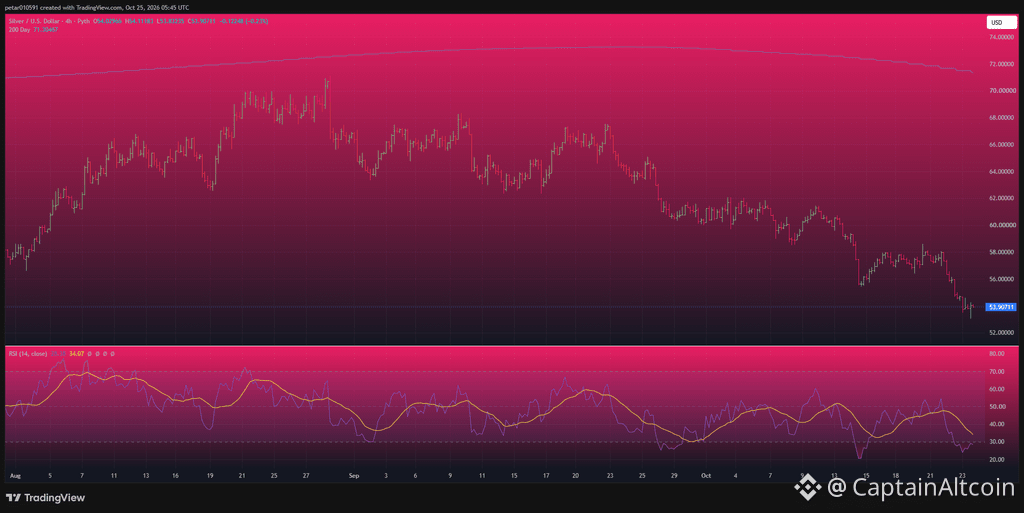
Article
Silver Price Prediction: Silver Shorts Reach an Extreme As XAG Tests $54Silver price sentiment has deteriorated dramatically, but the bearish trade may now be getting crowded enough to create conditions for a big countertrend move.
The Kobeissi Letter points to silver’s three-month put-call skew, which has risen to around -3 points, its highest level since early July.
Kobeissi says the metric has increased by roughly 10 points over the past four weeks, which shows stronger demand for bearish silver positions.
Even more striking, the reading has been higher only about 2% of the time over the past 12 months.
That tells us positioning has moved toward an extreme.
Kobeissi Says Investors Are Extremely Bearish on Silver
The options market is only one part of the story.
Kobeissi also notes that speculative investors, including hedge funds and CTAs, sold approximately $2.2 billion in silver futures over the three weeks ending October 13.
Their net long exposure has reportedly fallen to about $1.7 billion, the lowest level in at least two years.
For comparison, that positioning was around $8.5 billion in December 2025.
So the chart and positioning data point in the same direction: investors have aggressively reduced bullish exposure and increased bearish bets.
Kobeissi’s conclusion is straightforward: sentiment toward silver is now extremely bearish.
That does not automatically mean silver is ready to rally.
The short silver trade is becoming crowded. Silver’s 3-month silver put-call skew is up to -3 points, its highest level since early July. This metric measures the relative cost of put options to call options and is up +10 points over the last 4 weeks, signaling growing demand for bearish bets on silver prices. Over the last 12 months, this metric has been higher only 2% of the time. Meanwhile, speculative investors, including hedge funds and commodity trading advisers (CTAs), sold -$2.2 billion in silver futures over the 3 weeks ending October 13th. As a result, their net long positioning is down to just +$1.7 billion, the lowest in at least 2 years. For perspective, this metric stood at +$8.5 billion in December 2025. Investors are extremely bearish on silver.
— The Kobeissi Letter (@KobeissiLetter) October 24, 2026
But crowded positioning can become important because once a large part of the market is already positioned for lower prices, there may be fewer new sellers left to push the move.
If silver unexpectedly starts rising, shorts can also be forced to cover, adding additional buying pressure.
Read also: Here’s Why Gold and Silver Prices Are Getting Wrecked Right Now
Silver Price Chart Is Now Deeply Stretched
The four-hour silver chart I analyzed shows XAG/USD around $53.90 after falling from roughly $70 in late August.
The structure remains bearish.
Silver has produced a clear sequence of lower highs and lower lows, and the latest move has taken price below the $55 area that previously acted as support.
RSI is around 28.4, with its average near 34.
That puts silver in oversold territory.
Source: TradingView
This fits well with Kobeissi’s positioning data.
We now have two signs of an extended market at the same time: price momentum is deeply weak, and bearish positioning is becoming unusually crowded.
The first support area I would watch is roughly $53-$54.
If that region holds, a relief move toward $55-$56 becomes realistic.
Above there, $57-$58 would be the next important recovery zone.
The bearish scenario remains simple.
A decisive break below $53 could expose approximately $52, followed by the psychological $50 level.
Silver Price Prediction: Can Crowded Shorts Trigger a Bounce?
My base case is that silver is getting close to an area where a short-term rebound becomes likely, but there is not enough evidence yet to call a durable bottom.
Scenario Silver price outlook Bullish rebound Hold $53-$54 → $55-$56 → $57-$58 Base case $53-$56 consolidation Bearish continuation Lose $53 → $52 → $50
The interesting part is that the technical and positioning signals are now starting to align.
Silver is oversold on the four-hour chart, and Kobeissi’s data shows investors are already heavily positioned for more downside.
That makes chasing the selloff risky.
For now, $53 is the level I would watch most closely.
If buyers defend it and silver moves back above $55, the crowded short trade could become fuel for a stronger relief rally.
If $53 fails, however, sentiment alone will not save the market, and $50 could quickly become the next major target.
For more financial news and price predictions, click here.
Subscribe to our YouTube channel for daily crypto updates, market insights, and expert analysis.
The post Silver Price Prediction: Silver Shorts Reach an Extreme as XAG Tests $54 appeared first on CaptainAltcoin.
Silver Price Prediction: Silver Shorts Reach an Extreme As XAG Tests $54
Silver price sentiment has deteriorated dramatically, but the bearish trade may now be getting crowded enough to create conditions for a big countertrend move.
The Kobeissi Letter points to silver’s three-month put-call skew, which has risen to around -3 points, its highest level since early July.
Kobeissi says the metric has increased by roughly 10 points over the past four weeks, which shows stronger demand for bearish silver positions.
Even more striking, the reading has been higher only about 2% of the time over the past 12 months.
That tells us positioning has moved toward an extreme.
Kobeissi Says Investors Are Extremely Bearish on Silver
The options market is only one part of the story.
Kobeissi also notes that speculative investors, including hedge funds and CTAs, sold approximately $2.2 billion in silver futures over the three weeks ending October 13.
Their net long exposure has reportedly fallen to about $1.7 billion, the lowest level in at least two years.
For comparison, that positioning was around $8.5 billion in December 2025.
So the chart and positioning data point in the same direction: investors have aggressively reduced bullish exposure and increased bearish bets.
Kobeissi’s conclusion is straightforward: sentiment toward silver is now extremely bearish.
That does not automatically mean silver is ready to rally.
The short silver trade is becoming crowded. Silver’s 3-month silver put-call skew is up to -3 points, its highest level since early July. This metric measures the relative cost of put options to call options and is up +10 points over the last 4 weeks, signaling growing demand for bearish bets on silver prices. Over the last 12 months, this metric has been higher only 2% of the time. Meanwhile, speculative investors, including hedge funds and commodity trading advisers (CTAs), sold -$2.2 billion in silver futures over the 3 weeks ending October 13th. As a result, their net long positioning is down to just +$1.7 billion, the lowest in at least 2 years. For perspective, this metric stood at +$8.5 billion in December 2025. Investors are extremely bearish on silver.
— The Kobeissi Letter (@KobeissiLetter) October 24, 2026
But crowded positioning can become important because once a large part of the market is already positioned for lower prices, there may be fewer new sellers left to push the move.
If silver unexpectedly starts rising, shorts can also be forced to cover, adding additional buying pressure.
Read also: Here’s Why Gold and Silver Prices Are Getting Wrecked Right Now
Silver Price Chart Is Now Deeply Stretched
The four-hour silver chart I analyzed shows XAG/USD around $53.90 after falling from roughly $70 in late August.
The structure remains bearish.
Silver has produced a clear sequence of lower highs and lower lows, and the latest move has taken price below the $55 area that previously acted as support.
RSI is around 28.4, with its average near 34.
That puts silver in oversold territory.
Source: TradingView
This fits well with Kobeissi’s positioning data.
We now have two signs of an extended market at the same time: price momentum is deeply weak, and bearish positioning is becoming unusually crowded.
The first support area I would watch is roughly $53-$54.
If that region holds, a relief move toward $55-$56 becomes realistic.
Above there, $57-$58 would be the next important recovery zone.
The bearish scenario remains simple.
A decisive break below $53 could expose approximately $52, followed by the psychological $50 level.
Silver Price Prediction: Can Crowded Shorts Trigger a Bounce?
My base case is that silver is getting close to an area where a short-term rebound becomes likely, but there is not enough evidence yet to call a durable bottom.
Scenario Silver price outlook Bullish rebound Hold $53-$54 → $55-$56 → $57-$58 Base case $53-$56 consolidation Bearish continuation Lose $53 → $52 → $50
The interesting part is that the technical and positioning signals are now starting to align.
Silver is oversold on the four-hour chart, and Kobeissi’s data shows investors are already heavily positioned for more downside.
That makes chasing the selloff risky.
For now, $53 is the level I would watch most closely.
If buyers defend it and silver moves back above $55, the crowded short trade could become fuel for a stronger relief rally.
If $53 fails, however, sentiment alone will not save the market, and $50 could quickly become the next major target.
For more financial news and price predictions, click here.
Subscribe to our YouTube channel for daily crypto updates, market insights, and expert analysis.
The post Silver Price Prediction: Silver Shorts Reach an Extreme as XAG Tests $54 appeared first on CaptainAltcoin.
The Kobeissi Letter points to silver’s three-month put-call skew, which has risen to around -3 points, its highest level since early July.
Kobeissi says the metric has increased by roughly 10 points over the past four weeks, which shows stronger demand for bearish silver positions.
Even more striking, the reading has been higher only about 2% of the time over the past 12 months.
That tells us positioning has moved toward an extreme.
Kobeissi Says Investors Are Extremely Bearish on Silver
The options market is only one part of the story.
Kobeissi also notes that speculative investors, including hedge funds and CTAs, sold approximately $2.2 billion in silver futures over the three weeks ending October 13.
Their net long exposure has reportedly fallen to about $1.7 billion, the lowest level in at least two years.
For comparison, that positioning was around $8.5 billion in December 2025.
So the chart and positioning data point in the same direction: investors have aggressively reduced bullish exposure and increased bearish bets.
Kobeissi’s conclusion is straightforward: sentiment toward silver is now extremely bearish.
That does not automatically mean silver is ready to rally.
The short silver trade is becoming crowded. Silver’s 3-month silver put-call skew is up to -3 points, its highest level since early July. This metric measures the relative cost of put options to call options and is up +10 points over the last 4 weeks, signaling growing demand for bearish bets on silver prices. Over the last 12 months, this metric has been higher only 2% of the time. Meanwhile, speculative investors, including hedge funds and commodity trading advisers (CTAs), sold -$2.2 billion in silver futures over the 3 weeks ending October 13th. As a result, their net long positioning is down to just +$1.7 billion, the lowest in at least 2 years. For perspective, this metric stood at +$8.5 billion in December 2025. Investors are extremely bearish on silver.
— The Kobeissi Letter (@KobeissiLetter) October 24, 2026
But crowded positioning can become important because once a large part of the market is already positioned for lower prices, there may be fewer new sellers left to push the move.
If silver unexpectedly starts rising, shorts can also be forced to cover, adding additional buying pressure.
Read also: Here’s Why Gold and Silver Prices Are Getting Wrecked Right Now
Silver Price Chart Is Now Deeply Stretched
The four-hour silver chart I analyzed shows XAG/USD around $53.90 after falling from roughly $70 in late August.
The structure remains bearish.
Silver has produced a clear sequence of lower highs and lower lows, and the latest move has taken price below the $55 area that previously acted as support.
RSI is around 28.4, with its average near 34.
That puts silver in oversold territory.
Source: TradingView
This fits well with Kobeissi’s positioning data.
We now have two signs of an extended market at the same time: price momentum is deeply weak, and bearish positioning is becoming unusually crowded.
The first support area I would watch is roughly $53-$54.
If that region holds, a relief move toward $55-$56 becomes realistic.
Above there, $57-$58 would be the next important recovery zone.
The bearish scenario remains simple.
A decisive break below $53 could expose approximately $52, followed by the psychological $50 level.
Silver Price Prediction: Can Crowded Shorts Trigger a Bounce?
My base case is that silver is getting close to an area where a short-term rebound becomes likely, but there is not enough evidence yet to call a durable bottom.
Scenario Silver price outlook Bullish rebound Hold $53-$54 → $55-$56 → $57-$58 Base case $53-$56 consolidation Bearish continuation Lose $53 → $52 → $50
The interesting part is that the technical and positioning signals are now starting to align.
Silver is oversold on the four-hour chart, and Kobeissi’s data shows investors are already heavily positioned for more downside.
That makes chasing the selloff risky.
For now, $53 is the level I would watch most closely.
If buyers defend it and silver moves back above $55, the crowded short trade could become fuel for a stronger relief rally.
If $53 fails, however, sentiment alone will not save the market, and $50 could quickly become the next major target.
For more financial news and price predictions, click here.
Subscribe to our YouTube channel for daily crypto updates, market insights, and expert analysis.
The post Silver Price Prediction: Silver Shorts Reach an Extreme as XAG Tests $54 appeared first on CaptainAltcoin.
395
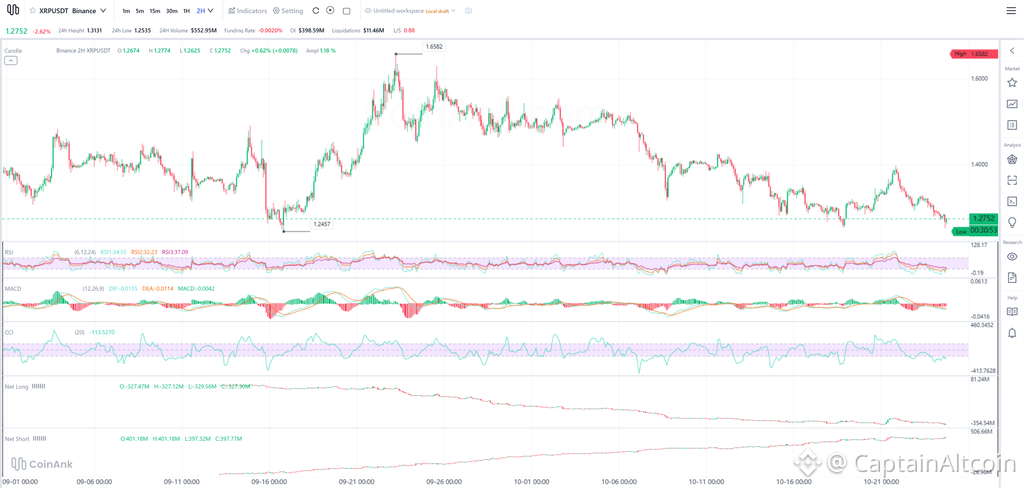
Article
Here’s Where XRP Price Could Go Next Week!XRP price enters the final week of October under pressure after failing to hold its latest recovery.
The token briefly rallied toward $1.39 earlier this week, but that move was rejected and XRP has since slipped back toward $1.27-$1.28. The broader crypto market has also weakened as oil remains elevated, ETF flows turn mixed and traders prepare for the Federal Reserve’s October 28 meeting.
That makes the October 26-November 1 period especially important for XRP.
The chart is weak in the short term, but several indicators are approaching levels where a relief bounce becomes possible.
XRP Price Has Returned to a Key Support Area
I had a look at the Binance XRP/USDT two-hour chart, and the structure has clearly deteriorated since the recent peak near $1.66.
XRP is currently around $1.275 after trading as low as roughly $1.253 over the latest 24-hour period.
The most important short-term zone is therefore $1.25-$1.27.
That area has already attracted buyers several times since September, making it the clearest support on the current chart.
Source: CoinAnk
If XRP loses $1.25 decisively, the next downside area I would watch is around $1.20-$1.22.
On the upside, $1.30 becomes the first recovery level.
Above there, the XRP price would need to reclaim roughly $1.33-$1.35 before the chart begins looking materially healthier.
The larger resistance zone remains around $1.38-$1.40, where the latest rebound failed.
Indicators Show Weak Momentum, but Selling Is Getting Stretched
The indicators remain bearish overall.
Short RSI is around 34.6, the medium reading roughly 32.2 and the longer RSI near 37.1.
That places momentum close to oversold territory, particularly on the faster settings.
This is important because XRP is no longer falling from neutral momentum. Selling has already pushed the market into a much weaker technical condition, increasing the probability of a short-term rebound if support holds.
MACD remains negative.
The DIF is around -0.0135 versus DEA near -0.0114, with the histogram also below zero at approximately -0.0042.
That tells me sellers still control momentum.
CCI near -113.5 reinforces the same idea. XRP is weak, but increasingly stretched.
The positioning data is also interesting.
Net longs are around negative $328 million, with net shorts close to $398 million.
That leaves considerable bearish positioning in the market. If XRP begins moving back above $1.30-$1.33, some of those positions could start adding fuel to a recovery.
Read also: XRP Price Forecasted to Reach (Only) $1.80 This Year: Kalshi Traders
Several Events Could Move XRP Next Week
The technical setup matters, but next week also contains several important catalysts.
The Federal Reserve announces its next rate decision on October 28.
Crypto has been under pressure from high oil prices, restrictive financial conditions and uncertainty around another potential rate increase later this year. Brent has remained above $110, keeping inflation concerns elevated.
A more dovish Fed message would likely help Bitcoin and altcoins, including XRP.
A hawkish message could do the opposite.
XRP also has its own catalysts.
Ripple’s Swell conference runs from October 27 to 29 in New York, creating the possibility of new partnership or institutional announcements.
Spot XRP ETF flows have also started improving again. Recent data showed roughly $3.55 million of inflows on October 22, taking that week’s total to around $4.25 million before the final weekly print.
Then comes November 1, when another 1 billion XRP becomes eligible for release from Ripple’s escrow.
That does not mean all 1 billion tokens will immediately enter circulation, but the event can still affect sentiment around supply.
XRP Price Prediction for October 26-November 1
For me, the entire weekly setup revolves around whether XRP can defend $1.25.
If that level holds and macro conditions improve, a rebound toward $1.30-$1.35 looks realistic.
A stronger recovery above $1.35 would put $1.38-$1.40 back in play.
If $1.25 breaks, however, the chart opens the door toward $1.20-$1.22.
Scenario XRP price range Bullish $1.35-$1.42 Base case $1.24-$1.35 Bearish $1.18-$1.24
My base case for next week is XRP trading mostly between $1.24 and $1.35.
The indicators are weak enough that another decline cannot be ruled out, but RSI and CCI are also getting stretched enough to make a relief bounce increasingly plausible.
The most important levels are simple: $1.25 below and $1.35 above.
Whichever one breaks first could define XRP’s direction into early November.
For more crypto news and price predictions, click here.
Subscribe to our YouTube channel for daily crypto updates, market insights, and expert analysis.
The post Here’s Where XRP Price Could Go Next Week! appeared first on CaptainAltcoin.
Here’s Where XRP Price Could Go Next Week!
XRP price enters the final week of October under pressure after failing to hold its latest recovery.
The token briefly rallied toward $1.39 earlier this week, but that move was rejected and XRP has since slipped back toward $1.27-$1.28. The broader crypto market has also weakened as oil remains elevated, ETF flows turn mixed and traders prepare for the Federal Reserve’s October 28 meeting.
That makes the October 26-November 1 period especially important for XRP.
The chart is weak in the short term, but several indicators are approaching levels where a relief bounce becomes possible.
XRP Price Has Returned to a Key Support Area
I had a look at the Binance XRP/USDT two-hour chart, and the structure has clearly deteriorated since the recent peak near $1.66.
XRP is currently around $1.275 after trading as low as roughly $1.253 over the latest 24-hour period.
The most important short-term zone is therefore $1.25-$1.27.
That area has already attracted buyers several times since September, making it the clearest support on the current chart.
Source: CoinAnk
If XRP loses $1.25 decisively, the next downside area I would watch is around $1.20-$1.22.
On the upside, $1.30 becomes the first recovery level.
Above there, the XRP price would need to reclaim roughly $1.33-$1.35 before the chart begins looking materially healthier.
The larger resistance zone remains around $1.38-$1.40, where the latest rebound failed.
Indicators Show Weak Momentum, but Selling Is Getting Stretched
The indicators remain bearish overall.
Short RSI is around 34.6, the medium reading roughly 32.2 and the longer RSI near 37.1.
That places momentum close to oversold territory, particularly on the faster settings.
This is important because XRP is no longer falling from neutral momentum. Selling has already pushed the market into a much weaker technical condition, increasing the probability of a short-term rebound if support holds.
MACD remains negative.
The DIF is around -0.0135 versus DEA near -0.0114, with the histogram also below zero at approximately -0.0042.
That tells me sellers still control momentum.
CCI near -113.5 reinforces the same idea. XRP is weak, but increasingly stretched.
The positioning data is also interesting.
Net longs are around negative $328 million, with net shorts close to $398 million.
That leaves considerable bearish positioning in the market. If XRP begins moving back above $1.30-$1.33, some of those positions could start adding fuel to a recovery.
Read also: XRP Price Forecasted to Reach (Only) $1.80 This Year: Kalshi Traders
Several Events Could Move XRP Next Week
The technical setup matters, but next week also contains several important catalysts.
The Federal Reserve announces its next rate decision on October 28.
Crypto has been under pressure from high oil prices, restrictive financial conditions and uncertainty around another potential rate increase later this year. Brent has remained above $110, keeping inflation concerns elevated.
A more dovish Fed message would likely help Bitcoin and altcoins, including XRP.
A hawkish message could do the opposite.
XRP also has its own catalysts.
Ripple’s Swell conference runs from October 27 to 29 in New York, creating the possibility of new partnership or institutional announcements.
Spot XRP ETF flows have also started improving again. Recent data showed roughly $3.55 million of inflows on October 22, taking that week’s total to around $4.25 million before the final weekly print.
Then comes November 1, when another 1 billion XRP becomes eligible for release from Ripple’s escrow.
That does not mean all 1 billion tokens will immediately enter circulation, but the event can still affect sentiment around supply.
XRP Price Prediction for October 26-November 1
For me, the entire weekly setup revolves around whether XRP can defend $1.25.
If that level holds and macro conditions improve, a rebound toward $1.30-$1.35 looks realistic.
A stronger recovery above $1.35 would put $1.38-$1.40 back in play.
If $1.25 breaks, however, the chart opens the door toward $1.20-$1.22.
Scenario XRP price range Bullish $1.35-$1.42 Base case $1.24-$1.35 Bearish $1.18-$1.24
My base case for next week is XRP trading mostly between $1.24 and $1.35.
The indicators are weak enough that another decline cannot be ruled out, but RSI and CCI are also getting stretched enough to make a relief bounce increasingly plausible.
The most important levels are simple: $1.25 below and $1.35 above.
Whichever one breaks first could define XRP’s direction into early November.
For more crypto news and price predictions, click here.
Subscribe to our YouTube channel for daily crypto updates, market insights, and expert analysis.
The post Here’s Where XRP Price Could Go Next Week! appeared first on CaptainAltcoin.
The token briefly rallied toward $1.39 earlier this week, but that move was rejected and XRP has since slipped back toward $1.27-$1.28. The broader crypto market has also weakened as oil remains elevated, ETF flows turn mixed and traders prepare for the Federal Reserve’s October 28 meeting.
That makes the October 26-November 1 period especially important for XRP.
The chart is weak in the short term, but several indicators are approaching levels where a relief bounce becomes possible.
XRP Price Has Returned to a Key Support Area
I had a look at the Binance XRP/USDT two-hour chart, and the structure has clearly deteriorated since the recent peak near $1.66.
XRP is currently around $1.275 after trading as low as roughly $1.253 over the latest 24-hour period.
The most important short-term zone is therefore $1.25-$1.27.
That area has already attracted buyers several times since September, making it the clearest support on the current chart.
Source: CoinAnk
If XRP loses $1.25 decisively, the next downside area I would watch is around $1.20-$1.22.
On the upside, $1.30 becomes the first recovery level.
Above there, the XRP price would need to reclaim roughly $1.33-$1.35 before the chart begins looking materially healthier.
The larger resistance zone remains around $1.38-$1.40, where the latest rebound failed.
Indicators Show Weak Momentum, but Selling Is Getting Stretched
The indicators remain bearish overall.
Short RSI is around 34.6, the medium reading roughly 32.2 and the longer RSI near 37.1.
That places momentum close to oversold territory, particularly on the faster settings.
This is important because XRP is no longer falling from neutral momentum. Selling has already pushed the market into a much weaker technical condition, increasing the probability of a short-term rebound if support holds.
MACD remains negative.
The DIF is around -0.0135 versus DEA near -0.0114, with the histogram also below zero at approximately -0.0042.
That tells me sellers still control momentum.
CCI near -113.5 reinforces the same idea. XRP is weak, but increasingly stretched.
The positioning data is also interesting.
Net longs are around negative $328 million, with net shorts close to $398 million.
That leaves considerable bearish positioning in the market. If XRP begins moving back above $1.30-$1.33, some of those positions could start adding fuel to a recovery.
Read also: XRP Price Forecasted to Reach (Only) $1.80 This Year: Kalshi Traders
Several Events Could Move XRP Next Week
The technical setup matters, but next week also contains several important catalysts.
The Federal Reserve announces its next rate decision on October 28.
Crypto has been under pressure from high oil prices, restrictive financial conditions and uncertainty around another potential rate increase later this year. Brent has remained above $110, keeping inflation concerns elevated.
A more dovish Fed message would likely help Bitcoin and altcoins, including XRP.
A hawkish message could do the opposite.
XRP also has its own catalysts.
Ripple’s Swell conference runs from October 27 to 29 in New York, creating the possibility of new partnership or institutional announcements.
Spot XRP ETF flows have also started improving again. Recent data showed roughly $3.55 million of inflows on October 22, taking that week’s total to around $4.25 million before the final weekly print.
Then comes November 1, when another 1 billion XRP becomes eligible for release from Ripple’s escrow.
That does not mean all 1 billion tokens will immediately enter circulation, but the event can still affect sentiment around supply.
XRP Price Prediction for October 26-November 1
For me, the entire weekly setup revolves around whether XRP can defend $1.25.
If that level holds and macro conditions improve, a rebound toward $1.30-$1.35 looks realistic.
A stronger recovery above $1.35 would put $1.38-$1.40 back in play.
If $1.25 breaks, however, the chart opens the door toward $1.20-$1.22.
Scenario XRP price range Bullish $1.35-$1.42 Base case $1.24-$1.35 Bearish $1.18-$1.24
My base case for next week is XRP trading mostly between $1.24 and $1.35.
The indicators are weak enough that another decline cannot be ruled out, but RSI and CCI are also getting stretched enough to make a relief bounce increasingly plausible.
The most important levels are simple: $1.25 below and $1.35 above.
Whichever one breaks first could define XRP’s direction into early November.
For more crypto news and price predictions, click here.
Subscribe to our YouTube channel for daily crypto updates, market insights, and expert analysis.
The post Here’s Where XRP Price Could Go Next Week! appeared first on CaptainAltcoin.
221
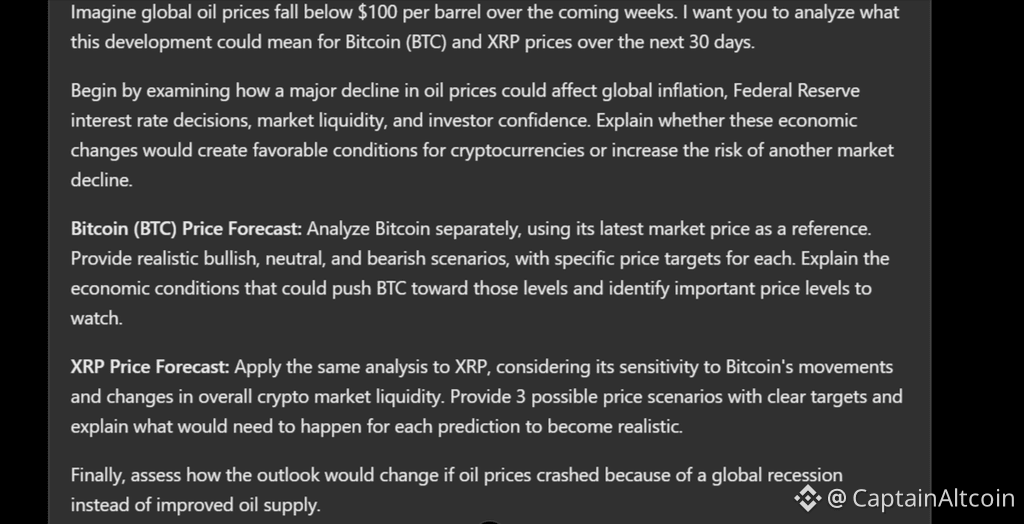
Article
ChatGPT Predicts Bitcoin and XRP Price If Oil Crashes Below $100A major drop in global oil prices could change the outlook for Bitcoin and XRP over the coming weeks. Oil falling below $100 per barrel could ease inflation pressure, improve expectations for interest rate cuts, and create better conditions for cryptocurrencies to recover.
However, there is another possibility worth considering. A sudden oil price crash could also indicate serious problems in the global economy, which would make things more difficult for Bitcoin and XRP.
We asked ChatGPT to examine both possibilities and predict where BTC and XRP prices could go over the next 30 days if oil crashes below $100.
Why Oil Falling Below $100 Could Change the Crypto Setup
Oil prices affect much more than the amount consumers pay for petrol. They influence transportation costs, manufacturing expenses, inflation, and even decisions made by the Federal Reserve.
When oil becomes cheaper, businesses generally spend less money transporting goods and producing everyday products. These lower costs can eventually reduce inflation pressure across the economy.
That matters because the Federal Reserve considers inflation when deciding whether to raise, maintain, or cut interest rates.
Lower inflation could give the Fed more room to reduce borrowing costs. Such a decision could encourage investment in assets like Bitcoin, XRP, and other cryptocurrencies.
The process is relatively straightforward:
Cheaper oil can reduce transportation and production costs.
Lower costs can help bring inflation down.
Cooling inflation can increase the possibility of interest rate cuts.
Lower interest rates can encourage investors to take more risks.
Increased investment demand could support Bitcoin and XRP prices.
However, the $100 level is not an automatic trigger for a crypto rally. The reason oil falls below that price is equally important.
If oil becomes cheaper because production increases and supply problems improve, cryptocurrencies could benefit from a healthier economic environment.
A different outcome becomes possible if oil crashes because businesses are struggling and global demand is weakening. Such conditions could increase recession fears and encourage investors to sell risky assets, including cryptocurrencies.
That distinction is important when considering ChatGPT’s Bitcoin and XRP price predictions.
The Prompt We Gave ChatGPT
We asked ChatGPT to examine how Bitcoin and XRP might perform over the next 30 days if global oil prices fall below $100 per barrel.
The prompt focused on inflation, Federal Reserve interest rate decisions, investor confidence, and liquidity in the cryptocurrency market.
We also requested separate bullish, neutral, and bearish price predictions for BTC and XRP, with specific price targets and explanations for each scenario.
Prompt Snapshot
The analysis considered whether cheaper oil could support a crypto recovery or create additional selling pressure if the decline came from a global economic recession.
ChatGPT’s Bitcoin Price Prediction
Bitcoin could benefit from oil prices falling below $100, especially if the decline helps reduce inflation and increases the possibility of Federal Reserve interest rate cuts.
ChatGPT’s analysis points to a possible recovery over the next 30 days, although the outcome depends heavily on why oil prices are falling.
The bullish scenario assumes that cheaper oil comes from improved global supply conditions rather than a weakening economy. Lower inflation could encourage the Federal Reserve to consider interest rate cuts, which may improve demand for risky assets.
Under these conditions, ChatGPT predicts that Bitcoin could recover toward $88,000 to $92,000. Such a move would represent an increase of approximately 9% to 14% from the assumed starting price of $81,000.
However, the recovery would likely require Bitcoin to reclaim the $84,000 level and maintain enough buying pressure to continue higher.
The neutral scenario is also worth considering. Oil prices could fall below $100 without producing an immediate change in Federal Reserve policy.
This could leave Bitcoin trading between $78,000 and $85,000 over the next 30 days. Investors may remain cautious as they wait for clearer evidence that inflation is cooling and economic conditions are improving.
The bearish scenario becomes more likely if oil crashes because of a serious decline in global demand. Recession concerns could force investors to reduce their exposure to cryptocurrencies, even if energy prices become cheaper.
ChatGPT estimates that Bitcoin could decline toward $72,000 to $76,000 under those conditions. A breakdown below $78,000 could increase the risk of a deeper correction.
The table below summarizes ChatGPT’s conditional Bitcoin price predictions.
Scenario BTC Price Prediction Expected Market Conditions Bullish $88,000 to $92,000 Lower inflation, improving liquidity, stronger demand Neutral $78,000 to $85,000 Limited economic improvement, cautious Fed Bearish $72,000 to $76,000 Recession fears, weaker demand, crypto selloff
These estimates assume Bitcoin starts near $81,000 and cover the next 30 days.
ChatGPT’s XRP Price Prediction
XRP could record a stronger percentage recovery than Bitcoin if falling oil prices improve conditions across the cryptocurrency market.
The reason is that altcoins can sometimes outperform Bitcoin when investors become more confident and begin putting additional money into riskier cryptocurrencies.
ChatGPT’s bullish prediction places XRP between $1.45 and $1.60 over the next 30 days, compared with the assumed starting price of $1.29.
That would represent a potential recovery of approximately 12% to 24%.
The bullish prediction depends on several conditions:
Oil prices fall because of improved supply rather than a global recession.
Inflation continues to cool and expectations for interest rate cuts improve.
Bitcoin recovers and creates better conditions for altcoins.
XRP attracts enough demand to sustain a recovery above $1.40.
However, XRP may not immediately benefit from cheaper oil if the wider cryptocurrency market remains uncertain.
Read Also: EUR/USD Price Prediction: Analyst Warns of More Downside Before a Rebound
ChatGPT’s neutral scenario places XRP between $1.20 and $1.40. This assumes inflation concerns ease somewhat, but investors remain hesitant to increase their exposure to altcoins.
The bearish scenario becomes relevant if oil crashes because of a weakening global economy.
Such conditions could reduce demand for speculative assets and put XRP under additional selling pressure.
ChatGPT predicts that XRP could decline toward $1 to $1.15 if recession concerns worsen and Bitcoin experiences another major correction.
XRP’s ability to defend the $1.20 area would therefore become important under this scenario. A sustained breakdown could leave the token vulnerable to further losses.
The table below summarizes the XRP price predictions under the different economic scenarios.
Scenario XRP Price Prediction Expected Market Conditions Bullish $1.45 to $1.60 Improving liquidity, BTC recovery, stronger altcoin demand Neutral $1.20 to $1.40 Limited investment demand, uncertain Fed policy Bearish $1 to $1.15 Global recession fears, crypto market weakness
These estimates assume XRP starts near $1.29 and cover the next 30 days.
What Could Ruin the Bullish Scenario
The biggest risk to these Bitcoin and XRP price predictions is a global recession.
Oil prices could fall below $100 because factories are producing fewer goods, consumers are spending less, and businesses are reducing their energy consumption.
Such a situation would create a difficult environment for cryptocurrencies, even if inflation begins to decline.
Another concern is that the Federal Reserve may not reduce interest rates as quickly as investors expect. Lower oil prices can help reduce inflation, but housing costs, wages, and other economic factors also influence monetary policy.
Bitcoin and XRP could therefore remain under pressure even after oil becomes cheaper.
Ultimately, ChatGPT’s predictions point to 2 possible outcomes. Cheaper oil could help Bitcoin recover toward $92,000 and XRP toward $1.60 if economic conditions improve.
FAQs
How many BTC tokens are there?
There are approximately 20 million Bitcoin in circulation. The total maximum supply is hard-coded at 21 million. More than 95% of all Bitcoin has already been mined, and the final coin is expected to be minted around the year 2140
How much will 1 XRP be worth in 2030?
By 2030, standard institutional and algorithmic forecasts generally project 1 XRP to be worth between $1.50 and $5.50, while more bullish mainstream financial analysts place a realistic target range of $5.00 to $10.00.
Subscribe to our YouTube channel for daily crypto updates, market insights, and expert analysis.
The post ChatGPT Predicts Bitcoin and XRP Price If Oil Crashes Below $100 appeared first on CaptainAltcoin.
ChatGPT Predicts Bitcoin and XRP Price If Oil Crashes Below $100
A major drop in global oil prices could change the outlook for Bitcoin and XRP over the coming weeks. Oil falling below $100 per barrel could ease inflation pressure, improve expectations for interest rate cuts, and create better conditions for cryptocurrencies to recover.
However, there is another possibility worth considering. A sudden oil price crash could also indicate serious problems in the global economy, which would make things more difficult for Bitcoin and XRP.
We asked ChatGPT to examine both possibilities and predict where BTC and XRP prices could go over the next 30 days if oil crashes below $100.
Why Oil Falling Below $100 Could Change the Crypto Setup
Oil prices affect much more than the amount consumers pay for petrol. They influence transportation costs, manufacturing expenses, inflation, and even decisions made by the Federal Reserve.
When oil becomes cheaper, businesses generally spend less money transporting goods and producing everyday products. These lower costs can eventually reduce inflation pressure across the economy.
That matters because the Federal Reserve considers inflation when deciding whether to raise, maintain, or cut interest rates.
Lower inflation could give the Fed more room to reduce borrowing costs. Such a decision could encourage investment in assets like Bitcoin, XRP, and other cryptocurrencies.
The process is relatively straightforward:
Cheaper oil can reduce transportation and production costs.
Lower costs can help bring inflation down.
Cooling inflation can increase the possibility of interest rate cuts.
Lower interest rates can encourage investors to take more risks.
Increased investment demand could support Bitcoin and XRP prices.
However, the $100 level is not an automatic trigger for a crypto rally. The reason oil falls below that price is equally important.
If oil becomes cheaper because production increases and supply problems improve, cryptocurrencies could benefit from a healthier economic environment.
A different outcome becomes possible if oil crashes because businesses are struggling and global demand is weakening. Such conditions could increase recession fears and encourage investors to sell risky assets, including cryptocurrencies.
That distinction is important when considering ChatGPT’s Bitcoin and XRP price predictions.
The Prompt We Gave ChatGPT
We asked ChatGPT to examine how Bitcoin and XRP might perform over the next 30 days if global oil prices fall below $100 per barrel.
The prompt focused on inflation, Federal Reserve interest rate decisions, investor confidence, and liquidity in the cryptocurrency market.
We also requested separate bullish, neutral, and bearish price predictions for BTC and XRP, with specific price targets and explanations for each scenario.
Prompt Snapshot
The analysis considered whether cheaper oil could support a crypto recovery or create additional selling pressure if the decline came from a global economic recession.
ChatGPT’s Bitcoin Price Prediction
Bitcoin could benefit from oil prices falling below $100, especially if the decline helps reduce inflation and increases the possibility of Federal Reserve interest rate cuts.
ChatGPT’s analysis points to a possible recovery over the next 30 days, although the outcome depends heavily on why oil prices are falling.
The bullish scenario assumes that cheaper oil comes from improved global supply conditions rather than a weakening economy. Lower inflation could encourage the Federal Reserve to consider interest rate cuts, which may improve demand for risky assets.
Under these conditions, ChatGPT predicts that Bitcoin could recover toward $88,000 to $92,000. Such a move would represent an increase of approximately 9% to 14% from the assumed starting price of $81,000.
However, the recovery would likely require Bitcoin to reclaim the $84,000 level and maintain enough buying pressure to continue higher.
The neutral scenario is also worth considering. Oil prices could fall below $100 without producing an immediate change in Federal Reserve policy.
This could leave Bitcoin trading between $78,000 and $85,000 over the next 30 days. Investors may remain cautious as they wait for clearer evidence that inflation is cooling and economic conditions are improving.
The bearish scenario becomes more likely if oil crashes because of a serious decline in global demand. Recession concerns could force investors to reduce their exposure to cryptocurrencies, even if energy prices become cheaper.
ChatGPT estimates that Bitcoin could decline toward $72,000 to $76,000 under those conditions. A breakdown below $78,000 could increase the risk of a deeper correction.
The table below summarizes ChatGPT’s conditional Bitcoin price predictions.
Scenario BTC Price Prediction Expected Market Conditions Bullish $88,000 to $92,000 Lower inflation, improving liquidity, stronger demand Neutral $78,000 to $85,000 Limited economic improvement, cautious Fed Bearish $72,000 to $76,000 Recession fears, weaker demand, crypto selloff
These estimates assume Bitcoin starts near $81,000 and cover the next 30 days.
ChatGPT’s XRP Price Prediction
XRP could record a stronger percentage recovery than Bitcoin if falling oil prices improve conditions across the cryptocurrency market.
The reason is that altcoins can sometimes outperform Bitcoin when investors become more confident and begin putting additional money into riskier cryptocurrencies.
ChatGPT’s bullish prediction places XRP between $1.45 and $1.60 over the next 30 days, compared with the assumed starting price of $1.29.
That would represent a potential recovery of approximately 12% to 24%.
The bullish prediction depends on several conditions:
Oil prices fall because of improved supply rather than a global recession.
Inflation continues to cool and expectations for interest rate cuts improve.
Bitcoin recovers and creates better conditions for altcoins.
XRP attracts enough demand to sustain a recovery above $1.40.
However, XRP may not immediately benefit from cheaper oil if the wider cryptocurrency market remains uncertain.
Read Also: EUR/USD Price Prediction: Analyst Warns of More Downside Before a Rebound
ChatGPT’s neutral scenario places XRP between $1.20 and $1.40. This assumes inflation concerns ease somewhat, but investors remain hesitant to increase their exposure to altcoins.
The bearish scenario becomes relevant if oil crashes because of a weakening global economy.
Such conditions could reduce demand for speculative assets and put XRP under additional selling pressure.
ChatGPT predicts that XRP could decline toward $1 to $1.15 if recession concerns worsen and Bitcoin experiences another major correction.
XRP’s ability to defend the $1.20 area would therefore become important under this scenario. A sustained breakdown could leave the token vulnerable to further losses.
The table below summarizes the XRP price predictions under the different economic scenarios.
Scenario XRP Price Prediction Expected Market Conditions Bullish $1.45 to $1.60 Improving liquidity, BTC recovery, stronger altcoin demand Neutral $1.20 to $1.40 Limited investment demand, uncertain Fed policy Bearish $1 to $1.15 Global recession fears, crypto market weakness
These estimates assume XRP starts near $1.29 and cover the next 30 days.
What Could Ruin the Bullish Scenario
The biggest risk to these Bitcoin and XRP price predictions is a global recession.
Oil prices could fall below $100 because factories are producing fewer goods, consumers are spending less, and businesses are reducing their energy consumption.
Such a situation would create a difficult environment for cryptocurrencies, even if inflation begins to decline.
Another concern is that the Federal Reserve may not reduce interest rates as quickly as investors expect. Lower oil prices can help reduce inflation, but housing costs, wages, and other economic factors also influence monetary policy.
Bitcoin and XRP could therefore remain under pressure even after oil becomes cheaper.
Ultimately, ChatGPT’s predictions point to 2 possible outcomes. Cheaper oil could help Bitcoin recover toward $92,000 and XRP toward $1.60 if economic conditions improve.
FAQs
How many BTC tokens are there?
There are approximately 20 million Bitcoin in circulation. The total maximum supply is hard-coded at 21 million. More than 95% of all Bitcoin has already been mined, and the final coin is expected to be minted around the year 2140
How much will 1 XRP be worth in 2030?
By 2030, standard institutional and algorithmic forecasts generally project 1 XRP to be worth between $1.50 and $5.50, while more bullish mainstream financial analysts place a realistic target range of $5.00 to $10.00.
Subscribe to our YouTube channel for daily crypto updates, market insights, and expert analysis.
The post ChatGPT Predicts Bitcoin and XRP Price If Oil Crashes Below $100 appeared first on CaptainAltcoin.
However, there is another possibility worth considering. A sudden oil price crash could also indicate serious problems in the global economy, which would make things more difficult for Bitcoin and XRP.
We asked ChatGPT to examine both possibilities and predict where BTC and XRP prices could go over the next 30 days if oil crashes below $100.
Why Oil Falling Below $100 Could Change the Crypto Setup
Oil prices affect much more than the amount consumers pay for petrol. They influence transportation costs, manufacturing expenses, inflation, and even decisions made by the Federal Reserve.
When oil becomes cheaper, businesses generally spend less money transporting goods and producing everyday products. These lower costs can eventually reduce inflation pressure across the economy.
That matters because the Federal Reserve considers inflation when deciding whether to raise, maintain, or cut interest rates.
Lower inflation could give the Fed more room to reduce borrowing costs. Such a decision could encourage investment in assets like Bitcoin, XRP, and other cryptocurrencies.
The process is relatively straightforward:
Cheaper oil can reduce transportation and production costs.
Lower costs can help bring inflation down.
Cooling inflation can increase the possibility of interest rate cuts.
Lower interest rates can encourage investors to take more risks.
Increased investment demand could support Bitcoin and XRP prices.
However, the $100 level is not an automatic trigger for a crypto rally. The reason oil falls below that price is equally important.
If oil becomes cheaper because production increases and supply problems improve, cryptocurrencies could benefit from a healthier economic environment.
A different outcome becomes possible if oil crashes because businesses are struggling and global demand is weakening. Such conditions could increase recession fears and encourage investors to sell risky assets, including cryptocurrencies.
That distinction is important when considering ChatGPT’s Bitcoin and XRP price predictions.
The Prompt We Gave ChatGPT
We asked ChatGPT to examine how Bitcoin and XRP might perform over the next 30 days if global oil prices fall below $100 per barrel.
The prompt focused on inflation, Federal Reserve interest rate decisions, investor confidence, and liquidity in the cryptocurrency market.
We also requested separate bullish, neutral, and bearish price predictions for BTC and XRP, with specific price targets and explanations for each scenario.
Prompt Snapshot
The analysis considered whether cheaper oil could support a crypto recovery or create additional selling pressure if the decline came from a global economic recession.
ChatGPT’s Bitcoin Price Prediction
Bitcoin could benefit from oil prices falling below $100, especially if the decline helps reduce inflation and increases the possibility of Federal Reserve interest rate cuts.
ChatGPT’s analysis points to a possible recovery over the next 30 days, although the outcome depends heavily on why oil prices are falling.
The bullish scenario assumes that cheaper oil comes from improved global supply conditions rather than a weakening economy. Lower inflation could encourage the Federal Reserve to consider interest rate cuts, which may improve demand for risky assets.
Under these conditions, ChatGPT predicts that Bitcoin could recover toward $88,000 to $92,000. Such a move would represent an increase of approximately 9% to 14% from the assumed starting price of $81,000.
However, the recovery would likely require Bitcoin to reclaim the $84,000 level and maintain enough buying pressure to continue higher.
The neutral scenario is also worth considering. Oil prices could fall below $100 without producing an immediate change in Federal Reserve policy.
This could leave Bitcoin trading between $78,000 and $85,000 over the next 30 days. Investors may remain cautious as they wait for clearer evidence that inflation is cooling and economic conditions are improving.
The bearish scenario becomes more likely if oil crashes because of a serious decline in global demand. Recession concerns could force investors to reduce their exposure to cryptocurrencies, even if energy prices become cheaper.
ChatGPT estimates that Bitcoin could decline toward $72,000 to $76,000 under those conditions. A breakdown below $78,000 could increase the risk of a deeper correction.
The table below summarizes ChatGPT’s conditional Bitcoin price predictions.
Scenario BTC Price Prediction Expected Market Conditions Bullish $88,000 to $92,000 Lower inflation, improving liquidity, stronger demand Neutral $78,000 to $85,000 Limited economic improvement, cautious Fed Bearish $72,000 to $76,000 Recession fears, weaker demand, crypto selloff
These estimates assume Bitcoin starts near $81,000 and cover the next 30 days.
ChatGPT’s XRP Price Prediction
XRP could record a stronger percentage recovery than Bitcoin if falling oil prices improve conditions across the cryptocurrency market.
The reason is that altcoins can sometimes outperform Bitcoin when investors become more confident and begin putting additional money into riskier cryptocurrencies.
ChatGPT’s bullish prediction places XRP between $1.45 and $1.60 over the next 30 days, compared with the assumed starting price of $1.29.
That would represent a potential recovery of approximately 12% to 24%.
The bullish prediction depends on several conditions:
Oil prices fall because of improved supply rather than a global recession.
Inflation continues to cool and expectations for interest rate cuts improve.
Bitcoin recovers and creates better conditions for altcoins.
XRP attracts enough demand to sustain a recovery above $1.40.
However, XRP may not immediately benefit from cheaper oil if the wider cryptocurrency market remains uncertain.
Read Also: EUR/USD Price Prediction: Analyst Warns of More Downside Before a Rebound
ChatGPT’s neutral scenario places XRP between $1.20 and $1.40. This assumes inflation concerns ease somewhat, but investors remain hesitant to increase their exposure to altcoins.
The bearish scenario becomes relevant if oil crashes because of a weakening global economy.
Such conditions could reduce demand for speculative assets and put XRP under additional selling pressure.
ChatGPT predicts that XRP could decline toward $1 to $1.15 if recession concerns worsen and Bitcoin experiences another major correction.
XRP’s ability to defend the $1.20 area would therefore become important under this scenario. A sustained breakdown could leave the token vulnerable to further losses.
The table below summarizes the XRP price predictions under the different economic scenarios.
Scenario XRP Price Prediction Expected Market Conditions Bullish $1.45 to $1.60 Improving liquidity, BTC recovery, stronger altcoin demand Neutral $1.20 to $1.40 Limited investment demand, uncertain Fed policy Bearish $1 to $1.15 Global recession fears, crypto market weakness
These estimates assume XRP starts near $1.29 and cover the next 30 days.
What Could Ruin the Bullish Scenario
The biggest risk to these Bitcoin and XRP price predictions is a global recession.
Oil prices could fall below $100 because factories are producing fewer goods, consumers are spending less, and businesses are reducing their energy consumption.
Such a situation would create a difficult environment for cryptocurrencies, even if inflation begins to decline.
Another concern is that the Federal Reserve may not reduce interest rates as quickly as investors expect. Lower oil prices can help reduce inflation, but housing costs, wages, and other economic factors also influence monetary policy.
Bitcoin and XRP could therefore remain under pressure even after oil becomes cheaper.
Ultimately, ChatGPT’s predictions point to 2 possible outcomes. Cheaper oil could help Bitcoin recover toward $92,000 and XRP toward $1.60 if economic conditions improve.
FAQs
How many BTC tokens are there?
There are approximately 20 million Bitcoin in circulation. The total maximum supply is hard-coded at 21 million. More than 95% of all Bitcoin has already been mined, and the final coin is expected to be minted around the year 2140
How much will 1 XRP be worth in 2030?
By 2030, standard institutional and algorithmic forecasts generally project 1 XRP to be worth between $1.50 and $5.50, while more bullish mainstream financial analysts place a realistic target range of $5.00 to $10.00.
Subscribe to our YouTube channel for daily crypto updates, market insights, and expert analysis.
The post ChatGPT Predicts Bitcoin and XRP Price If Oil Crashes Below $100 appeared first on CaptainAltcoin.
200
Injective Secures Regulatory Milestones for Tokenization in USInjective is expanding its regulatory footprint in the United States as it pushes deeper into tokenized securities and institutional onchain finance.
The company said CEO Eric Chen recently met with officials from the White House, SEC and CFTC in Washington alongside members of Injective’s legal, policy and research teams.
The meetings come after several regulatory milestones that Injective says are helping build the infrastructure needed to bring tokenized assets into the U.S. financial system.
Injective Builds Regulated Infrastructure for Tokenized Assets
One of the biggest developments came in August, when Injective Institutional Services became registered with the U.S. Securities and Exchange Commission as a transfer agent.
That allows the entity to support regulated ownership recordkeeping for securities, including maintaining records of who owns an asset and processing ownership changes.
Injective has also gained access to regulated U.S. derivatives markets.
INJ futures began trading on Bitnomial in April, giving institutional and retail investors access to INJ exposure through a CFTC-regulated designated contract market.
The company is now developing additional infrastructure for tokenized stocks, funds and other real-world assets.
ICMYI: This month, Injective CEO @ericinjective met with officials from the White House, SEC and CFTC in Washington, joined by our General Counsel, Head of Policy and Head of Research. Injective has spent years building the regulatory foundation to bring tokenization and onchain finance into the U.S. financial system. That work is already translating into tangible milestones: → Injective Institutional Services is an SEC-registered transfer agent, providing regulated ownership recordkeeping services for tokenized securities. → INJ futures are listed on CFTC-regulated U.S. markets, connecting Injective to regulated financial infrastructure. → Injective is developing institutional-grade infrastructure to bring tokenized stocks, funds and real-world assets onchain. → Our legal and policy teams continue engaging directly with U.S. lawmakers and regulators to help shape the future of digital asset regulation. While much of the industry is only beginning to navigate the American regulatory landscape, $INJ has been laying the groundwork for years. The next era of finance will be built onchain, and Injective is positioning itself to help lead that transformation in America. Join the journey with us.
— Injective (@injective) October 24, 2026
Injective Mint, for example, is designed to support issuance, permissions, administration and settlement of tokenized assets onchain. The network has also been used in pilots involving tokenized commercial receivables and other institutional assets.
The latest Washington meetings do not mean Injective has received blanket regulatory approval for tokenized securities or other financial products.
However, the combination of an SEC-registered transfer agent, regulated INJ futures and continued direct engagement with U.S. policymakers gives Injective a stronger regulatory foundation than many blockchain projects pursuing the tokenization market.
The company’s broader goal is to position Injective as infrastructure for institutions that want to issue and manage financial assets onchain while operating within existing U.S. regulatory frameworks.
For more financial news and price predictions, click here.
Subscribe to our YouTube channel for daily crypto updates, market insights, and expert analysis.
The post Injective Secures Regulatory Milestones for Tokenization in US appeared first on CaptainAltcoin.
Injective Secures Regulatory Milestones for Tokenization in US
Injective is expanding its regulatory footprint in the United States as it pushes deeper into tokenized securities and institutional onchain finance.
The company said CEO Eric Chen recently met with officials from the White House, SEC and CFTC in Washington alongside members of Injective’s legal, policy and research teams.
The meetings come after several regulatory milestones that Injective says are helping build the infrastructure needed to bring tokenized assets into the U.S. financial system.
Injective Builds Regulated Infrastructure for Tokenized Assets
One of the biggest developments came in August, when Injective Institutional Services became registered with the U.S. Securities and Exchange Commission as a transfer agent.
That allows the entity to support regulated ownership recordkeeping for securities, including maintaining records of who owns an asset and processing ownership changes.
Injective has also gained access to regulated U.S. derivatives markets.
INJ futures began trading on Bitnomial in April, giving institutional and retail investors access to INJ exposure through a CFTC-regulated designated contract market.
The company is now developing additional infrastructure for tokenized stocks, funds and other real-world assets.
ICMYI: This month, Injective CEO @ericinjective met with officials from the White House, SEC and CFTC in Washington, joined by our General Counsel, Head of Policy and Head of Research. Injective has spent years building the regulatory foundation to bring tokenization and onchain finance into the U.S. financial system. That work is already translating into tangible milestones: → Injective Institutional Services is an SEC-registered transfer agent, providing regulated ownership recordkeeping services for tokenized securities. → INJ futures are listed on CFTC-regulated U.S. markets, connecting Injective to regulated financial infrastructure. → Injective is developing institutional-grade infrastructure to bring tokenized stocks, funds and real-world assets onchain. → Our legal and policy teams continue engaging directly with U.S. lawmakers and regulators to help shape the future of digital asset regulation. While much of the industry is only beginning to navigate the American regulatory landscape, $INJ has been laying the groundwork for years. The next era of finance will be built onchain, and Injective is positioning itself to help lead that transformation in America. Join the journey with us.
— Injective (@injective) October 24, 2026
Injective Mint, for example, is designed to support issuance, permissions, administration and settlement of tokenized assets onchain. The network has also been used in pilots involving tokenized commercial receivables and other institutional assets.
The latest Washington meetings do not mean Injective has received blanket regulatory approval for tokenized securities or other financial products.
However, the combination of an SEC-registered transfer agent, regulated INJ futures and continued direct engagement with U.S. policymakers gives Injective a stronger regulatory foundation than many blockchain projects pursuing the tokenization market.
The company’s broader goal is to position Injective as infrastructure for institutions that want to issue and manage financial assets onchain while operating within existing U.S. regulatory frameworks.
For more financial news and price predictions, click here.
Subscribe to our YouTube channel for daily crypto updates, market insights, and expert analysis.
The post Injective Secures Regulatory Milestones for Tokenization in US appeared first on CaptainAltcoin.
The company said CEO Eric Chen recently met with officials from the White House, SEC and CFTC in Washington alongside members of Injective’s legal, policy and research teams.
The meetings come after several regulatory milestones that Injective says are helping build the infrastructure needed to bring tokenized assets into the U.S. financial system.
Injective Builds Regulated Infrastructure for Tokenized Assets
One of the biggest developments came in August, when Injective Institutional Services became registered with the U.S. Securities and Exchange Commission as a transfer agent.
That allows the entity to support regulated ownership recordkeeping for securities, including maintaining records of who owns an asset and processing ownership changes.
Injective has also gained access to regulated U.S. derivatives markets.
INJ futures began trading on Bitnomial in April, giving institutional and retail investors access to INJ exposure through a CFTC-regulated designated contract market.
The company is now developing additional infrastructure for tokenized stocks, funds and other real-world assets.
ICMYI: This month, Injective CEO @ericinjective met with officials from the White House, SEC and CFTC in Washington, joined by our General Counsel, Head of Policy and Head of Research. Injective has spent years building the regulatory foundation to bring tokenization and onchain finance into the U.S. financial system. That work is already translating into tangible milestones: → Injective Institutional Services is an SEC-registered transfer agent, providing regulated ownership recordkeeping services for tokenized securities. → INJ futures are listed on CFTC-regulated U.S. markets, connecting Injective to regulated financial infrastructure. → Injective is developing institutional-grade infrastructure to bring tokenized stocks, funds and real-world assets onchain. → Our legal and policy teams continue engaging directly with U.S. lawmakers and regulators to help shape the future of digital asset regulation. While much of the industry is only beginning to navigate the American regulatory landscape, $INJ has been laying the groundwork for years. The next era of finance will be built onchain, and Injective is positioning itself to help lead that transformation in America. Join the journey with us.
— Injective (@injective) October 24, 2026
Injective Mint, for example, is designed to support issuance, permissions, administration and settlement of tokenized assets onchain. The network has also been used in pilots involving tokenized commercial receivables and other institutional assets.
The latest Washington meetings do not mean Injective has received blanket regulatory approval for tokenized securities or other financial products.
However, the combination of an SEC-registered transfer agent, regulated INJ futures and continued direct engagement with U.S. policymakers gives Injective a stronger regulatory foundation than many blockchain projects pursuing the tokenization market.
The company’s broader goal is to position Injective as infrastructure for institutions that want to issue and manage financial assets onchain while operating within existing U.S. regulatory frameworks.
For more financial news and price predictions, click here.
Subscribe to our YouTube channel for daily crypto updates, market insights, and expert analysis.
The post Injective Secures Regulatory Milestones for Tokenization in US appeared first on CaptainAltcoin.
488
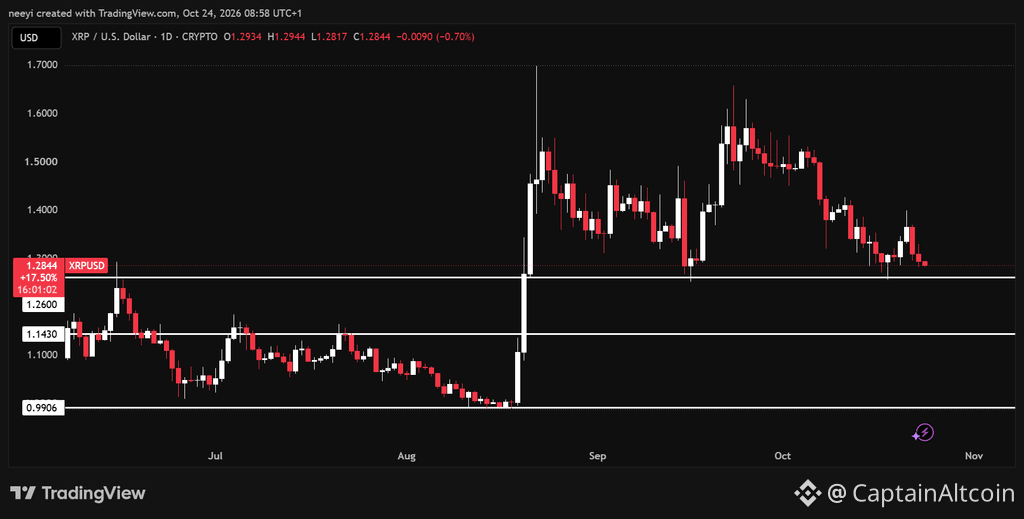
Article
AI XRP Price Forecast Turns Bullish As This Indicator Hits Extreme Oversold LevelsXRP’s latest decline has brought its price back toward a support level that has repeatedly interrupted selling since August. Vincent Van Code’s automated analysis now points to an oversold reading that could open the door to a recovery. The question is whether buyers can turn that opportunity into a meaningful bounce.
The bullish part of this AI XRP price forecast comes from an indicator that measures how heavily the token has been sold. Other readings remain bearish, so the recovery case still needs confirmation from price action. XRP’s next move around familiar support could help settle that debate.
Vincent Van Code’s AI XRP Price Forecast Identifies Extreme Oversold Conditions
Vincent Van Code shared an automated XRP assessment through his Vancode.ai research platform. The supplied snapshot placed XRP price near $1.29, down 0.65% over 24 hours, alongside a volume reading of 38,581,909.
The strongest argument for a bounce came from the Relative Strength Index. XRP’s RSI measured 17.35, well below the commonly used oversold threshold of 30.
That reading shows how heavily recent price action has favored sellers. It can precede a relief rally, although an oversold indicator cannot establish that a bottom has formed. Strong downtrends can keep an asset oversold even after an initial recovery attempt.
Latest AI Summary: XRP $1.28 ± $0.0300 (60% strength) Current Token Status Price: $1.29 Volume: 38,581,909 24H Change %: -0.65% Price is in a clear downtrend, having broken below all key EMAs and currently trading near $1.29. RSI is deeply oversold at 17.35, suggesting a potential relief bounce. MACD histogram is negative but decelerating. Recent candles show consistent selling pressure with lower highs and lows. Volume spikes on down moves confirm bearish sentiment. Immediate support at $1.26 and resistance at $1.39. Trend Strong short-term downtrend. Price has collapsed from recent highs near $1.39 to current levels, breaking decisively below all major moving averages. Candles – Bearish (85%) Recent hourly candles show a series of lower highs and lower lows. The last 24 hours feature long red candles on high volume, confirming persistent selling pressure. EMA – Bearish (90%) Price $1.29 is well below all EMAs (12: $1.31, 20: $1.32, 50: $1.32, 200: $1.31), confirming a strong bearish alignment and significant selling pressure. MACD – Bearish (70%) MACD line is negative at -0.00889 and below its signal line. The histogram is negative but less negative than prior reading, indicating bearish momentum may be slowing. RSI – Bullish (80%) RSI_14 at 17.35 is deeply oversold, far below the 30 threshold. This indicates extreme selling pressure and suggests a high probability of a short-term technical bounce. Volume – Bearish (75%) Volume spikes consistently accompany price declines (e.g., 3.5M+ at 23:00), confirming strong selling interest. Low volume on small up moves suggests weak buying. Click for more details https://t.co/ajqL3iSXvj https://t.co/JuZJYDY4xL is an educational research tool. All projections are automated model outputs and do not constitute financial advice. Always perform your own independent research.
— Vincent Van Code (@vincent_vancode) October 24, 2026
Van Code’s model assigned its RSI assessment an 80% bullish score. That figure represents the tool’s classification of the indicator, rather than an independently verified 80% probability that XRP price will rise.
The broader automated output centered on $1.28, plus or minus $0.03, with a stated strength of 60%. That range describes a relatively narrow price projection and does not establish a larger bullish reversal.
XRP Price Indicators Still Show Persistent Selling Pressure
The oversold RSI stands against several bearish readings in Van Code’s analysis. XRP price remained below its listed exponential moving averages, which ranged from approximately $1.31 to $1.32.
Those levels create an immediate recovery test. A bounce toward that area would need enough demand to carry XRP back above the averages and prevent another rejection.
The MACD reading remained negative, although its histogram had become less negative than the previous reading. That points to a possible slowdown in bearish pressure, without confirmation that buyers have taken control.
Recent hourly candles also formed lower highs and lower lows. Larger volume accompanied price declines, and smaller recoveries attracted weaker volume in the supplied assessment.
These conditions explain why the bullish XRP price forecast needs careful interpretation. The RSI supports a potential rebound, but the broader evidence still describes a market under selling pressure.
XRP Price Support At $1.26 Has Repeatedly Produced Recoveries
A look at the XRP price structure described in the supplied analysis shows repeated recoveries from around $1.26 since August. Similar bounces appeared in mid September and mid October, which makes the latest return to this area especially relevant.
XRPUSD Price Chart / TradingView.com
The latest decline could also produce a 3rd consecutive red daily candle. That would bring XRP back toward familiar support after another stretch of weakness.
Repeated defenses give $1.26 a clear role in the recovery scenario. However, previous bounces do not guarantee another successful defense, particularly if sellers continue to press the level.
The main levels in the supplied analysis are:
$1.26 support: Buyers need to defend this area to preserve the immediate bounce scenario.
$1.31 to $1.32 resistance: The listed moving averages create an early test for a recovery.
$1.39 resistance: Van Code identified this level as a further barrier above the current price.
A recovery through these levels would provide stronger evidence than the oversold RSI alone.
Read Also: Gold and Silver Price Predictions for Today (October 24) – Crash Continues?
Losing $1.26 Could Expose XRP Price To Deeper Declines
The bearish scenario becomes more relevant if XRP breaks below $1.26 and fails to recover that level. The supplied price analysis identifies $1.15 to $1.14 as the next potential support zone.
A further breakdown below that area could expose XRP price to $0.99 before the end of the month or early next month. That remains a conditional scenario, not a confirmed destination or a separate forecast from Van Code’s model.
FAQs
How much will 1 XRP be worth in 2030?
Wall Street and cryptocurrency analysts project the credible price of XRP to sit between $5.00 and $15.00 by 2030. While the crypto market is famously volatile and impossible to predict with certainty, current market consensus generally rules out hyper-bullish online rumors of XRP hitting $1,000 or $10,000, as the required market capitalizations would mathematically exceed the entire global economy.
Can XRP hit $100 dollars?
XRP can theoretically hit $100, but it is extremely unlikely in the near or medium term because it would require a market capitalization of roughly $5.3 trillion to $7 trillion (and up to $10 trillion if all 100 billion tokens are in circulation), which is larger than the valuation of major global stock indexes and several times the size of the entire cryptocurrency market.
Subscribe to our YouTube channel for daily crypto updates, market insights, and expert analysis.
The post AI XRP Price Forecast Turns Bullish As This Indicator Hits Extreme Oversold Levels appeared first on CaptainAltcoin.
AI XRP Price Forecast Turns Bullish As This Indicator Hits Extreme Oversold Levels
XRP’s latest decline has brought its price back toward a support level that has repeatedly interrupted selling since August. Vincent Van Code’s automated analysis now points to an oversold reading that could open the door to a recovery. The question is whether buyers can turn that opportunity into a meaningful bounce.
The bullish part of this AI XRP price forecast comes from an indicator that measures how heavily the token has been sold. Other readings remain bearish, so the recovery case still needs confirmation from price action. XRP’s next move around familiar support could help settle that debate.
Vincent Van Code’s AI XRP Price Forecast Identifies Extreme Oversold Conditions
Vincent Van Code shared an automated XRP assessment through his Vancode.ai research platform. The supplied snapshot placed XRP price near $1.29, down 0.65% over 24 hours, alongside a volume reading of 38,581,909.
The strongest argument for a bounce came from the Relative Strength Index. XRP’s RSI measured 17.35, well below the commonly used oversold threshold of 30.
That reading shows how heavily recent price action has favored sellers. It can precede a relief rally, although an oversold indicator cannot establish that a bottom has formed. Strong downtrends can keep an asset oversold even after an initial recovery attempt.
Latest AI Summary: XRP $1.28 ± $0.0300 (60% strength) Current Token Status Price: $1.29 Volume: 38,581,909 24H Change %: -0.65% Price is in a clear downtrend, having broken below all key EMAs and currently trading near $1.29. RSI is deeply oversold at 17.35, suggesting a potential relief bounce. MACD histogram is negative but decelerating. Recent candles show consistent selling pressure with lower highs and lows. Volume spikes on down moves confirm bearish sentiment. Immediate support at $1.26 and resistance at $1.39. Trend Strong short-term downtrend. Price has collapsed from recent highs near $1.39 to current levels, breaking decisively below all major moving averages. Candles – Bearish (85%) Recent hourly candles show a series of lower highs and lower lows. The last 24 hours feature long red candles on high volume, confirming persistent selling pressure. EMA – Bearish (90%) Price $1.29 is well below all EMAs (12: $1.31, 20: $1.32, 50: $1.32, 200: $1.31), confirming a strong bearish alignment and significant selling pressure. MACD – Bearish (70%) MACD line is negative at -0.00889 and below its signal line. The histogram is negative but less negative than prior reading, indicating bearish momentum may be slowing. RSI – Bullish (80%) RSI_14 at 17.35 is deeply oversold, far below the 30 threshold. This indicates extreme selling pressure and suggests a high probability of a short-term technical bounce. Volume – Bearish (75%) Volume spikes consistently accompany price declines (e.g., 3.5M+ at 23:00), confirming strong selling interest. Low volume on small up moves suggests weak buying. Click for more details https://t.co/ajqL3iSXvj https://t.co/JuZJYDY4xL is an educational research tool. All projections are automated model outputs and do not constitute financial advice. Always perform your own independent research.
— Vincent Van Code (@vincent_vancode) October 24, 2026
Van Code’s model assigned its RSI assessment an 80% bullish score. That figure represents the tool’s classification of the indicator, rather than an independently verified 80% probability that XRP price will rise.
The broader automated output centered on $1.28, plus or minus $0.03, with a stated strength of 60%. That range describes a relatively narrow price projection and does not establish a larger bullish reversal.
XRP Price Indicators Still Show Persistent Selling Pressure
The oversold RSI stands against several bearish readings in Van Code’s analysis. XRP price remained below its listed exponential moving averages, which ranged from approximately $1.31 to $1.32.
Those levels create an immediate recovery test. A bounce toward that area would need enough demand to carry XRP back above the averages and prevent another rejection.
The MACD reading remained negative, although its histogram had become less negative than the previous reading. That points to a possible slowdown in bearish pressure, without confirmation that buyers have taken control.
Recent hourly candles also formed lower highs and lower lows. Larger volume accompanied price declines, and smaller recoveries attracted weaker volume in the supplied assessment.
These conditions explain why the bullish XRP price forecast needs careful interpretation. The RSI supports a potential rebound, but the broader evidence still describes a market under selling pressure.
XRP Price Support At $1.26 Has Repeatedly Produced Recoveries
A look at the XRP price structure described in the supplied analysis shows repeated recoveries from around $1.26 since August. Similar bounces appeared in mid September and mid October, which makes the latest return to this area especially relevant.
XRPUSD Price Chart / TradingView.com
The latest decline could also produce a 3rd consecutive red daily candle. That would bring XRP back toward familiar support after another stretch of weakness.
Repeated defenses give $1.26 a clear role in the recovery scenario. However, previous bounces do not guarantee another successful defense, particularly if sellers continue to press the level.
The main levels in the supplied analysis are:
$1.26 support: Buyers need to defend this area to preserve the immediate bounce scenario.
$1.31 to $1.32 resistance: The listed moving averages create an early test for a recovery.
$1.39 resistance: Van Code identified this level as a further barrier above the current price.
A recovery through these levels would provide stronger evidence than the oversold RSI alone.
Read Also: Gold and Silver Price Predictions for Today (October 24) – Crash Continues?
Losing $1.26 Could Expose XRP Price To Deeper Declines
The bearish scenario becomes more relevant if XRP breaks below $1.26 and fails to recover that level. The supplied price analysis identifies $1.15 to $1.14 as the next potential support zone.
A further breakdown below that area could expose XRP price to $0.99 before the end of the month or early next month. That remains a conditional scenario, not a confirmed destination or a separate forecast from Van Code’s model.
FAQs
How much will 1 XRP be worth in 2030?
Wall Street and cryptocurrency analysts project the credible price of XRP to sit between $5.00 and $15.00 by 2030. While the crypto market is famously volatile and impossible to predict with certainty, current market consensus generally rules out hyper-bullish online rumors of XRP hitting $1,000 or $10,000, as the required market capitalizations would mathematically exceed the entire global economy.
Can XRP hit $100 dollars?
XRP can theoretically hit $100, but it is extremely unlikely in the near or medium term because it would require a market capitalization of roughly $5.3 trillion to $7 trillion (and up to $10 trillion if all 100 billion tokens are in circulation), which is larger than the valuation of major global stock indexes and several times the size of the entire cryptocurrency market.
Subscribe to our YouTube channel for daily crypto updates, market insights, and expert analysis.
The post AI XRP Price Forecast Turns Bullish As This Indicator Hits Extreme Oversold Levels appeared first on CaptainAltcoin.
The bullish part of this AI XRP price forecast comes from an indicator that measures how heavily the token has been sold. Other readings remain bearish, so the recovery case still needs confirmation from price action. XRP’s next move around familiar support could help settle that debate.
Vincent Van Code’s AI XRP Price Forecast Identifies Extreme Oversold Conditions
Vincent Van Code shared an automated XRP assessment through his Vancode.ai research platform. The supplied snapshot placed XRP price near $1.29, down 0.65% over 24 hours, alongside a volume reading of 38,581,909.
The strongest argument for a bounce came from the Relative Strength Index. XRP’s RSI measured 17.35, well below the commonly used oversold threshold of 30.
That reading shows how heavily recent price action has favored sellers. It can precede a relief rally, although an oversold indicator cannot establish that a bottom has formed. Strong downtrends can keep an asset oversold even after an initial recovery attempt.
Latest AI Summary: XRP $1.28 ± $0.0300 (60% strength) Current Token Status Price: $1.29 Volume: 38,581,909 24H Change %: -0.65% Price is in a clear downtrend, having broken below all key EMAs and currently trading near $1.29. RSI is deeply oversold at 17.35, suggesting a potential relief bounce. MACD histogram is negative but decelerating. Recent candles show consistent selling pressure with lower highs and lows. Volume spikes on down moves confirm bearish sentiment. Immediate support at $1.26 and resistance at $1.39. Trend Strong short-term downtrend. Price has collapsed from recent highs near $1.39 to current levels, breaking decisively below all major moving averages. Candles – Bearish (85%) Recent hourly candles show a series of lower highs and lower lows. The last 24 hours feature long red candles on high volume, confirming persistent selling pressure. EMA – Bearish (90%) Price $1.29 is well below all EMAs (12: $1.31, 20: $1.32, 50: $1.32, 200: $1.31), confirming a strong bearish alignment and significant selling pressure. MACD – Bearish (70%) MACD line is negative at -0.00889 and below its signal line. The histogram is negative but less negative than prior reading, indicating bearish momentum may be slowing. RSI – Bullish (80%) RSI_14 at 17.35 is deeply oversold, far below the 30 threshold. This indicates extreme selling pressure and suggests a high probability of a short-term technical bounce. Volume – Bearish (75%) Volume spikes consistently accompany price declines (e.g., 3.5M+ at 23:00), confirming strong selling interest. Low volume on small up moves suggests weak buying. Click for more details https://t.co/ajqL3iSXvj https://t.co/JuZJYDY4xL is an educational research tool. All projections are automated model outputs and do not constitute financial advice. Always perform your own independent research.
— Vincent Van Code (@vincent_vancode) October 24, 2026
Van Code’s model assigned its RSI assessment an 80% bullish score. That figure represents the tool’s classification of the indicator, rather than an independently verified 80% probability that XRP price will rise.
The broader automated output centered on $1.28, plus or minus $0.03, with a stated strength of 60%. That range describes a relatively narrow price projection and does not establish a larger bullish reversal.
XRP Price Indicators Still Show Persistent Selling Pressure
The oversold RSI stands against several bearish readings in Van Code’s analysis. XRP price remained below its listed exponential moving averages, which ranged from approximately $1.31 to $1.32.
Those levels create an immediate recovery test. A bounce toward that area would need enough demand to carry XRP back above the averages and prevent another rejection.
The MACD reading remained negative, although its histogram had become less negative than the previous reading. That points to a possible slowdown in bearish pressure, without confirmation that buyers have taken control.
Recent hourly candles also formed lower highs and lower lows. Larger volume accompanied price declines, and smaller recoveries attracted weaker volume in the supplied assessment.
These conditions explain why the bullish XRP price forecast needs careful interpretation. The RSI supports a potential rebound, but the broader evidence still describes a market under selling pressure.
XRP Price Support At $1.26 Has Repeatedly Produced Recoveries
A look at the XRP price structure described in the supplied analysis shows repeated recoveries from around $1.26 since August. Similar bounces appeared in mid September and mid October, which makes the latest return to this area especially relevant.
XRPUSD Price Chart / TradingView.com
The latest decline could also produce a 3rd consecutive red daily candle. That would bring XRP back toward familiar support after another stretch of weakness.
Repeated defenses give $1.26 a clear role in the recovery scenario. However, previous bounces do not guarantee another successful defense, particularly if sellers continue to press the level.
The main levels in the supplied analysis are:
$1.26 support: Buyers need to defend this area to preserve the immediate bounce scenario.
$1.31 to $1.32 resistance: The listed moving averages create an early test for a recovery.
$1.39 resistance: Van Code identified this level as a further barrier above the current price.
A recovery through these levels would provide stronger evidence than the oversold RSI alone.
Read Also: Gold and Silver Price Predictions for Today (October 24) – Crash Continues?
Losing $1.26 Could Expose XRP Price To Deeper Declines
The bearish scenario becomes more relevant if XRP breaks below $1.26 and fails to recover that level. The supplied price analysis identifies $1.15 to $1.14 as the next potential support zone.
A further breakdown below that area could expose XRP price to $0.99 before the end of the month or early next month. That remains a conditional scenario, not a confirmed destination or a separate forecast from Van Code’s model.
FAQs
How much will 1 XRP be worth in 2030?
Wall Street and cryptocurrency analysts project the credible price of XRP to sit between $5.00 and $15.00 by 2030. While the crypto market is famously volatile and impossible to predict with certainty, current market consensus generally rules out hyper-bullish online rumors of XRP hitting $1,000 or $10,000, as the required market capitalizations would mathematically exceed the entire global economy.
Can XRP hit $100 dollars?
XRP can theoretically hit $100, but it is extremely unlikely in the near or medium term because it would require a market capitalization of roughly $5.3 trillion to $7 trillion (and up to $10 trillion if all 100 billion tokens are in circulation), which is larger than the valuation of major global stock indexes and several times the size of the entire cryptocurrency market.
Subscribe to our YouTube channel for daily crypto updates, market insights, and expert analysis.
The post AI XRP Price Forecast Turns Bullish As This Indicator Hits Extreme Oversold Levels appeared first on CaptainAltcoin.
3
350
Gold Price Today: Why $4,000 Is the Level Everyone Is WatchingGold has now broken below the psychological $4,000 level, which extended one of its weakest stretches in months.
Spot gold fell to roughly $3,975 during the latest session before hovering close to $4,000 again. That leaves the metal sharply lower for the week and puts the market at a level traders are watching very closely.
Rob Mirlach argues that $4,000 is now the line that could determine whether this move was simply a violent flush or the start of a deeper correction.
His framework is straightforward:
reclaim $4,000 and the drop starts looking more like a liquidation event
lose $3,975 and the July lows near $3,960 come back into focus
the next Federal Reserve decision could decide whether pressure continues
Why Gold Is Falling With Stocks
Normally, falling equities and geopolitical tension should help gold.
This time, they are not.
One reason is liquidity.
When hedge funds and other large investors face losses or reduce leverage, they often sell liquid assets to raise cash. Gold is one of the easiest assets to sell quickly.
That helps explain why bullion has been falling alongside equities instead of immediately benefiting from safe-haven demand.
GOLD JUST LOST $4,000 WHILE WALL STREET’S BIGGEST HEDGE FUNDS BET ON A CRASH. Goldman Sachs data via Bloomberg: Hedge funds are shorting stocks at near 5 year highs. Short sales are running about 5 to 1 against new buys this month. Short leverage sits in the 99th percentile of the last 5 years. Goldman just put out a short squeeze warning. Meanwhile: Oil is $103, up almost 4% today. The 10 year is near 5%. Gold hit $3,975 today, its lowest since July 17. That’s $215 off this week’s $4,190 high. Gold is supposed to be the safe place when Wall Street panics. Yet gold is falling WITH stocks. When funds need cash, they sell what they can. Gold is the easiest thing to sell. My plan: 1. $4,000 is the line. Back above it and this drop looks like a flush. 2. Lose $3,975 and the July lows near $3,960 are next. 3. The Fed decides Wednesday at 2 PM New York. FREE GOLD NEWS DAY PLAYBOOK COMMENT "NEWS" AND I’LL DM IT TO YOU. (Follow me first so it lands.)
— Rob Mirlach (@RobMirlach) October 23, 2026
Oil is another problem.
Brent crude remains above $100, keeping inflation concerns elevated. That makes it harder for the Federal Reserve to turn dovish and keeps pressure on non-yielding assets such as gold.
Treasury yields near 5% add to that pressure.
Why $4,000 Matters
The $4,000 level is important both technically and psychologically.
Price has already traded below it, but the next reaction around $3,975-$4,000 should tell us whether sellers are losing control.
If gold quickly reclaims $4,000 and pushes back above roughly $4,020-$4,040, that would be the first sign of stabilization.
If $3,975 fails, the next level is around $3,960.
Below that, $3,900 becomes increasingly relevant.
Gold Price Outlook
Scenario Gold price path Bullish recovery Reclaim $4,000 → $4,040 → $4,075-$4,100 Neutral $3,975-$4,040 consolidation Bearish continuation Lose $3,975 → $3,960 → $3,900
Mirlach’s framing makes sense because $4,000 is now the line separating a possible liquidation flush from a deeper breakdown.
If buyers reclaim it, the current selloff may start looking exhausted.
If they cannot, gold may still have another leg lower before a durable bottom forms.
For more financial news and price predictions, click here.
Subscribe to our YouTube channel for daily crypto updates, market insights, and expert analysis.
The post Gold Price Today: Why $4,000 Is the Level Everyone Is Watching appeared first on CaptainAltcoin.
Gold Price Today: Why $4,000 Is the Level Everyone Is Watching
Gold has now broken below the psychological $4,000 level, which extended one of its weakest stretches in months.
Spot gold fell to roughly $3,975 during the latest session before hovering close to $4,000 again. That leaves the metal sharply lower for the week and puts the market at a level traders are watching very closely.
Rob Mirlach argues that $4,000 is now the line that could determine whether this move was simply a violent flush or the start of a deeper correction.
His framework is straightforward:
reclaim $4,000 and the drop starts looking more like a liquidation event
lose $3,975 and the July lows near $3,960 come back into focus
the next Federal Reserve decision could decide whether pressure continues
Why Gold Is Falling With Stocks
Normally, falling equities and geopolitical tension should help gold.
This time, they are not.
One reason is liquidity.
When hedge funds and other large investors face losses or reduce leverage, they often sell liquid assets to raise cash. Gold is one of the easiest assets to sell quickly.
That helps explain why bullion has been falling alongside equities instead of immediately benefiting from safe-haven demand.
GOLD JUST LOST $4,000 WHILE WALL STREET’S BIGGEST HEDGE FUNDS BET ON A CRASH. Goldman Sachs data via Bloomberg: Hedge funds are shorting stocks at near 5 year highs. Short sales are running about 5 to 1 against new buys this month. Short leverage sits in the 99th percentile of the last 5 years. Goldman just put out a short squeeze warning. Meanwhile: Oil is $103, up almost 4% today. The 10 year is near 5%. Gold hit $3,975 today, its lowest since July 17. That’s $215 off this week’s $4,190 high. Gold is supposed to be the safe place when Wall Street panics. Yet gold is falling WITH stocks. When funds need cash, they sell what they can. Gold is the easiest thing to sell. My plan: 1. $4,000 is the line. Back above it and this drop looks like a flush. 2. Lose $3,975 and the July lows near $3,960 are next. 3. The Fed decides Wednesday at 2 PM New York. FREE GOLD NEWS DAY PLAYBOOK COMMENT "NEWS" AND I’LL DM IT TO YOU. (Follow me first so it lands.)
— Rob Mirlach (@RobMirlach) October 23, 2026
Oil is another problem.
Brent crude remains above $100, keeping inflation concerns elevated. That makes it harder for the Federal Reserve to turn dovish and keeps pressure on non-yielding assets such as gold.
Treasury yields near 5% add to that pressure.
Why $4,000 Matters
The $4,000 level is important both technically and psychologically.
Price has already traded below it, but the next reaction around $3,975-$4,000 should tell us whether sellers are losing control.
If gold quickly reclaims $4,000 and pushes back above roughly $4,020-$4,040, that would be the first sign of stabilization.
If $3,975 fails, the next level is around $3,960.
Below that, $3,900 becomes increasingly relevant.
Gold Price Outlook
Scenario Gold price path Bullish recovery Reclaim $4,000 → $4,040 → $4,075-$4,100 Neutral $3,975-$4,040 consolidation Bearish continuation Lose $3,975 → $3,960 → $3,900
Mirlach’s framing makes sense because $4,000 is now the line separating a possible liquidation flush from a deeper breakdown.
If buyers reclaim it, the current selloff may start looking exhausted.
If they cannot, gold may still have another leg lower before a durable bottom forms.
For more financial news and price predictions, click here.
Subscribe to our YouTube channel for daily crypto updates, market insights, and expert analysis.
The post Gold Price Today: Why $4,000 Is the Level Everyone Is Watching appeared first on CaptainAltcoin.
Spot gold fell to roughly $3,975 during the latest session before hovering close to $4,000 again. That leaves the metal sharply lower for the week and puts the market at a level traders are watching very closely.
Rob Mirlach argues that $4,000 is now the line that could determine whether this move was simply a violent flush or the start of a deeper correction.
His framework is straightforward:
reclaim $4,000 and the drop starts looking more like a liquidation event
lose $3,975 and the July lows near $3,960 come back into focus
the next Federal Reserve decision could decide whether pressure continues
Why Gold Is Falling With Stocks
Normally, falling equities and geopolitical tension should help gold.
This time, they are not.
One reason is liquidity.
When hedge funds and other large investors face losses or reduce leverage, they often sell liquid assets to raise cash. Gold is one of the easiest assets to sell quickly.
That helps explain why bullion has been falling alongside equities instead of immediately benefiting from safe-haven demand.
GOLD JUST LOST $4,000 WHILE WALL STREET’S BIGGEST HEDGE FUNDS BET ON A CRASH. Goldman Sachs data via Bloomberg: Hedge funds are shorting stocks at near 5 year highs. Short sales are running about 5 to 1 against new buys this month. Short leverage sits in the 99th percentile of the last 5 years. Goldman just put out a short squeeze warning. Meanwhile: Oil is $103, up almost 4% today. The 10 year is near 5%. Gold hit $3,975 today, its lowest since July 17. That’s $215 off this week’s $4,190 high. Gold is supposed to be the safe place when Wall Street panics. Yet gold is falling WITH stocks. When funds need cash, they sell what they can. Gold is the easiest thing to sell. My plan: 1. $4,000 is the line. Back above it and this drop looks like a flush. 2. Lose $3,975 and the July lows near $3,960 are next. 3. The Fed decides Wednesday at 2 PM New York. FREE GOLD NEWS DAY PLAYBOOK COMMENT "NEWS" AND I’LL DM IT TO YOU. (Follow me first so it lands.)
— Rob Mirlach (@RobMirlach) October 23, 2026
Oil is another problem.
Brent crude remains above $100, keeping inflation concerns elevated. That makes it harder for the Federal Reserve to turn dovish and keeps pressure on non-yielding assets such as gold.
Treasury yields near 5% add to that pressure.
Why $4,000 Matters
The $4,000 level is important both technically and psychologically.
Price has already traded below it, but the next reaction around $3,975-$4,000 should tell us whether sellers are losing control.
If gold quickly reclaims $4,000 and pushes back above roughly $4,020-$4,040, that would be the first sign of stabilization.
If $3,975 fails, the next level is around $3,960.
Below that, $3,900 becomes increasingly relevant.
Gold Price Outlook
Scenario Gold price path Bullish recovery Reclaim $4,000 → $4,040 → $4,075-$4,100 Neutral $3,975-$4,040 consolidation Bearish continuation Lose $3,975 → $3,960 → $3,900
Mirlach’s framing makes sense because $4,000 is now the line separating a possible liquidation flush from a deeper breakdown.
If buyers reclaim it, the current selloff may start looking exhausted.
If they cannot, gold may still have another leg lower before a durable bottom forms.
For more financial news and price predictions, click here.
Subscribe to our YouTube channel for daily crypto updates, market insights, and expert analysis.
The post Gold Price Today: Why $4,000 Is the Level Everyone Is Watching appeared first on CaptainAltcoin.
253
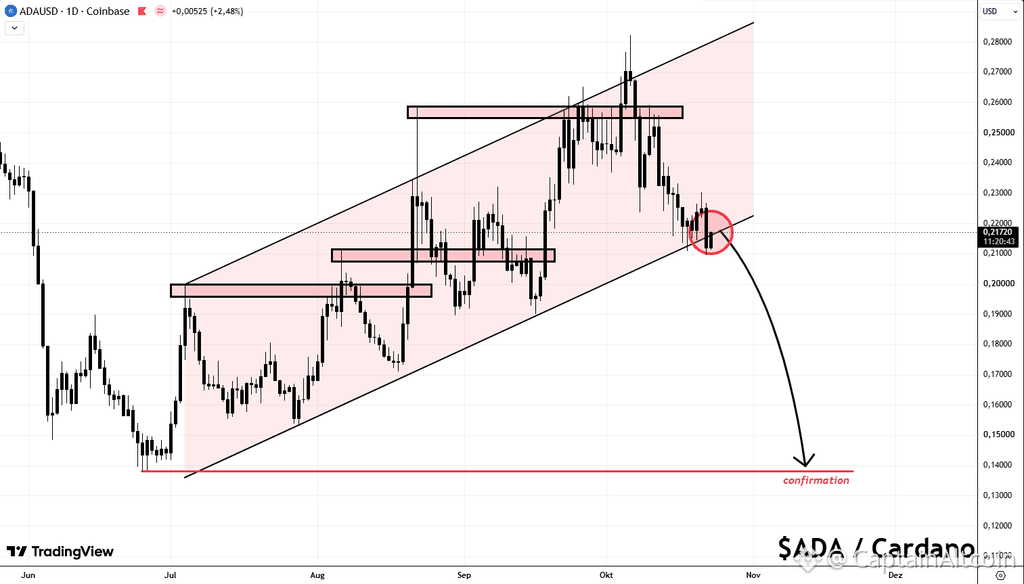
Article
Analyst Warns Cardano Price May Be Heading for a Final Flush!Cardano’s latest recovery is under pressure, and analyst V believes ADA could face another painful test before a lasting bottom develops. His warning comes as the project advances network upgrades and enterprise applications, which makes the contrast between development progress and price weakness worth a closer look.
The analyst, known as @finsends on X, questions whether Cardano price has completed its decline. His chart identifies a vulnerable technical structure that could decide what happens next.
Cardano Price Tests The Channel Behind Its Recovery
A look at the Cardano chart shows ADA near $0.2172 on the daily Coinbase timeframe. Price has returned to the lower boundary of an ascending channel after a rejection near its upper edge.
That channel has contained much of the recovery from the June low. ADA established progressively higher lows through July, August, and September before its October advance reached approximately $0.28.
The recovery has since lost ground. Cardano price fell below the marked resistance area around $0.255 to $0.259 and returned toward the rising support line near $0.215.
V’s concern centers on that support boundary. He described ADA as a prime candidate for another low and said a fall outside the channel could strengthen his bearish outlook.
The red circle marks the current support test. Recent candles extend beneath the boundary, although that alone cannot establish a sustained breakdown. A daily close below support followed by an unsuccessful recovery would provide stronger evidence.
@finsends / X A Cardano Price Breakdown Could Expose The June Low
The chart’s curved arrow projects a decline toward the horizontal red line around $0.138. That area corresponds closely to the June bottom and represents approximately 36% downside from the displayed price.
The arrow illustrates V’s bearish scenario rather than a guaranteed destination. Several price areas separate ADA from that potential retest:
$0.207 To $0.212: This marked zone represents the nearest horizontal support beneath the channel test.
$0.196 To $0.200: An earlier resistance area could become another support test.
Approximately $0.138: The June low anchors the projected final flush scenario.
A break below the channel would weaken the sequence of higher lows. Further losses through the horizontal support zones would give the downside projection more technical support.
The bullish alternative requires ADA to reclaim the channel and hold above its lower boundary. A recovery toward $0.23 would improve the immediate picture, although the marked $0.255 to $0.259 resistance zone remains a larger obstacle.
V also expressed interest in buying after another low. His view therefore leaves room for a later recovery, although the chart cannot confirm that any future decline would produce the final bottom.
Cardano Upgrades Continue Despite ADA Price Weakness
Cardano’s development activity provides useful context, but technical progress does not automatically create immediate demand for ADA.
DijkstraNet opened for public participation ahead of Node 11.2 and its planned protocol changes. An important distinction applies here: the initial Dijkstra test phase excludes Leios, which follows a separate development track. A testnet opening also does not establish a mainnet activation date.
Toto Finance’s copper reserve proposal presents a different test. The project seeks 22 million ADA from the treasury to acquire and tokenize physical copper, and the vote expires on November 15. Approval would commit ecosystem capital to a commodity investment whose outcome depends on costs, custody, and copper prices.
Regulatory work continues as well. The Cardano Foundation joined 5 other blockchain organizations to request a binding digital commodity definition within the SEC’s proposed rules. That request represents an effort to secure clearer treatment, rather than a completed regulatory decision.
Read Also: Analyst’s XRP Price Prediction Points to $1.20 as the Key Battleground
Programmable Tokens And Enterprise Applications Expand Cardano’s Uses
Cardano’s programmable token standard went live on October 7. CIP 0113 allows issuers to apply identity checks, transfer restrictions, and freeze controls to regulated native assets. Those features could support stablecoins, funds, and tokenized securities.
The x402 SDK integration also enables applications and AI agents to pay for services through web requests. Separately, Petrobras and the Cardano Foundation delivered applications related to sustainable aviation fuel and renewable diesel traceability. These developments expand practical uses without proving an immediate Cardano price recovery.
Amaru, an independent Rust node implementation, adds another development milestone. Intersect has described a Q4 2026 objective for mainnet block production. The specific October 27 beta date and November production schedule supplied for this article remain unconfirmed by the official update reviewed.
FAQs
Will Cardano ADA reach $10?
Cardano (ADA) trading well below $1 in 2026 makes reaching $10 highly improbable in the near term, according to mainstream algorithmic models and market analysts tracked by the Traders Union.
Where will Cardano be in 5 years?
Five years from now (around 2031), analytical models and market forecasts project Cardano (ADA) to trade between $0.14 and $0.38, depending on broader market cycles and network adoption.
Subscribe to our YouTube channel for daily crypto updates, market insights, and expert analysis.
The post Analyst Warns Cardano Price May Be Heading For A Final Flush! appeared first on CaptainAltcoin.
Analyst Warns Cardano Price May Be Heading for a Final Flush!
Cardano’s latest recovery is under pressure, and analyst V believes ADA could face another painful test before a lasting bottom develops. His warning comes as the project advances network upgrades and enterprise applications, which makes the contrast between development progress and price weakness worth a closer look.
The analyst, known as @finsends on X, questions whether Cardano price has completed its decline. His chart identifies a vulnerable technical structure that could decide what happens next.
Cardano Price Tests The Channel Behind Its Recovery
A look at the Cardano chart shows ADA near $0.2172 on the daily Coinbase timeframe. Price has returned to the lower boundary of an ascending channel after a rejection near its upper edge.
That channel has contained much of the recovery from the June low. ADA established progressively higher lows through July, August, and September before its October advance reached approximately $0.28.
The recovery has since lost ground. Cardano price fell below the marked resistance area around $0.255 to $0.259 and returned toward the rising support line near $0.215.
V’s concern centers on that support boundary. He described ADA as a prime candidate for another low and said a fall outside the channel could strengthen his bearish outlook.
The red circle marks the current support test. Recent candles extend beneath the boundary, although that alone cannot establish a sustained breakdown. A daily close below support followed by an unsuccessful recovery would provide stronger evidence.
@finsends / X A Cardano Price Breakdown Could Expose The June Low
The chart’s curved arrow projects a decline toward the horizontal red line around $0.138. That area corresponds closely to the June bottom and represents approximately 36% downside from the displayed price.
The arrow illustrates V’s bearish scenario rather than a guaranteed destination. Several price areas separate ADA from that potential retest:
$0.207 To $0.212: This marked zone represents the nearest horizontal support beneath the channel test.
$0.196 To $0.200: An earlier resistance area could become another support test.
Approximately $0.138: The June low anchors the projected final flush scenario.
A break below the channel would weaken the sequence of higher lows. Further losses through the horizontal support zones would give the downside projection more technical support.
The bullish alternative requires ADA to reclaim the channel and hold above its lower boundary. A recovery toward $0.23 would improve the immediate picture, although the marked $0.255 to $0.259 resistance zone remains a larger obstacle.
V also expressed interest in buying after another low. His view therefore leaves room for a later recovery, although the chart cannot confirm that any future decline would produce the final bottom.
Cardano Upgrades Continue Despite ADA Price Weakness
Cardano’s development activity provides useful context, but technical progress does not automatically create immediate demand for ADA.
DijkstraNet opened for public participation ahead of Node 11.2 and its planned protocol changes. An important distinction applies here: the initial Dijkstra test phase excludes Leios, which follows a separate development track. A testnet opening also does not establish a mainnet activation date.
Toto Finance’s copper reserve proposal presents a different test. The project seeks 22 million ADA from the treasury to acquire and tokenize physical copper, and the vote expires on November 15. Approval would commit ecosystem capital to a commodity investment whose outcome depends on costs, custody, and copper prices.
Regulatory work continues as well. The Cardano Foundation joined 5 other blockchain organizations to request a binding digital commodity definition within the SEC’s proposed rules. That request represents an effort to secure clearer treatment, rather than a completed regulatory decision.
Read Also: Analyst’s XRP Price Prediction Points to $1.20 as the Key Battleground
Programmable Tokens And Enterprise Applications Expand Cardano’s Uses
Cardano’s programmable token standard went live on October 7. CIP 0113 allows issuers to apply identity checks, transfer restrictions, and freeze controls to regulated native assets. Those features could support stablecoins, funds, and tokenized securities.
The x402 SDK integration also enables applications and AI agents to pay for services through web requests. Separately, Petrobras and the Cardano Foundation delivered applications related to sustainable aviation fuel and renewable diesel traceability. These developments expand practical uses without proving an immediate Cardano price recovery.
Amaru, an independent Rust node implementation, adds another development milestone. Intersect has described a Q4 2026 objective for mainnet block production. The specific October 27 beta date and November production schedule supplied for this article remain unconfirmed by the official update reviewed.
FAQs
Will Cardano ADA reach $10?
Cardano (ADA) trading well below $1 in 2026 makes reaching $10 highly improbable in the near term, according to mainstream algorithmic models and market analysts tracked by the Traders Union.
Where will Cardano be in 5 years?
Five years from now (around 2031), analytical models and market forecasts project Cardano (ADA) to trade between $0.14 and $0.38, depending on broader market cycles and network adoption.
Subscribe to our YouTube channel for daily crypto updates, market insights, and expert analysis.
The post Analyst Warns Cardano Price May Be Heading For A Final Flush! appeared first on CaptainAltcoin.
The analyst, known as @finsends on X, questions whether Cardano price has completed its decline. His chart identifies a vulnerable technical structure that could decide what happens next.
Cardano Price Tests The Channel Behind Its Recovery
A look at the Cardano chart shows ADA near $0.2172 on the daily Coinbase timeframe. Price has returned to the lower boundary of an ascending channel after a rejection near its upper edge.
That channel has contained much of the recovery from the June low. ADA established progressively higher lows through July, August, and September before its October advance reached approximately $0.28.
The recovery has since lost ground. Cardano price fell below the marked resistance area around $0.255 to $0.259 and returned toward the rising support line near $0.215.
V’s concern centers on that support boundary. He described ADA as a prime candidate for another low and said a fall outside the channel could strengthen his bearish outlook.
The red circle marks the current support test. Recent candles extend beneath the boundary, although that alone cannot establish a sustained breakdown. A daily close below support followed by an unsuccessful recovery would provide stronger evidence.
@finsends / X A Cardano Price Breakdown Could Expose The June Low
The chart’s curved arrow projects a decline toward the horizontal red line around $0.138. That area corresponds closely to the June bottom and represents approximately 36% downside from the displayed price.
The arrow illustrates V’s bearish scenario rather than a guaranteed destination. Several price areas separate ADA from that potential retest:
$0.207 To $0.212: This marked zone represents the nearest horizontal support beneath the channel test.
$0.196 To $0.200: An earlier resistance area could become another support test.
Approximately $0.138: The June low anchors the projected final flush scenario.
A break below the channel would weaken the sequence of higher lows. Further losses through the horizontal support zones would give the downside projection more technical support.
The bullish alternative requires ADA to reclaim the channel and hold above its lower boundary. A recovery toward $0.23 would improve the immediate picture, although the marked $0.255 to $0.259 resistance zone remains a larger obstacle.
V also expressed interest in buying after another low. His view therefore leaves room for a later recovery, although the chart cannot confirm that any future decline would produce the final bottom.
Cardano Upgrades Continue Despite ADA Price Weakness
Cardano’s development activity provides useful context, but technical progress does not automatically create immediate demand for ADA.
DijkstraNet opened for public participation ahead of Node 11.2 and its planned protocol changes. An important distinction applies here: the initial Dijkstra test phase excludes Leios, which follows a separate development track. A testnet opening also does not establish a mainnet activation date.
Toto Finance’s copper reserve proposal presents a different test. The project seeks 22 million ADA from the treasury to acquire and tokenize physical copper, and the vote expires on November 15. Approval would commit ecosystem capital to a commodity investment whose outcome depends on costs, custody, and copper prices.
Regulatory work continues as well. The Cardano Foundation joined 5 other blockchain organizations to request a binding digital commodity definition within the SEC’s proposed rules. That request represents an effort to secure clearer treatment, rather than a completed regulatory decision.
Read Also: Analyst’s XRP Price Prediction Points to $1.20 as the Key Battleground
Programmable Tokens And Enterprise Applications Expand Cardano’s Uses
Cardano’s programmable token standard went live on October 7. CIP 0113 allows issuers to apply identity checks, transfer restrictions, and freeze controls to regulated native assets. Those features could support stablecoins, funds, and tokenized securities.
The x402 SDK integration also enables applications and AI agents to pay for services through web requests. Separately, Petrobras and the Cardano Foundation delivered applications related to sustainable aviation fuel and renewable diesel traceability. These developments expand practical uses without proving an immediate Cardano price recovery.
Amaru, an independent Rust node implementation, adds another development milestone. Intersect has described a Q4 2026 objective for mainnet block production. The specific October 27 beta date and November production schedule supplied for this article remain unconfirmed by the official update reviewed.
FAQs
Will Cardano ADA reach $10?
Cardano (ADA) trading well below $1 in 2026 makes reaching $10 highly improbable in the near term, according to mainstream algorithmic models and market analysts tracked by the Traders Union.
Where will Cardano be in 5 years?
Five years from now (around 2031), analytical models and market forecasts project Cardano (ADA) to trade between $0.14 and $0.38, depending on broader market cycles and network adoption.
Subscribe to our YouTube channel for daily crypto updates, market insights, and expert analysis.
The post Analyst Warns Cardano Price May Be Heading For A Final Flush! appeared first on CaptainAltcoin.
397
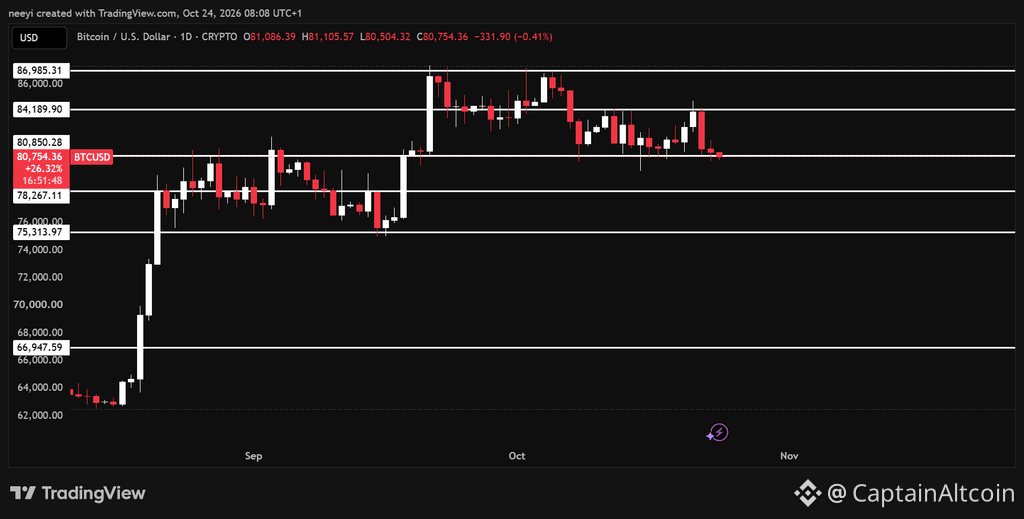
Article
Bitcoin Price Crash: Where Could BTC Find Its Next Bottom?Bitcoin’s struggle around a key support zone has put the next potential bottom back in focus. The supplied price analysis places BTC near a level that could decide whether the latest decline ends with a recovery or extends into a deeper correction.
Jayson Casper’s analysis offers several possible areas where buyers could return. Crypto Millie also presents a case for a correction within a broader bullish outlook. Neither view makes an immediate recovery certain, and the difference between a temporary bounce and a durable bottom will matter.
The clearest way to assess this Bitcoin price crash is to follow the support levels in order. Each failed defense would bring a lower target into play.
Bitcoin Price Faces A Crucial Test Around $80,500 To $80,600
Bitcoin price chart identifies $80,500 to $80,600 as the immediate support zone.
BTC is described as attempting to break below this area, although a decisive loss of support remains the condition for further downside.
That distinction matters because a brief move below support can reverse. A sustained breakdown would leave a weaker structure and make the next lower support more relevant.
BTC Price Chart / TradingView.com
The first downside target in this analysis is approximately $78,260. That level could come into play during the weekend if Bitcoin cannot recover the immediate support zone. The timing remains a scenario, and the price would still need to follow through below support.
A successful defense would keep a recovery toward $86,000 possible. Bitcoin therefore has 2 competing paths around the same area, and the reaction near $80,500 to $80,600 provides the first test.
Jayson Casper Identifies Lower Bitcoin Support Near $77,000 And $75,000
Jayson Casper’s video, “CRYPTO MARKET WARNING! Don’t Trust This Bitcoin Bounce Yet!”, also describes the possibility of another decline before a more convincing recovery.
Casper discusses a move below approximately $79,300 and identifies another potential support area around $76,000 to $77,000. His analysis uses Fibonacci levels and previous trading ranges to identify places where a reaction could develop.
Those levels broadly overlap with the lower support sequence in the accompanying analysis. They do not establish an exact bottom, but they help narrow the areas that could become relevant after an initial breakdown.
Casper also describes a possible move below $75,000 followed by a recovery above it. That would be a different outcome from Bitcoin losing $75,000 and remaining underneath it.
A quick reclaim could indicate that sellers failed to maintain control below support. Continued weakness beneath the same level would leave the deeper downside scenario open.
His central condition is confirmation through price behavior. Reaching a support level alone would not satisfy the requirements he describes for a potential entry.
Losing $75,000 Could Return BTC To Its Previous Trading Range
The accompanying analysis treats $75,000 as an important boundary. A failure there could send Bitcoin back into the $66,000 to $75,000 range identified in the brief as a previous trading area.
That outcome would carry a different implication from a short decline toward $78,260. Bitcoin could return to a broader sideways range instead of quickly resuming its recovery.
Casper’s deeper support discussion includes approximately $68,000, where he identifies potential confluence with an anchored VWAP band. This falls inside the lower range described in the accompanying analysis.
The main Bitcoin price scenarios can be organized as follows:
Holding $80,500 to $80,600 keeps a recovery toward $86,000 possible.
Losing that zone puts approximately $78,260 into focus first.
Further weakness brings $76,000 to $77,000 and $75,000 into consideration.
A sustained breakdown below $75,000 opens the deeper $66,000 to $75,000 scenario.
These are conditional levels rather than a forecast that every target must be reached. Buyers could interrupt the decline before Bitcoin tests the lowest area.
Read Also: Is Kaspa Really Dead? This Network Data Says Otherwise
Casper’s Broader Bitcoin Outlook Still Allows A Higher Low
Casper’s caution does not amount to a claim that Bitcoin must enter a prolonged bear market. His broader interpretation allows a substantial pullback to produce a higher low within an uptrend.
He describes bearish weekly signals alongside bullish signals across broader timeframes. His argument is that those conditions can coexist because a market can maintain a larger recovery structure and still undergo a painful correction.
Casper also discusses historical declines that followed the weekly signal he tracks. Those comparisons explain his caution, although they do not establish how far the next decline would travel.
His framework leaves room for a bounce near support, another failed recovery, or a deeper pullback before buyers regain control. A higher low remains his preferred broader possibility, but the immediate downside risk remains part of that outlook.
Crypto Millie Watches For Strength Near The 50 Week Average
Crypto Millie offers a more constructive interpretation of the correction in the supplied transcript. The analyst describes the weakness as related to leverage and continues to favor the broader crypto outlook.
That remains Millie’s assessment, and the transcript alone does not prove the cause of the selloff. More directly relevant to the bottom discussion is the emphasis on price strength near the 50 week moving average.
Millie describes waiting for a clearer reaction around that average before becoming more aggressive. This reinforces the importance of how Bitcoin responds at support rather than simply whether it reaches a familiar level.
Subscribe to our YouTube channel for daily crypto updates, market insights, and expert analysis.
The post Bitcoin Price Crash: Where Could BTC Find Its Next Bottom? appeared first on CaptainAltcoin.
Bitcoin Price Crash: Where Could BTC Find Its Next Bottom?
Bitcoin’s struggle around a key support zone has put the next potential bottom back in focus. The supplied price analysis places BTC near a level that could decide whether the latest decline ends with a recovery or extends into a deeper correction.
Jayson Casper’s analysis offers several possible areas where buyers could return. Crypto Millie also presents a case for a correction within a broader bullish outlook. Neither view makes an immediate recovery certain, and the difference between a temporary bounce and a durable bottom will matter.
The clearest way to assess this Bitcoin price crash is to follow the support levels in order. Each failed defense would bring a lower target into play.
Bitcoin Price Faces A Crucial Test Around $80,500 To $80,600
Bitcoin price chart identifies $80,500 to $80,600 as the immediate support zone.
BTC is described as attempting to break below this area, although a decisive loss of support remains the condition for further downside.
That distinction matters because a brief move below support can reverse. A sustained breakdown would leave a weaker structure and make the next lower support more relevant.
BTC Price Chart / TradingView.com
The first downside target in this analysis is approximately $78,260. That level could come into play during the weekend if Bitcoin cannot recover the immediate support zone. The timing remains a scenario, and the price would still need to follow through below support.
A successful defense would keep a recovery toward $86,000 possible. Bitcoin therefore has 2 competing paths around the same area, and the reaction near $80,500 to $80,600 provides the first test.
Jayson Casper Identifies Lower Bitcoin Support Near $77,000 And $75,000
Jayson Casper’s video, “CRYPTO MARKET WARNING! Don’t Trust This Bitcoin Bounce Yet!”, also describes the possibility of another decline before a more convincing recovery.
Casper discusses a move below approximately $79,300 and identifies another potential support area around $76,000 to $77,000. His analysis uses Fibonacci levels and previous trading ranges to identify places where a reaction could develop.
Those levels broadly overlap with the lower support sequence in the accompanying analysis. They do not establish an exact bottom, but they help narrow the areas that could become relevant after an initial breakdown.
Casper also describes a possible move below $75,000 followed by a recovery above it. That would be a different outcome from Bitcoin losing $75,000 and remaining underneath it.
A quick reclaim could indicate that sellers failed to maintain control below support. Continued weakness beneath the same level would leave the deeper downside scenario open.
His central condition is confirmation through price behavior. Reaching a support level alone would not satisfy the requirements he describes for a potential entry.
Losing $75,000 Could Return BTC To Its Previous Trading Range
The accompanying analysis treats $75,000 as an important boundary. A failure there could send Bitcoin back into the $66,000 to $75,000 range identified in the brief as a previous trading area.
That outcome would carry a different implication from a short decline toward $78,260. Bitcoin could return to a broader sideways range instead of quickly resuming its recovery.
Casper’s deeper support discussion includes approximately $68,000, where he identifies potential confluence with an anchored VWAP band. This falls inside the lower range described in the accompanying analysis.
The main Bitcoin price scenarios can be organized as follows:
Holding $80,500 to $80,600 keeps a recovery toward $86,000 possible.
Losing that zone puts approximately $78,260 into focus first.
Further weakness brings $76,000 to $77,000 and $75,000 into consideration.
A sustained breakdown below $75,000 opens the deeper $66,000 to $75,000 scenario.
These are conditional levels rather than a forecast that every target must be reached. Buyers could interrupt the decline before Bitcoin tests the lowest area.
Read Also: Is Kaspa Really Dead? This Network Data Says Otherwise
Casper’s Broader Bitcoin Outlook Still Allows A Higher Low
Casper’s caution does not amount to a claim that Bitcoin must enter a prolonged bear market. His broader interpretation allows a substantial pullback to produce a higher low within an uptrend.
He describes bearish weekly signals alongside bullish signals across broader timeframes. His argument is that those conditions can coexist because a market can maintain a larger recovery structure and still undergo a painful correction.
Casper also discusses historical declines that followed the weekly signal he tracks. Those comparisons explain his caution, although they do not establish how far the next decline would travel.
His framework leaves room for a bounce near support, another failed recovery, or a deeper pullback before buyers regain control. A higher low remains his preferred broader possibility, but the immediate downside risk remains part of that outlook.
Crypto Millie Watches For Strength Near The 50 Week Average
Crypto Millie offers a more constructive interpretation of the correction in the supplied transcript. The analyst describes the weakness as related to leverage and continues to favor the broader crypto outlook.
That remains Millie’s assessment, and the transcript alone does not prove the cause of the selloff. More directly relevant to the bottom discussion is the emphasis on price strength near the 50 week moving average.
Millie describes waiting for a clearer reaction around that average before becoming more aggressive. This reinforces the importance of how Bitcoin responds at support rather than simply whether it reaches a familiar level.
Subscribe to our YouTube channel for daily crypto updates, market insights, and expert analysis.
The post Bitcoin Price Crash: Where Could BTC Find Its Next Bottom? appeared first on CaptainAltcoin.
Jayson Casper’s analysis offers several possible areas where buyers could return. Crypto Millie also presents a case for a correction within a broader bullish outlook. Neither view makes an immediate recovery certain, and the difference between a temporary bounce and a durable bottom will matter.
The clearest way to assess this Bitcoin price crash is to follow the support levels in order. Each failed defense would bring a lower target into play.
Bitcoin Price Faces A Crucial Test Around $80,500 To $80,600
Bitcoin price chart identifies $80,500 to $80,600 as the immediate support zone.
BTC is described as attempting to break below this area, although a decisive loss of support remains the condition for further downside.
That distinction matters because a brief move below support can reverse. A sustained breakdown would leave a weaker structure and make the next lower support more relevant.
BTC Price Chart / TradingView.com
The first downside target in this analysis is approximately $78,260. That level could come into play during the weekend if Bitcoin cannot recover the immediate support zone. The timing remains a scenario, and the price would still need to follow through below support.
A successful defense would keep a recovery toward $86,000 possible. Bitcoin therefore has 2 competing paths around the same area, and the reaction near $80,500 to $80,600 provides the first test.
Jayson Casper Identifies Lower Bitcoin Support Near $77,000 And $75,000
Jayson Casper’s video, “CRYPTO MARKET WARNING! Don’t Trust This Bitcoin Bounce Yet!”, also describes the possibility of another decline before a more convincing recovery.
Casper discusses a move below approximately $79,300 and identifies another potential support area around $76,000 to $77,000. His analysis uses Fibonacci levels and previous trading ranges to identify places where a reaction could develop.
Those levels broadly overlap with the lower support sequence in the accompanying analysis. They do not establish an exact bottom, but they help narrow the areas that could become relevant after an initial breakdown.
Casper also describes a possible move below $75,000 followed by a recovery above it. That would be a different outcome from Bitcoin losing $75,000 and remaining underneath it.
A quick reclaim could indicate that sellers failed to maintain control below support. Continued weakness beneath the same level would leave the deeper downside scenario open.
His central condition is confirmation through price behavior. Reaching a support level alone would not satisfy the requirements he describes for a potential entry.
Losing $75,000 Could Return BTC To Its Previous Trading Range
The accompanying analysis treats $75,000 as an important boundary. A failure there could send Bitcoin back into the $66,000 to $75,000 range identified in the brief as a previous trading area.
That outcome would carry a different implication from a short decline toward $78,260. Bitcoin could return to a broader sideways range instead of quickly resuming its recovery.
Casper’s deeper support discussion includes approximately $68,000, where he identifies potential confluence with an anchored VWAP band. This falls inside the lower range described in the accompanying analysis.
The main Bitcoin price scenarios can be organized as follows:
Holding $80,500 to $80,600 keeps a recovery toward $86,000 possible.
Losing that zone puts approximately $78,260 into focus first.
Further weakness brings $76,000 to $77,000 and $75,000 into consideration.
A sustained breakdown below $75,000 opens the deeper $66,000 to $75,000 scenario.
These are conditional levels rather than a forecast that every target must be reached. Buyers could interrupt the decline before Bitcoin tests the lowest area.
Read Also: Is Kaspa Really Dead? This Network Data Says Otherwise
Casper’s Broader Bitcoin Outlook Still Allows A Higher Low
Casper’s caution does not amount to a claim that Bitcoin must enter a prolonged bear market. His broader interpretation allows a substantial pullback to produce a higher low within an uptrend.
He describes bearish weekly signals alongside bullish signals across broader timeframes. His argument is that those conditions can coexist because a market can maintain a larger recovery structure and still undergo a painful correction.
Casper also discusses historical declines that followed the weekly signal he tracks. Those comparisons explain his caution, although they do not establish how far the next decline would travel.
His framework leaves room for a bounce near support, another failed recovery, or a deeper pullback before buyers regain control. A higher low remains his preferred broader possibility, but the immediate downside risk remains part of that outlook.
Crypto Millie Watches For Strength Near The 50 Week Average
Crypto Millie offers a more constructive interpretation of the correction in the supplied transcript. The analyst describes the weakness as related to leverage and continues to favor the broader crypto outlook.
That remains Millie’s assessment, and the transcript alone does not prove the cause of the selloff. More directly relevant to the bottom discussion is the emphasis on price strength near the 50 week moving average.
Millie describes waiting for a clearer reaction around that average before becoming more aggressive. This reinforces the importance of how Bitcoin responds at support rather than simply whether it reaches a familiar level.
Subscribe to our YouTube channel for daily crypto updates, market insights, and expert analysis.
The post Bitcoin Price Crash: Where Could BTC Find Its Next Bottom? appeared first on CaptainAltcoin.
177
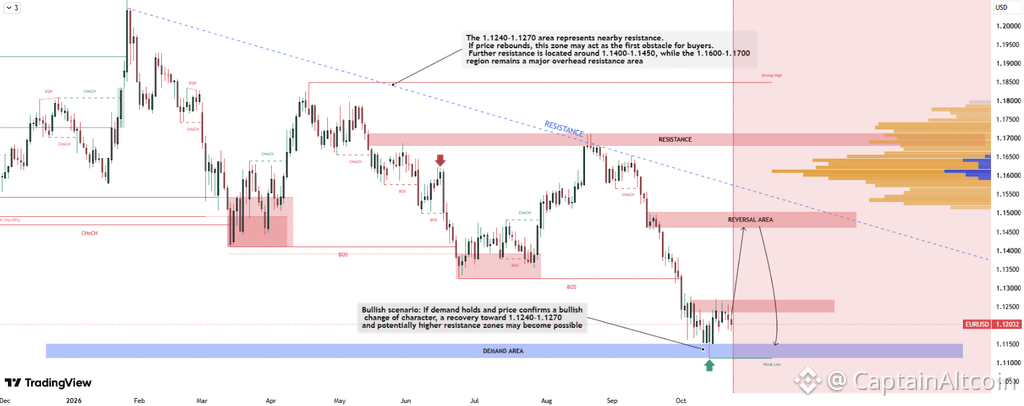
Article
EUR/USD Price Prediction: Analyst Warns of More Downside Before a ReboundEUR/USD is trading near 1.12 after another leg lower, but analyst Daniel Carter believes the pair may be approaching an area where buyers could attempt a recovery.
His TradingView chart is titled “EURUSD Bearish Pullback Toward Key Support & Potential Recovery,” and that captures the setup well.
The broader trend is still bearish, but EUR/USD price has now moved into a demand zone that previously attracted buyers. Carter’s chart therefore does not call for an immediate reversal. It maps a scenario where EUR/USD first holds support, confirms a change in character, and only then begins a larger rebound.
Daniel Carter’s EUR/USD Chart Shows a Critical Demand Zone
The most important area on the chart is the blue demand zone around roughly 1.11-1.115.
EUR/USD has already dropped into this region after breaking a series of short-term support levels during October.
Carter’s chart also marks a recent weak low near the bottom of that demand zone.
This is important because the bullish scenario depends on price defending that area.
The chart notes that if demand holds and EUR/USD confirms a bullish change of character, a recovery toward 1.1240-1.1270 becomes possible.
That is the first upside zone I would watch as well.
There is then another resistance area around 1.1450-1.1500.
Source: tradingview.com/ideas
Above that, Carter marks a larger resistance band around 1.16-1.17, which also aligns with a descending trendline that has capped EUR/USD for months.
The chart therefore maps a clear progression:
1.11 support holds → 1.1240-1.1270 → 1.1450-1.1500 → 1.16-1.17.
The broader bearish structure does not disappear unless EUR/USD starts reclaiming these levels.
EUR/USD Price Forecast: What Would Confirm or Invalidate the Rebound?
The current price near 1.12 is still below several broken support areas.
That means the pair has not confirmed a reversal yet.
The first bullish signal would be a clear reaction from the demand zone followed by a higher low and a move back above roughly 1.1240-1.1270.
If that happens, the recovery scenario becomes more credible.
The stronger confirmation would come above 1.1450-1.1500.
A break through that region would suggest EUR/USD is no longer simply producing a relief bounce inside a broader downtrend.
The bearish scenario is simpler.
If the 1.11 demand zone fails cleanly, the chart loses its main bullish foundation.
That would leave EUR/USD vulnerable to another leg lower, with the market needing to establish a new support area beneath the current range.
So the setup is not “EUR/USD has bottomed.”
It is “EUR/USD is testing the area where a bottom could begin to form.”
Macro Factors That Could Move EUR/USD Next
The macro backdrop still favors the dollar more than the euro.
The Federal Reserve is expected to keep rates unchanged at its October 28 meeting, but economists still broadly expect another increase in December. Persistent inflation and expensive energy continue to support that higher-for-longer outlook.
The euro has its own problems.
French fiscal and political stress has pushed French borrowing costs higher relative to Germany, creating additional pressure on the single currency. EUR/USD recently traded near 1.119 as investors focused on widening French bond spreads and political uncertainty.
The ECB also meets next week and is expected to hold rates steady, but the euro area is dealing with weaker growth momentum and slower business activity.
That means EUR/USD enters the weekend with a fairly clear macro imbalance:
The Fed remains relatively hawkish
U.S. rates remain higher than euro-area rates
French fiscal risk is hurting the euro
Euro-area growth remains soft
Both the Fed and ECB decisions arrive next week
From a macro perspective, that makes a large sustained EUR/USD rally harder to justify immediately.
From a technical perspective, however, the pair is now close enough to Carter’s demand zone that a short-term recovery attempt would not be surprising.
For now, I would watch 1.11 on the downside and 1.1240-1.1270 on the upside.
A defense of 1.11 keeps the rebound scenario alive.
A break below it would tell us the bearish move still has more room.
For more financial news and price predictions, click here.
Subscribe to our YouTube channel for daily crypto updates, market insights, and expert analysis.
The post EUR/USD Price Prediction: Analyst Warns of More Downside Before a Rebound appeared first on CaptainAltcoin.
EUR/USD Price Prediction: Analyst Warns of More Downside Before a Rebound
EUR/USD is trading near 1.12 after another leg lower, but analyst Daniel Carter believes the pair may be approaching an area where buyers could attempt a recovery.
His TradingView chart is titled “EURUSD Bearish Pullback Toward Key Support & Potential Recovery,” and that captures the setup well.
The broader trend is still bearish, but EUR/USD price has now moved into a demand zone that previously attracted buyers. Carter’s chart therefore does not call for an immediate reversal. It maps a scenario where EUR/USD first holds support, confirms a change in character, and only then begins a larger rebound.
Daniel Carter’s EUR/USD Chart Shows a Critical Demand Zone
The most important area on the chart is the blue demand zone around roughly 1.11-1.115.
EUR/USD has already dropped into this region after breaking a series of short-term support levels during October.
Carter’s chart also marks a recent weak low near the bottom of that demand zone.
This is important because the bullish scenario depends on price defending that area.
The chart notes that if demand holds and EUR/USD confirms a bullish change of character, a recovery toward 1.1240-1.1270 becomes possible.
That is the first upside zone I would watch as well.
There is then another resistance area around 1.1450-1.1500.
Source: tradingview.com/ideas
Above that, Carter marks a larger resistance band around 1.16-1.17, which also aligns with a descending trendline that has capped EUR/USD for months.
The chart therefore maps a clear progression:
1.11 support holds → 1.1240-1.1270 → 1.1450-1.1500 → 1.16-1.17.
The broader bearish structure does not disappear unless EUR/USD starts reclaiming these levels.
EUR/USD Price Forecast: What Would Confirm or Invalidate the Rebound?
The current price near 1.12 is still below several broken support areas.
That means the pair has not confirmed a reversal yet.
The first bullish signal would be a clear reaction from the demand zone followed by a higher low and a move back above roughly 1.1240-1.1270.
If that happens, the recovery scenario becomes more credible.
The stronger confirmation would come above 1.1450-1.1500.
A break through that region would suggest EUR/USD is no longer simply producing a relief bounce inside a broader downtrend.
The bearish scenario is simpler.
If the 1.11 demand zone fails cleanly, the chart loses its main bullish foundation.
That would leave EUR/USD vulnerable to another leg lower, with the market needing to establish a new support area beneath the current range.
So the setup is not “EUR/USD has bottomed.”
It is “EUR/USD is testing the area where a bottom could begin to form.”
Macro Factors That Could Move EUR/USD Next
The macro backdrop still favors the dollar more than the euro.
The Federal Reserve is expected to keep rates unchanged at its October 28 meeting, but economists still broadly expect another increase in December. Persistent inflation and expensive energy continue to support that higher-for-longer outlook.
The euro has its own problems.
French fiscal and political stress has pushed French borrowing costs higher relative to Germany, creating additional pressure on the single currency. EUR/USD recently traded near 1.119 as investors focused on widening French bond spreads and political uncertainty.
The ECB also meets next week and is expected to hold rates steady, but the euro area is dealing with weaker growth momentum and slower business activity.
That means EUR/USD enters the weekend with a fairly clear macro imbalance:
The Fed remains relatively hawkish
U.S. rates remain higher than euro-area rates
French fiscal risk is hurting the euro
Euro-area growth remains soft
Both the Fed and ECB decisions arrive next week
From a macro perspective, that makes a large sustained EUR/USD rally harder to justify immediately.
From a technical perspective, however, the pair is now close enough to Carter’s demand zone that a short-term recovery attempt would not be surprising.
For now, I would watch 1.11 on the downside and 1.1240-1.1270 on the upside.
A defense of 1.11 keeps the rebound scenario alive.
A break below it would tell us the bearish move still has more room.
For more financial news and price predictions, click here.
Subscribe to our YouTube channel for daily crypto updates, market insights, and expert analysis.
The post EUR/USD Price Prediction: Analyst Warns of More Downside Before a Rebound appeared first on CaptainAltcoin.
His TradingView chart is titled “EURUSD Bearish Pullback Toward Key Support & Potential Recovery,” and that captures the setup well.
The broader trend is still bearish, but EUR/USD price has now moved into a demand zone that previously attracted buyers. Carter’s chart therefore does not call for an immediate reversal. It maps a scenario where EUR/USD first holds support, confirms a change in character, and only then begins a larger rebound.
Daniel Carter’s EUR/USD Chart Shows a Critical Demand Zone
The most important area on the chart is the blue demand zone around roughly 1.11-1.115.
EUR/USD has already dropped into this region after breaking a series of short-term support levels during October.
Carter’s chart also marks a recent weak low near the bottom of that demand zone.
This is important because the bullish scenario depends on price defending that area.
The chart notes that if demand holds and EUR/USD confirms a bullish change of character, a recovery toward 1.1240-1.1270 becomes possible.
That is the first upside zone I would watch as well.
There is then another resistance area around 1.1450-1.1500.
Source: tradingview.com/ideas
Above that, Carter marks a larger resistance band around 1.16-1.17, which also aligns with a descending trendline that has capped EUR/USD for months.
The chart therefore maps a clear progression:
1.11 support holds → 1.1240-1.1270 → 1.1450-1.1500 → 1.16-1.17.
The broader bearish structure does not disappear unless EUR/USD starts reclaiming these levels.
EUR/USD Price Forecast: What Would Confirm or Invalidate the Rebound?
The current price near 1.12 is still below several broken support areas.
That means the pair has not confirmed a reversal yet.
The first bullish signal would be a clear reaction from the demand zone followed by a higher low and a move back above roughly 1.1240-1.1270.
If that happens, the recovery scenario becomes more credible.
The stronger confirmation would come above 1.1450-1.1500.
A break through that region would suggest EUR/USD is no longer simply producing a relief bounce inside a broader downtrend.
The bearish scenario is simpler.
If the 1.11 demand zone fails cleanly, the chart loses its main bullish foundation.
That would leave EUR/USD vulnerable to another leg lower, with the market needing to establish a new support area beneath the current range.
So the setup is not “EUR/USD has bottomed.”
It is “EUR/USD is testing the area where a bottom could begin to form.”
Macro Factors That Could Move EUR/USD Next
The macro backdrop still favors the dollar more than the euro.
The Federal Reserve is expected to keep rates unchanged at its October 28 meeting, but economists still broadly expect another increase in December. Persistent inflation and expensive energy continue to support that higher-for-longer outlook.
The euro has its own problems.
French fiscal and political stress has pushed French borrowing costs higher relative to Germany, creating additional pressure on the single currency. EUR/USD recently traded near 1.119 as investors focused on widening French bond spreads and political uncertainty.
The ECB also meets next week and is expected to hold rates steady, but the euro area is dealing with weaker growth momentum and slower business activity.
That means EUR/USD enters the weekend with a fairly clear macro imbalance:
The Fed remains relatively hawkish
U.S. rates remain higher than euro-area rates
French fiscal risk is hurting the euro
Euro-area growth remains soft
Both the Fed and ECB decisions arrive next week
From a macro perspective, that makes a large sustained EUR/USD rally harder to justify immediately.
From a technical perspective, however, the pair is now close enough to Carter’s demand zone that a short-term recovery attempt would not be surprising.
For now, I would watch 1.11 on the downside and 1.1240-1.1270 on the upside.
A defense of 1.11 keeps the rebound scenario alive.
A break below it would tell us the bearish move still has more room.
For more financial news and price predictions, click here.
Subscribe to our YouTube channel for daily crypto updates, market insights, and expert analysis.
The post EUR/USD Price Prediction: Analyst Warns of More Downside Before a Rebound appeared first on CaptainAltcoin.
1
336
Why Is the Crypto Market Down Today (October 24)?The crypto market is back under pressure on October 24, with Bitcoin trading around $80,650 and most large-cap altcoins moving lower alongside it.
Ethereum is near $2,375, XRP around $1.28 and Solana close to $102. Bitcoin is down roughly 1% over the latest 24-hour period, but several altcoins have performed worse, which has pushed Bitcoin dominance higher.
The decline is not being driven by one crypto-specific headline.
Oil prices, inflation concerns, ETF withdrawals and another round of leveraged liquidations are all weighing on the market at the same time.
Oil Above $100 Is Becoming a Problem for Bitcoin
One of the biggest macro pressures remains oil.
Brent crude has been trading above $100 and recently moved as high as roughly $116 as Middle East supply risks remained elevated.
That matters for Bitcoin because higher oil can feed inflation.
More expensive energy raises transportation and production costs across the economy. If that keeps inflation elevated, the Federal Reserve has less room to reduce interest rates and may need to maintain restrictive policy for longer.
That is generally difficult for risk assets.
Bitcoin does not react mechanically to every move in crude oil, but the transmission mechanism is fairly straightforward:
Higher oil → stronger inflation pressure → higher interest-rate expectations → tighter liquidity → more pressure on BTC and other speculative assets.
This is also why we recently looked at the long-term Bitcoin versus Brent relationship. Periods of sustained strength in crude have often coincided with weaker Bitcoin momentum.
As long as Brent remains above $100, that macro pressure is unlikely to disappear quickly.
Bitcoin Dominance Is Rising as Altcoins Take More Damage
Bitcoin dominance has moved to approximately 60.05%.
That means Bitcoin now represents around 60% of the total cryptocurrency market capitalization.
This does not mean rising dominance itself is causing the market decline.
Instead, it tells us where investors are positioning during the selloff.
Bitcoin is falling, but many altcoins are falling faster.
The current snapshot shows ETH down around 2% over 24 hours, XRP close to 1.5% lower, Solana down more than 2%, and Hyperliquid down over 3%.
When traders become more defensive, capital often rotates away from smaller and higher-risk cryptocurrencies toward BTC, stablecoins or cash.
A 60% Bitcoin dominance reading therefore reinforces the idea that the current environment is still risk-off for altcoins.
Liquidations Are Adding Fuel to the Selloff
Leverage is making the move worse.
Around $87-$91 million in Bitcoin positions were liquidated during the latest 24-hour period, with the overwhelming majority coming from longs. One liquidation tracker showed roughly $79 million in BTC longs closed compared with only about $8 million in shorts.
That distinction is important.
When leveraged long positions are liquidated, exchanges automatically sell the position.
If enough liquidations happen together, those forced sales can push Bitcoin lower, which then triggers additional liquidation levels.
That creates a feedback loop:
BTC falls → leveraged longs are liquidated → forced selling increases → BTC falls further.
So liquidations probably did not start today’s weakness, but they can amplify it once the market begins moving lower.
Read also: Claude AI Predicts Bitcoin and XRP Price If Oil Reaches $130
ETF Outflows Are Another Warning Sign
Institutional flows have also deteriorated.
U.S. spot Bitcoin ETFs recorded approximately $635.6 million in net withdrawals on October 22, their largest daily outflow since June. BlackRock’s IBIT alone lost roughly $254 million, with Fidelity and ARK products also recording substantial withdrawals.
That reversal was notable because the funds had attracted more than $1 billion across the preceding few sessions.
Ethereum funds are struggling as well.
Spot ETH ETFs lost roughly $110 million during the same session, and October withdrawals have already exceeded $1 billion.
ETF flows can change quickly, so one or two bad sessions do not automatically establish a long-term trend.
But when falling prices, macro uncertainty and ETF withdrawals occur together, there is less fresh demand available to absorb selling.
Why the Crypto Market Is Down Today
There are therefore several pressures acting on crypto simultaneously:
Brent crude remains above $100, keeping inflation fears alive
Markets remain concerned about higher-for-longer interest rates
Bitcoin ETF flows have turned negative again
BTC long liquidations are amplifying the decline
Bitcoin dominance near 60% shows altcoins are taking heavier damage
Weakness across technology and other risk assets is reducing appetite for speculative trades
Bitcoin around $80,000-$81,000 is now especially important.
If BTC can continue defending that area, the market could remain in consolidation rather than entering another deeper selloff.
A clean loss of $80,000 would be more concerning because it could expose the recent lows around $79,000 and potentially trigger another round of leveraged selling.
For now, the crypto market does not appear to be reacting to one catastrophic event.
It is dealing with a combination of expensive oil, restrictive macro conditions, weakening institutional flows and too much leverage.
And until at least one of those pressures begins to ease, Bitcoin and the broader crypto market may continue struggling to build a convincing recovery.
For more crypto news and price predictions, click here.
Subscribe to our YouTube channel for daily crypto updates, market insights, and expert analysis.
The post Why Is the Crypto Market Down Today (October 24)? appeared first on CaptainAltcoin.
Why Is the Crypto Market Down Today (October 24)?
The crypto market is back under pressure on October 24, with Bitcoin trading around $80,650 and most large-cap altcoins moving lower alongside it.
Ethereum is near $2,375, XRP around $1.28 and Solana close to $102. Bitcoin is down roughly 1% over the latest 24-hour period, but several altcoins have performed worse, which has pushed Bitcoin dominance higher.
The decline is not being driven by one crypto-specific headline.
Oil prices, inflation concerns, ETF withdrawals and another round of leveraged liquidations are all weighing on the market at the same time.
Oil Above $100 Is Becoming a Problem for Bitcoin
One of the biggest macro pressures remains oil.
Brent crude has been trading above $100 and recently moved as high as roughly $116 as Middle East supply risks remained elevated.
That matters for Bitcoin because higher oil can feed inflation.
More expensive energy raises transportation and production costs across the economy. If that keeps inflation elevated, the Federal Reserve has less room to reduce interest rates and may need to maintain restrictive policy for longer.
That is generally difficult for risk assets.
Bitcoin does not react mechanically to every move in crude oil, but the transmission mechanism is fairly straightforward:
Higher oil → stronger inflation pressure → higher interest-rate expectations → tighter liquidity → more pressure on BTC and other speculative assets.
This is also why we recently looked at the long-term Bitcoin versus Brent relationship. Periods of sustained strength in crude have often coincided with weaker Bitcoin momentum.
As long as Brent remains above $100, that macro pressure is unlikely to disappear quickly.
Bitcoin Dominance Is Rising as Altcoins Take More Damage
Bitcoin dominance has moved to approximately 60.05%.
That means Bitcoin now represents around 60% of the total cryptocurrency market capitalization.
This does not mean rising dominance itself is causing the market decline.
Instead, it tells us where investors are positioning during the selloff.
Bitcoin is falling, but many altcoins are falling faster.
The current snapshot shows ETH down around 2% over 24 hours, XRP close to 1.5% lower, Solana down more than 2%, and Hyperliquid down over 3%.
When traders become more defensive, capital often rotates away from smaller and higher-risk cryptocurrencies toward BTC, stablecoins or cash.
A 60% Bitcoin dominance reading therefore reinforces the idea that the current environment is still risk-off for altcoins.
Liquidations Are Adding Fuel to the Selloff
Leverage is making the move worse.
Around $87-$91 million in Bitcoin positions were liquidated during the latest 24-hour period, with the overwhelming majority coming from longs. One liquidation tracker showed roughly $79 million in BTC longs closed compared with only about $8 million in shorts.
That distinction is important.
When leveraged long positions are liquidated, exchanges automatically sell the position.
If enough liquidations happen together, those forced sales can push Bitcoin lower, which then triggers additional liquidation levels.
That creates a feedback loop:
BTC falls → leveraged longs are liquidated → forced selling increases → BTC falls further.
So liquidations probably did not start today’s weakness, but they can amplify it once the market begins moving lower.
Read also: Claude AI Predicts Bitcoin and XRP Price If Oil Reaches $130
ETF Outflows Are Another Warning Sign
Institutional flows have also deteriorated.
U.S. spot Bitcoin ETFs recorded approximately $635.6 million in net withdrawals on October 22, their largest daily outflow since June. BlackRock’s IBIT alone lost roughly $254 million, with Fidelity and ARK products also recording substantial withdrawals.
That reversal was notable because the funds had attracted more than $1 billion across the preceding few sessions.
Ethereum funds are struggling as well.
Spot ETH ETFs lost roughly $110 million during the same session, and October withdrawals have already exceeded $1 billion.
ETF flows can change quickly, so one or two bad sessions do not automatically establish a long-term trend.
But when falling prices, macro uncertainty and ETF withdrawals occur together, there is less fresh demand available to absorb selling.
Why the Crypto Market Is Down Today
There are therefore several pressures acting on crypto simultaneously:
Brent crude remains above $100, keeping inflation fears alive
Markets remain concerned about higher-for-longer interest rates
Bitcoin ETF flows have turned negative again
BTC long liquidations are amplifying the decline
Bitcoin dominance near 60% shows altcoins are taking heavier damage
Weakness across technology and other risk assets is reducing appetite for speculative trades
Bitcoin around $80,000-$81,000 is now especially important.
If BTC can continue defending that area, the market could remain in consolidation rather than entering another deeper selloff.
A clean loss of $80,000 would be more concerning because it could expose the recent lows around $79,000 and potentially trigger another round of leveraged selling.
For now, the crypto market does not appear to be reacting to one catastrophic event.
It is dealing with a combination of expensive oil, restrictive macro conditions, weakening institutional flows and too much leverage.
And until at least one of those pressures begins to ease, Bitcoin and the broader crypto market may continue struggling to build a convincing recovery.
For more crypto news and price predictions, click here.
Subscribe to our YouTube channel for daily crypto updates, market insights, and expert analysis.
The post Why Is the Crypto Market Down Today (October 24)? appeared first on CaptainAltcoin.
Ethereum is near $2,375, XRP around $1.28 and Solana close to $102. Bitcoin is down roughly 1% over the latest 24-hour period, but several altcoins have performed worse, which has pushed Bitcoin dominance higher.
The decline is not being driven by one crypto-specific headline.
Oil prices, inflation concerns, ETF withdrawals and another round of leveraged liquidations are all weighing on the market at the same time.
Oil Above $100 Is Becoming a Problem for Bitcoin
One of the biggest macro pressures remains oil.
Brent crude has been trading above $100 and recently moved as high as roughly $116 as Middle East supply risks remained elevated.
That matters for Bitcoin because higher oil can feed inflation.
More expensive energy raises transportation and production costs across the economy. If that keeps inflation elevated, the Federal Reserve has less room to reduce interest rates and may need to maintain restrictive policy for longer.
That is generally difficult for risk assets.
Bitcoin does not react mechanically to every move in crude oil, but the transmission mechanism is fairly straightforward:
Higher oil → stronger inflation pressure → higher interest-rate expectations → tighter liquidity → more pressure on BTC and other speculative assets.
This is also why we recently looked at the long-term Bitcoin versus Brent relationship. Periods of sustained strength in crude have often coincided with weaker Bitcoin momentum.
As long as Brent remains above $100, that macro pressure is unlikely to disappear quickly.
Bitcoin Dominance Is Rising as Altcoins Take More Damage
Bitcoin dominance has moved to approximately 60.05%.
That means Bitcoin now represents around 60% of the total cryptocurrency market capitalization.
This does not mean rising dominance itself is causing the market decline.
Instead, it tells us where investors are positioning during the selloff.
Bitcoin is falling, but many altcoins are falling faster.
The current snapshot shows ETH down around 2% over 24 hours, XRP close to 1.5% lower, Solana down more than 2%, and Hyperliquid down over 3%.
When traders become more defensive, capital often rotates away from smaller and higher-risk cryptocurrencies toward BTC, stablecoins or cash.
A 60% Bitcoin dominance reading therefore reinforces the idea that the current environment is still risk-off for altcoins.
Liquidations Are Adding Fuel to the Selloff
Leverage is making the move worse.
Around $87-$91 million in Bitcoin positions were liquidated during the latest 24-hour period, with the overwhelming majority coming from longs. One liquidation tracker showed roughly $79 million in BTC longs closed compared with only about $8 million in shorts.
That distinction is important.
When leveraged long positions are liquidated, exchanges automatically sell the position.
If enough liquidations happen together, those forced sales can push Bitcoin lower, which then triggers additional liquidation levels.
That creates a feedback loop:
BTC falls → leveraged longs are liquidated → forced selling increases → BTC falls further.
So liquidations probably did not start today’s weakness, but they can amplify it once the market begins moving lower.
Read also: Claude AI Predicts Bitcoin and XRP Price If Oil Reaches $130
ETF Outflows Are Another Warning Sign
Institutional flows have also deteriorated.
U.S. spot Bitcoin ETFs recorded approximately $635.6 million in net withdrawals on October 22, their largest daily outflow since June. BlackRock’s IBIT alone lost roughly $254 million, with Fidelity and ARK products also recording substantial withdrawals.
That reversal was notable because the funds had attracted more than $1 billion across the preceding few sessions.
Ethereum funds are struggling as well.
Spot ETH ETFs lost roughly $110 million during the same session, and October withdrawals have already exceeded $1 billion.
ETF flows can change quickly, so one or two bad sessions do not automatically establish a long-term trend.
But when falling prices, macro uncertainty and ETF withdrawals occur together, there is less fresh demand available to absorb selling.
Why the Crypto Market Is Down Today
There are therefore several pressures acting on crypto simultaneously:
Brent crude remains above $100, keeping inflation fears alive
Markets remain concerned about higher-for-longer interest rates
Bitcoin ETF flows have turned negative again
BTC long liquidations are amplifying the decline
Bitcoin dominance near 60% shows altcoins are taking heavier damage
Weakness across technology and other risk assets is reducing appetite for speculative trades
Bitcoin around $80,000-$81,000 is now especially important.
If BTC can continue defending that area, the market could remain in consolidation rather than entering another deeper selloff.
A clean loss of $80,000 would be more concerning because it could expose the recent lows around $79,000 and potentially trigger another round of leveraged selling.
For now, the crypto market does not appear to be reacting to one catastrophic event.
It is dealing with a combination of expensive oil, restrictive macro conditions, weakening institutional flows and too much leverage.
And until at least one of those pressures begins to ease, Bitcoin and the broader crypto market may continue struggling to build a convincing recovery.
For more crypto news and price predictions, click here.
Subscribe to our YouTube channel for daily crypto updates, market insights, and expert analysis.
The post Why Is the Crypto Market Down Today (October 24)? appeared first on CaptainAltcoin.
1.4k
Log in to explore more content
Join global crypto users on Binance Square
⚡️ Get latest and useful information about crypto.
💬 Trusted by the world’s largest crypto exchange.
👍 Discover real insights from verified creators.
Email / Phone number
Trending Topics
BinancePick
2.6M views
140,847 Discussing
Join #EarningsSeason: Predict Earnings on Binance Pick, Share Your Take on Binance Square!
Binance Square Official
·401 Likes
·338.2k views
EarningsSeason
5M views
24,284 Discussing
FranklinTempletonFilesForTwoDividendToBitcoinETFs
680 views
57 Discussing