
若兮-Aurora
1.4k Posts

若兮-Aurora
Report
Block User
公众号:金析若兮 七年合约实盘经验,精通趋势分析与风控体系。用数据和策略驱动每一次交易决策
5 Following
1.0K+ Followers
792 Liked
Posts
Portfolio
All
Quotes
Videos
PINNED
·
--
Are you always missing out on big market moves? Can't time your entries right, and exiting at profit feels chaotic and nerve-wracking, leaving you stuck in losses or out of sync, forced to suffer anxiety alone?
No more struggling alone! Whether you want to discuss market trends, share practical strategies, vent about market pitfalls, or seek advice on getting out of tough spots, come join the Binance Chat Room—gather with others to find direction and avoid risks. It’s far more reliable than figuring it out by yourself!
$BTC $ETH $SOL #Market correction in crypto
Are you always missing out on big market moves? Can't time your entries right, and exiting at profit feels chaotic and nerve-wracking, leaving you stuck in losses or out of sync, forced to suffer anxiety alone?
No more struggling alone! Whether you want to discuss market trends, share practical strategies, vent about market pitfalls, or seek advice on getting out of tough spots, come join the Binance Chat Room—gather with others to find direction and avoid risks. It’s far more reliable than figuring it out by yourself!
$BTC $ETH $SOL #Market correction in crypto
No more struggling alone! Whether you want to discuss market trends, share practical strategies, vent about market pitfalls, or seek advice on getting out of tough spots, come join the Binance Chat Room—gather with others to find direction and avoid risks. It’s far more reliable than figuring it out by yourself!
$BTC $ETH $SOL #Market correction in crypto


1
1.3k
PINNED
·
--
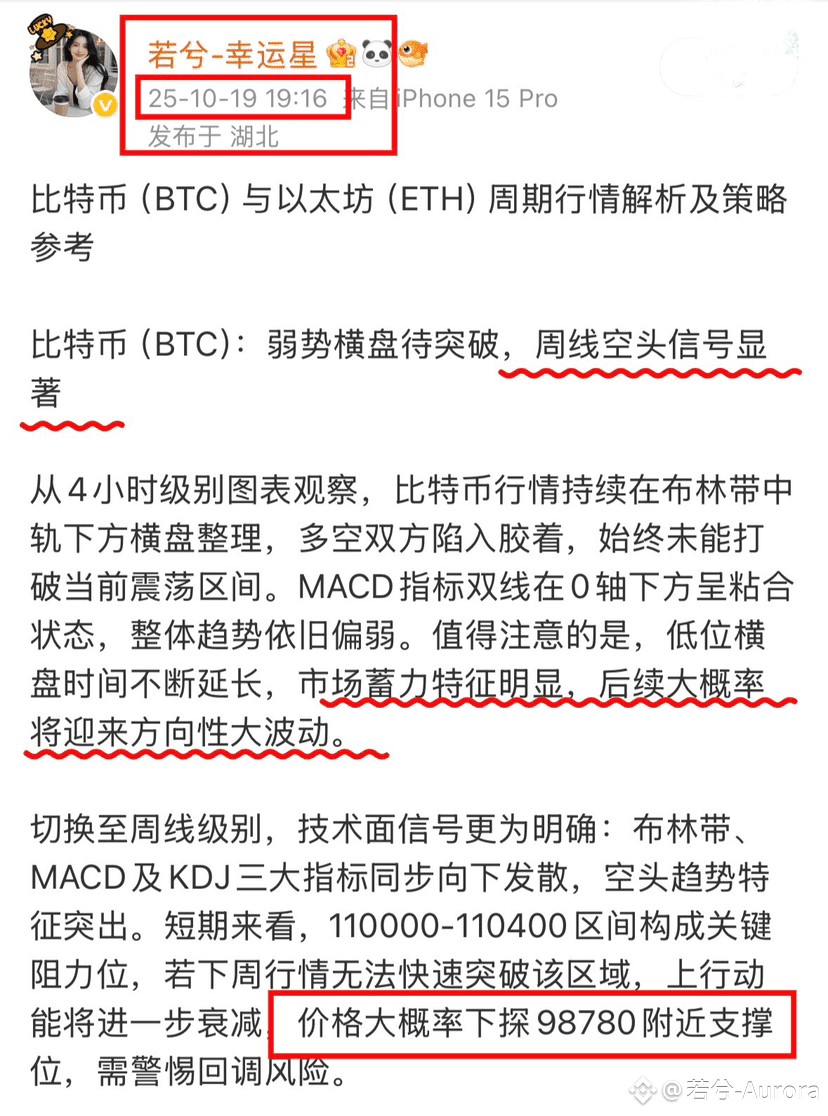
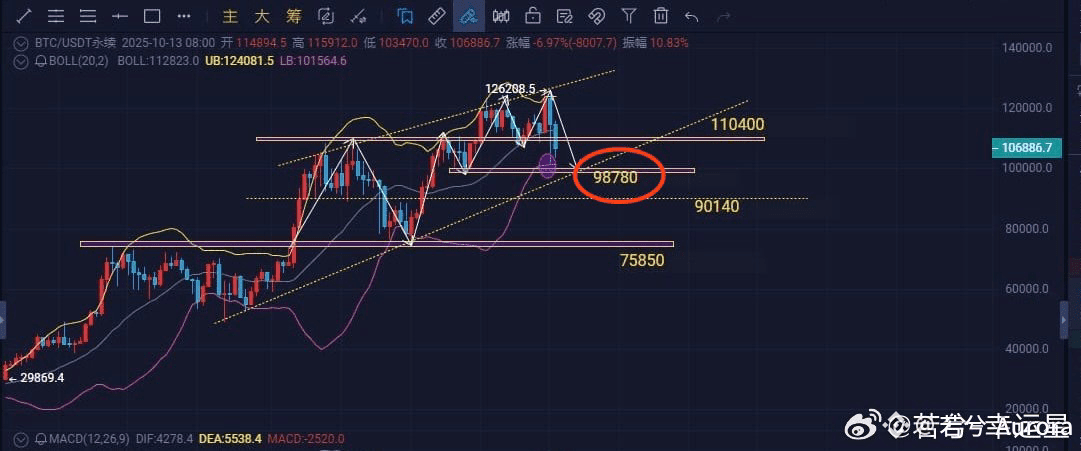
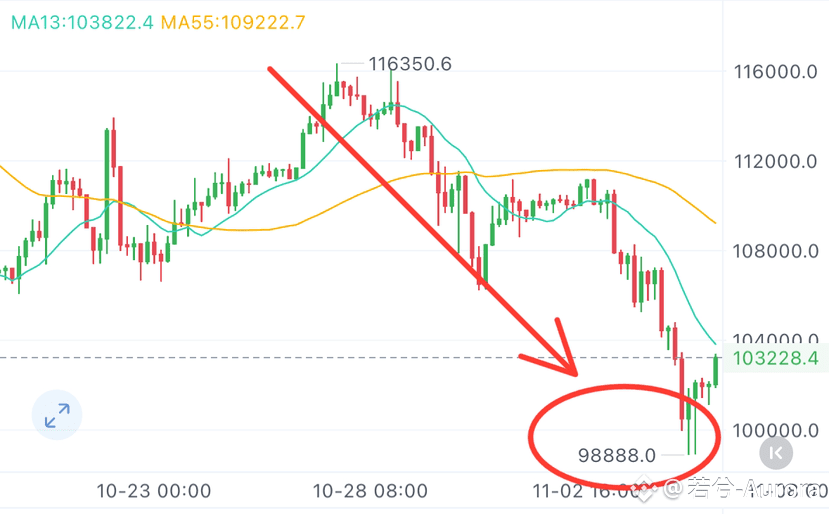
As early as October 19, Ruo Xi mentioned in an analysis of the subsequent long-term cycle that the bearish trend was obvious. This week, it has been a continuous downward trend from the 1110 level. In three days, the price of Bitcoin has declined by 10,000 points, accurately predicting a drop near 98780. The market has indeed followed expectations and declined to 98800. The script provided half a month ago has come to fruition! $BTC $ETH $SOL #加密市场回调
As early as October 19, Ruo Xi mentioned in an analysis of the subsequent long-term cycle that the bearish trend was obvious. This week, it has been a continuous downward trend from the 1110 level. In three days, the price of Bitcoin has declined by 10,000 points, accurately predicting a drop near 98780. The market has indeed followed expectations and declined to 98800. The script provided half a month ago has come to fruition! $BTC $ETH $SOL #加密市场回调
3
702
·
--
Bitcoin Multi-Timeframe Market Analysis
I. 【Weekly Timeframe | Long-Term Outlook】
The market has pulled back from its recent high, with a significant overall retracement. The weekly chart has now closed lower for four consecutive weeks.
After a prolonged and deep decline, we won't aggressively chase shorts this week. Overall, the market is more likely to see a technical rebound or move sideways as it consolidates.
Key long-term buying zone: 69000—73000
This is a strong support zone near the bottom. If the price reaches this level, it would be an excellent opportunity to build a long-term position.
II. 【Daily Timeframe | Medium-Term Outlook】
The double-top target at 77500 that we've been tracking for the past month has been fully reached ✅
• Daily bullish OB zone: 74800—77100
Long positions have been successfully established at lower levels. We'll patiently hold and wait for a rebound and recovery.
• Daily bearish resistance OB zone: 80300—82000
If the market rebounds into this higher zone, it will be a key area to watch for resistance and look for opportunities to short at high levels.
III. 【4-Hour Timeframe | Short-Term Outlook】
The daily support zone has held effectively. The current price is 78100. Key short-term resistance to watch: 79500. Whether price breaks through will determine the strength and continuation of the short-term rebound.$BTC
Bitcoin Multi-Timeframe Market Analysis
I. 【Weekly Timeframe | Long-Term Outlook】
The market has pulled back from its recent high, with a significant overall retracement. The weekly chart has now closed lower for four consecutive weeks.
After a prolonged and deep decline, we won't aggressively chase shorts this week. Overall, the market is more likely to see a technical rebound or move sideways as it consolidates.
Key long-term buying zone: 69000—73000
This is a strong support zone near the bottom. If the price reaches this level, it would be an excellent opportunity to build a long-term position.
II. 【Daily Timeframe | Medium-Term Outlook】
The double-top target at 77500 that we've been tracking for the past month has been fully reached ✅
• Daily bullish OB zone: 74800—77100
Long positions have been successfully established at lower levels. We'll patiently hold and wait for a rebound and recovery.
• Daily bearish resistance OB zone: 80300—82000
If the market rebounds into this higher zone, it will be a key area to watch for resistance and look for opportunities to short at high levels.
III. 【4-Hour Timeframe | Short-Term Outlook】
The daily support zone has held effectively. The current price is 78100. Key short-term resistance to watch: 79500. Whether price breaks through will determine the strength and continuation of the short-term rebound.$BTC
I. 【Weekly Timeframe | Long-Term Outlook】
The market has pulled back from its recent high, with a significant overall retracement. The weekly chart has now closed lower for four consecutive weeks.
After a prolonged and deep decline, we won't aggressively chase shorts this week. Overall, the market is more likely to see a technical rebound or move sideways as it consolidates.
Key long-term buying zone: 69000—73000
This is a strong support zone near the bottom. If the price reaches this level, it would be an excellent opportunity to build a long-term position.
II. 【Daily Timeframe | Medium-Term Outlook】
The double-top target at 77500 that we've been tracking for the past month has been fully reached ✅
• Daily bullish OB zone: 74800—77100
Long positions have been successfully established at lower levels. We'll patiently hold and wait for a rebound and recovery.
• Daily bearish resistance OB zone: 80300—82000
If the market rebounds into this higher zone, it will be a key area to watch for resistance and look for opportunities to short at high levels.
III. 【4-Hour Timeframe | Short-Term Outlook】
The daily support zone has held effectively. The current price is 78100. Key short-term resistance to watch: 79500. Whether price breaks through will determine the strength and continuation of the short-term rebound.$BTC
139
·
--
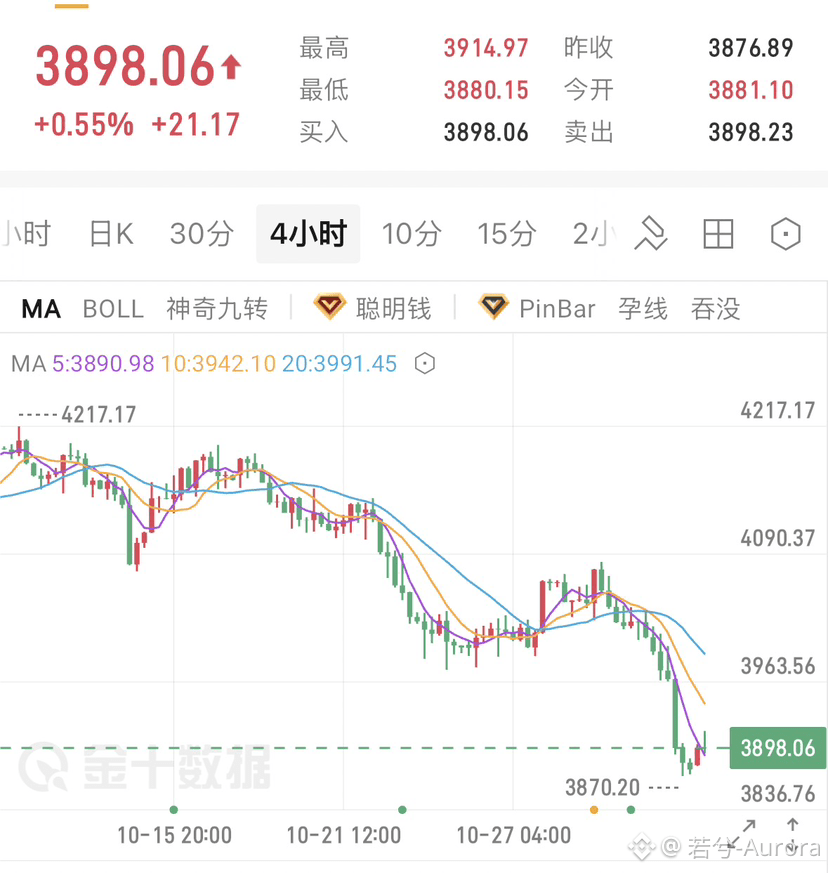
Gold fell sharply last Friday. It weakened gradually during the Asian and European sessions, then accelerated lower in the US session, declining steadily throughout the day and closing with a large bearish daily candle.
On the 2-hour chart, gold has broken below the 3975 support level. The MA20 is near 3966, and the moving averages remain in a standard bearish alignment.
The MACD lines continue to move lower below the zero line, while the bearish momentum bars keep expanding. Downward pressure remains strong for now.
Today, the initial outlook is for the downward momentum to continue. The key is to watch for shorting opportunities during the European and US sessions.
Resistance is at 3930 and 3950. If prices rebound to either level, consider scaling into short positions. A decisive break below 3870 would put 3850 and 3800 in focus.
Gold has just broken below its previous low, and bearish sentiment is strong. There are no signs of a bottom for now, so don’t rush to buy the dip. This is market analysis only and does not constitute investment advice. #xau
Gold fell sharply last Friday. It weakened gradually during the Asian and European sessions, then accelerated lower in the US session, declining steadily throughout the day and closing with a large bearish daily candle.
On the 2-hour chart, gold has broken below the 3975 support level. The MA20 is near 3966, and the moving averages remain in a standard bearish alignment.
The MACD lines continue to move lower below the zero line, while the bearish momentum bars keep expanding. Downward pressure remains strong for now.
Today, the initial outlook is for the downward momentum to continue. The key is to watch for shorting opportunities during the European and US sessions.
Resistance is at 3930 and 3950. If prices rebound to either level, consider scaling into short positions. A decisive break below 3870 would put 3850 and 3800 in focus.
Gold has just broken below its previous low, and bearish sentiment is strong. There are no signs of a bottom for now, so don’t rush to buy the dip. This is market analysis only and does not constitute investment advice. #xau
On the 2-hour chart, gold has broken below the 3975 support level. The MA20 is near 3966, and the moving averages remain in a standard bearish alignment.
The MACD lines continue to move lower below the zero line, while the bearish momentum bars keep expanding. Downward pressure remains strong for now.
Today, the initial outlook is for the downward momentum to continue. The key is to watch for shorting opportunities during the European and US sessions.
Resistance is at 3930 and 3950. If prices rebound to either level, consider scaling into short positions. A decisive break below 3870 would put 3850 and 3800 in focus.
Gold has just broken below its previous low, and bearish sentiment is strong. There are no signs of a bottom for now, so don’t rush to buy the dip. This is market analysis only and does not constitute investment advice. #xau
232
·
--
Verified
10.30 Market Analysis
I had been waiting for a short-selling opportunity all along yesterday, and fortunately, patience paid off with some gains. This wave of decline today was indeed greatly catalyzed by the news.
First, on the news side: Binance's hot wallet experienced a large-scale abnormal fund transfer today, and the market widely suspected a hacker attack. CZ also publicly stated that it looked like a hacker attack. Subsequently, institutions such as Tether and Circle froze a large amount of related assets.
What truly affected the market was not just the fund movement itself, but that it once again hit market confidence in the security and liquidity of exchange assets. After the news spread, a large number of leveraged long positions were liquidated in concentration, further amplifying the decline.
So, on the chart, I won't yet regard that huge bearish candle with a long lower wick as a confirmation of support. It looks more like a wave of passive covering after panic selling and forced liquidations were released in concentration. A fast drop does not mean the selling pressure has been completely exhausted.
Looking at the technical side, the 4-hour timeframe experienced a sharp drop, with price directly breaking below the lower Bollinger Band, and MACD has already formed a bearish crossover. The bearish structure still holds the initiative.
Although a long lower wick appeared at low levels and there was a certain rebound, there is still no clear trend reversal signal. In the short term, it is more likely to be weak consolidation and technical repair after being oversold.
My strategy today is still mainly to short, and I am not in a hurry to chase at low levels.
If the daytime session can stage a rebound, focus on the pressure around 78500—79000, wait for the rebound to weaken and for signs of fading strength, then consider positioning short.
Below, first look at around 77000.
If the rebound is very weak and cannot even reach the pressure zone, then continue to watch and do not trade just for the sake of trading.
A long lower wick does not mean a bottom has formed, and an oversold rebound does not mean a trend reversal. Right now, the most important thing is to wait for the market to give confirmation signals, rather than rushing to guess the bottom.$BTC $ETH
10.30 Market Analysis
I had been waiting for a short-selling opportunity all along yesterday, and fortunately, patience paid off with some gains. This wave of decline today was indeed greatly catalyzed by the news.
First, on the news side: Binance's hot wallet experienced a large-scale abnormal fund transfer today, and the market widely suspected a hacker attack. CZ also publicly stated that it looked like a hacker attack. Subsequently, institutions such as Tether and Circle froze a large amount of related assets.
What truly affected the market was not just the fund movement itself, but that it once again hit market confidence in the security and liquidity of exchange assets. After the news spread, a large number of leveraged long positions were liquidated in concentration, further amplifying the decline.
So, on the chart, I won't yet regard that huge bearish candle with a long lower wick as a confirmation of support. It looks more like a wave of passive covering after panic selling and forced liquidations were released in concentration. A fast drop does not mean the selling pressure has been completely exhausted.
Looking at the technical side, the 4-hour timeframe experienced a sharp drop, with price directly breaking below the lower Bollinger Band, and MACD has already formed a bearish crossover. The bearish structure still holds the initiative.
Although a long lower wick appeared at low levels and there was a certain rebound, there is still no clear trend reversal signal. In the short term, it is more likely to be weak consolidation and technical repair after being oversold.
My strategy today is still mainly to short, and I am not in a hurry to chase at low levels.
If the daytime session can stage a rebound, focus on the pressure around 78500—79000, wait for the rebound to weaken and for signs of fading strength, then consider positioning short.
Below, first look at around 77000.
If the rebound is very weak and cannot even reach the pressure zone, then continue to watch and do not trade just for the sake of trading.
A long lower wick does not mean a bottom has formed, and an oversold rebound does not mean a trend reversal. Right now, the most important thing is to wait for the market to give confirmation signals, rather than rushing to guess the bottom.$BTC $ETH
I had been waiting for a short-selling opportunity all along yesterday, and fortunately, patience paid off with some gains. This wave of decline today was indeed greatly catalyzed by the news.
First, on the news side: Binance's hot wallet experienced a large-scale abnormal fund transfer today, and the market widely suspected a hacker attack. CZ also publicly stated that it looked like a hacker attack. Subsequently, institutions such as Tether and Circle froze a large amount of related assets.
What truly affected the market was not just the fund movement itself, but that it once again hit market confidence in the security and liquidity of exchange assets. After the news spread, a large number of leveraged long positions were liquidated in concentration, further amplifying the decline.
So, on the chart, I won't yet regard that huge bearish candle with a long lower wick as a confirmation of support. It looks more like a wave of passive covering after panic selling and forced liquidations were released in concentration. A fast drop does not mean the selling pressure has been completely exhausted.
Looking at the technical side, the 4-hour timeframe experienced a sharp drop, with price directly breaking below the lower Bollinger Band, and MACD has already formed a bearish crossover. The bearish structure still holds the initiative.
Although a long lower wick appeared at low levels and there was a certain rebound, there is still no clear trend reversal signal. In the short term, it is more likely to be weak consolidation and technical repair after being oversold.
My strategy today is still mainly to short, and I am not in a hurry to chase at low levels.
If the daytime session can stage a rebound, focus on the pressure around 78500—79000, wait for the rebound to weaken and for signs of fading strength, then consider positioning short.
Below, first look at around 77000.
If the rebound is very weak and cannot even reach the pressure zone, then continue to watch and do not trade just for the sake of trading.
A long lower wick does not mean a bottom has formed, and an oversold rebound does not mean a trend reversal. Right now, the most important thing is to wait for the market to give confirmation signals, rather than rushing to guess the bottom.$BTC $ETH
445
·
--
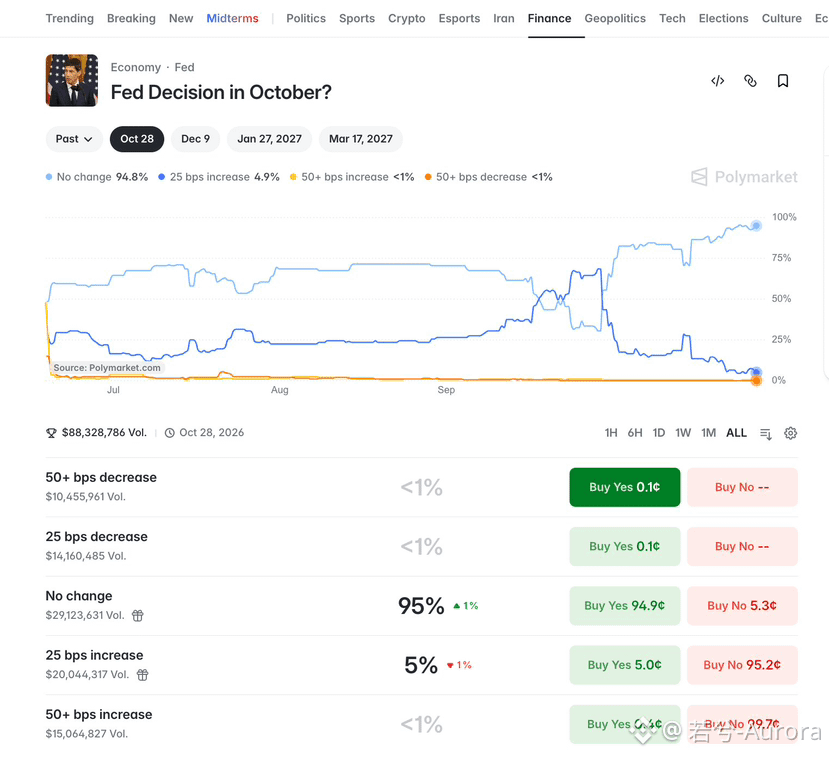
From tonight through Friday, the crypto market still has three hurdles to clear.
First, the Fed’s rate decision at 2 a.m. tonight. The market broadly expects rates to remain unchanged, but what really matters isn’t the decision itself—it’s what the Fed says at the press conference about its policy path for December.
Second, Thursday night’s PCE inflation data. Market expectations are currently around 3.6%–3.7%. Keep in mind, that’s just an expectation, not the final result. If inflation remains stubbornly high, expectations for rate cuts could cool further, which wouldn’t be good news for BTC.
Third, around $11 billion worth of BTC options expire on Friday. That’s a sizable amount and could intensify short-term positioning battles. But don’t assume the price will necessarily move toward the Max Pain level just because you know where it is.$BTC
From tonight through Friday, the crypto market still has three hurdles to clear.
First, the Fed’s rate decision at 2 a.m. tonight. The market broadly expects rates to remain unchanged, but what really matters isn’t the decision itself—it’s what the Fed says at the press conference about its policy path for December.
Second, Thursday night’s PCE inflation data. Market expectations are currently around 3.6%–3.7%. Keep in mind, that’s just an expectation, not the final result. If inflation remains stubbornly high, expectations for rate cuts could cool further, which wouldn’t be good news for BTC.
Third, around $11 billion worth of BTC options expire on Friday. That’s a sizable amount and could intensify short-term positioning battles. But don’t assume the price will necessarily move toward the Max Pain level just because you know where it is.$BTC
First, the Fed’s rate decision at 2 a.m. tonight. The market broadly expects rates to remain unchanged, but what really matters isn’t the decision itself—it’s what the Fed says at the press conference about its policy path for December.
Second, Thursday night’s PCE inflation data. Market expectations are currently around 3.6%–3.7%. Keep in mind, that’s just an expectation, not the final result. If inflation remains stubbornly high, expectations for rate cuts could cool further, which wouldn’t be good news for BTC.
Third, around $11 billion worth of BTC options expire on Friday. That’s a sizable amount and could intensify short-term positioning battles. But don’t assume the price will necessarily move toward the Max Pain level just because you know where it is.$BTC
1.5k
·
--
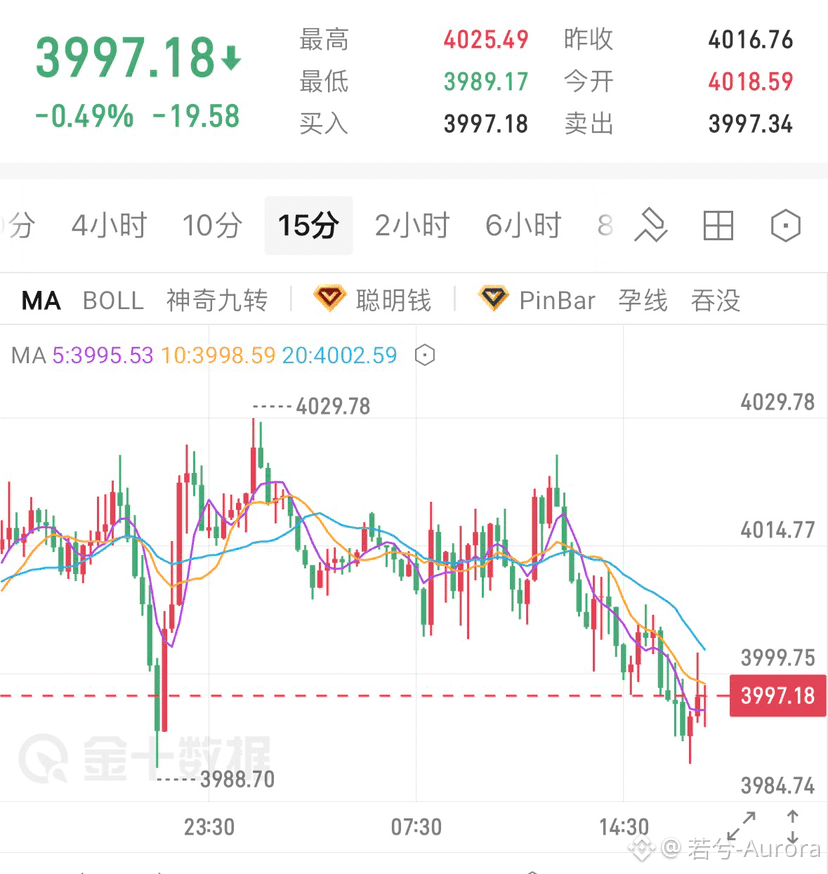
Gold remains in a clear downtrend on the four-hour chart, with no change in the market’s overall weakness. Price continues to trade under pressure below the moving averages across all timeframes, while the descending trendline overhead firmly caps any bullish rebound. The overall market structure is clearly bearish.
In the short term, price has entered a choppy range around 4000. It has found brief support below and has not continued to plunge, but the balance of bullish and bearish momentum remains highly uneven. The bulls’ rebound effort is severely lacking; this is merely a brief pause in the decline, not a signal that the downtrend has ended or reversed.
Main strategy for tonight: follow the trend and look for short positions.
The overall outlook remains bearish, and any rebound presents an opportunity to sell.
If price pushes higher to test the 4010–4015 range and shows signs of stalling or coming under pressure, consider opening a small short position.
Place the stop-loss above 4025. The initial short-term target is the 4000 level; if it breaks, look for a continuation toward 3990.
If price decisively breaks below 4000 and holds there, bearish momentum is likely to build again. Follow the trend toward the 3975 low.
This market outlook is for reference only and does not constitute investment advice.
Gold remains in a clear downtrend on the four-hour chart, with no change in the market’s overall weakness. Price continues to trade under pressure below the moving averages across all timeframes, while the descending trendline overhead firmly caps any bullish rebound. The overall market structure is clearly bearish.
In the short term, price has entered a choppy range around 4000. It has found brief support below and has not continued to plunge, but the balance of bullish and bearish momentum remains highly uneven. The bulls’ rebound effort is severely lacking; this is merely a brief pause in the decline, not a signal that the downtrend has ended or reversed.
Main strategy for tonight: follow the trend and look for short positions.
The overall outlook remains bearish, and any rebound presents an opportunity to sell.
If price pushes higher to test the 4010–4015 range and shows signs of stalling or coming under pressure, consider opening a small short position.
Place the stop-loss above 4025. The initial short-term target is the 4000 level; if it breaks, look for a continuation toward 3990.
If price decisively breaks below 4000 and holds there, bearish momentum is likely to build again. Follow the trend toward the 3975 low.
This market outlook is for reference only and does not constitute investment advice.
In the short term, price has entered a choppy range around 4000. It has found brief support below and has not continued to plunge, but the balance of bullish and bearish momentum remains highly uneven. The bulls’ rebound effort is severely lacking; this is merely a brief pause in the decline, not a signal that the downtrend has ended or reversed.
Main strategy for tonight: follow the trend and look for short positions.
The overall outlook remains bearish, and any rebound presents an opportunity to sell.
If price pushes higher to test the 4010–4015 range and shows signs of stalling or coming under pressure, consider opening a small short position.
Place the stop-loss above 4025. The initial short-term target is the 4000 level; if it breaks, look for a continuation toward 3990.
If price decisively breaks below 4000 and holds there, bearish momentum is likely to build again. Follow the trend toward the 3975 low.
This market outlook is for reference only and does not constitute investment advice.
186
·
--
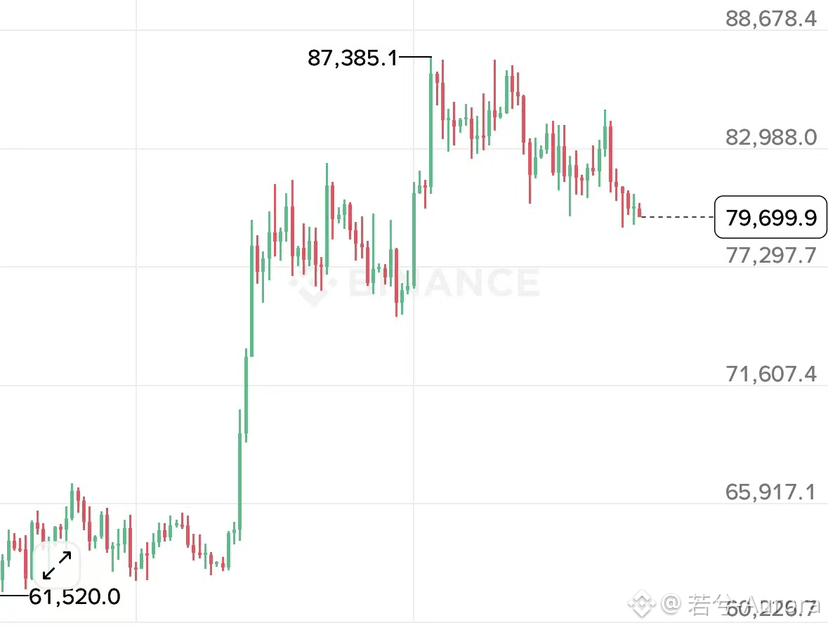
Whether we see a rebound this week still depends on macro factors, especially oil prices and the Fed’s stance.
With the Fed’s policy meeting coming up, the market has largely priced in rates staying unchanged. What’s really worth watching is what the Fed says next, and whether inflation will affect the path of interest rates going forward.
Personally, I’m keeping a close eye on oil prices. If they continue to fall, inflationary pressures may ease, which would create better conditions for a rebound in risk assets like BTC. But if oil prices remain elevated, expectations of high interest rates will be hard to shake, and a sustained rally in BTC will remain a challenge.
So this week, I’m not expecting BTC to reverse course outright just yet. I’m more inclined to expect some consolidation first, followed by a possible rebound.
In the short term, watch 80,800–81,000. Whether the price can break through and hold above this range is crucial. If it does, the next levels to watch are 82,700 and 83,000, with around 83,300 in sight if momentum is strong.
But if the price tries several times and still can’t break through, don’t rush to call it a reversal. A rebound is a rebound; a trend is a trend. The two shouldn’t be confused.
On the other hand, if 80,000 breaks again and the price can’t recover it after a bounce, we should be wary of a further move toward the previous low.
In the short term, I’ll look for rebound opportunities when they arise, but I won’t chase prices higher. In the medium term, I’ll continue to view the market as being in a correction and wait for a clear signal that momentum has turned stronger.
At the end of the day, buyers stepping in around 80,000 doesn’t mean the market is ready to rise. What matters next is whether buying pressure can keep building and absorb the overhead resistance. After all, holding support and moving higher are two different things. $BTC
Whether we see a rebound this week still depends on macro factors, especially oil prices and the Fed’s stance.
With the Fed’s policy meeting coming up, the market has largely priced in rates staying unchanged. What’s really worth watching is what the Fed says next, and whether inflation will affect the path of interest rates going forward.
Personally, I’m keeping a close eye on oil prices. If they continue to fall, inflationary pressures may ease, which would create better conditions for a rebound in risk assets like BTC. But if oil prices remain elevated, expectations of high interest rates will be hard to shake, and a sustained rally in BTC will remain a challenge.
So this week, I’m not expecting BTC to reverse course outright just yet. I’m more inclined to expect some consolidation first, followed by a possible rebound.
In the short term, watch 80,800–81,000. Whether the price can break through and hold above this range is crucial. If it does, the next levels to watch are 82,700 and 83,000, with around 83,300 in sight if momentum is strong.
But if the price tries several times and still can’t break through, don’t rush to call it a reversal. A rebound is a rebound; a trend is a trend. The two shouldn’t be confused.
On the other hand, if 80,000 breaks again and the price can’t recover it after a bounce, we should be wary of a further move toward the previous low.
In the short term, I’ll look for rebound opportunities when they arise, but I won’t chase prices higher. In the medium term, I’ll continue to view the market as being in a correction and wait for a clear signal that momentum has turned stronger.
At the end of the day, buyers stepping in around 80,000 doesn’t mean the market is ready to rise. What matters next is whether buying pressure can keep building and absorb the overhead resistance. After all, holding support and moving higher are two different things. $BTC
With the Fed’s policy meeting coming up, the market has largely priced in rates staying unchanged. What’s really worth watching is what the Fed says next, and whether inflation will affect the path of interest rates going forward.
Personally, I’m keeping a close eye on oil prices. If they continue to fall, inflationary pressures may ease, which would create better conditions for a rebound in risk assets like BTC. But if oil prices remain elevated, expectations of high interest rates will be hard to shake, and a sustained rally in BTC will remain a challenge.
So this week, I’m not expecting BTC to reverse course outright just yet. I’m more inclined to expect some consolidation first, followed by a possible rebound.
In the short term, watch 80,800–81,000. Whether the price can break through and hold above this range is crucial. If it does, the next levels to watch are 82,700 and 83,000, with around 83,300 in sight if momentum is strong.
But if the price tries several times and still can’t break through, don’t rush to call it a reversal. A rebound is a rebound; a trend is a trend. The two shouldn’t be confused.
On the other hand, if 80,000 breaks again and the price can’t recover it after a bounce, we should be wary of a further move toward the previous low.
In the short term, I’ll look for rebound opportunities when they arise, but I won’t chase prices higher. In the medium term, I’ll continue to view the market as being in a correction and wait for a clear signal that momentum has turned stronger.
At the end of the day, buyers stepping in around 80,000 doesn’t mean the market is ready to rise. What matters next is whether buying pressure can keep building and absorb the overhead resistance. After all, holding support and moving higher are two different things. $BTC
386
·
--
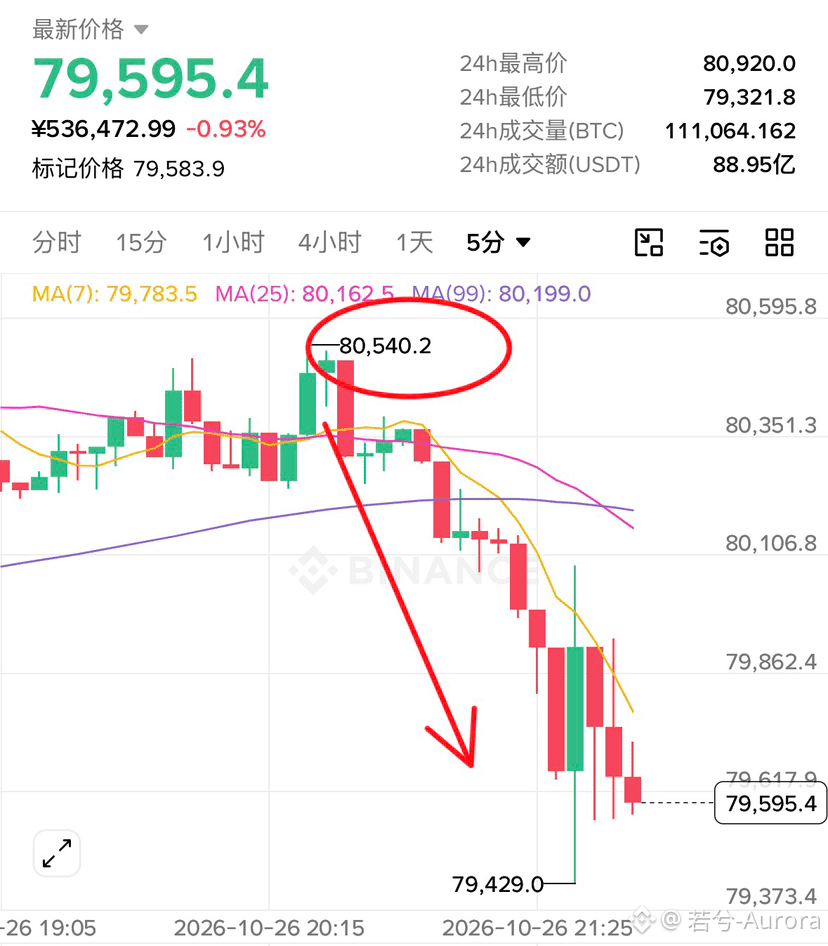
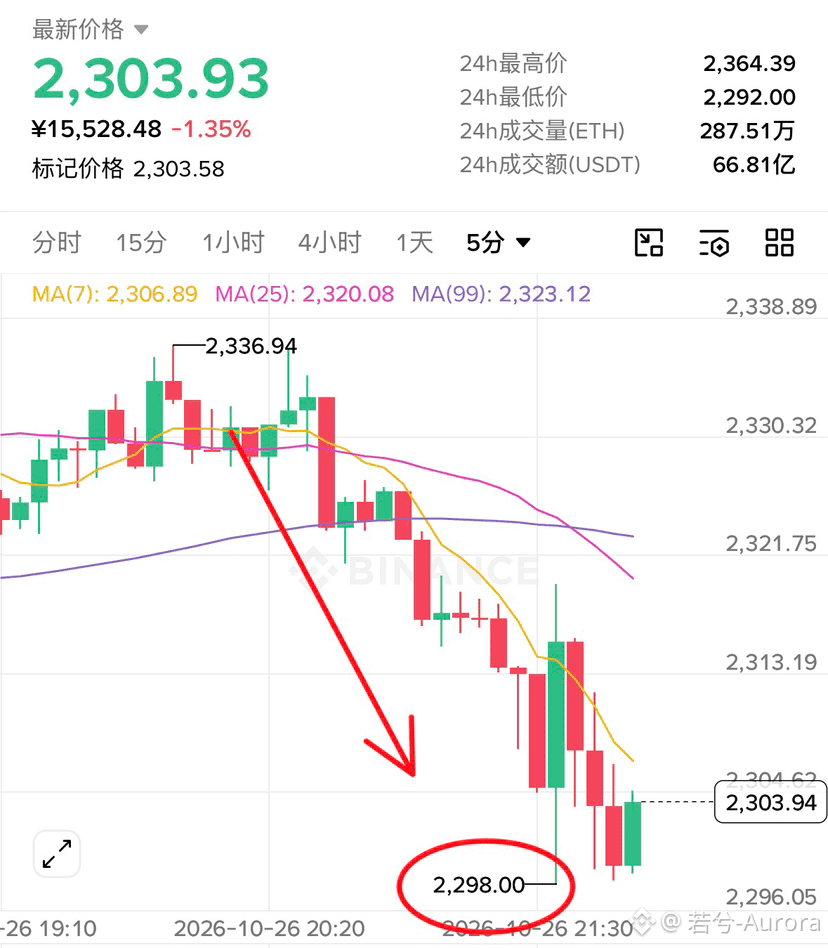
Bitcoin and Ethereum have rebounded even less strongly than expected. Stick to the strategy of shorting at higher levels, and don’t blindly buy the dip! $BTC
Bitcoin and Ethereum have rebounded even less strongly than expected. Stick to the strategy of shorting at higher levels, and don’t blindly buy the dip! $BTC
361
·
--
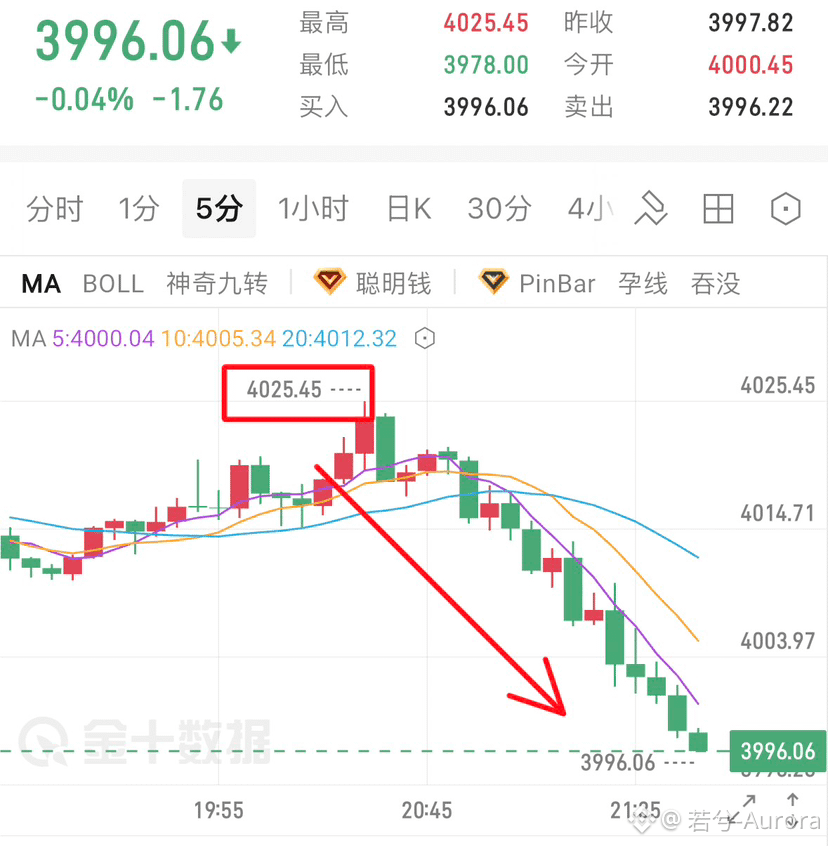
This move also fits the range Ruoxi gave. It peaked at 4025, and the current low is 3996—already a 30-point move. Did you catch it? #Xau
This move also fits the range Ruoxi gave. It peaked at 4025, and the current low is 3996—already a 30-point move. Did you catch it? #Xau
354
·
--
Partly True
You can’t explain this gold selloff by looking only at geopolitics.
In theory, escalating geopolitical tensions should support gold, but the market isn’t buying it. The reason is simple: if oil prices stay elevated, inflationary pressure will increase, and expectations that the Fed will keep interest rates high will rise as well—putting pressure on gold instead.
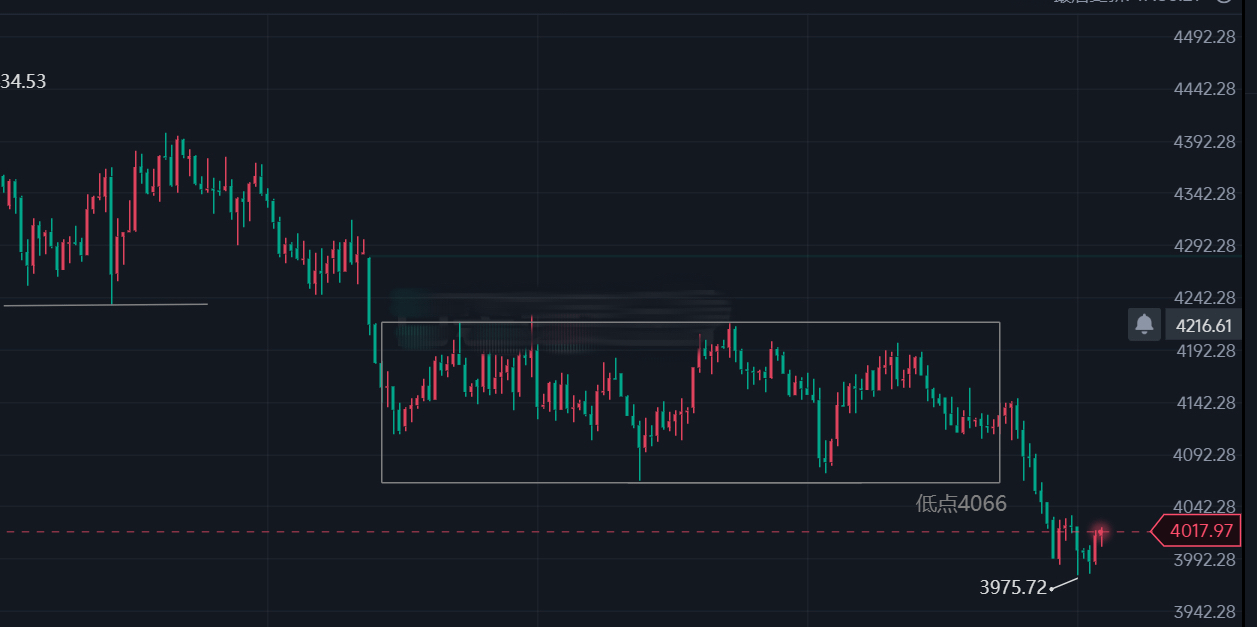
Technically, gold has already broken below its previous consolidation range, and the short-term structure is bearish. The previous low at 4066 could now turn into resistance.
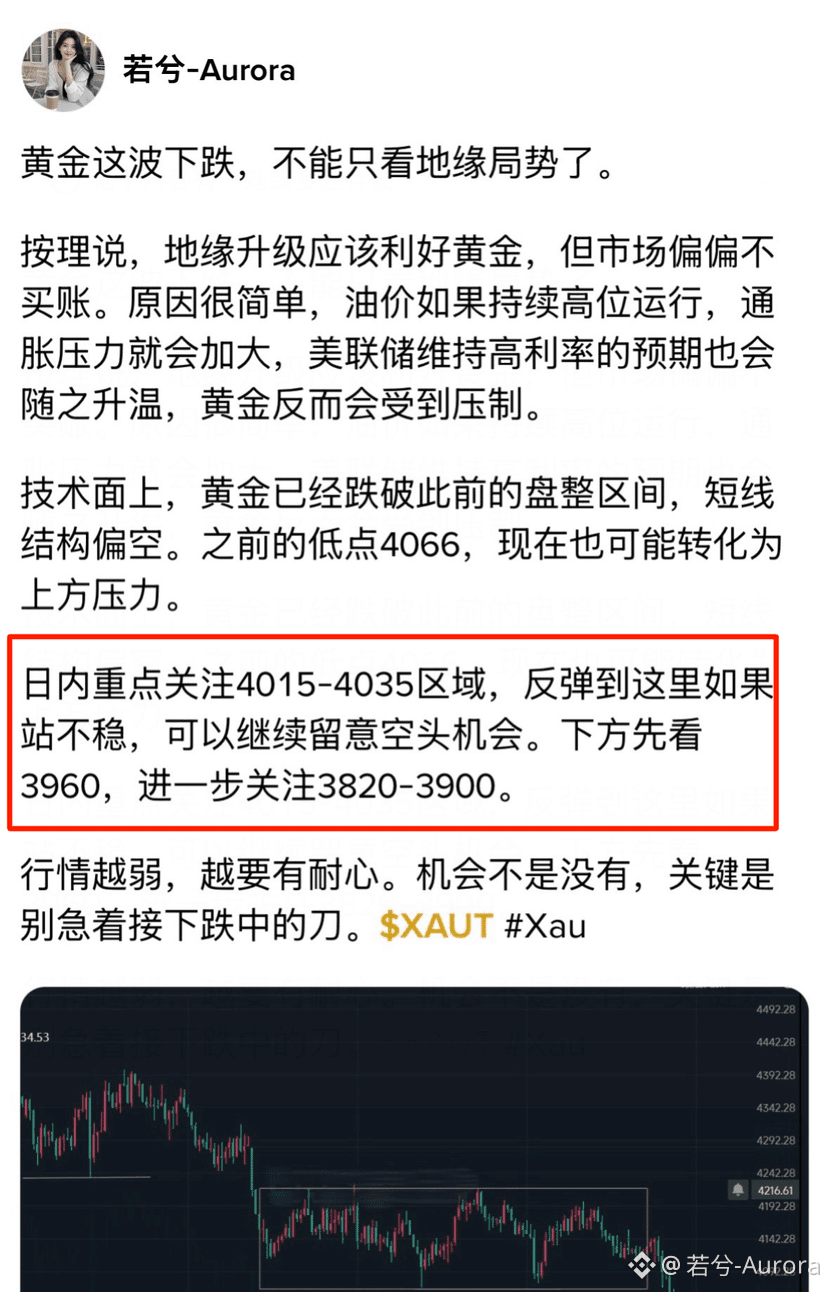
Today, keep a close eye on the 4015–4035 zone. If gold rebounds to this area but fails to hold, watch for further short opportunities. First, look toward 3960, then keep an eye on 3820–3900.
The weaker the market gets, the more patience you need. Opportunities are still there—the key is not to rush in and try to catch a falling knife. $XAUT #Xau
You can’t explain this gold selloff by looking only at geopolitics.
In theory, escalating geopolitical tensions should support gold, but the market isn’t buying it. The reason is simple: if oil prices stay elevated, inflationary pressure will increase, and expectations that the Fed will keep interest rates high will rise as well—putting pressure on gold instead.
Technically, gold has already broken below its previous consolidation range, and the short-term structure is bearish. The previous low at 4066 could now turn into resistance.
Today, keep a close eye on the 4015–4035 zone. If gold rebounds to this area but fails to hold, watch for further short opportunities. First, look toward 3960, then keep an eye on 3820–3900.
The weaker the market gets, the more patience you need. Opportunities are still there—the key is not to rush in and try to catch a falling knife. $XAUT #Xau
In theory, escalating geopolitical tensions should support gold, but the market isn’t buying it. The reason is simple: if oil prices stay elevated, inflationary pressure will increase, and expectations that the Fed will keep interest rates high will rise as well—putting pressure on gold instead.
Technically, gold has already broken below its previous consolidation range, and the short-term structure is bearish. The previous low at 4066 could now turn into resistance.
Today, keep a close eye on the 4015–4035 zone. If gold rebounds to this area but fails to hold, watch for further short opportunities. First, look toward 3960, then keep an eye on 3820–3900.
The weaker the market gets, the more patience you need. Opportunities are still there—the key is not to rush in and try to catch a falling knife. $XAUT #Xau
114
·
--
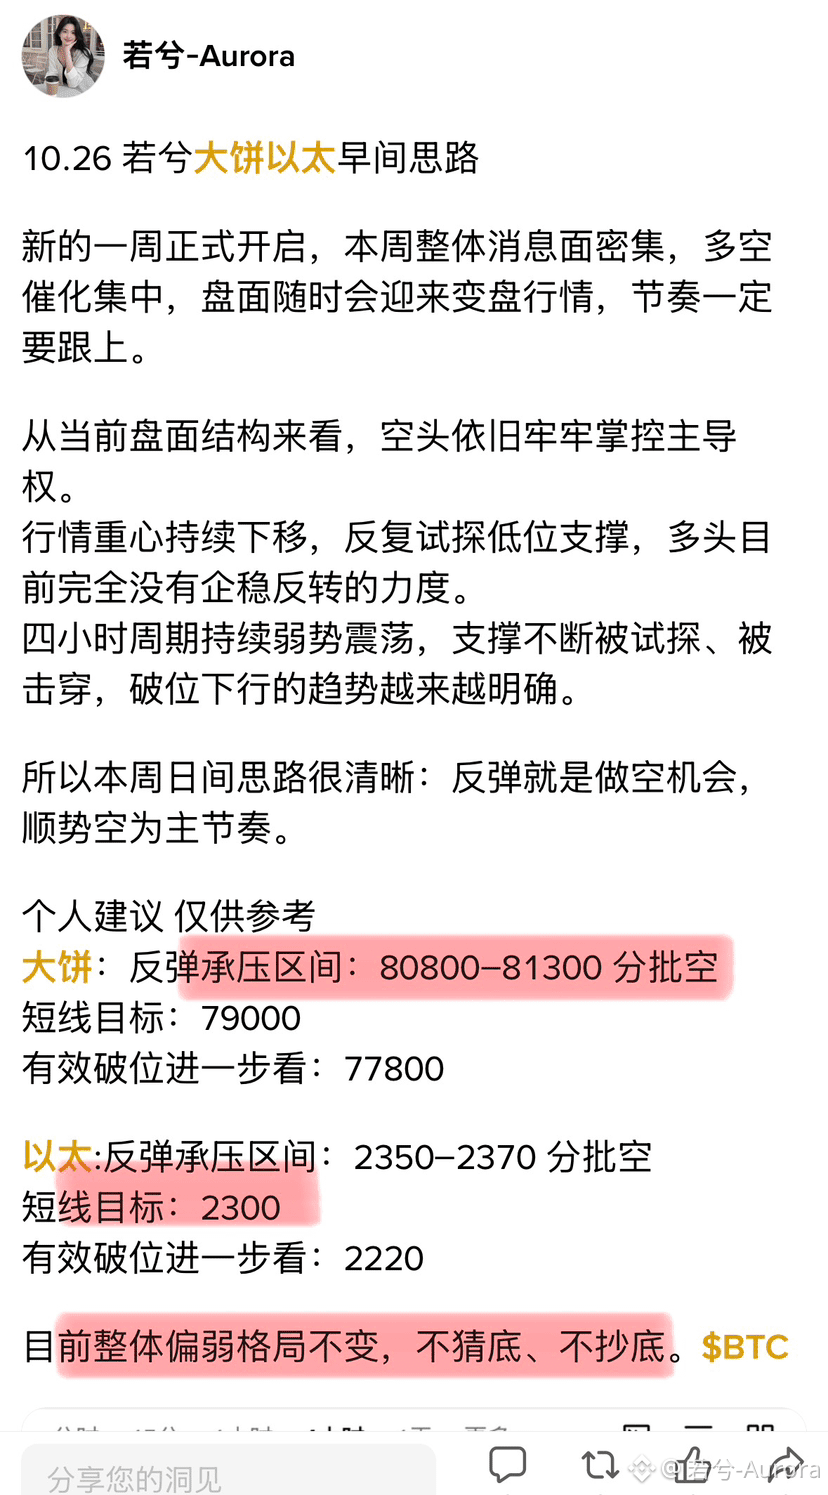
10.26 Ruoxi’s Morning Outlook on Bitcoin and Ethereum
A new week is officially underway. The news flow is expected to be heavy this week, with catalysts for both bulls and bears concentrated. The market could shift at any time, so it’s important to keep pace.
Looking at the current market structure, bears remain firmly in control.
The market continues to trend lower, repeatedly testing support at the lows. Bulls have shown no sign of establishing a base or reversing the trend.
The four-hour chart remains in a weak consolidation. Support keeps getting tested and broken, and the downtrend is becoming increasingly clear.
So the approach for this week’s daytime trading is straightforward: treat rebounds as opportunities to short, with trend-following shorts as the primary strategy.
My personal suggestions, for reference only:
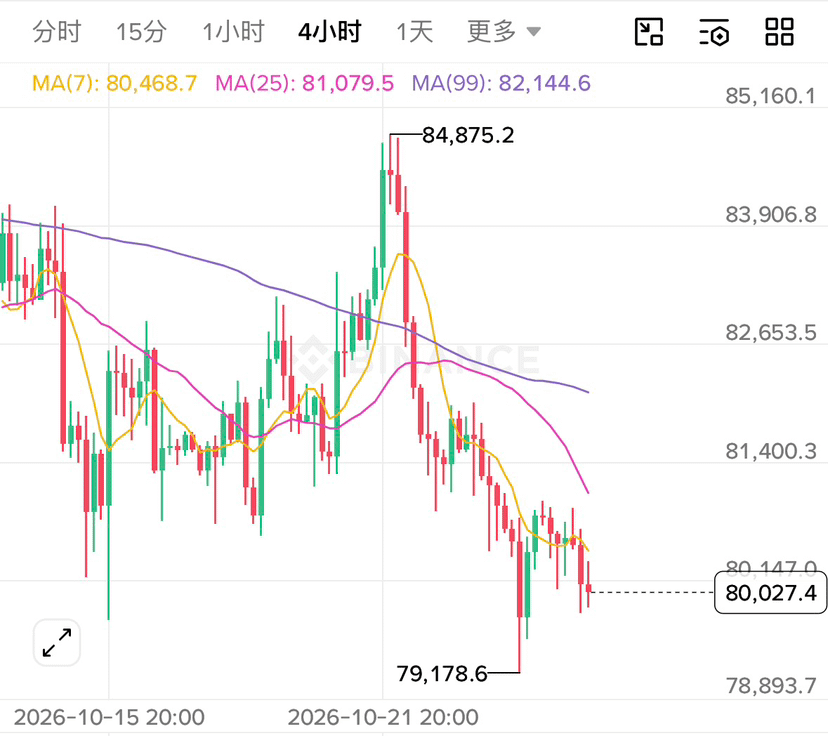
Bitcoin: Short in batches in the 80,800–81,300 resistance zone on a rebound
Short-term target: 79,000
If support is decisively broken, next target: 77,800
Ethereum: Short in batches in the 2,350–2,370 resistance zone on a rebound
Short-term target: 2,300
If support is decisively broken, next target: 2,220
The overall weak market structure remains unchanged. Don’t try to guess the bottom or buy the dip. $BTC
10.26 Ruoxi’s Morning Outlook on Bitcoin and Ethereum
A new week is officially underway. The news flow is expected to be heavy this week, with catalysts for both bulls and bears concentrated. The market could shift at any time, so it’s important to keep pace.
Looking at the current market structure, bears remain firmly in control.
The market continues to trend lower, repeatedly testing support at the lows. Bulls have shown no sign of establishing a base or reversing the trend.
The four-hour chart remains in a weak consolidation. Support keeps getting tested and broken, and the downtrend is becoming increasingly clear.
So the approach for this week’s daytime trading is straightforward: treat rebounds as opportunities to short, with trend-following shorts as the primary strategy.
My personal suggestions, for reference only:
Bitcoin: Short in batches in the 80,800–81,300 resistance zone on a rebound
Short-term target: 79,000
If support is decisively broken, next target: 77,800
Ethereum: Short in batches in the 2,350–2,370 resistance zone on a rebound
Short-term target: 2,300
If support is decisively broken, next target: 2,220
The overall weak market structure remains unchanged. Don’t try to guess the bottom or buy the dip. $BTC
A new week is officially underway. The news flow is expected to be heavy this week, with catalysts for both bulls and bears concentrated. The market could shift at any time, so it’s important to keep pace.
Looking at the current market structure, bears remain firmly in control.
The market continues to trend lower, repeatedly testing support at the lows. Bulls have shown no sign of establishing a base or reversing the trend.
The four-hour chart remains in a weak consolidation. Support keeps getting tested and broken, and the downtrend is becoming increasingly clear.
So the approach for this week’s daytime trading is straightforward: treat rebounds as opportunities to short, with trend-following shorts as the primary strategy.
My personal suggestions, for reference only:
Bitcoin: Short in batches in the 80,800–81,300 resistance zone on a rebound
Short-term target: 79,000
If support is decisively broken, next target: 77,800
Ethereum: Short in batches in the 2,350–2,370 resistance zone on a rebound
Short-term target: 2,300
If support is decisively broken, next target: 2,220
The overall weak market structure remains unchanged. Don’t try to guess the bottom or buy the dip. $BTC
124
·
--
Gold hasn’t found a bottom yet. The key level to watch at Monday’s open is 4034.
Bitcoin, gold, and U.S. stocks all weakened on Friday night. Gold met resistance after rebounding to 4034, then plunged to 3975 on a big bearish candle and closed at 3995, failing to hold above 4000.
This is an accelerated decline on the 8-hour timeframe. The drop has been steep, and there are no signs of a bottom yet. The broader trend remains bearish; for now, the only thing to watch for is an oversold rebound.
I’ll update my outlook after Monday’s open. On the 30-minute chart, gold needs to hold above 4034 to have a chance of finding a short-term bottom. If it can’t reclaim that level on the rebound, it will most likely continue lower, into the 38xx range.
Can gold recover to 4034 on Monday? #XAU
Gold hasn’t found a bottom yet. The key level to watch at Monday’s open is 4034.
Bitcoin, gold, and U.S. stocks all weakened on Friday night. Gold met resistance after rebounding to 4034, then plunged to 3975 on a big bearish candle and closed at 3995, failing to hold above 4000.
This is an accelerated decline on the 8-hour timeframe. The drop has been steep, and there are no signs of a bottom yet. The broader trend remains bearish; for now, the only thing to watch for is an oversold rebound.
I’ll update my outlook after Monday’s open. On the 30-minute chart, gold needs to hold above 4034 to have a chance of finding a short-term bottom. If it can’t reclaim that level on the rebound, it will most likely continue lower, into the 38xx range.
Can gold recover to 4034 on Monday? #XAU
Bitcoin, gold, and U.S. stocks all weakened on Friday night. Gold met resistance after rebounding to 4034, then plunged to 3975 on a big bearish candle and closed at 3995, failing to hold above 4000.
This is an accelerated decline on the 8-hour timeframe. The drop has been steep, and there are no signs of a bottom yet. The broader trend remains bearish; for now, the only thing to watch for is an oversold rebound.
I’ll update my outlook after Monday’s open. On the 30-minute chart, gold needs to hold above 4034 to have a chance of finding a short-term bottom. If it can’t reclaim that level on the rebound, it will most likely continue lower, into the 38xx range.
Can gold recover to 4034 on Monday? #XAU
77
·
--
6 Types of People Who Consistently Make Money in Crypto
1. The fiercely disciplined
They can sit on the sidelines and stay mostly in cash. They wait for high-confidence setups, take only a few trades a year, and exit once they’ve reached their profit target—never getting greedy or overstaying their welcome.
2. The patient long-term investor
They don’t let short-term price swings affect their mindset. They believe in an asset’s long-term value and hold on, letting time compound their returns and market cycles deliver the profits.
3. The skilled swing trader
They focus only on the core coins they know well and don’t jump in and out of positions at random. By repeatedly selling high and buying low, they gradually lower their average entry price—and may even get it below zero.
4. The focused leader trader
They trade only the market’s main narratives and leading coins, steering clear of weak, obscure tokens. They act decisively and stick to strict discipline, aiming only for the most reliable, high-confidence moves.
5. The disciplined system trader
They have a mature trading system of their own and follow signals, not emotions. They tune out the noise, don’t let news sway them, and execute their trades mechanically.
6. The savvy trader who knows when to be content
They don’t try to take the last dollar out of the market—they take the juiciest part of the move. They don’t gamble at the end of a rally; they take profits early and put capital preservation first.
6 Types of People Who Consistently Make Money in Crypto
1. The fiercely disciplined
They can sit on the sidelines and stay mostly in cash. They wait for high-confidence setups, take only a few trades a year, and exit once they’ve reached their profit target—never getting greedy or overstaying their welcome.
2. The patient long-term investor
They don’t let short-term price swings affect their mindset. They believe in an asset’s long-term value and hold on, letting time compound their returns and market cycles deliver the profits.
3. The skilled swing trader
They focus only on the core coins they know well and don’t jump in and out of positions at random. By repeatedly selling high and buying low, they gradually lower their average entry price—and may even get it below zero.
4. The focused leader trader
They trade only the market’s main narratives and leading coins, steering clear of weak, obscure tokens. They act decisively and stick to strict discipline, aiming only for the most reliable, high-confidence moves.
5. The disciplined system trader
They have a mature trading system of their own and follow signals, not emotions. They tune out the noise, don’t let news sway them, and execute their trades mechanically.
6. The savvy trader who knows when to be content
They don’t try to take the last dollar out of the market—they take the juiciest part of the move. They don’t gamble at the end of a rally; they take profits early and put capital preservation first.
1. The fiercely disciplined
They can sit on the sidelines and stay mostly in cash. They wait for high-confidence setups, take only a few trades a year, and exit once they’ve reached their profit target—never getting greedy or overstaying their welcome.
2. The patient long-term investor
They don’t let short-term price swings affect their mindset. They believe in an asset’s long-term value and hold on, letting time compound their returns and market cycles deliver the profits.
3. The skilled swing trader
They focus only on the core coins they know well and don’t jump in and out of positions at random. By repeatedly selling high and buying low, they gradually lower their average entry price—and may even get it below zero.
4. The focused leader trader
They trade only the market’s main narratives and leading coins, steering clear of weak, obscure tokens. They act decisively and stick to strict discipline, aiming only for the most reliable, high-confidence moves.
5. The disciplined system trader
They have a mature trading system of their own and follow signals, not emotions. They tune out the noise, don’t let news sway them, and execute their trades mechanically.
6. The savvy trader who knows when to be content
They don’t try to take the last dollar out of the market—they take the juiciest part of the move. They don’t gamble at the end of a rally; they take profits early and put capital preservation first.
81
·
--
The daily-chart correction isn’t over yet.
With price action looking like this, if it continues to move lower, we could see a sharp, accelerated selloff.
That said, another rebound is still possible.
Keep a close eye on 4075 tonight. If we get another rebound, it will most likely start around 4075.
But if the market gaps down and the selloff accelerates, don’t rush to buy the dip above 4000. #xau
The daily-chart correction isn’t over yet.
With price action looking like this, if it continues to move lower, we could see a sharp, accelerated selloff.
That said, another rebound is still possible.
Keep a close eye on 4075 tonight. If we get another rebound, it will most likely start around 4075.
But if the market gaps down and the selloff accelerates, don’t rush to buy the dip above 4000. #xau
With price action looking like this, if it continues to move lower, we could see a sharp, accelerated selloff.
That said, another rebound is still possible.
Keep a close eye on 4075 tonight. If we get another rebound, it will most likely start around 4075.
But if the market gaps down and the selloff accelerates, don’t rush to buy the dip above 4000. #xau
508
·
--

Article
Why does trading harder make your account lose money even faster?After spending a while in crypto, you start to realize that most beginners lose money not because they can’t read candlestick charts or analyze the market, but because they want to catch every opportunity and don’t want to miss a single move.
You see the 1-minute candlestick chart suddenly spike, panic about missing out, and rush in to go long. But just as your order fills, the market turns and pulls back. Worried your paper profits will disappear, you hurriedly sell at a loss to cut your losses.
The funny thing is, the moment you cut your losses and exit, the price surges again; then, as soon as you chase it, it turns around and starts falling. You spend the whole day trading, fail to get the direction right on most moves, and rack up a hefty bill in fees. Most people who’ve traded futures know how frustrating this feels.
Why does trading harder make your account lose money even faster?
After spending a while in crypto, you start to realize that most beginners lose money not because they can’t read candlestick charts or analyze the market, but because they want to catch every opportunity and don’t want to miss a single move.
You see the 1-minute candlestick chart suddenly spike, panic about missing out, and rush in to go long. But just as your order fills, the market turns and pulls back. Worried your paper profits will disappear, you hurriedly sell at a loss to cut your losses.
The funny thing is, the moment you cut your losses and exit, the price surges again; then, as soon as you chase it, it turns around and starts falling. You spend the whole day trading, fail to get the direction right on most moves, and rack up a hefty bill in fees. Most people who’ve traded futures know how frustrating this feels.
You see the 1-minute candlestick chart suddenly spike, panic about missing out, and rush in to go long. But just as your order fills, the market turns and pulls back. Worried your paper profits will disappear, you hurriedly sell at a loss to cut your losses.
The funny thing is, the moment you cut your losses and exit, the price surges again; then, as soon as you chase it, it turns around and starts falling. You spend the whole day trading, fail to get the direction right on most moves, and rack up a hefty bill in fees. Most people who’ve traded futures know how frustrating this feels.
98
·
--
Gold intraday outlook
Overall bias is bearish, but at this stage, when operating, you must be very cautious and not blindly optimistic. The market’s intraday swing on a daily-chart level is extremely large. Under the current bearish structure, there are essentially only two possible paths ahead: either it quickly breaks down and runs lower, or it keeps oscillating back and forth, grinding through the行情 via repeated consolidation.
There is another possibility that hasn’t been mentioned much earlier, and it’s actually also hard to predict in my mind: once the price can effectively hold above 4450, the upward momentum on the daily chart may likely push the price to spike toward around 4650.
However, until the 4450 level is broken, the bigger-picture direction remains bearish as the main idea.
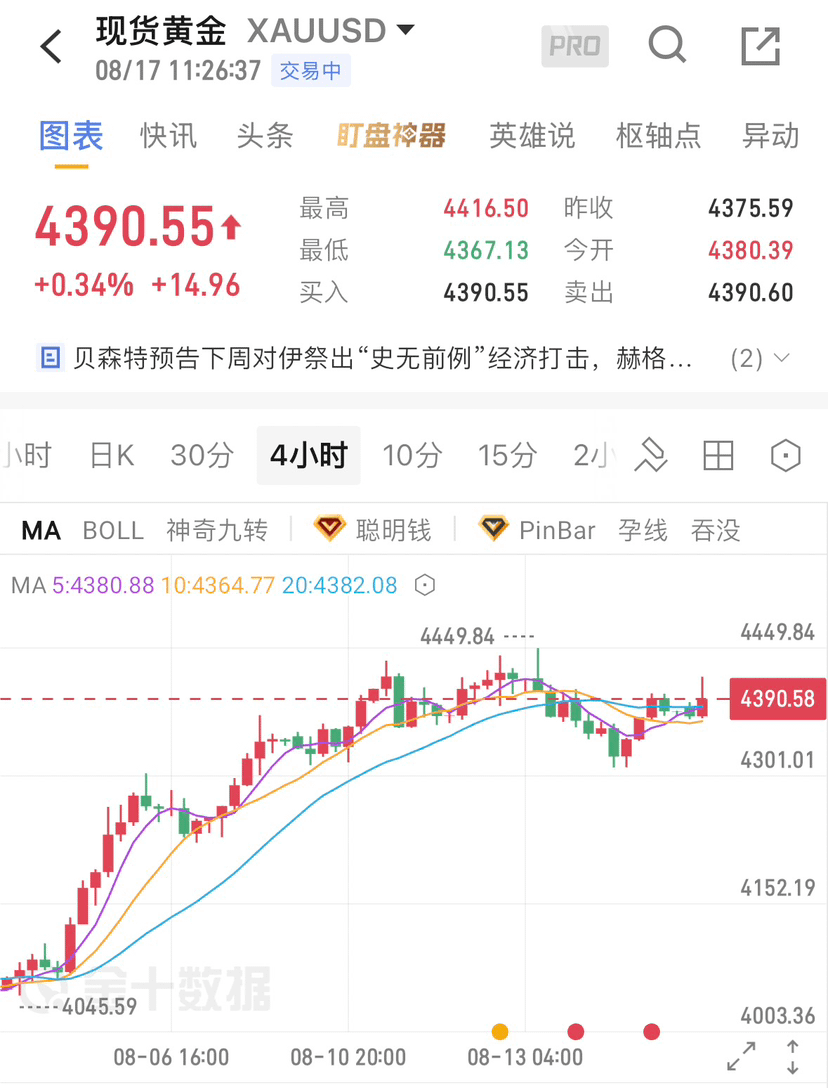
For intraday short-term trades, from the one-hour cycle, the 4410–4435 range faces strong resistance. You can focus on this resistance band today and look for suitable opportunities to set up short positions.
If the bears can gain strength and move lower, the key support area to watch is around 4320–4330.
Risk warning: The above is only for sharing market ideas and does not constitute any investment advice. Market conditions change quickly—manage your position sizing and risk control well.
#美国拟迫各国在美中AI阵营选边 $XAU
Gold intraday outlook
Overall bias is bearish, but at this stage, when operating, you must be very cautious and not blindly optimistic. The market’s intraday swing on a daily-chart level is extremely large. Under the current bearish structure, there are essentially only two possible paths ahead: either it quickly breaks down and runs lower, or it keeps oscillating back and forth, grinding through the行情 via repeated consolidation.
There is another possibility that hasn’t been mentioned much earlier, and it’s actually also hard to predict in my mind: once the price can effectively hold above 4450, the upward momentum on the daily chart may likely push the price to spike toward around 4650.
However, until the 4450 level is broken, the bigger-picture direction remains bearish as the main idea.
For intraday short-term trades, from the one-hour cycle, the 4410–4435 range faces strong resistance. You can focus on this resistance band today and look for suitable opportunities to set up short positions.
If the bears can gain strength and move lower, the key support area to watch is around 4320–4330.
Risk warning: The above is only for sharing market ideas and does not constitute any investment advice. Market conditions change quickly—manage your position sizing and risk control well.
#美国拟迫各国在美中AI阵营选边 $XAU
Overall bias is bearish, but at this stage, when operating, you must be very cautious and not blindly optimistic. The market’s intraday swing on a daily-chart level is extremely large. Under the current bearish structure, there are essentially only two possible paths ahead: either it quickly breaks down and runs lower, or it keeps oscillating back and forth, grinding through the行情 via repeated consolidation.
There is another possibility that hasn’t been mentioned much earlier, and it’s actually also hard to predict in my mind: once the price can effectively hold above 4450, the upward momentum on the daily chart may likely push the price to spike toward around 4650.
However, until the 4450 level is broken, the bigger-picture direction remains bearish as the main idea.
For intraday short-term trades, from the one-hour cycle, the 4410–4435 range faces strong resistance. You can focus on this resistance band today and look for suitable opportunities to set up short positions.
If the bears can gain strength and move lower, the key support area to watch is around 4320–4330.
Risk warning: The above is only for sharing market ideas and does not constitute any investment advice. Market conditions change quickly—manage your position sizing and risk control well.
#美国拟迫各国在美中AI阵营选边 $XAU
166
·
--
The market never moves according to the expectations of the majority.
A few days ago, after BTC tested the bottom for the second time, it suddenly rebounded violently, leaving a group of people who were bearish down to 50,000 stunned.
As soon as this big bullish candle appeared, some people immediately started shouting "The bull is back, hurry back."
My personal opinion:
Throughout February and March, BTC will most likely fluctuate widely in the range of 60,000 to 72,000, with no unilateral trend, just back and forth washing and repeated tug-of-war.
The essence of the fluctuation is to unify the market's holding costs, building momentum for the next real trend.
I expect a significant rebound to start in April.
$BTC $ETH
The market never moves according to the expectations of the majority.
A few days ago, after BTC tested the bottom for the second time, it suddenly rebounded violently, leaving a group of people who were bearish down to 50,000 stunned.
As soon as this big bullish candle appeared, some people immediately started shouting "The bull is back, hurry back."
My personal opinion:
Throughout February and March, BTC will most likely fluctuate widely in the range of 60,000 to 72,000, with no unilateral trend, just back and forth washing and repeated tug-of-war.
The essence of the fluctuation is to unify the market's holding costs, building momentum for the next real trend.
I expect a significant rebound to start in April.
$BTC $ETH
A few days ago, after BTC tested the bottom for the second time, it suddenly rebounded violently, leaving a group of people who were bearish down to 50,000 stunned.
As soon as this big bullish candle appeared, some people immediately started shouting "The bull is back, hurry back."
My personal opinion:
Throughout February and March, BTC will most likely fluctuate widely in the range of 60,000 to 72,000, with no unilateral trend, just back and forth washing and repeated tug-of-war.
The essence of the fluctuation is to unify the market's holding costs, building momentum for the next real trend.
I expect a significant rebound to start in April.
$BTC $ETH
458
·
--
Bitcoin 1-hour cycle: Rebound momentum has completely exhausted, the bearish crushing pattern has emerged
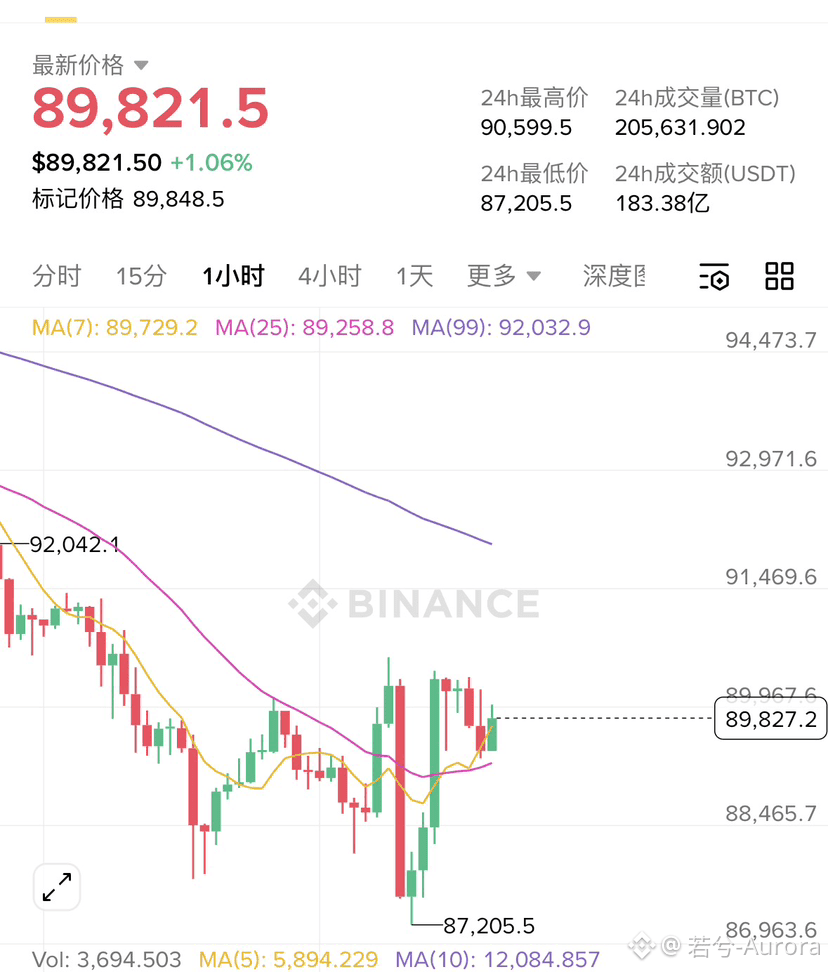
Bitcoin rebounded from a low of 87205, but after all this time, it still cannot stabilize at the critical 90000 level. The rebound highs are getting lower, and the strength of the bulls is visibly waning, with heavy selling pressure above like a mountain.
Looking at the short-term moving averages, MA7 and MA30 have long since turned downward, forming resistance. Every time the price barely stands above the moving averages, it gets pushed back down. The signal for a short-term trend reversal to bearish is already clear.
The recent candlestick patterns are even more interesting, all featuring long upper shadows. The range of 90000-90500 is like an iron plate, and it simply cannot break through. This is a typical bull trap; don't be fooled by the bulls into buying in.
Currently, the price is around the support of 89500, which looks as fragile as paper. If this position breaks, the next test will be the previous low of 87205, and breaking it will directly open up downward space.
In terms of operations, go short in the range of 90100-90600, with a target looking first at 88100-88600.
Bitcoin 1-hour cycle: Rebound momentum has completely exhausted, the bearish crushing pattern has emerged
Bitcoin rebounded from a low of 87205, but after all this time, it still cannot stabilize at the critical 90000 level. The rebound highs are getting lower, and the strength of the bulls is visibly waning, with heavy selling pressure above like a mountain.
Looking at the short-term moving averages, MA7 and MA30 have long since turned downward, forming resistance. Every time the price barely stands above the moving averages, it gets pushed back down. The signal for a short-term trend reversal to bearish is already clear.
The recent candlestick patterns are even more interesting, all featuring long upper shadows. The range of 90000-90500 is like an iron plate, and it simply cannot break through. This is a typical bull trap; don't be fooled by the bulls into buying in.
Currently, the price is around the support of 89500, which looks as fragile as paper. If this position breaks, the next test will be the previous low of 87205, and breaking it will directly open up downward space.
In terms of operations, go short in the range of 90100-90600, with a target looking first at 88100-88600.
Bitcoin rebounded from a low of 87205, but after all this time, it still cannot stabilize at the critical 90000 level. The rebound highs are getting lower, and the strength of the bulls is visibly waning, with heavy selling pressure above like a mountain.
Looking at the short-term moving averages, MA7 and MA30 have long since turned downward, forming resistance. Every time the price barely stands above the moving averages, it gets pushed back down. The signal for a short-term trend reversal to bearish is already clear.
The recent candlestick patterns are even more interesting, all featuring long upper shadows. The range of 90000-90500 is like an iron plate, and it simply cannot break through. This is a typical bull trap; don't be fooled by the bulls into buying in.
Currently, the price is around the support of 89500, which looks as fragile as paper. If this position breaks, the next test will be the previous low of 87205, and breaking it will directly open up downward space.
In terms of operations, go short in the range of 90100-90600, with a target looking first at 88100-88600.
225
·
--
At 21:30 tonight, the U.S. December non-farm employment report will be released, marking the first major data release of the year. The market currently expects a gain of 60,000 jobs, slightly revised down from the previous 64,000, while the unemployment rate is expected to fall from 4.6% to 4.5%. However, the earlier ADP employment data showed only a 41,000 increase, far below market expectations, signaling a weakening labor market in advance. This has made the "data gap" in this non-farm report the key variable that could trigger market movements.
From a logical perspective, if the non-farm data falls short of expectations—especially if job gains dip below 50,000 or the unemployment rate rebounds—the probability of a Fed rate cut in March will rise further. The U.S. dollar index is likely to face downward pressure, while gold could surge. Conversely, if the data significantly exceeds expectations, the rate cut outlook will be suppressed, and gold may see a short-term pullback, while the dollar gains strength.
Besides gold, cryptocurrencies also need close attention during this non-farm release. Here’s a swing short strategy for Bitcoin and Ethereum tonight:
• Bitcoin: Place short positions near the 91,500–92,000 range, with the first target at 89,600. If broken, aim for 87,800 as the next support level.
• Ethereum: Short simultaneously in the 3,160–3,190 range, targeting the 3,100 level first. If broken, look toward the 3,000 psychological level.
Finally, a reminder for retail investors: the market is likely to remain range-bound before the data release. Avoid blindly betting on a direction ahead of time. Wait for the data to come out, then follow the trend. Also, always set strict stop-losses—especially in cryptocurrencies, which are highly volatile. Maintain your risk control lines to avoid significant losses from sudden market moves.
$BTC $ETH $SOL
At 21:30 tonight, the U.S. December non-farm employment report will be released, marking the first major data release of the year. The market currently expects a gain of 60,000 jobs, slightly revised down from the previous 64,000, while the unemployment rate is expected to fall from 4.6% to 4.5%. However, the earlier ADP employment data showed only a 41,000 increase, far below market expectations, signaling a weakening labor market in advance. This has made the "data gap" in this non-farm report the key variable that could trigger market movements.
From a logical perspective, if the non-farm data falls short of expectations—especially if job gains dip below 50,000 or the unemployment rate rebounds—the probability of a Fed rate cut in March will rise further. The U.S. dollar index is likely to face downward pressure, while gold could surge. Conversely, if the data significantly exceeds expectations, the rate cut outlook will be suppressed, and gold may see a short-term pullback, while the dollar gains strength.
Besides gold, cryptocurrencies also need close attention during this non-farm release. Here’s a swing short strategy for Bitcoin and Ethereum tonight:
• Bitcoin: Place short positions near the 91,500–92,000 range, with the first target at 89,600. If broken, aim for 87,800 as the next support level.
• Ethereum: Short simultaneously in the 3,160–3,190 range, targeting the 3,100 level first. If broken, look toward the 3,000 psychological level.
Finally, a reminder for retail investors: the market is likely to remain range-bound before the data release. Avoid blindly betting on a direction ahead of time. Wait for the data to come out, then follow the trend. Also, always set strict stop-losses—especially in cryptocurrencies, which are highly volatile. Maintain your risk control lines to avoid significant losses from sudden market moves.
$BTC $ETH $SOL
From a logical perspective, if the non-farm data falls short of expectations—especially if job gains dip below 50,000 or the unemployment rate rebounds—the probability of a Fed rate cut in March will rise further. The U.S. dollar index is likely to face downward pressure, while gold could surge. Conversely, if the data significantly exceeds expectations, the rate cut outlook will be suppressed, and gold may see a short-term pullback, while the dollar gains strength.
Besides gold, cryptocurrencies also need close attention during this non-farm release. Here’s a swing short strategy for Bitcoin and Ethereum tonight:
• Bitcoin: Place short positions near the 91,500–92,000 range, with the first target at 89,600. If broken, aim for 87,800 as the next support level.
• Ethereum: Short simultaneously in the 3,160–3,190 range, targeting the 3,100 level first. If broken, look toward the 3,000 psychological level.
Finally, a reminder for retail investors: the market is likely to remain range-bound before the data release. Avoid blindly betting on a direction ahead of time. Wait for the data to come out, then follow the trend. Also, always set strict stop-losses—especially in cryptocurrencies, which are highly volatile. Maintain your risk control lines to avoid significant losses from sudden market moves.
$BTC $ETH $SOL
272
Log in to explore more content
Join global crypto users on Binance Square
⚡️ Get latest and useful information about crypto.
💬 Trusted by the world’s largest crypto exchange.
👍 Discover real insights from verified creators.
Email / Phone number