

Crypto子棋
1.4k Posts

Crypto子棋
 Square Verified
Report
Block User
专注区块链行情分析,投资分享,挖掘财富密码,分享优质项目!X账号:@cloakmk

Macro KOL

原创之星

BTC Holder
Frequent Trader
8.9 Years
21 Following
15.4K+ Followers
35.4K+ Liked
2 Badges
Posts
All
Quotes
Videos
·
--
Bullish
Chasing highs—I'm a professional!😄
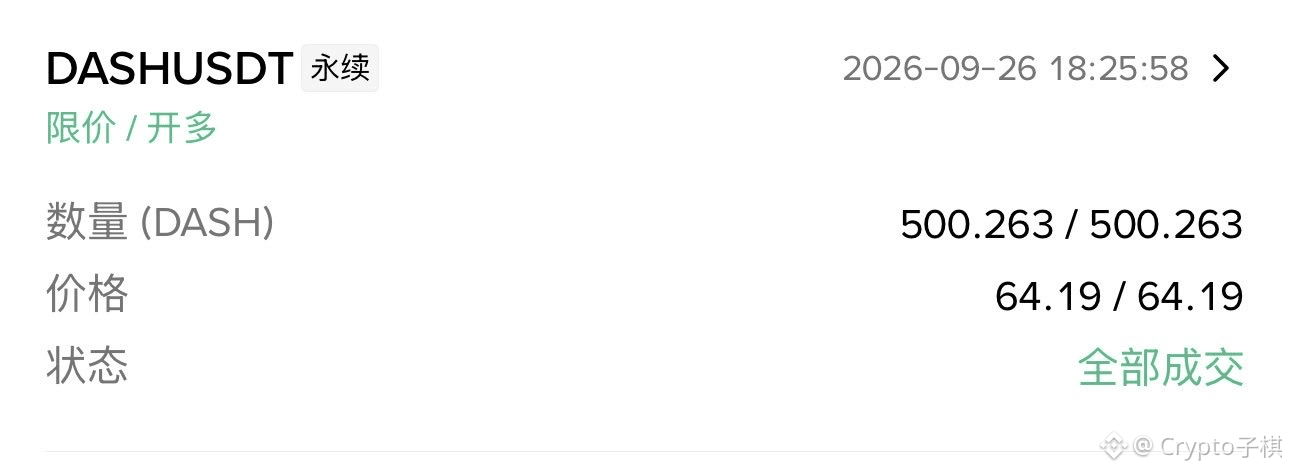
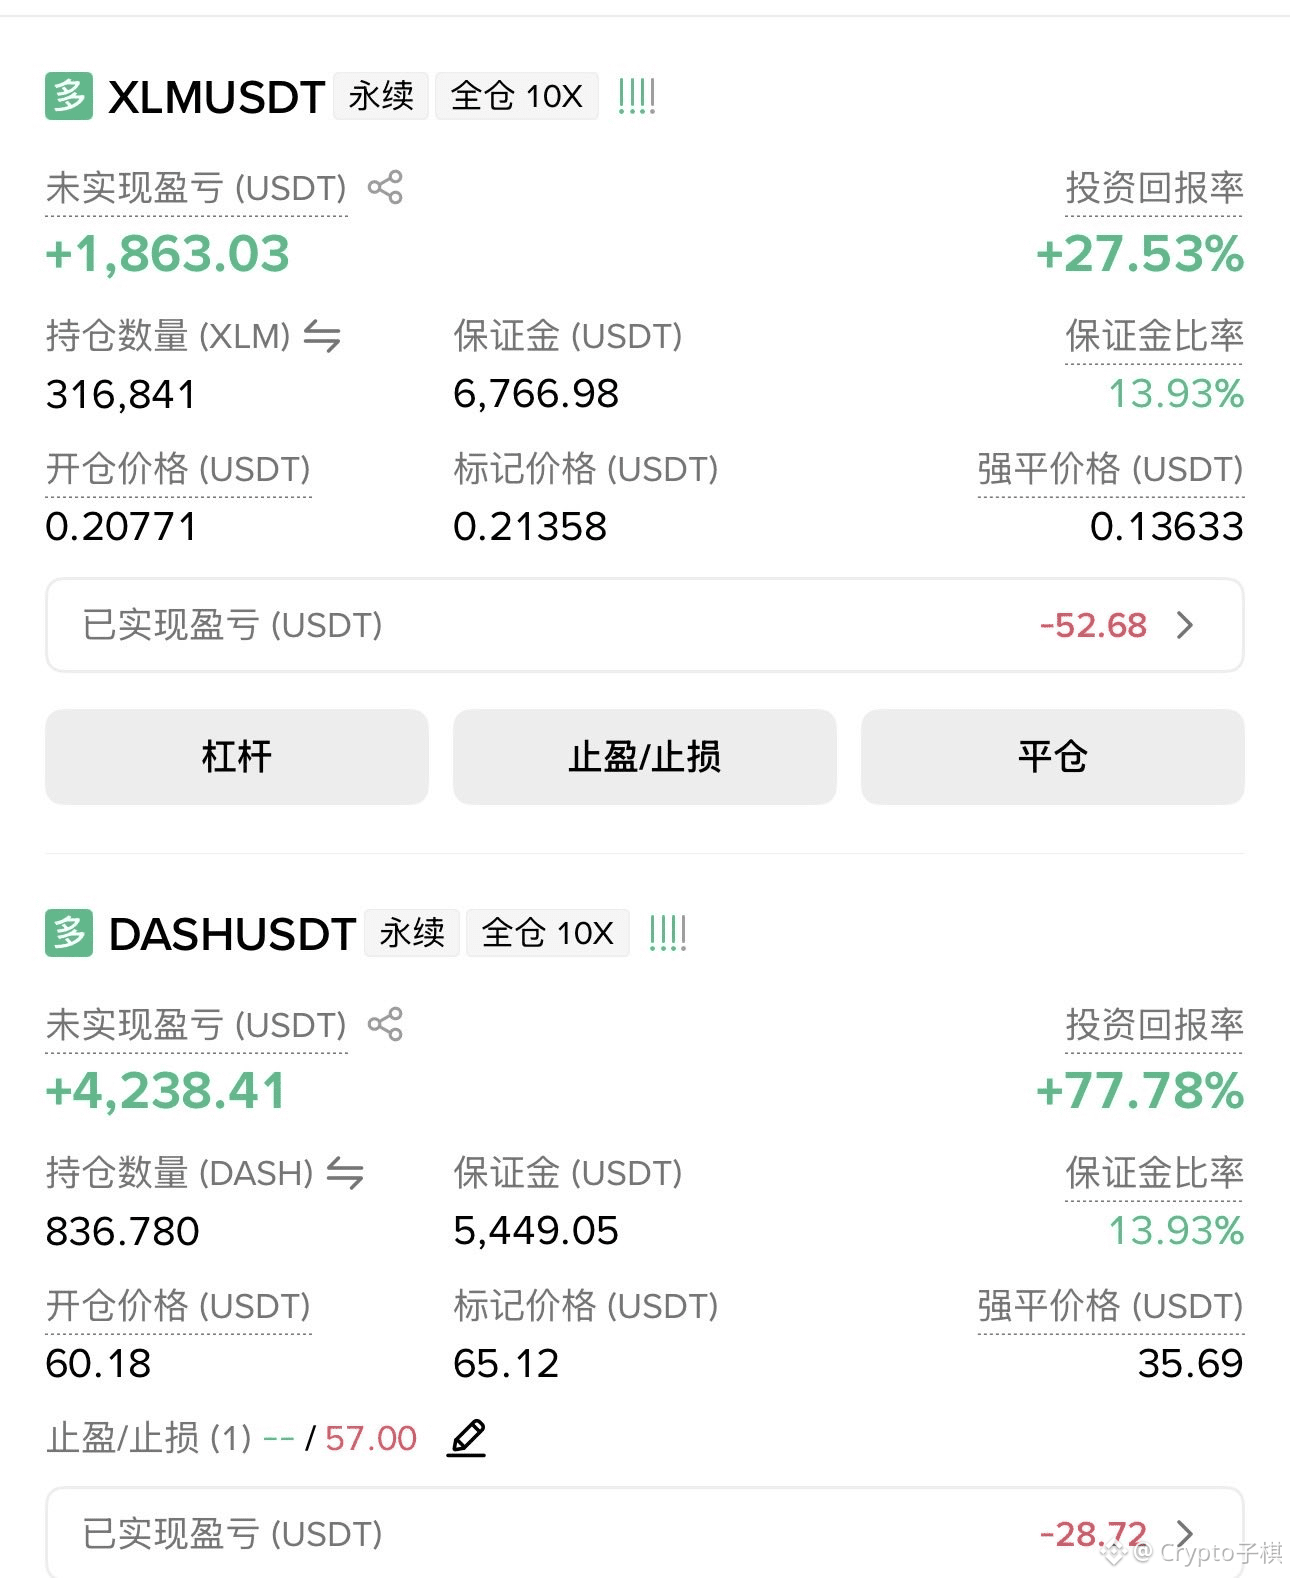
To be honest, I've been going head-to-head with DASH recently. Mainly because its value-for-money is great, and its trend looks pretty good too—the bottom is gradually rising, and there's a volume-backed breakout sprint going on!
Just now I saw DASH rise for no apparent reason, so I went in with 64. The position size isn't big, but in just a moment it climbed to 69. A rise of 8%—I'm pretty satisfied with that…
I've tried trading the swings several times, but I never managed to hold the position. Hopefully this time won't disappoint me 😂 The main uptrend wave is starting—break through the recent high, please 😄
Chasing highs—I'm a professional!😄
To be honest, I've been going head-to-head with DASH recently. Mainly because its value-for-money is great, and its trend looks pretty good too—the bottom is gradually rising, and there's a volume-backed breakout sprint going on!
Just now I saw DASH rise for no apparent reason, so I went in with 64. The position size isn't big, but in just a moment it climbed to 69. A rise of 8%—I'm pretty satisfied with that…
I've tried trading the swings several times, but I never managed to hold the position. Hopefully this time won't disappoint me 😂 The main uptrend wave is starting—break through the recent high, please 😄
To be honest, I've been going head-to-head with DASH recently. Mainly because its value-for-money is great, and its trend looks pretty good too—the bottom is gradually rising, and there's a volume-backed breakout sprint going on!
Just now I saw DASH rise for no apparent reason, so I went in with 64. The position size isn't big, but in just a moment it climbed to 69. A rise of 8%—I'm pretty satisfied with that…
I've tried trading the swings several times, but I never managed to hold the position. Hopefully this time won't disappoint me 😂 The main uptrend wave is starting—break through the recent high, please 😄
1
1.1k
·
--
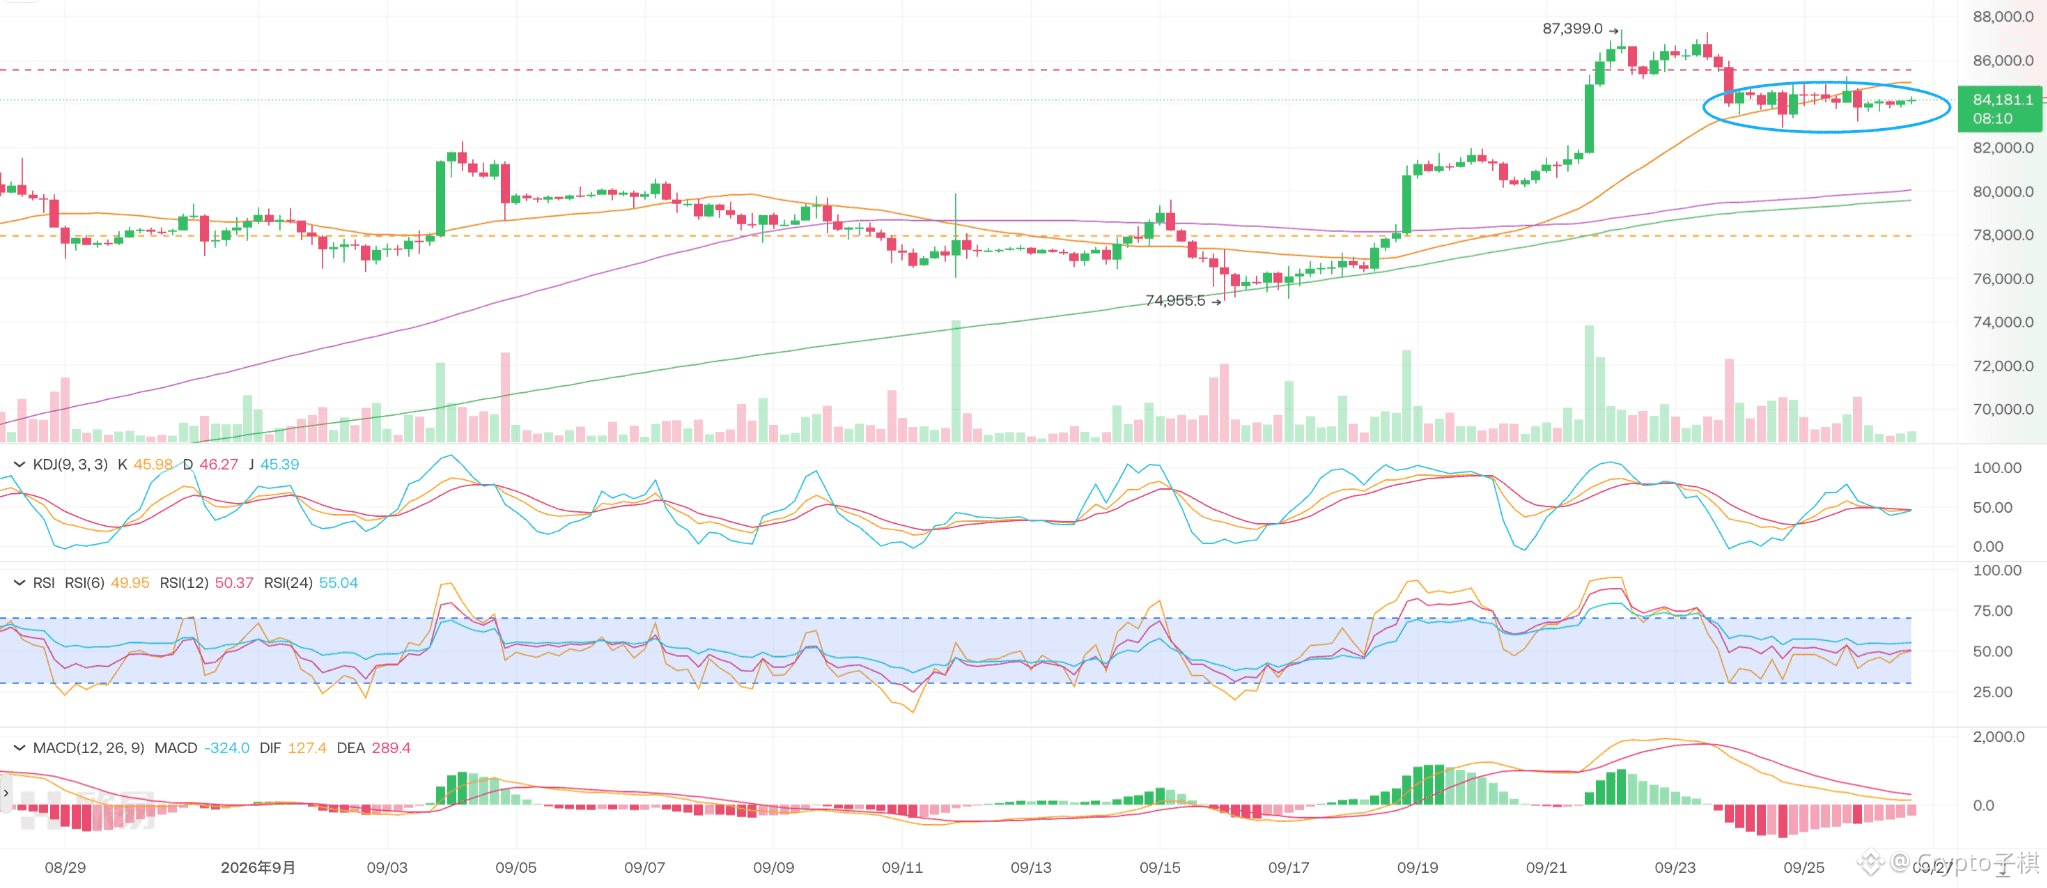
The weekend was sideways trading with reduced volume. It’s basically just waiting for Monday’s U.S. stock market to provide direction.
After a push up to 87,400 then a pullback, the price has remained locked between 83,000 and 85,000. RSI has returned to 50; the KDJ has dulled in the middle; the bearish MACD histogram bars have shortened. This indicates that the momentum for chasing higher has ebbed, and that proactive selling is also limited.
Right now it’s neither building energy for a breakout nor flipping to a bearish trend. It’s a waiting game between bulls and bears for a new pricing signal.
The ETF has seen net inflows for seven straight days, which shows institutions are still accumulating. But the single-day inflow has fallen to about $134 million, which can only support the price and not yet push it through.
Over the next two days, it’s likely to keep ranging. The real direction will be chosen after Monday’s U.S. market opens: if it holds above 85,000 with increased volume, first look at 86,000, then test 87,400. If it breaks below 83,000, then expect a pullback to 81,500–82,000.
My view: in the short term it’s slightly bullish, but before a breakout above 86,000, any rise is merely a range rebound. On Monday, focus on the Nasdaq index and U.S. Treasury yields—whichever one breaks the balance first will determine which way BTC goes.
The weekend was sideways trading with reduced volume. It’s basically just waiting for Monday’s U.S. stock market to provide direction.
After a push up to 87,400 then a pullback, the price has remained locked between 83,000 and 85,000. RSI has returned to 50; the KDJ has dulled in the middle; the bearish MACD histogram bars have shortened. This indicates that the momentum for chasing higher has ebbed, and that proactive selling is also limited.
Right now it’s neither building energy for a breakout nor flipping to a bearish trend. It’s a waiting game between bulls and bears for a new pricing signal.
The ETF has seen net inflows for seven straight days, which shows institutions are still accumulating. But the single-day inflow has fallen to about $134 million, which can only support the price and not yet push it through.
Over the next two days, it’s likely to keep ranging. The real direction will be chosen after Monday’s U.S. market opens: if it holds above 85,000 with increased volume, first look at 86,000, then test 87,400. If it breaks below 83,000, then expect a pullback to 81,500–82,000.
My view: in the short term it’s slightly bullish, but before a breakout above 86,000, any rise is merely a range rebound. On Monday, focus on the Nasdaq index and U.S. Treasury yields—whichever one breaks the balance first will determine which way BTC goes.
After a push up to 87,400 then a pullback, the price has remained locked between 83,000 and 85,000. RSI has returned to 50; the KDJ has dulled in the middle; the bearish MACD histogram bars have shortened. This indicates that the momentum for chasing higher has ebbed, and that proactive selling is also limited.
Right now it’s neither building energy for a breakout nor flipping to a bearish trend. It’s a waiting game between bulls and bears for a new pricing signal.
The ETF has seen net inflows for seven straight days, which shows institutions are still accumulating. But the single-day inflow has fallen to about $134 million, which can only support the price and not yet push it through.
Over the next two days, it’s likely to keep ranging. The real direction will be chosen after Monday’s U.S. market opens: if it holds above 85,000 with increased volume, first look at 86,000, then test 87,400. If it breaks below 83,000, then expect a pullback to 81,500–82,000.
My view: in the short term it’s slightly bullish, but before a breakout above 86,000, any rise is merely a range rebound. On Monday, focus on the Nasdaq index and U.S. Treasury yields—whichever one breaks the balance first will determine which way BTC goes.
2
635
·
--
Why, when the market looks better, should you actually lower your return expectations?
Recently the market has been doing well. In a short period of time, BTC has risen more than 40%, reaching 84,000. Since it’s still going up, many people are already targeting 95,000!
When I first entered the crypto space, I thought in a bull market you should be more bold and take bigger risks.
BTC is rising, altcoins are catching up, and in groups people talk about doubling every day. If you don’t go heavy, isn’t that wasting the opportunity?
Later, I finally understood: the closer you get to the moment when everyone seems to understand, the worse the odds usually are.
In one of my earlier market cycles, I made a lot of money in the beginning. My account grew significantly, but I felt the returns still weren’t enough.
At the early low prices, I didn’t dare to buy. I waited until the trend was confirmed, and when sentiment was at its hottest, that’s when I started adding leverage and chasing small coins. My goal also shifted from making 30% to having to double. Then, with just one normal pullback, the market took back most of the profits I’d made over the prior few months.
At the start of a trend, prices are lower and disagreements are bigger—people willing to bear uncertainty take the higher-odds side.
Later on, the news is better and consensus is stronger, but the cost of the capital (the price of the “tickets”) is also higher.
At this point, it may look like the risk is the lowest. In reality, incremental new buying is decreasing. Any good news that falls short of expectations could trigger crowded positioning to exit all at once.
So when the market gets hotter, what I pay attention to isn’t how much more it can rise, but rather: if there’s suddenly a pullback, how much am I willing to give back? Sensible de-leveraging and taking profits to lock in principal isn’t bearish—it’s simply preventing greed from undoing trades that were already correct.
Remember: the better the market, the easier it is to make money—yet the harder it is to keep profits. A truly mature bull-market strategy isn’t to eat every segment of the rally; it’s not to put all the gains back on the table at the most excited moment.
Why, when the market looks better, should you actually lower your return expectations?
Recently the market has been doing well. In a short period of time, BTC has risen more than 40%, reaching 84,000. Since it’s still going up, many people are already targeting 95,000!
When I first entered the crypto space, I thought in a bull market you should be more bold and take bigger risks.
BTC is rising, altcoins are catching up, and in groups people talk about doubling every day. If you don’t go heavy, isn’t that wasting the opportunity?
Later, I finally understood: the closer you get to the moment when everyone seems to understand, the worse the odds usually are.
In one of my earlier market cycles, I made a lot of money in the beginning. My account grew significantly, but I felt the returns still weren’t enough.
At the early low prices, I didn’t dare to buy. I waited until the trend was confirmed, and when sentiment was at its hottest, that’s when I started adding leverage and chasing small coins. My goal also shifted from making 30% to having to double. Then, with just one normal pullback, the market took back most of the profits I’d made over the prior few months.
At the start of a trend, prices are lower and disagreements are bigger—people willing to bear uncertainty take the higher-odds side.
Later on, the news is better and consensus is stronger, but the cost of the capital (the price of the “tickets”) is also higher.
At this point, it may look like the risk is the lowest. In reality, incremental new buying is decreasing. Any good news that falls short of expectations could trigger crowded positioning to exit all at once.
So when the market gets hotter, what I pay attention to isn’t how much more it can rise, but rather: if there’s suddenly a pullback, how much am I willing to give back? Sensible de-leveraging and taking profits to lock in principal isn’t bearish—it’s simply preventing greed from undoing trades that were already correct.
Remember: the better the market, the easier it is to make money—yet the harder it is to keep profits. A truly mature bull-market strategy isn’t to eat every segment of the rally; it’s not to put all the gains back on the table at the most excited moment.
Recently the market has been doing well. In a short period of time, BTC has risen more than 40%, reaching 84,000. Since it’s still going up, many people are already targeting 95,000!
When I first entered the crypto space, I thought in a bull market you should be more bold and take bigger risks.
BTC is rising, altcoins are catching up, and in groups people talk about doubling every day. If you don’t go heavy, isn’t that wasting the opportunity?
Later, I finally understood: the closer you get to the moment when everyone seems to understand, the worse the odds usually are.
In one of my earlier market cycles, I made a lot of money in the beginning. My account grew significantly, but I felt the returns still weren’t enough.
At the early low prices, I didn’t dare to buy. I waited until the trend was confirmed, and when sentiment was at its hottest, that’s when I started adding leverage and chasing small coins. My goal also shifted from making 30% to having to double. Then, with just one normal pullback, the market took back most of the profits I’d made over the prior few months.
At the start of a trend, prices are lower and disagreements are bigger—people willing to bear uncertainty take the higher-odds side.
Later on, the news is better and consensus is stronger, but the cost of the capital (the price of the “tickets”) is also higher.
At this point, it may look like the risk is the lowest. In reality, incremental new buying is decreasing. Any good news that falls short of expectations could trigger crowded positioning to exit all at once.
So when the market gets hotter, what I pay attention to isn’t how much more it can rise, but rather: if there’s suddenly a pullback, how much am I willing to give back? Sensible de-leveraging and taking profits to lock in principal isn’t bearish—it’s simply preventing greed from undoing trades that were already correct.
Remember: the better the market, the easier it is to make money—yet the harder it is to keep profits. A truly mature bull-market strategy isn’t to eat every segment of the rally; it’s not to put all the gains back on the table at the most excited moment.
1
1
1.4k
·
--
After BTC spikes up 87.4 thousand dollars and then falls: is it a shakeout or a failed breakout?
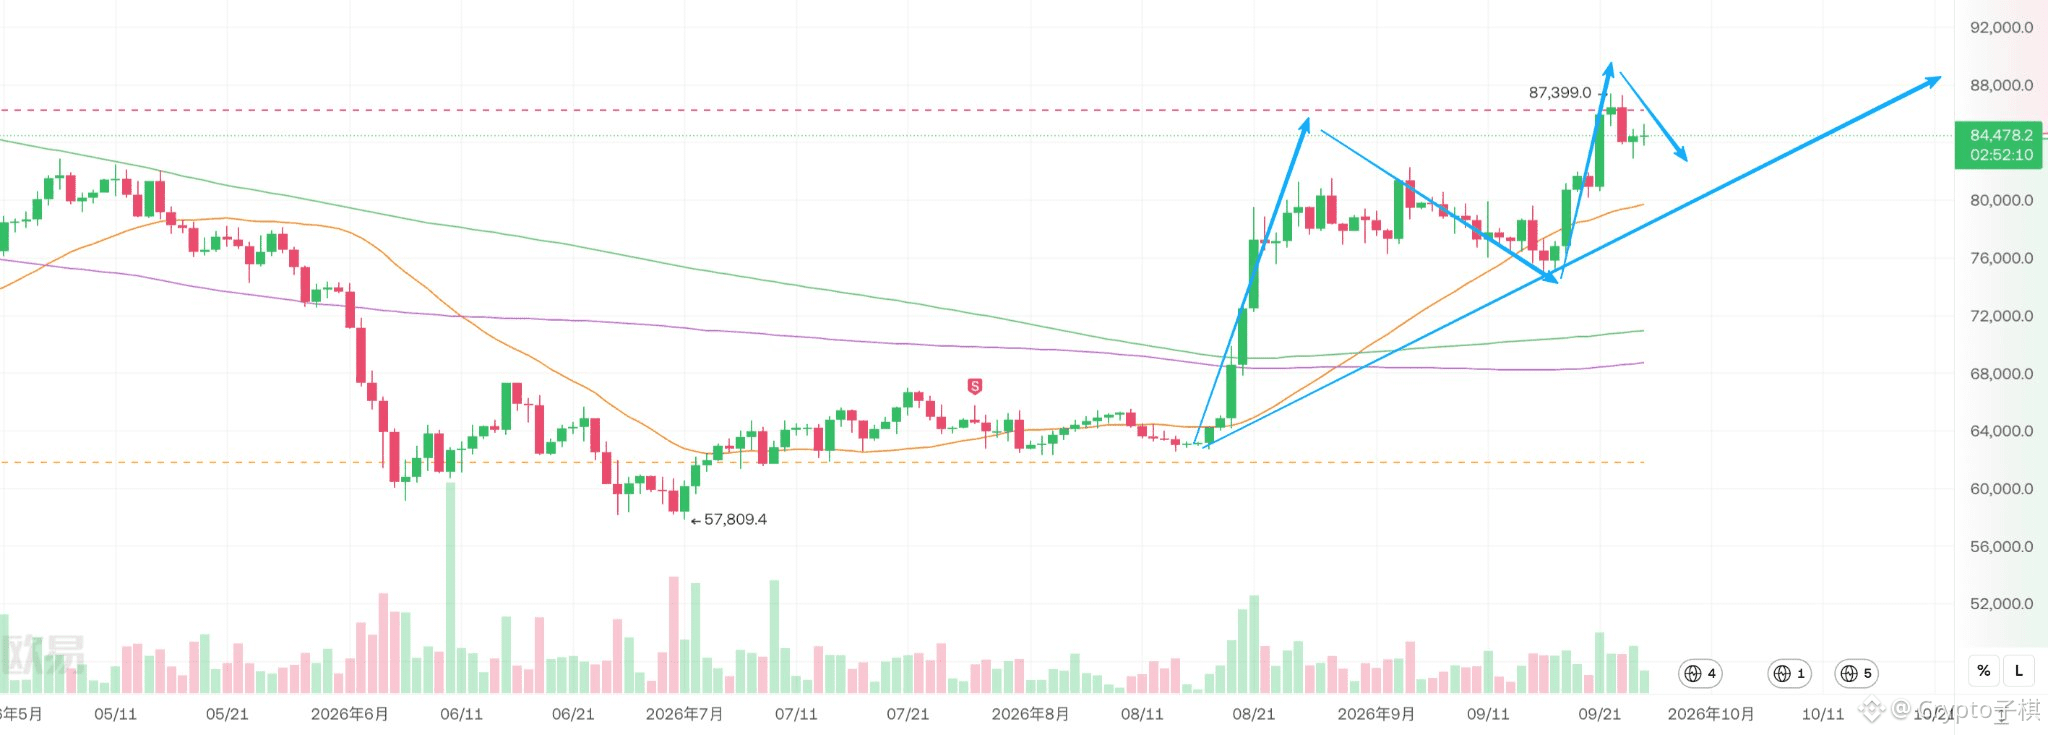
The daily chart trend is still somewhat bullish. The 4-hour chart is currently pulling back to confirm. Resistance around 88k is strong, but we still can’t conclude that the entire upswing has ended.
This rally has been driven by spot ETF buying as well as short-covering from the bearish side—not just a simple futures wick.
During the pullback, open interest has clearly declined. Funding rates briefly turned negative, suggesting leveraged long exposure at the highs is being cleared. Even though the price has retraced, ETFs are still maintaining net inflows, and exchange balances have not increased noticeably.
At this point, it looks more like profit-taking and high-level turnover rather than a coordinated institutional withdrawal.
Technically, the daily chart is still trading above the short-term moving averages, and the upward structure hasn’t been broken. However, on the 4-hour chart, the recent highs have started to slope downward, and trading volume hasn’t continued to expand. Bulls have shifted from active offense to defense.
Next, focus on three key zones:
$83k–$84k is the first support. If it holds, there is still a chance for a rebound toward $86k, and then another attempt to challenge the $87.4k–$88k range.
$80k–$82k is the lifeline for this breakout. A pullback that doesn’t break it is a normal shakeout; if it breaks down and then rebounds but can’t reclaim the level, the market will transition into a weaker, range-bound consolidation.
Only if price can increase in volume and hold above $88k will there be an opportunity to open up the space toward $90k–$92k.
Risk appetite in US stocks hasn’t deteriorated across the board for now, but the 10-year Treasury yield has returned above 5%. Higher interest rates will continue to limit BTC’s upside.
Over the next few days, I’m inclined to expect first consolidation, then a directional move. For position protection, watch the $82k level. If you’ve missed the move, wait for the pullback to confirm. The bias is bullish, but it doesn’t mean every entry point is worth buying.
After BTC spikes up 87.4 thousand dollars and then falls: is it a shakeout or a failed breakout?
The daily chart trend is still somewhat bullish. The 4-hour chart is currently pulling back to confirm. Resistance around 88k is strong, but we still can’t conclude that the entire upswing has ended.
This rally has been driven by spot ETF buying as well as short-covering from the bearish side—not just a simple futures wick.
During the pullback, open interest has clearly declined. Funding rates briefly turned negative, suggesting leveraged long exposure at the highs is being cleared. Even though the price has retraced, ETFs are still maintaining net inflows, and exchange balances have not increased noticeably.
At this point, it looks more like profit-taking and high-level turnover rather than a coordinated institutional withdrawal.
Technically, the daily chart is still trading above the short-term moving averages, and the upward structure hasn’t been broken. However, on the 4-hour chart, the recent highs have started to slope downward, and trading volume hasn’t continued to expand. Bulls have shifted from active offense to defense.
Next, focus on three key zones:
$83k–$84k is the first support. If it holds, there is still a chance for a rebound toward $86k, and then another attempt to challenge the $87.4k–$88k range.
$80k–$82k is the lifeline for this breakout. A pullback that doesn’t break it is a normal shakeout; if it breaks down and then rebounds but can’t reclaim the level, the market will transition into a weaker, range-bound consolidation.
Only if price can increase in volume and hold above $88k will there be an opportunity to open up the space toward $90k–$92k.
Risk appetite in US stocks hasn’t deteriorated across the board for now, but the 10-year Treasury yield has returned above 5%. Higher interest rates will continue to limit BTC’s upside.
Over the next few days, I’m inclined to expect first consolidation, then a directional move. For position protection, watch the $82k level. If you’ve missed the move, wait for the pullback to confirm. The bias is bullish, but it doesn’t mean every entry point is worth buying.
The daily chart trend is still somewhat bullish. The 4-hour chart is currently pulling back to confirm. Resistance around 88k is strong, but we still can’t conclude that the entire upswing has ended.
This rally has been driven by spot ETF buying as well as short-covering from the bearish side—not just a simple futures wick.
During the pullback, open interest has clearly declined. Funding rates briefly turned negative, suggesting leveraged long exposure at the highs is being cleared. Even though the price has retraced, ETFs are still maintaining net inflows, and exchange balances have not increased noticeably.
At this point, it looks more like profit-taking and high-level turnover rather than a coordinated institutional withdrawal.
Technically, the daily chart is still trading above the short-term moving averages, and the upward structure hasn’t been broken. However, on the 4-hour chart, the recent highs have started to slope downward, and trading volume hasn’t continued to expand. Bulls have shifted from active offense to defense.
Next, focus on three key zones:
$83k–$84k is the first support. If it holds, there is still a chance for a rebound toward $86k, and then another attempt to challenge the $87.4k–$88k range.
$80k–$82k is the lifeline for this breakout. A pullback that doesn’t break it is a normal shakeout; if it breaks down and then rebounds but can’t reclaim the level, the market will transition into a weaker, range-bound consolidation.
Only if price can increase in volume and hold above $88k will there be an opportunity to open up the space toward $90k–$92k.
Risk appetite in US stocks hasn’t deteriorated across the board for now, but the 10-year Treasury yield has returned above 5%. Higher interest rates will continue to limit BTC’s upside.
Over the next few days, I’m inclined to expect first consolidation, then a directional move. For position protection, watch the $82k level. If you’ve missed the move, wait for the pullback to confirm. The bias is bullish, but it doesn’t mean every entry point is worth buying.
1
1.1k
·
--
I think I finally get it—once I make a little profit and then post on X, the market basically starts leading the way down!
It’s too accurate. I posted just a little while last night, and then it started dropping. The position didn’t just fail to profit—it actually went into loss. What do I do!
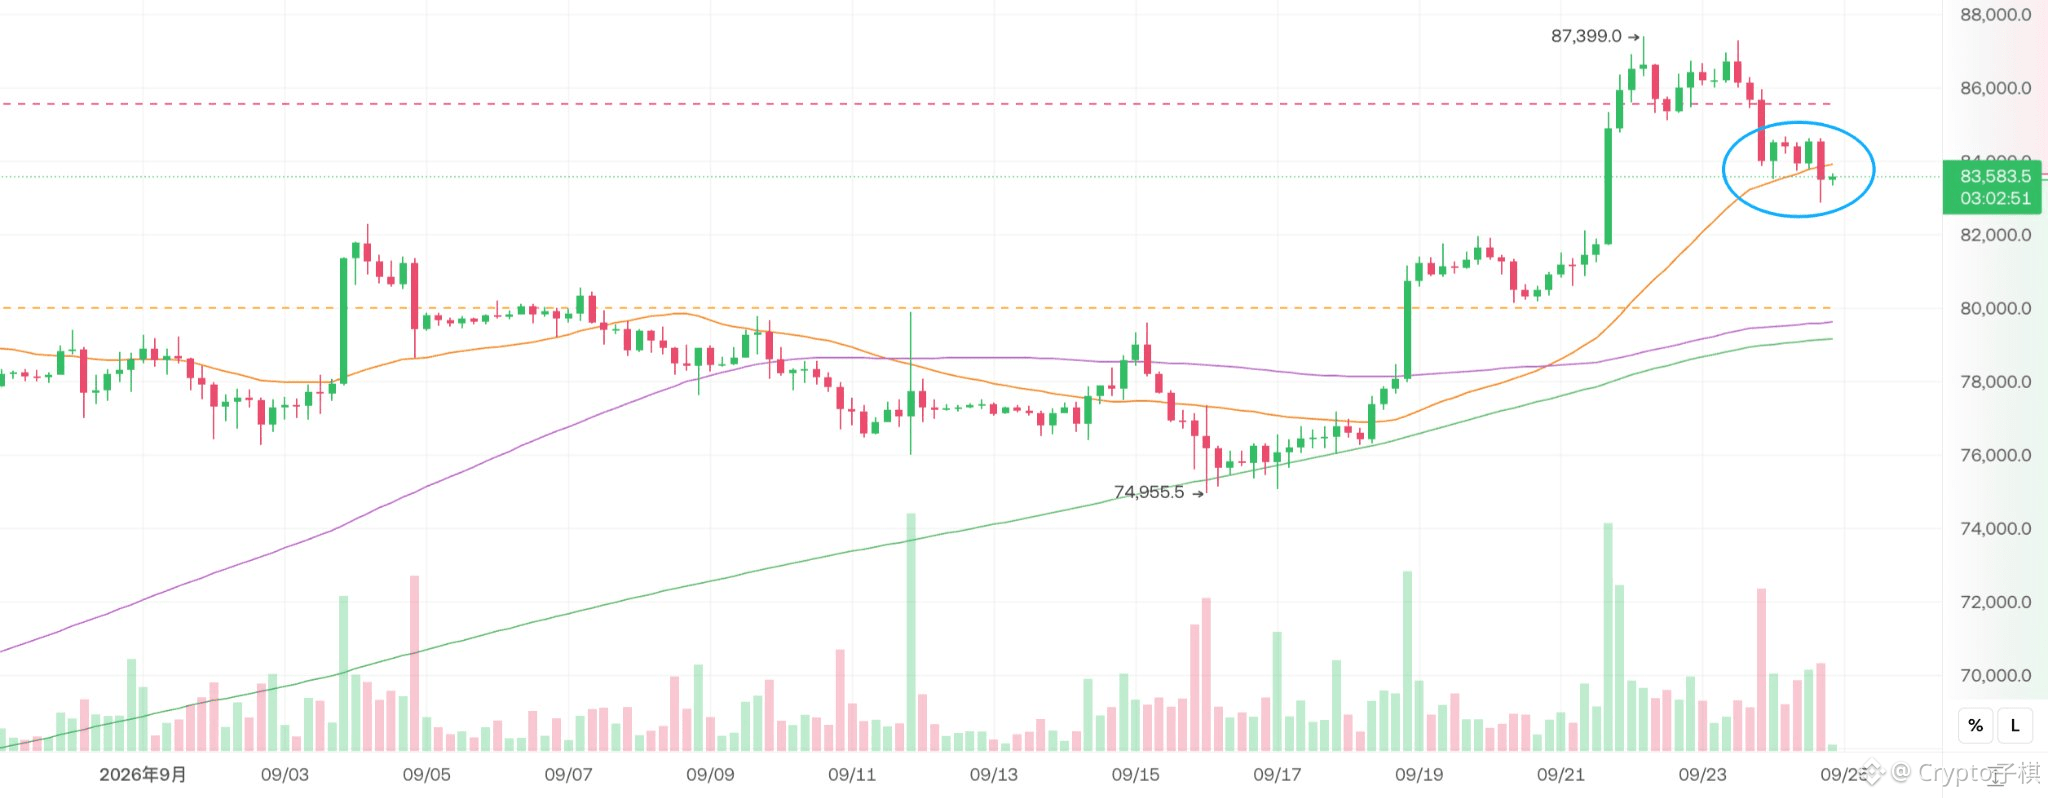
BTC has fallen from 874,000 to 835,000. Right now it looks more like a normal pullback after a breakout rather than a confirmed top. But the 4-hour chart has shifted from strong upward momentum to range-bound consolidation in the upper area.
First, I’m watching 830,000. The core line of defense is 820,000. If 820,000 holds, there’s still a chance to return to 850,000–860,000, and then challenge 874,000 again. If it breaks below 820,000 on increased volume, it may pull back toward 800,000. Weakness could continue, even reaching 780,000.
ETF flows are still coming in, which suggests the market is being supported, but the price isn’t moving up in sync. That also reflects heavier sell pressure overhead. My strategy is: for holders, defend with 820,000; for those who are sidelined, don’t chase—wait for support to stabilize before considering following.
I think I finally get it—once I make a little profit and then post on X, the market basically starts leading the way down!
It’s too accurate. I posted just a little while last night, and then it started dropping. The position didn’t just fail to profit—it actually went into loss. What do I do!
BTC has fallen from 874,000 to 835,000. Right now it looks more like a normal pullback after a breakout rather than a confirmed top. But the 4-hour chart has shifted from strong upward momentum to range-bound consolidation in the upper area.
First, I’m watching 830,000. The core line of defense is 820,000. If 820,000 holds, there’s still a chance to return to 850,000–860,000, and then challenge 874,000 again. If it breaks below 820,000 on increased volume, it may pull back toward 800,000. Weakness could continue, even reaching 780,000.
ETF flows are still coming in, which suggests the market is being supported, but the price isn’t moving up in sync. That also reflects heavier sell pressure overhead. My strategy is: for holders, defend with 820,000; for those who are sidelined, don’t chase—wait for support to stabilize before considering following.
It’s too accurate. I posted just a little while last night, and then it started dropping. The position didn’t just fail to profit—it actually went into loss. What do I do!
BTC has fallen from 874,000 to 835,000. Right now it looks more like a normal pullback after a breakout rather than a confirmed top. But the 4-hour chart has shifted from strong upward momentum to range-bound consolidation in the upper area.
First, I’m watching 830,000. The core line of defense is 820,000. If 820,000 holds, there’s still a chance to return to 850,000–860,000, and then challenge 874,000 again. If it breaks below 820,000 on increased volume, it may pull back toward 800,000. Weakness could continue, even reaching 780,000.
ETF flows are still coming in, which suggests the market is being supported, but the price isn’t moving up in sync. That also reflects heavier sell pressure overhead. My strategy is: for holders, defend with 820,000; for those who are sidelined, don’t chase—wait for support to stabilize before considering following.
Crypto子棋
·
--
Now BTC is consolidating around 85,000. I think this round of rally has already reached the mid-to-late stage; a 50% gain is expected to be around 92,000!
This rise is kind of inexplicable, but it’s very obvious that the market can’t keep going up forever—some pullback is inevitable. As it stands, the monthly chart has already turned three straight bullish candles. At this point, it’s impossible for me to chase the price higher.
My approach is mainly short-term futures: take profit and run. The moment there’s any sign of trouble, I leave immediately—no hesitation, no attachment. If I can make a bit of money, that’s enough.
Earlier, I analyzed that this rally will last about three months. After that, there will be a pullback of more than 15%. Right now, I’m still firmly of this view. For those of you who might miss the move, I recommend short-term trading—advance quickly, exit quickly—then wait for a big opportunity to re-enter again……
This rise is kind of inexplicable, but it’s very obvious that the market can’t keep going up forever—some pullback is inevitable. As it stands, the monthly chart has already turned three straight bullish candles. At this point, it’s impossible for me to chase the price higher.
My approach is mainly short-term futures: take profit and run. The moment there’s any sign of trouble, I leave immediately—no hesitation, no attachment. If I can make a bit of money, that’s enough.
Earlier, I analyzed that this rally will last about three months. After that, there will be a pullback of more than 15%. Right now, I’m still firmly of this view. For those of you who might miss the move, I recommend short-term trading—advance quickly, exit quickly—then wait for a big opportunity to re-enter again……
1
668
·
--
Why can’t profitable positions be held for long, but losing positions can be held for a long time?
After years of trading, I’ve noticed that people’s patience for profits and losses is completely opposite.
When a coin gains 10%, you start panicking that the profit will be given back. Even a minor pullback makes you rush to lock in your gains. Another coin is down 30%, but instead you begin to study its long-term value, telling yourself that as long as you don’t sell, it doesn’t really count as a loss.
The result is often: small wins are cashed out quickly, while big losses are postponed indefinitely.
I used to be like that, too.
I’d exit a winning position on a single bearish candle, because once I sell, the profit finally becomes “mine.” But losing positions keep getting opportunities, because stopping out is equivalent to admitting that my judgment was wrong.
On the surface, it looks like you’re controlling risk. In reality, you’re just eager to feel “right,” while avoiding the embarrassment that comes with being wrong.
But your account doesn’t care about your pride.
Whether a profitable position should truly be sold depends on whether the trend and the original buy logic have failed. Whether a losing position should be held doesn’t depend on how far it has dropped; it depends on whether, after re-evaluation now, it’s still worth tying up your capital.
If every time you cut profits short and let losses grow, even a high win rate can still be ruined by a small number of mistakes.
Remember: holding profits requires tolerating fluctuations; stopping losses requires admitting you got it wrong. The hardest part of trading isn’t deciding which way price will go—it’s not letting emotions decide the lifespan of your positions.
Why can’t profitable positions be held for long, but losing positions can be held for a long time?
After years of trading, I’ve noticed that people’s patience for profits and losses is completely opposite.
When a coin gains 10%, you start panicking that the profit will be given back. Even a minor pullback makes you rush to lock in your gains. Another coin is down 30%, but instead you begin to study its long-term value, telling yourself that as long as you don’t sell, it doesn’t really count as a loss.
The result is often: small wins are cashed out quickly, while big losses are postponed indefinitely.
I used to be like that, too.
I’d exit a winning position on a single bearish candle, because once I sell, the profit finally becomes “mine.” But losing positions keep getting opportunities, because stopping out is equivalent to admitting that my judgment was wrong.
On the surface, it looks like you’re controlling risk. In reality, you’re just eager to feel “right,” while avoiding the embarrassment that comes with being wrong.
But your account doesn’t care about your pride.
Whether a profitable position should truly be sold depends on whether the trend and the original buy logic have failed. Whether a losing position should be held doesn’t depend on how far it has dropped; it depends on whether, after re-evaluation now, it’s still worth tying up your capital.
If every time you cut profits short and let losses grow, even a high win rate can still be ruined by a small number of mistakes.
Remember: holding profits requires tolerating fluctuations; stopping losses requires admitting you got it wrong. The hardest part of trading isn’t deciding which way price will go—it’s not letting emotions decide the lifespan of your positions.
After years of trading, I’ve noticed that people’s patience for profits and losses is completely opposite.
When a coin gains 10%, you start panicking that the profit will be given back. Even a minor pullback makes you rush to lock in your gains. Another coin is down 30%, but instead you begin to study its long-term value, telling yourself that as long as you don’t sell, it doesn’t really count as a loss.
The result is often: small wins are cashed out quickly, while big losses are postponed indefinitely.
I used to be like that, too.
I’d exit a winning position on a single bearish candle, because once I sell, the profit finally becomes “mine.” But losing positions keep getting opportunities, because stopping out is equivalent to admitting that my judgment was wrong.
On the surface, it looks like you’re controlling risk. In reality, you’re just eager to feel “right,” while avoiding the embarrassment that comes with being wrong.
But your account doesn’t care about your pride.
Whether a profitable position should truly be sold depends on whether the trend and the original buy logic have failed. Whether a losing position should be held doesn’t depend on how far it has dropped; it depends on whether, after re-evaluation now, it’s still worth tying up your capital.
If every time you cut profits short and let losses grow, even a high win rate can still be ruined by a small number of mistakes.
Remember: holding profits requires tolerating fluctuations; stopping losses requires admitting you got it wrong. The hardest part of trading isn’t deciding which way price will go—it’s not letting emotions decide the lifespan of your positions.
1
5
3.7k
·
--
Now BTC is consolidating around 85,000. I think this round of rally has already reached the mid-to-late stage; a 50% gain is expected to be around 92,000!
This rise is kind of inexplicable, but it’s very obvious that the market can’t keep going up forever—some pullback is inevitable. As it stands, the monthly chart has already turned three straight bullish candles. At this point, it’s impossible for me to chase the price higher.
My approach is mainly short-term futures: take profit and run. The moment there’s any sign of trouble, I leave immediately—no hesitation, no attachment. If I can make a bit of money, that’s enough.
Earlier, I analyzed that this rally will last about three months. After that, there will be a pullback of more than 15%. Right now, I’m still firmly of this view. For those of you who might miss the move, I recommend short-term trading—advance quickly, exit quickly—then wait for a big opportunity to re-enter again……
Now BTC is consolidating around 85,000. I think this round of rally has already reached the mid-to-late stage; a 50% gain is expected to be around 92,000!
This rise is kind of inexplicable, but it’s very obvious that the market can’t keep going up forever—some pullback is inevitable. As it stands, the monthly chart has already turned three straight bullish candles. At this point, it’s impossible for me to chase the price higher.
My approach is mainly short-term futures: take profit and run. The moment there’s any sign of trouble, I leave immediately—no hesitation, no attachment. If I can make a bit of money, that’s enough.
Earlier, I analyzed that this rally will last about three months. After that, there will be a pullback of more than 15%. Right now, I’m still firmly of this view. For those of you who might miss the move, I recommend short-term trading—advance quickly, exit quickly—then wait for a big opportunity to re-enter again……
This rise is kind of inexplicable, but it’s very obvious that the market can’t keep going up forever—some pullback is inevitable. As it stands, the monthly chart has already turned three straight bullish candles. At this point, it’s impossible for me to chase the price higher.
My approach is mainly short-term futures: take profit and run. The moment there’s any sign of trouble, I leave immediately—no hesitation, no attachment. If I can make a bit of money, that’s enough.
Earlier, I analyzed that this rally will last about three months. After that, there will be a pullback of more than 15%. Right now, I’m still firmly of this view. For those of you who might miss the move, I recommend short-term trading—advance quickly, exit quickly—then wait for a big opportunity to re-enter again……
3
1
4
5.6k
·
--
Bullish
Jumping all the way to 87,000 fake coins—then the whole group starts catching up on gains; how much safe room is left in this round of market?
This is a question everyone is concerned about, especially those who missed the move!
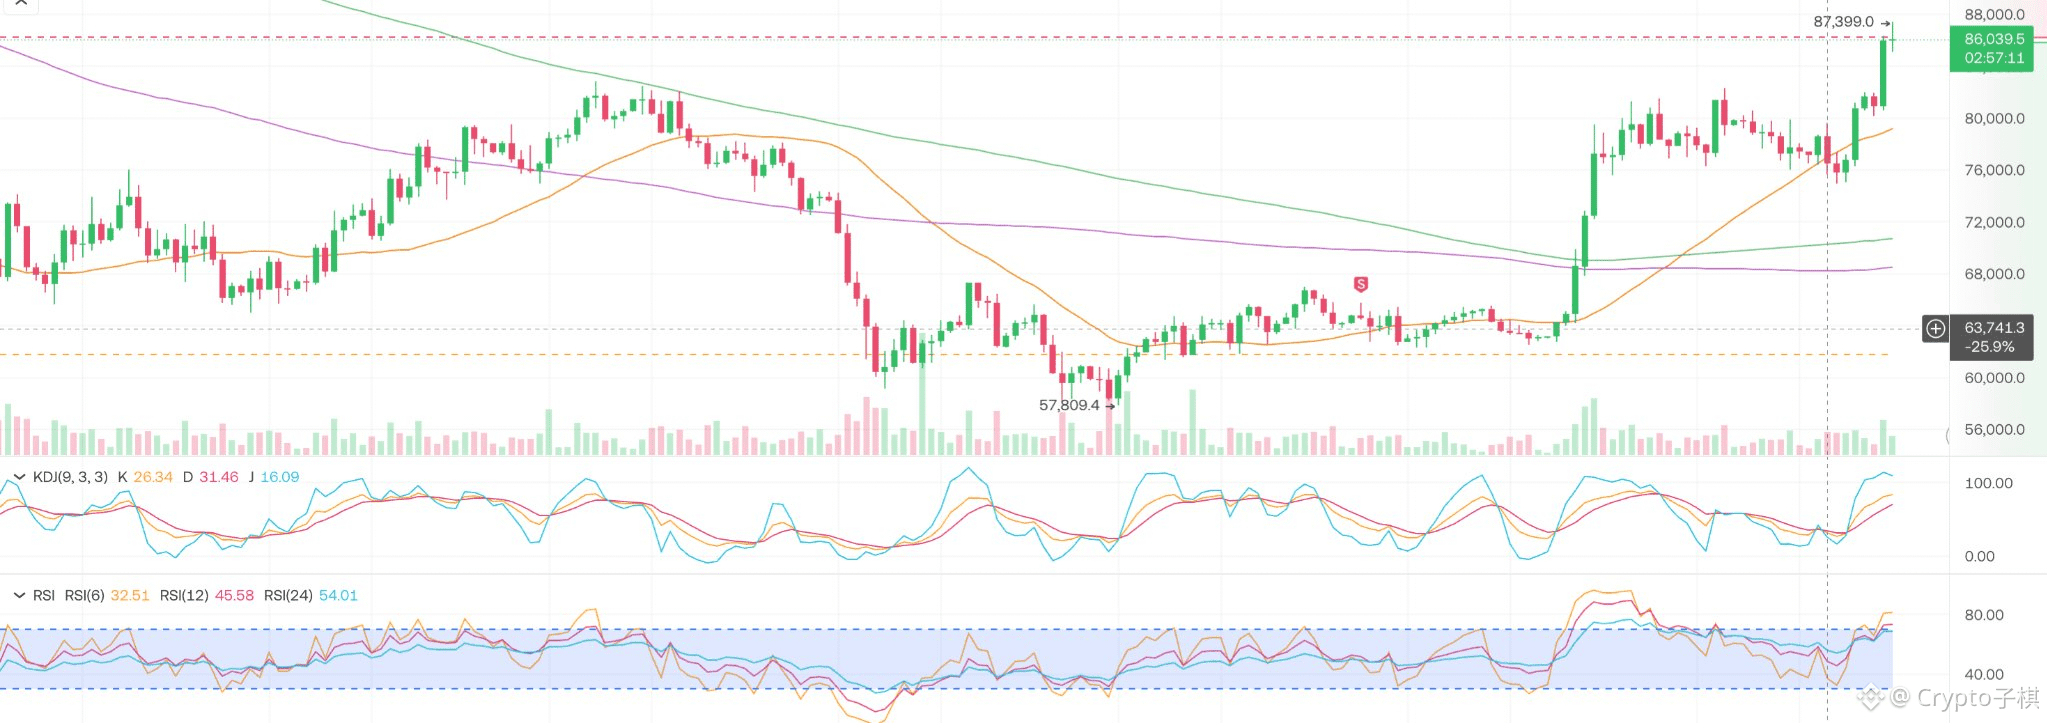
I think this market has already moved out of the early rebound stage and entered a phase of breakout acceleration and fund diffusion. For now, there’s no clear top signal, but the most comfortable low-level opportunity has already passed.
Currently, we’re roughly in the third step of the entire rebound:
First step: the panic liquidation from 58,000 to 67,000. The market doesn’t believe in a bottom, yet the chips quietly rotate at low levels.
Second step: the trend repair from 63,000 to 82,000—$BTC regains the medium- to long-term moving averages. Shorts cover, but most people still treat the rise as a bear-market dead-cat bounce.
Third step: now, from 75,000 to 87,000, the sidelined funds begin to chase. After BTC stabilizes near the high range, capital continues to spread to ETH, SOL, and altcoins, and the momentum from winning trades becomes noticeably hotter.
But the third step could either lead to the main uptrend—or form a local stage top.
If BTC breaks above 88,000 with increased volume, and then holds on a pullback to 85,000 without breaking it, then the market can be considered to have entered the fourth step, and there will be an opportunity to challenge 90,000–96,000.
On the other hand, if it spikes up and then falls back below 82,000, or even loses 80,000, then the more疯狂 altcoin catching-up you see, the more you should be careful—this could be the emotion release at the end of the rebound.
Based on the drop from 126,200 to 57,800 USD: 84,000 USD corresponds to the 38.2% rebound level; 92,000 USD corresponds to the 50% rebound level. The first key checkpoint has already been crossed—the next real pressure zone is 88,000–92,000 USD.
The collective rebound in altcoins suggests that risk appetite is spreading. However, BTC’s market share is still close to 59%, which feels more like capital spillover after a breakout than an immediate definition of a full-on altcoin season.
Next, just watch a few levels:
Hold 83,000–84,000 USD, and we can continue to look for 89,000–92,000 USD;
If it falls back to 80,000–82,000 USD, it means the breakout strength is starting to weaken;
My strategy remains the same: I still see the trend as bullish. But at this point, the odds no longer offer good value. In terms of execution, I’m more inclined toward short-term, quick in-and-out trades!
Jumping all the way to 87,000 fake coins—then the whole group starts catching up on gains; how much safe room is left in this round of market?
This is a question everyone is concerned about, especially those who missed the move!
I think this market has already moved out of the early rebound stage and entered a phase of breakout acceleration and fund diffusion. For now, there’s no clear top signal, but the most comfortable low-level opportunity has already passed.
Currently, we’re roughly in the third step of the entire rebound:
First step: the panic liquidation from 58,000 to 67,000. The market doesn’t believe in a bottom, yet the chips quietly rotate at low levels.
Second step: the trend repair from 63,000 to 82,000—$BTC regains the medium- to long-term moving averages. Shorts cover, but most people still treat the rise as a bear-market dead-cat bounce.
Third step: now, from 75,000 to 87,000, the sidelined funds begin to chase. After BTC stabilizes near the high range, capital continues to spread to ETH, SOL, and altcoins, and the momentum from winning trades becomes noticeably hotter.
But the third step could either lead to the main uptrend—or form a local stage top.
If BTC breaks above 88,000 with increased volume, and then holds on a pullback to 85,000 without breaking it, then the market can be considered to have entered the fourth step, and there will be an opportunity to challenge 90,000–96,000.
On the other hand, if it spikes up and then falls back below 82,000, or even loses 80,000, then the more疯狂 altcoin catching-up you see, the more you should be careful—this could be the emotion release at the end of the rebound.
Based on the drop from 126,200 to 57,800 USD: 84,000 USD corresponds to the 38.2% rebound level; 92,000 USD corresponds to the 50% rebound level. The first key checkpoint has already been crossed—the next real pressure zone is 88,000–92,000 USD.
The collective rebound in altcoins suggests that risk appetite is spreading. However, BTC’s market share is still close to 59%, which feels more like capital spillover after a breakout than an immediate definition of a full-on altcoin season.
Next, just watch a few levels:
Hold 83,000–84,000 USD, and we can continue to look for 89,000–92,000 USD;
If it falls back to 80,000–82,000 USD, it means the breakout strength is starting to weaken;
My strategy remains the same: I still see the trend as bullish. But at this point, the odds no longer offer good value. In terms of execution, I’m more inclined toward short-term, quick in-and-out trades!
This is a question everyone is concerned about, especially those who missed the move!
I think this market has already moved out of the early rebound stage and entered a phase of breakout acceleration and fund diffusion. For now, there’s no clear top signal, but the most comfortable low-level opportunity has already passed.
Currently, we’re roughly in the third step of the entire rebound:
First step: the panic liquidation from 58,000 to 67,000. The market doesn’t believe in a bottom, yet the chips quietly rotate at low levels.
Second step: the trend repair from 63,000 to 82,000—$BTC regains the medium- to long-term moving averages. Shorts cover, but most people still treat the rise as a bear-market dead-cat bounce.
Third step: now, from 75,000 to 87,000, the sidelined funds begin to chase. After BTC stabilizes near the high range, capital continues to spread to ETH, SOL, and altcoins, and the momentum from winning trades becomes noticeably hotter.
But the third step could either lead to the main uptrend—or form a local stage top.
If BTC breaks above 88,000 with increased volume, and then holds on a pullback to 85,000 without breaking it, then the market can be considered to have entered the fourth step, and there will be an opportunity to challenge 90,000–96,000.
On the other hand, if it spikes up and then falls back below 82,000, or even loses 80,000, then the more疯狂 altcoin catching-up you see, the more you should be careful—this could be the emotion release at the end of the rebound.
Based on the drop from 126,200 to 57,800 USD: 84,000 USD corresponds to the 38.2% rebound level; 92,000 USD corresponds to the 50% rebound level. The first key checkpoint has already been crossed—the next real pressure zone is 88,000–92,000 USD.
The collective rebound in altcoins suggests that risk appetite is spreading. However, BTC’s market share is still close to 59%, which feels more like capital spillover after a breakout than an immediate definition of a full-on altcoin season.
Next, just watch a few levels:
Hold 83,000–84,000 USD, and we can continue to look for 89,000–92,000 USD;
If it falls back to 80,000–82,000 USD, it means the breakout strength is starting to weaken;
My strategy remains the same: I still see the trend as bullish. But at this point, the odds no longer offer good value. In terms of execution, I’m more inclined toward short-term, quick in-and-out trades!
2
1.8k
·
--
BTC has been rising so much—my biggest position right now is called: regret 😂
All the way up, and the group chat has already started discussing where the next stop is.
But when I look at the candlestick chart, all I can think is: Great, the analysis was right—I just didn’t make any money.
This is probably the most awkward moment for an old bull trader.
When it’s falling, I research support levels every day, terrified that the final drop will bury me. But when it rallies, I start thinking I’ll wait for a pullback and then jump in.
In the end, BTC is being extremely polite: no pullback at all, and the tail lights are almost disappearing from view.
Now you want me to chase?
Honestly, I just can’t bring myself to do it.
Missing the trade is already painful enough. If I chase again and go heavy at the top just to “fix” missing the trade—and then that last needle sticks down—that wouldn’t be missing the trade anymore. That would be precisely completing a trading loop of: “didn’t profit, then lost a bit too.”
So my strategy now is pretty simple: if I miss the larger trend position, then I accept it.
No fighting with the market. No forcing myself to prove I’m brave by hard-chasing.
Every day, I quietly do some short-term trades I’m confident about, make some meal-money profits; the rest of the funds I do some financial management—earn a bit of returns—and also watch other people post their profit screenshots.
Others: “+18%.”
Me: “Financial management returns credited +58U.”
Don’t ask.
It’s just steady—ask too much, and it’s just heartbreaking.😂
But after going through bull and bear markets many times, I can actually accept this kind of state now.
The biggest loss from missing the trade is simply: “I didn’t make money.” The biggest risk from FOMO is: “I’ll actually lose money.”
If BTC keeps rising, I’ll admit I sold too early and missed the move.
If later it gives a comfortable pullback, I’ll still have at least some bullets in my hand.
The market won’t stop going up just because I didn’t get in.
And I don’t need to throw off my own rhythm just because the market is rising.
The biggest lesson in this cycle might not be catching BTC—it might be watching it run higher while still resisting the urge to chase.
After all, the reason an old bull trader survives until today isn’t that they get in every time.
It’s that—when they miss the trade and their mouth is tough, their hands still manage to hold back.😂
BTC has been rising so much—my biggest position right now is called: regret 😂
All the way up, and the group chat has already started discussing where the next stop is.
But when I look at the candlestick chart, all I can think is: Great, the analysis was right—I just didn’t make any money.
This is probably the most awkward moment for an old bull trader.
When it’s falling, I research support levels every day, terrified that the final drop will bury me. But when it rallies, I start thinking I’ll wait for a pullback and then jump in.
In the end, BTC is being extremely polite: no pullback at all, and the tail lights are almost disappearing from view.
Now you want me to chase?
Honestly, I just can’t bring myself to do it.
Missing the trade is already painful enough. If I chase again and go heavy at the top just to “fix” missing the trade—and then that last needle sticks down—that wouldn’t be missing the trade anymore. That would be precisely completing a trading loop of: “didn’t profit, then lost a bit too.”
So my strategy now is pretty simple: if I miss the larger trend position, then I accept it.
No fighting with the market. No forcing myself to prove I’m brave by hard-chasing.
Every day, I quietly do some short-term trades I’m confident about, make some meal-money profits; the rest of the funds I do some financial management—earn a bit of returns—and also watch other people post their profit screenshots.
Others: “+18%.”
Me: “Financial management returns credited +58U.”
Don’t ask.
It’s just steady—ask too much, and it’s just heartbreaking.😂
But after going through bull and bear markets many times, I can actually accept this kind of state now.
The biggest loss from missing the trade is simply: “I didn’t make money.” The biggest risk from FOMO is: “I’ll actually lose money.”
If BTC keeps rising, I’ll admit I sold too early and missed the move.
If later it gives a comfortable pullback, I’ll still have at least some bullets in my hand.
The market won’t stop going up just because I didn’t get in.
And I don’t need to throw off my own rhythm just because the market is rising.
The biggest lesson in this cycle might not be catching BTC—it might be watching it run higher while still resisting the urge to chase.
After all, the reason an old bull trader survives until today isn’t that they get in every time.
It’s that—when they miss the trade and their mouth is tough, their hands still manage to hold back.😂
All the way up, and the group chat has already started discussing where the next stop is.
But when I look at the candlestick chart, all I can think is: Great, the analysis was right—I just didn’t make any money.
This is probably the most awkward moment for an old bull trader.
When it’s falling, I research support levels every day, terrified that the final drop will bury me. But when it rallies, I start thinking I’ll wait for a pullback and then jump in.
In the end, BTC is being extremely polite: no pullback at all, and the tail lights are almost disappearing from view.
Now you want me to chase?
Honestly, I just can’t bring myself to do it.
Missing the trade is already painful enough. If I chase again and go heavy at the top just to “fix” missing the trade—and then that last needle sticks down—that wouldn’t be missing the trade anymore. That would be precisely completing a trading loop of: “didn’t profit, then lost a bit too.”
So my strategy now is pretty simple: if I miss the larger trend position, then I accept it.
No fighting with the market. No forcing myself to prove I’m brave by hard-chasing.
Every day, I quietly do some short-term trades I’m confident about, make some meal-money profits; the rest of the funds I do some financial management—earn a bit of returns—and also watch other people post their profit screenshots.
Others: “+18%.”
Me: “Financial management returns credited +58U.”
Don’t ask.
It’s just steady—ask too much, and it’s just heartbreaking.😂
But after going through bull and bear markets many times, I can actually accept this kind of state now.
The biggest loss from missing the trade is simply: “I didn’t make money.” The biggest risk from FOMO is: “I’ll actually lose money.”
If BTC keeps rising, I’ll admit I sold too early and missed the move.
If later it gives a comfortable pullback, I’ll still have at least some bullets in my hand.
The market won’t stop going up just because I didn’t get in.
And I don’t need to throw off my own rhythm just because the market is rising.
The biggest lesson in this cycle might not be catching BTC—it might be watching it run higher while still resisting the urge to chase.
After all, the reason an old bull trader survives until today isn’t that they get in every time.
It’s that—when they miss the trade and their mouth is tough, their hands still manage to hold back.😂
4
18
8.1k
·
--
BTC has risen to $85,000. The most uncomfortable part isn’t being trapped in a position—it’s missing the move.
But missing the move only means you earn less; it doesn’t mean you’re truly losing.
What has caused me to lose big money most often isn’t missing the market—it’s being afraid to miss it further, then finally chasing in heavy at a key resistance level under pressure.
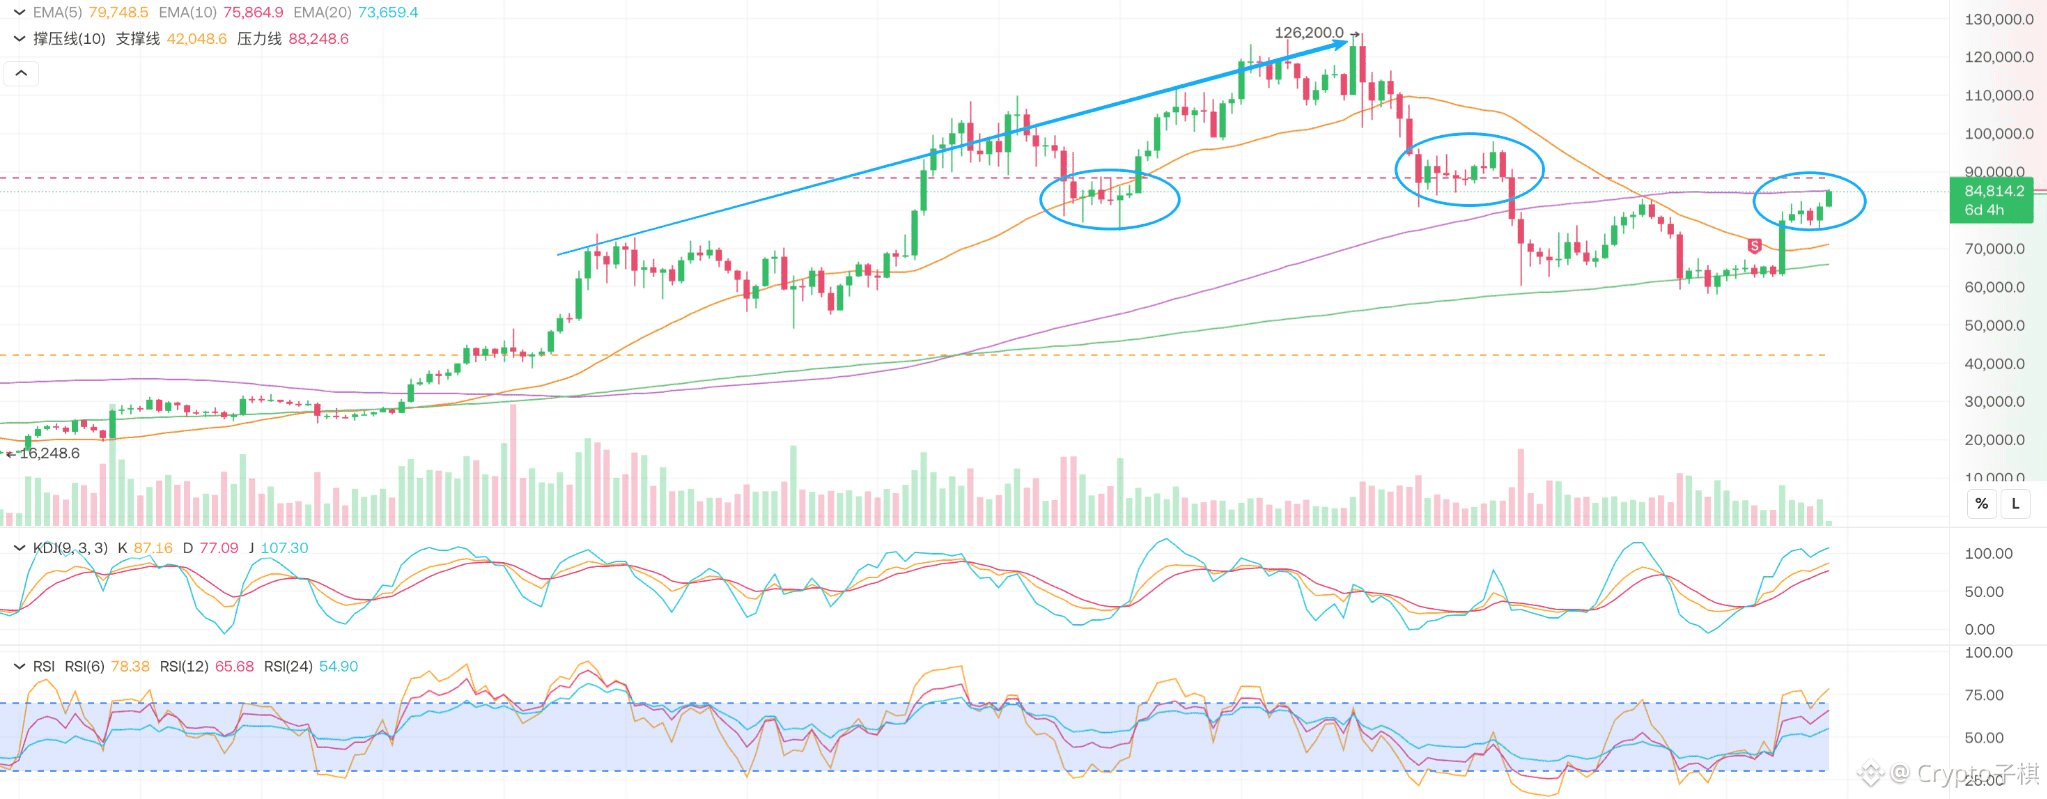
From the weekly chart, $BTC has already moved above the EMA5, EMA10, and EMA20. ETF inflows have resumed, and the trend is indeed strengthening. This rally isn’t just short-covering.
The issue is: the current position isn’t cheap.
$85,000–$88,000 is the previous trapped-holder and dense-liquidity zone. Weekly RSI and KDJ are also in overbought territory. There hasn’t been a real breakout above resistance yet, but it could pull back toward around $80,000. Chasing here offers a poor risk-reward ratio.
As someone who’s been left behind, I’d set up three plans in advance:
1. BTC breaks directly above $88,000. Don’t chase the first bullish candle. Wait for a pullback to $85,000 that holds, then follow with a small position. After confirmation that it has steadied above $90,000, gradually add. The target would be $93,000–$96,000.
2. The breakout fails and it rallies into highs before turning back, pulling back to $80,000–$82,000. As long as volume contracts and selling stops (trend stabilization on the daily), and the daily structure hasn’t been broken, you can try entries in batches—but you won’t buy it all at once.
3. A break below $79,000 happens, and any rebound can’t be reclaimed. That signals the breakout failed. Continue holding cash and wait for support to be re-confirmed around $76,000.
If you’re strong at short-term trading, you can trade lightly between $82,000–$88,000, but you must set a stop-loss. Without a stable trading system, standing by is actually more suitable for the current market.
There will always be opportunities. I’d rather buy at a higher price with confirmation than, because I missed the move once, take away other people’s profitable positions at the weekly resistance level.
BTC has risen to $85,000. The most uncomfortable part isn’t being trapped in a position—it’s missing the move.
But missing the move only means you earn less; it doesn’t mean you’re truly losing.
What has caused me to lose big money most often isn’t missing the market—it’s being afraid to miss it further, then finally chasing in heavy at a key resistance level under pressure.
From the weekly chart, $BTC has already moved above the EMA5, EMA10, and EMA20. ETF inflows have resumed, and the trend is indeed strengthening. This rally isn’t just short-covering.
The issue is: the current position isn’t cheap.
$85,000–$88,000 is the previous trapped-holder and dense-liquidity zone. Weekly RSI and KDJ are also in overbought territory. There hasn’t been a real breakout above resistance yet, but it could pull back toward around $80,000. Chasing here offers a poor risk-reward ratio.
As someone who’s been left behind, I’d set up three plans in advance:
1. BTC breaks directly above $88,000. Don’t chase the first bullish candle. Wait for a pullback to $85,000 that holds, then follow with a small position. After confirmation that it has steadied above $90,000, gradually add. The target would be $93,000–$96,000.
2. The breakout fails and it rallies into highs before turning back, pulling back to $80,000–$82,000. As long as volume contracts and selling stops (trend stabilization on the daily), and the daily structure hasn’t been broken, you can try entries in batches—but you won’t buy it all at once.
3. A break below $79,000 happens, and any rebound can’t be reclaimed. That signals the breakout failed. Continue holding cash and wait for support to be re-confirmed around $76,000.
If you’re strong at short-term trading, you can trade lightly between $82,000–$88,000, but you must set a stop-loss. Without a stable trading system, standing by is actually more suitable for the current market.
There will always be opportunities. I’d rather buy at a higher price with confirmation than, because I missed the move once, take away other people’s profitable positions at the weekly resistance level.
But missing the move only means you earn less; it doesn’t mean you’re truly losing.
What has caused me to lose big money most often isn’t missing the market—it’s being afraid to miss it further, then finally chasing in heavy at a key resistance level under pressure.
From the weekly chart, $BTC has already moved above the EMA5, EMA10, and EMA20. ETF inflows have resumed, and the trend is indeed strengthening. This rally isn’t just short-covering.
The issue is: the current position isn’t cheap.
$85,000–$88,000 is the previous trapped-holder and dense-liquidity zone. Weekly RSI and KDJ are also in overbought territory. There hasn’t been a real breakout above resistance yet, but it could pull back toward around $80,000. Chasing here offers a poor risk-reward ratio.
As someone who’s been left behind, I’d set up three plans in advance:
1. BTC breaks directly above $88,000. Don’t chase the first bullish candle. Wait for a pullback to $85,000 that holds, then follow with a small position. After confirmation that it has steadied above $90,000, gradually add. The target would be $93,000–$96,000.
2. The breakout fails and it rallies into highs before turning back, pulling back to $80,000–$82,000. As long as volume contracts and selling stops (trend stabilization on the daily), and the daily structure hasn’t been broken, you can try entries in batches—but you won’t buy it all at once.
3. A break below $79,000 happens, and any rebound can’t be reclaimed. That signals the breakout failed. Continue holding cash and wait for support to be re-confirmed around $76,000.
If you’re strong at short-term trading, you can trade lightly between $82,000–$88,000, but you must set a stop-loss. Without a stable trading system, standing by is actually more suitable for the current market.
There will always be opportunities. I’d rather buy at a higher price with confirmation than, because I missed the move once, take away other people’s profitable positions at the weekly resistance level.
1
2
3.3k
·
--
Why, when you’re long-term bullish on a coin, can trading with futures still mean you may never wait for it to rise?
When I first started trading futures, I thought: if my directional judgment is correct, then adding leverage simply amplifies the returns.
If I believe BTC will rise over the next six months, then going long on futures seems more efficient than buying spot.
Only later did I realize: spot trading is about the destination, while leveraged trading also includes the path.
I used to decide that an asset would rise in the medium term, so I opened a high-leverage long position.
A few months later, it indeed doubled—but before the rise, it first went through a 20% pullback. Spot holders were only temporarily at a loss, while I was liquidated before the trend even started.
In the end, my direction was right, but my account never made it to the answer.
Futures also involve ongoing costs such as funding rates, margin, and volatility.
You think you’re placing a bet on the price after six months, but the exchange is checking every moment whether you can survive the next candlestick. The higher the leverage, the less time the market gives you to be proven right; even if your long-term logic is solid, it can’t stop short-term liquidity from sweeping the order book.
So before using futures, you can’t only ask whether it will go up in the future—you also need to ask: how much it might drop in the middle, how much you can personally endure, and where your invalidation conditions are. Treating long-term bullishness as an excuse to refuse stop-losses is just using a big-picture view to hide uncontrolled short-term risk.
Remember: spot can accompany the logic until it plays out gradually, but leverage has to survive the price path first. You may get the destination right, yet still not make it through the process—and therefore never reach your goal.
Why, when you’re long-term bullish on a coin, can trading with futures still mean you may never wait for it to rise?
When I first started trading futures, I thought: if my directional judgment is correct, then adding leverage simply amplifies the returns.
If I believe BTC will rise over the next six months, then going long on futures seems more efficient than buying spot.
Only later did I realize: spot trading is about the destination, while leveraged trading also includes the path.
I used to decide that an asset would rise in the medium term, so I opened a high-leverage long position.
A few months later, it indeed doubled—but before the rise, it first went through a 20% pullback. Spot holders were only temporarily at a loss, while I was liquidated before the trend even started.
In the end, my direction was right, but my account never made it to the answer.
Futures also involve ongoing costs such as funding rates, margin, and volatility.
You think you’re placing a bet on the price after six months, but the exchange is checking every moment whether you can survive the next candlestick. The higher the leverage, the less time the market gives you to be proven right; even if your long-term logic is solid, it can’t stop short-term liquidity from sweeping the order book.
So before using futures, you can’t only ask whether it will go up in the future—you also need to ask: how much it might drop in the middle, how much you can personally endure, and where your invalidation conditions are. Treating long-term bullishness as an excuse to refuse stop-losses is just using a big-picture view to hide uncontrolled short-term risk.
Remember: spot can accompany the logic until it plays out gradually, but leverage has to survive the price path first. You may get the destination right, yet still not make it through the process—and therefore never reach your goal.
When I first started trading futures, I thought: if my directional judgment is correct, then adding leverage simply amplifies the returns.
If I believe BTC will rise over the next six months, then going long on futures seems more efficient than buying spot.
Only later did I realize: spot trading is about the destination, while leveraged trading also includes the path.
I used to decide that an asset would rise in the medium term, so I opened a high-leverage long position.
A few months later, it indeed doubled—but before the rise, it first went through a 20% pullback. Spot holders were only temporarily at a loss, while I was liquidated before the trend even started.
In the end, my direction was right, but my account never made it to the answer.
Futures also involve ongoing costs such as funding rates, margin, and volatility.
You think you’re placing a bet on the price after six months, but the exchange is checking every moment whether you can survive the next candlestick. The higher the leverage, the less time the market gives you to be proven right; even if your long-term logic is solid, it can’t stop short-term liquidity from sweeping the order book.
So before using futures, you can’t only ask whether it will go up in the future—you also need to ask: how much it might drop in the middle, how much you can personally endure, and where your invalidation conditions are. Treating long-term bullishness as an excuse to refuse stop-losses is just using a big-picture view to hide uncontrolled short-term risk.
Remember: spot can accompany the logic until it plays out gradually, but leverage has to survive the price path first. You may get the destination right, yet still not make it through the process—and therefore never reach your goal.
3
814
·
--
Why does repeatedly testing a support level make it more dangerous?
When I first learned technical analysis, I always thought that if price kept failing to break a certain level after several attempts, it meant the support was strong.
The first bounce felt safe to buy—then I added on the second time. The third time, I even canceled my stop-loss. Since it had held so many times, surely it would be fine again.
Later, I realized that a support level is not a concrete wall, but a pool of buy orders waiting to be filled.
Each time price touches that level, it consumes part of the capital providing the buy-side support.
The first time, someone buys the dip and the rebound is swift. The second time, there is still buying interest, but the rebound height starts to get lower. By the third time, those willing to take the other side may already be fully positioned; what remains is more and more trapped sellers hoping to get out on the next bounce.
I used to add to my position repeatedly along the lower edge of a trading range. The first few times I could profit from the rebound, and I mistook what was essentially chance for a stable pattern.
Only until the final time the support finally failed: all the traders who were relying on stops at that same level sold at the same time. What had looked like a solid floor instantly turned into an entry point accelerating downward.
To judge whether a support level is effective, you can’t just count how many times it held. You also need to look at the strength of each rebound, the trading volume, the structure of the lows, and the spot-market absorption. If rebounds are getting weaker and the number of tests increases, it’s not that the opportunity becomes more certain—it may mean the buy-side support is being gradually exhausted.
Remember: the value of support isn’t measured by how many times it held in the past, but by how much real money is still willing to step in and buy the next time.
Why does repeatedly testing a support level make it more dangerous?
When I first learned technical analysis, I always thought that if price kept failing to break a certain level after several attempts, it meant the support was strong.
The first bounce felt safe to buy—then I added on the second time. The third time, I even canceled my stop-loss. Since it had held so many times, surely it would be fine again.
Later, I realized that a support level is not a concrete wall, but a pool of buy orders waiting to be filled.
Each time price touches that level, it consumes part of the capital providing the buy-side support.
The first time, someone buys the dip and the rebound is swift. The second time, there is still buying interest, but the rebound height starts to get lower. By the third time, those willing to take the other side may already be fully positioned; what remains is more and more trapped sellers hoping to get out on the next bounce.
I used to add to my position repeatedly along the lower edge of a trading range. The first few times I could profit from the rebound, and I mistook what was essentially chance for a stable pattern.
Only until the final time the support finally failed: all the traders who were relying on stops at that same level sold at the same time. What had looked like a solid floor instantly turned into an entry point accelerating downward.
To judge whether a support level is effective, you can’t just count how many times it held. You also need to look at the strength of each rebound, the trading volume, the structure of the lows, and the spot-market absorption. If rebounds are getting weaker and the number of tests increases, it’s not that the opportunity becomes more certain—it may mean the buy-side support is being gradually exhausted.
Remember: the value of support isn’t measured by how many times it held in the past, but by how much real money is still willing to step in and buy the next time.
When I first learned technical analysis, I always thought that if price kept failing to break a certain level after several attempts, it meant the support was strong.
The first bounce felt safe to buy—then I added on the second time. The third time, I even canceled my stop-loss. Since it had held so many times, surely it would be fine again.
Later, I realized that a support level is not a concrete wall, but a pool of buy orders waiting to be filled.
Each time price touches that level, it consumes part of the capital providing the buy-side support.
The first time, someone buys the dip and the rebound is swift. The second time, there is still buying interest, but the rebound height starts to get lower. By the third time, those willing to take the other side may already be fully positioned; what remains is more and more trapped sellers hoping to get out on the next bounce.
I used to add to my position repeatedly along the lower edge of a trading range. The first few times I could profit from the rebound, and I mistook what was essentially chance for a stable pattern.
Only until the final time the support finally failed: all the traders who were relying on stops at that same level sold at the same time. What had looked like a solid floor instantly turned into an entry point accelerating downward.
To judge whether a support level is effective, you can’t just count how many times it held. You also need to look at the strength of each rebound, the trading volume, the structure of the lows, and the spot-market absorption. If rebounds are getting weaker and the number of tests increases, it’s not that the opportunity becomes more certain—it may mean the buy-side support is being gradually exhausted.
Remember: the value of support isn’t measured by how many times it held in the past, but by how much real money is still willing to step in and buy the next time.
1
4
1.6k
·
--
Honestly, I’m already confused about how the market is moving right now!
Many people ask me about it, and I’m not sure either. I can only make a rough analysis based on the existing price action. You can use it as a reference and exchange ideas with everyone!
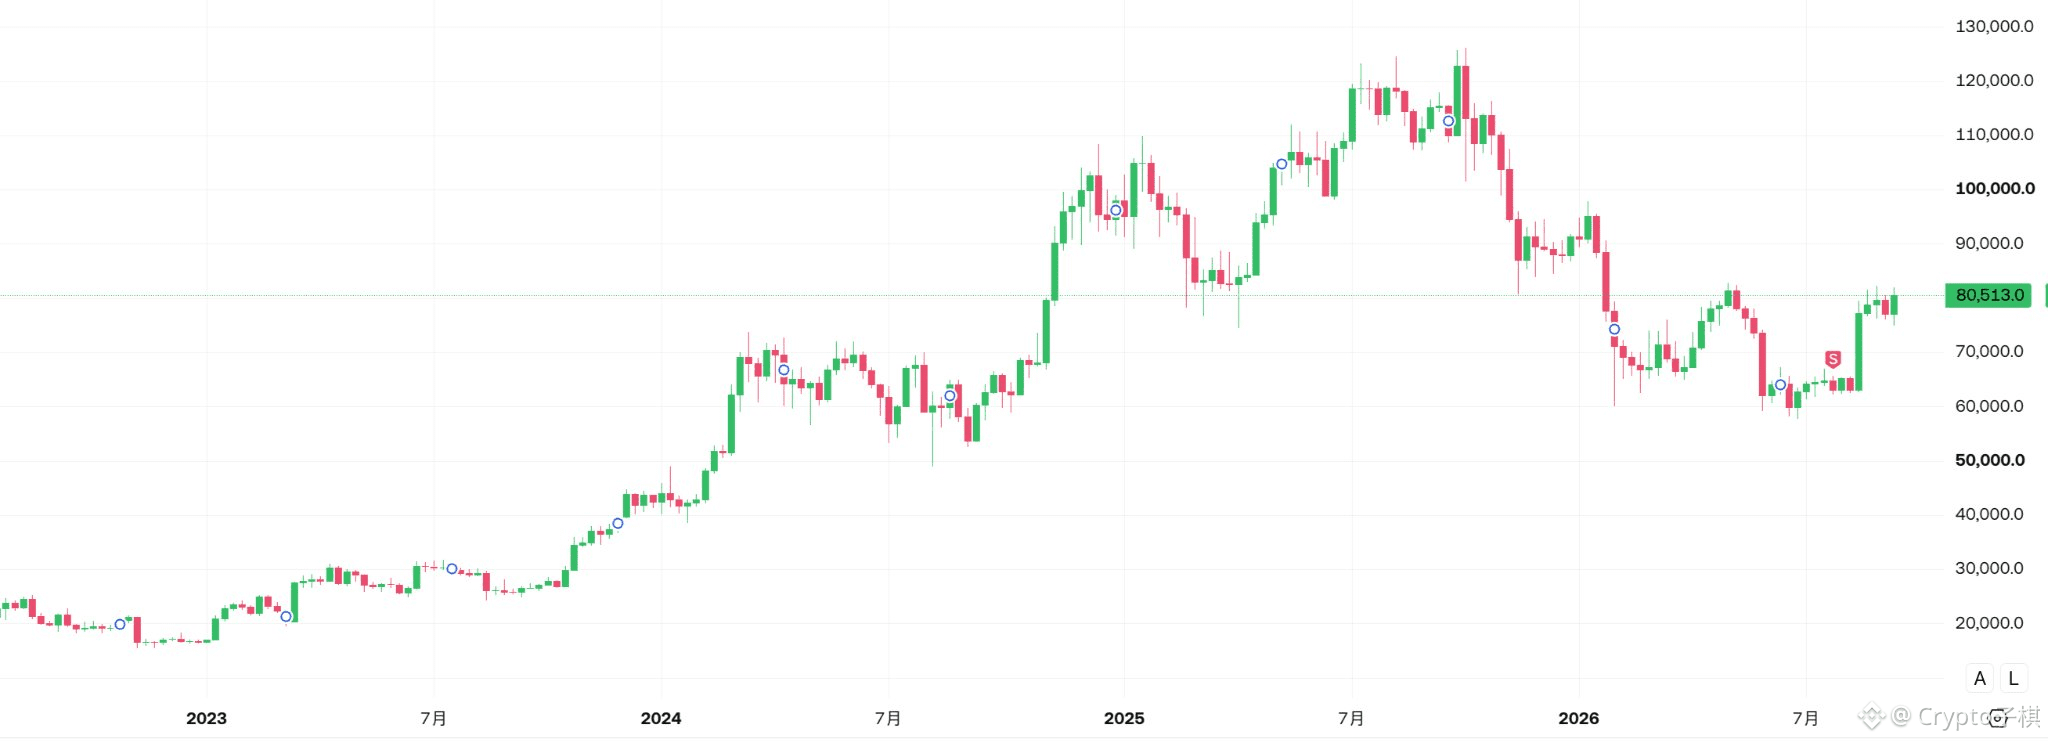
I believe $58,000 is very likely the bottom, but it can’t be confirmed yet as the final cycle bottom. However, even if it isn’t truly the bottom, it probably won’t be far from $58,000!
The main sell-off phase in the bear market has likely ended. The market is repairing from the bottom and moving toward the bull-bear border, but it’s still not a new round of the main upswing.
Here are a few questions everyone is concerned about—take a look and let’s discuss!
1. Why is it rising now?
BTC has fallen from $123,000 to $58,000, a drawdown of more than 50%. Leverage and high-level holdings have completed a round of clearing. Then, rate hikes, the hawkish dot-plot, and regulatory negative news were concentrated and came down—yet the price hasn’t made new lows. This suggests that sell pressure is starting to exhaust. At the same time, spot ETF spot-buying, the repair of unrealized losses, and short-covering collectively pushed the price through $80,000.
2. What stage are we in between bull and bear right now?
I lean more toward “mid-term repair after the end of the bear market’s main drop,” not a brand-new bull market. ETFs have changed the bear-market structure, but they haven’t eliminated the cycle. In the past, prices could have crashed 70%—80%. Now it’s more likely to retrace around 50% and then spend a longer time consolidating to build the base.
3. Is $58,000 the final bottom?
$58,000 has the conditions for a bottom, but it still lacks confirmation. Stablecoins haven’t expanded noticeably, and corporate treasury buying remains weak—indicating insufficient incremental liquidity.
As long as the market holds $62,000–$65,000, the probability that $58,000 becomes the cycle low is higher. If this zone breaks, it may still test $58,000 again.
4. How will the next six months likely unfold?
In a high-interest-rate environment, BTC can’t easily rise in a continuous main upswing. It will more likely trade in a wide range between $68,000 and $95,000, with the overall trend slowly lifting.
Hold $76,000 and the repair continues. If it breaks below $73,000, the market turns weaker again. If it stands above $85,000, then it can challenge $90,000–$96,000. Only if the weekly chart reclaims $100,000 can we confirm that the bear market has truly ended.
In short: $58,000 looks like a bottom, but it’s not the bottom truly confirmed by the market yet. $80,000 is a repair point, $85,000 is the key level, and $100,000 is the ironclad proof that the bear market is truly over.
Honestly, I’m already confused about how the market is moving right now!
Many people ask me about it, and I’m not sure either. I can only make a rough analysis based on the existing price action. You can use it as a reference and exchange ideas with everyone!
I believe $58,000 is very likely the bottom, but it can’t be confirmed yet as the final cycle bottom. However, even if it isn’t truly the bottom, it probably won’t be far from $58,000!
The main sell-off phase in the bear market has likely ended. The market is repairing from the bottom and moving toward the bull-bear border, but it’s still not a new round of the main upswing.
Here are a few questions everyone is concerned about—take a look and let’s discuss!
1. Why is it rising now?
BTC has fallen from $123,000 to $58,000, a drawdown of more than 50%. Leverage and high-level holdings have completed a round of clearing. Then, rate hikes, the hawkish dot-plot, and regulatory negative news were concentrated and came down—yet the price hasn’t made new lows. This suggests that sell pressure is starting to exhaust. At the same time, spot ETF spot-buying, the repair of unrealized losses, and short-covering collectively pushed the price through $80,000.
2. What stage are we in between bull and bear right now?
I lean more toward “mid-term repair after the end of the bear market’s main drop,” not a brand-new bull market. ETFs have changed the bear-market structure, but they haven’t eliminated the cycle. In the past, prices could have crashed 70%—80%. Now it’s more likely to retrace around 50% and then spend a longer time consolidating to build the base.
3. Is $58,000 the final bottom?
$58,000 has the conditions for a bottom, but it still lacks confirmation. Stablecoins haven’t expanded noticeably, and corporate treasury buying remains weak—indicating insufficient incremental liquidity.
As long as the market holds $62,000–$65,000, the probability that $58,000 becomes the cycle low is higher. If this zone breaks, it may still test $58,000 again.
4. How will the next six months likely unfold?
In a high-interest-rate environment, BTC can’t easily rise in a continuous main upswing. It will more likely trade in a wide range between $68,000 and $95,000, with the overall trend slowly lifting.
Hold $76,000 and the repair continues. If it breaks below $73,000, the market turns weaker again. If it stands above $85,000, then it can challenge $90,000–$96,000. Only if the weekly chart reclaims $100,000 can we confirm that the bear market has truly ended.
In short: $58,000 looks like a bottom, but it’s not the bottom truly confirmed by the market yet. $80,000 is a repair point, $85,000 is the key level, and $100,000 is the ironclad proof that the bear market is truly over.
Many people ask me about it, and I’m not sure either. I can only make a rough analysis based on the existing price action. You can use it as a reference and exchange ideas with everyone!
I believe $58,000 is very likely the bottom, but it can’t be confirmed yet as the final cycle bottom. However, even if it isn’t truly the bottom, it probably won’t be far from $58,000!
The main sell-off phase in the bear market has likely ended. The market is repairing from the bottom and moving toward the bull-bear border, but it’s still not a new round of the main upswing.
Here are a few questions everyone is concerned about—take a look and let’s discuss!
1. Why is it rising now?
BTC has fallen from $123,000 to $58,000, a drawdown of more than 50%. Leverage and high-level holdings have completed a round of clearing. Then, rate hikes, the hawkish dot-plot, and regulatory negative news were concentrated and came down—yet the price hasn’t made new lows. This suggests that sell pressure is starting to exhaust. At the same time, spot ETF spot-buying, the repair of unrealized losses, and short-covering collectively pushed the price through $80,000.
2. What stage are we in between bull and bear right now?
I lean more toward “mid-term repair after the end of the bear market’s main drop,” not a brand-new bull market. ETFs have changed the bear-market structure, but they haven’t eliminated the cycle. In the past, prices could have crashed 70%—80%. Now it’s more likely to retrace around 50% and then spend a longer time consolidating to build the base.
3. Is $58,000 the final bottom?
$58,000 has the conditions for a bottom, but it still lacks confirmation. Stablecoins haven’t expanded noticeably, and corporate treasury buying remains weak—indicating insufficient incremental liquidity.
As long as the market holds $62,000–$65,000, the probability that $58,000 becomes the cycle low is higher. If this zone breaks, it may still test $58,000 again.
4. How will the next six months likely unfold?
In a high-interest-rate environment, BTC can’t easily rise in a continuous main upswing. It will more likely trade in a wide range between $68,000 and $95,000, with the overall trend slowly lifting.
Hold $76,000 and the repair continues. If it breaks below $73,000, the market turns weaker again. If it stands above $85,000, then it can challenge $90,000–$96,000. Only if the weekly chart reclaims $100,000 can we confirm that the bear market has truly ended.
In short: $58,000 looks like a bottom, but it’s not the bottom truly confirmed by the market yet. $80,000 is a repair point, $85,000 is the key level, and $100,000 is the ironclad proof that the bear market is truly over.
4
1
7.7k
·
--
It wasn’t that “good news suddenly arrived” that caused the big rally last night; it was that the shorts couldn’t hold on any longer.
Last night I judged that as long as BTC holds $77,000, it would break into $80,000 and continue to test the $82,000–$83,000 range.
So far the high has already reached around $81,600. The direction has essentially played out—only the pace is faster than I expected.
The reasons aren’t complicated.
Rate hikes, the hawkish dot plot, and the regulatory bill getting blocked have all already been priced in. But BTC still hasn’t broken below $75,000–$76,000. Since the bearish news can’t push it down, the shorts naturally start to get nervous.
Meanwhile, spot ETFs have shifted from continuous outflows to net inflows for two days totaling about $590 million. U.S. regulatory expectations are also warming up. Spot capital first pushes the price toward $80,000; then the shorts stop-loss, which further amplifies the upside.
On the technical side, BTC has already reclaimed the 4-hour MA30, MA120, and MA200. MACD continues to expand volume, and the bulls have regained initiative. However, both RSI and KDJ have entered the overbought zone. The $81,600–$82,300 area is also the next resistance zone, and the risk-reward for chasing higher isn’t great.
Before month-end, focus on three key levels:
- Holding $80,000: If price stays strong, look for $84,000–$85,000.
- Breaking below $79,000: That would suggest the breakout needs to be re-confirmed, and price may pull back toward $78,000.
- Falling back below $77,500 again: Only then would this rally be considered clearly failed.
I think during the rest of September the market is likely to consolidate with a bullish bias, but above $82,000 is the real test. If bearish news doesn’t bring the price down, it indicates the positioning is strengthening. Only if volume expands and price holds above $82,300 can we say the trend reversal is confirmed; if it can’t hold, then this is still just a strong rebound.
It wasn’t that “good news suddenly arrived” that caused the big rally last night; it was that the shorts couldn’t hold on any longer.
Last night I judged that as long as BTC holds $77,000, it would break into $80,000 and continue to test the $82,000–$83,000 range.
So far the high has already reached around $81,600. The direction has essentially played out—only the pace is faster than I expected.
The reasons aren’t complicated.
Rate hikes, the hawkish dot plot, and the regulatory bill getting blocked have all already been priced in. But BTC still hasn’t broken below $75,000–$76,000. Since the bearish news can’t push it down, the shorts naturally start to get nervous.
Meanwhile, spot ETFs have shifted from continuous outflows to net inflows for two days totaling about $590 million. U.S. regulatory expectations are also warming up. Spot capital first pushes the price toward $80,000; then the shorts stop-loss, which further amplifies the upside.
On the technical side, BTC has already reclaimed the 4-hour MA30, MA120, and MA200. MACD continues to expand volume, and the bulls have regained initiative. However, both RSI and KDJ have entered the overbought zone. The $81,600–$82,300 area is also the next resistance zone, and the risk-reward for chasing higher isn’t great.
Before month-end, focus on three key levels:
- Holding $80,000: If price stays strong, look for $84,000–$85,000.
- Breaking below $79,000: That would suggest the breakout needs to be re-confirmed, and price may pull back toward $78,000.
- Falling back below $77,500 again: Only then would this rally be considered clearly failed.
I think during the rest of September the market is likely to consolidate with a bullish bias, but above $82,000 is the real test. If bearish news doesn’t bring the price down, it indicates the positioning is strengthening. Only if volume expands and price holds above $82,300 can we say the trend reversal is confirmed; if it can’t hold, then this is still just a strong rebound.
Last night I judged that as long as BTC holds $77,000, it would break into $80,000 and continue to test the $82,000–$83,000 range.
So far the high has already reached around $81,600. The direction has essentially played out—only the pace is faster than I expected.
The reasons aren’t complicated.
Rate hikes, the hawkish dot plot, and the regulatory bill getting blocked have all already been priced in. But BTC still hasn’t broken below $75,000–$76,000. Since the bearish news can’t push it down, the shorts naturally start to get nervous.
Meanwhile, spot ETFs have shifted from continuous outflows to net inflows for two days totaling about $590 million. U.S. regulatory expectations are also warming up. Spot capital first pushes the price toward $80,000; then the shorts stop-loss, which further amplifies the upside.
On the technical side, BTC has already reclaimed the 4-hour MA30, MA120, and MA200. MACD continues to expand volume, and the bulls have regained initiative. However, both RSI and KDJ have entered the overbought zone. The $81,600–$82,300 area is also the next resistance zone, and the risk-reward for chasing higher isn’t great.
Before month-end, focus on three key levels:
- Holding $80,000: If price stays strong, look for $84,000–$85,000.
- Breaking below $79,000: That would suggest the breakout needs to be re-confirmed, and price may pull back toward $78,000.
- Falling back below $77,500 again: Only then would this rally be considered clearly failed.
I think during the rest of September the market is likely to consolidate with a bullish bias, but above $82,000 is the real test. If bearish news doesn’t bring the price down, it indicates the positioning is strengthening. Only if volume expands and price holds above $82,300 can we say the trend reversal is confirmed; if it can’t hold, then this is still just a strong rebound.
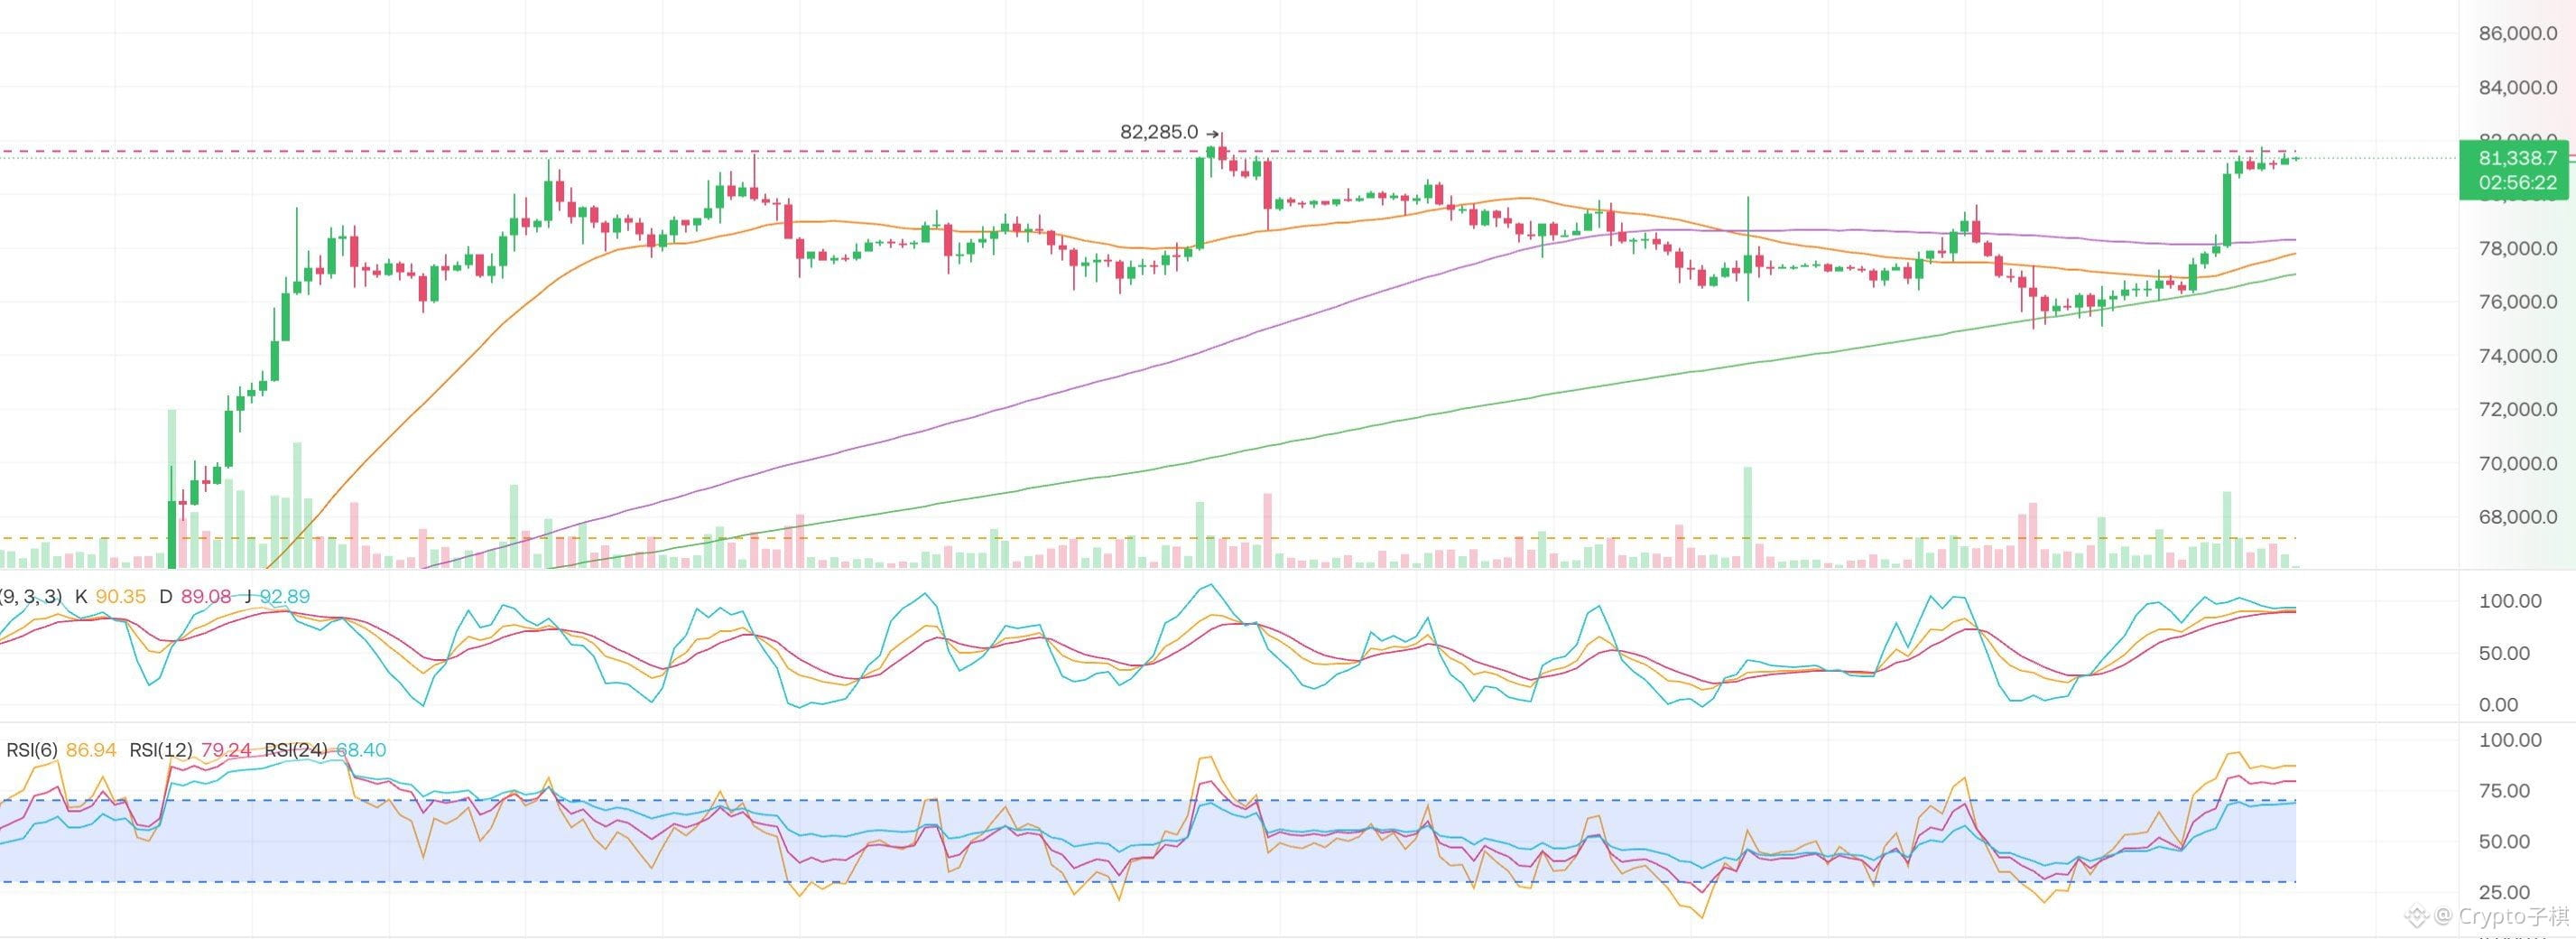
1
2.4k
·
--
What the hell is going on—how did it suddenly jump to 80,000?!
An hour ago I had a long position opened at 76,000, and I sold it at 78,000. Just now I went to take a 💩, and when I came back I saw it had reached 80,000. I thought my eyes were playing tricks…
Damn it, that 💩 should’ve been held in—shouldn’t have gone. Who would’ve thought that in the time it takes to take a dump, BTC would jump by $2,000!
What the hell is going on—how did it suddenly jump to 80,000?!
An hour ago I had a long position opened at 76,000, and I sold it at 78,000. Just now I went to take a 💩, and when I came back I saw it had reached 80,000. I thought my eyes were playing tricks…
Damn it, that 💩 should’ve been held in—shouldn’t have gone. Who would’ve thought that in the time it takes to take a dump, BTC would jump by $2,000!
An hour ago I had a long position opened at 76,000, and I sold it at 78,000. Just now I went to take a 💩, and when I came back I saw it had reached 80,000. I thought my eyes were playing tricks…
Damn it, that 💩 should’ve been held in—shouldn’t have gone. Who would’ve thought that in the time it takes to take a dump, BTC would jump by $2,000!
1
6
3.6k
·
--
After the rate hike, $BTC bounced back from 75,000 to around 78,000 and is now consolidating!
But what’s really worth noting is this: despite multiple headwinds— the Federal Reserve’s rate hikes, a stronger US dollar and US Treasuries, and ETF outflows— the 75,000 level still hasn’t been smashed through.
In the past 4 hours, there have been consecutive candles with long lower wicks; the lows are gradually rising. Then it broke above the downward trendline, the MACD formed a golden cross, and the momentum histogram has expanded.
But talking about a reversal is still too early.
The KDJ has already entered the high zone, and the short-term RSI is nearing overbought. Meanwhile, 78,500 to 80,000 is another area of moving-average and order-flow resistance. When it broke through, the trading volume didn’t increase noticeably, suggesting this rally is more driven by weakening sell pressure and short covering—not a broad influx of fresh incremental capital.
After ETF outflows of roughly $746 million over two consecutive days, the latest trading day saw a rebound inflow of about $160 million. Institutions haven’t retreated. There are definitely buyers around 75,000, but this money is more like a backstop for now; it’s not enough to push BTC directly up to $82,000.
So for the rest of September, I’m more inclined to see a first push toward 79,000–80,000, then a pullback to confirm.
If it pulls back to 77,000 and holds without breaking, that would suggest the original trendline has turned from resistance into support. After that, I would continue to look for 82,000–83,000.
If it spikes higher and then falls back below 76,000 again, this breakout could turn out to be a false move, and the 75,000 level would need to be tested once more.
If it can hold above $83,000, only then would this bear-market bounce be worthy of being upgraded to a trend reversal. If it breaks below $72,400, then the so-called “resilience” would just be a delay in the decline—watch out for $69,600.
For the short term, it’s okay to be optimistic about the rebound, but don’t be too confident about a reversal. My past experience tells me: once you get blindly optimistic, the market won’t be far behind in educating you!
After the rate hike, $BTC bounced back from 75,000 to around 78,000 and is now consolidating!
But what’s really worth noting is this: despite multiple headwinds— the Federal Reserve’s rate hikes, a stronger US dollar and US Treasuries, and ETF outflows— the 75,000 level still hasn’t been smashed through.
In the past 4 hours, there have been consecutive candles with long lower wicks; the lows are gradually rising. Then it broke above the downward trendline, the MACD formed a golden cross, and the momentum histogram has expanded.
But talking about a reversal is still too early.
The KDJ has already entered the high zone, and the short-term RSI is nearing overbought. Meanwhile, 78,500 to 80,000 is another area of moving-average and order-flow resistance. When it broke through, the trading volume didn’t increase noticeably, suggesting this rally is more driven by weakening sell pressure and short covering—not a broad influx of fresh incremental capital.
After ETF outflows of roughly $746 million over two consecutive days, the latest trading day saw a rebound inflow of about $160 million. Institutions haven’t retreated. There are definitely buyers around 75,000, but this money is more like a backstop for now; it’s not enough to push BTC directly up to $82,000.
So for the rest of September, I’m more inclined to see a first push toward 79,000–80,000, then a pullback to confirm.
If it pulls back to 77,000 and holds without breaking, that would suggest the original trendline has turned from resistance into support. After that, I would continue to look for 82,000–83,000.
If it spikes higher and then falls back below 76,000 again, this breakout could turn out to be a false move, and the 75,000 level would need to be tested once more.
If it can hold above $83,000, only then would this bear-market bounce be worthy of being upgraded to a trend reversal. If it breaks below $72,400, then the so-called “resilience” would just be a delay in the decline—watch out for $69,600.
For the short term, it’s okay to be optimistic about the rebound, but don’t be too confident about a reversal. My past experience tells me: once you get blindly optimistic, the market won’t be far behind in educating you!
But what’s really worth noting is this: despite multiple headwinds— the Federal Reserve’s rate hikes, a stronger US dollar and US Treasuries, and ETF outflows— the 75,000 level still hasn’t been smashed through.
In the past 4 hours, there have been consecutive candles with long lower wicks; the lows are gradually rising. Then it broke above the downward trendline, the MACD formed a golden cross, and the momentum histogram has expanded.
But talking about a reversal is still too early.
The KDJ has already entered the high zone, and the short-term RSI is nearing overbought. Meanwhile, 78,500 to 80,000 is another area of moving-average and order-flow resistance. When it broke through, the trading volume didn’t increase noticeably, suggesting this rally is more driven by weakening sell pressure and short covering—not a broad influx of fresh incremental capital.
After ETF outflows of roughly $746 million over two consecutive days, the latest trading day saw a rebound inflow of about $160 million. Institutions haven’t retreated. There are definitely buyers around 75,000, but this money is more like a backstop for now; it’s not enough to push BTC directly up to $82,000.
So for the rest of September, I’m more inclined to see a first push toward 79,000–80,000, then a pullback to confirm.
If it pulls back to 77,000 and holds without breaking, that would suggest the original trendline has turned from resistance into support. After that, I would continue to look for 82,000–83,000.
If it spikes higher and then falls back below 76,000 again, this breakout could turn out to be a false move, and the 75,000 level would need to be tested once more.
If it can hold above $83,000, only then would this bear-market bounce be worthy of being upgraded to a trend reversal. If it breaks below $72,400, then the so-called “resilience” would just be a delay in the decline—watch out for $69,600.
For the short term, it’s okay to be optimistic about the rebound, but don’t be too confident about a reversal. My past experience tells me: once you get blindly optimistic, the market won’t be far behind in educating you!
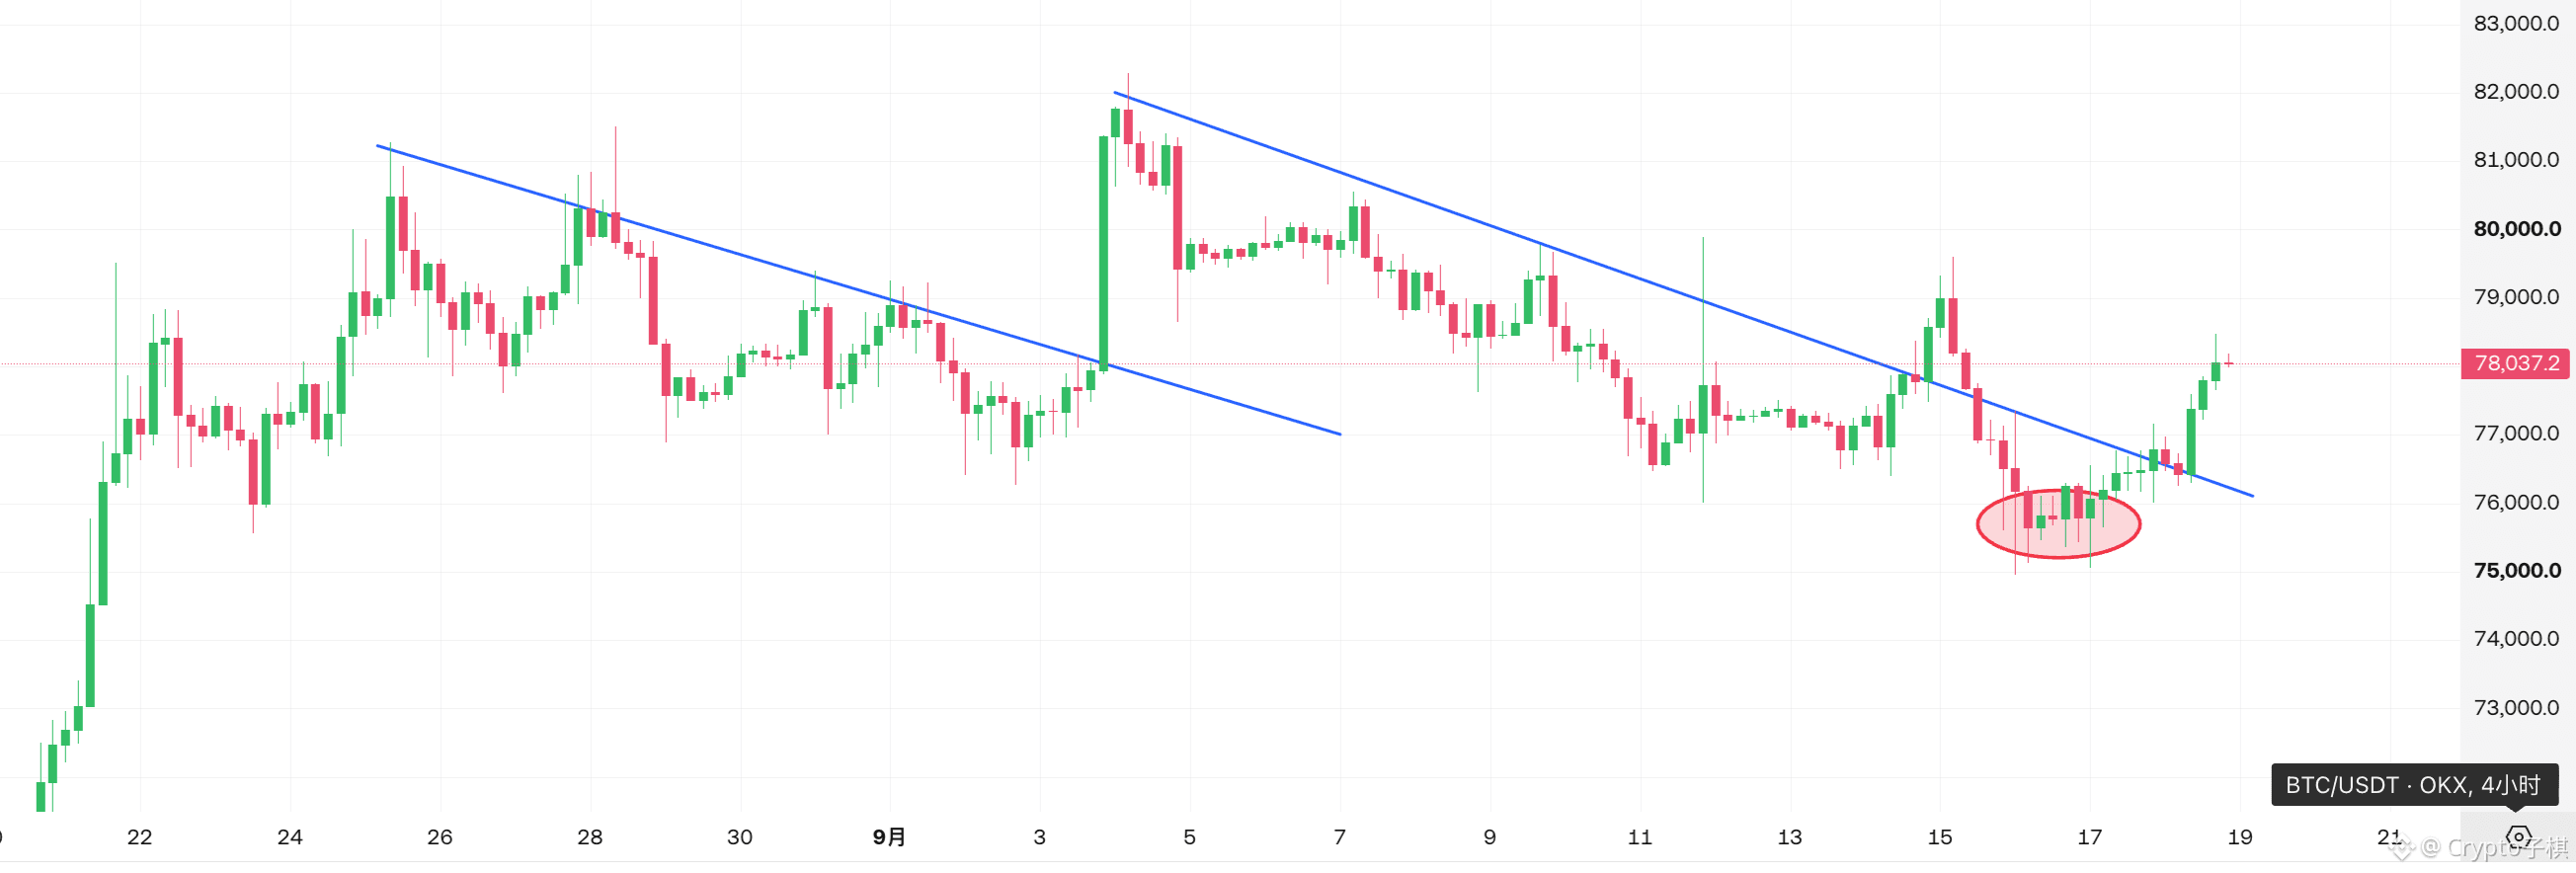
Crypto子棋
·
--
With so many bearish factors—BTC manages to hold without dropping despite $BTC , is this truly a bottom, or just stubborn support?
The Federal Reserve raises rates; the dot plot suggests more hikes within the year.
Watersh speech tilts hawkish, and the US dollar and Treasury yields strengthen.
The CLARITY Act faces setbacks; large outflows from ETFs, and even Strategy has started selling coins.
Under the old script, after this lineup of moves, even if BTC doesn’t crash, it should report around the $70,000 level.
But this time, it only dipped as low as around $75,000, and was quickly picked up again.
This suggests that around $75,000 there truly is buy support. The market wasn’t completely unprepared for the rate hikes. From $82,000 down to $75,000 is nearly a 9% pullback, which already digested part of the bad news in advance.
But we still can’t rush to call the bull market back.
After trading for a while, I care less about how scary the news sounds, and more about how price moves after it comes out. If bad news doesn’t drop the price, it means the bears can’t really smash it for now. If bad news lands and price can’t rebound, it means the bulls aren’t that strong.
Right now, BTC is simple: there are buyers below, but no chasing above.
As long as $75,000 to $76,000 holds, there’s a chance for the market to go sideways and repair in the short term, then retest the $80,000 to $82,000 range.
Only if it stands firm at $82,000 with volume can we say this batch of bearish catalysts has been digested. Then, breaking above $84,000 to $85,000 is what actually deserves talk of a trend reversal.
If $75,000 breaks, the next stop is $72,400. If that level holds, it can still be viewed as a consolidation-and-wash scenario. But if it effectively breaks, the so-called “hard to drop” behavior may just mean a delayed selloff—and later we need to watch out for $69,600.
Once above $82,000, the bearish news is basically exhausted; if it breaks below $72,400, the decline is simply late.
As for the middle stretch, the one operation I’m most familiar with is the same: either stay on the sidelines or, for short-term trading, set take-profit and stop-loss properly.
The Federal Reserve raises rates; the dot plot suggests more hikes within the year.
Watersh speech tilts hawkish, and the US dollar and Treasury yields strengthen.
The CLARITY Act faces setbacks; large outflows from ETFs, and even Strategy has started selling coins.
Under the old script, after this lineup of moves, even if BTC doesn’t crash, it should report around the $70,000 level.
But this time, it only dipped as low as around $75,000, and was quickly picked up again.
This suggests that around $75,000 there truly is buy support. The market wasn’t completely unprepared for the rate hikes. From $82,000 down to $75,000 is nearly a 9% pullback, which already digested part of the bad news in advance.
But we still can’t rush to call the bull market back.
After trading for a while, I care less about how scary the news sounds, and more about how price moves after it comes out. If bad news doesn’t drop the price, it means the bears can’t really smash it for now. If bad news lands and price can’t rebound, it means the bulls aren’t that strong.
Right now, BTC is simple: there are buyers below, but no chasing above.
As long as $75,000 to $76,000 holds, there’s a chance for the market to go sideways and repair in the short term, then retest the $80,000 to $82,000 range.
Only if it stands firm at $82,000 with volume can we say this batch of bearish catalysts has been digested. Then, breaking above $84,000 to $85,000 is what actually deserves talk of a trend reversal.
If $75,000 breaks, the next stop is $72,400. If that level holds, it can still be viewed as a consolidation-and-wash scenario. But if it effectively breaks, the so-called “hard to drop” behavior may just mean a delayed selloff—and later we need to watch out for $69,600.
Once above $82,000, the bearish news is basically exhausted; if it breaks below $72,400, the decline is simply late.
As for the middle stretch, the one operation I’m most familiar with is the same: either stay on the sidelines or, for short-term trading, set take-profit and stop-loss properly.
5
1.7k
·
--
With so many bearish factors—BTC manages to hold without dropping despite $BTC , is this truly a bottom, or just stubborn support?
The Federal Reserve raises rates; the dot plot suggests more hikes within the year.
Watersh speech tilts hawkish, and the US dollar and Treasury yields strengthen.
The CLARITY Act faces setbacks; large outflows from ETFs, and even Strategy has started selling coins.
Under the old script, after this lineup of moves, even if BTC doesn’t crash, it should report around the $70,000 level.
But this time, it only dipped as low as around $75,000, and was quickly picked up again.
This suggests that around $75,000 there truly is buy support. The market wasn’t completely unprepared for the rate hikes. From $82,000 down to $75,000 is nearly a 9% pullback, which already digested part of the bad news in advance.
But we still can’t rush to call the bull market back.
After trading for a while, I care less about how scary the news sounds, and more about how price moves after it comes out. If bad news doesn’t drop the price, it means the bears can’t really smash it for now. If bad news lands and price can’t rebound, it means the bulls aren’t that strong.
Right now, BTC is simple: there are buyers below, but no chasing above.
As long as $75,000 to $76,000 holds, there’s a chance for the market to go sideways and repair in the short term, then retest the $80,000 to $82,000 range.
Only if it stands firm at $82,000 with volume can we say this batch of bearish catalysts has been digested. Then, breaking above $84,000 to $85,000 is what actually deserves talk of a trend reversal.
If $75,000 breaks, the next stop is $72,400. If that level holds, it can still be viewed as a consolidation-and-wash scenario. But if it effectively breaks, the so-called “hard to drop” behavior may just mean a delayed selloff—and later we need to watch out for $69,600.
Once above $82,000, the bearish news is basically exhausted; if it breaks below $72,400, the decline is simply late.
As for the middle stretch, the one operation I’m most familiar with is the same: either stay on the sidelines or, for short-term trading, set take-profit and stop-loss properly.
With so many bearish factors—BTC manages to hold without dropping despite $BTC , is this truly a bottom, or just stubborn support?
The Federal Reserve raises rates; the dot plot suggests more hikes within the year.
Watersh speech tilts hawkish, and the US dollar and Treasury yields strengthen.
The CLARITY Act faces setbacks; large outflows from ETFs, and even Strategy has started selling coins.
Under the old script, after this lineup of moves, even if BTC doesn’t crash, it should report around the $70,000 level.
But this time, it only dipped as low as around $75,000, and was quickly picked up again.
This suggests that around $75,000 there truly is buy support. The market wasn’t completely unprepared for the rate hikes. From $82,000 down to $75,000 is nearly a 9% pullback, which already digested part of the bad news in advance.
But we still can’t rush to call the bull market back.
After trading for a while, I care less about how scary the news sounds, and more about how price moves after it comes out. If bad news doesn’t drop the price, it means the bears can’t really smash it for now. If bad news lands and price can’t rebound, it means the bulls aren’t that strong.
Right now, BTC is simple: there are buyers below, but no chasing above.
As long as $75,000 to $76,000 holds, there’s a chance for the market to go sideways and repair in the short term, then retest the $80,000 to $82,000 range.
Only if it stands firm at $82,000 with volume can we say this batch of bearish catalysts has been digested. Then, breaking above $84,000 to $85,000 is what actually deserves talk of a trend reversal.
If $75,000 breaks, the next stop is $72,400. If that level holds, it can still be viewed as a consolidation-and-wash scenario. But if it effectively breaks, the so-called “hard to drop” behavior may just mean a delayed selloff—and later we need to watch out for $69,600.
Once above $82,000, the bearish news is basically exhausted; if it breaks below $72,400, the decline is simply late.
As for the middle stretch, the one operation I’m most familiar with is the same: either stay on the sidelines or, for short-term trading, set take-profit and stop-loss properly.
The Federal Reserve raises rates; the dot plot suggests more hikes within the year.
Watersh speech tilts hawkish, and the US dollar and Treasury yields strengthen.
The CLARITY Act faces setbacks; large outflows from ETFs, and even Strategy has started selling coins.
Under the old script, after this lineup of moves, even if BTC doesn’t crash, it should report around the $70,000 level.
But this time, it only dipped as low as around $75,000, and was quickly picked up again.
This suggests that around $75,000 there truly is buy support. The market wasn’t completely unprepared for the rate hikes. From $82,000 down to $75,000 is nearly a 9% pullback, which already digested part of the bad news in advance.
But we still can’t rush to call the bull market back.
After trading for a while, I care less about how scary the news sounds, and more about how price moves after it comes out. If bad news doesn’t drop the price, it means the bears can’t really smash it for now. If bad news lands and price can’t rebound, it means the bulls aren’t that strong.
Right now, BTC is simple: there are buyers below, but no chasing above.
As long as $75,000 to $76,000 holds, there’s a chance for the market to go sideways and repair in the short term, then retest the $80,000 to $82,000 range.
Only if it stands firm at $82,000 with volume can we say this batch of bearish catalysts has been digested. Then, breaking above $84,000 to $85,000 is what actually deserves talk of a trend reversal.
If $75,000 breaks, the next stop is $72,400. If that level holds, it can still be viewed as a consolidation-and-wash scenario. But if it effectively breaks, the so-called “hard to drop” behavior may just mean a delayed selloff—and later we need to watch out for $69,600.
Once above $82,000, the bearish news is basically exhausted; if it breaks below $72,400, the decline is simply late.
As for the middle stretch, the one operation I’m most familiar with is the same: either stay on the sidelines or, for short-term trading, set take-profit and stop-loss properly.
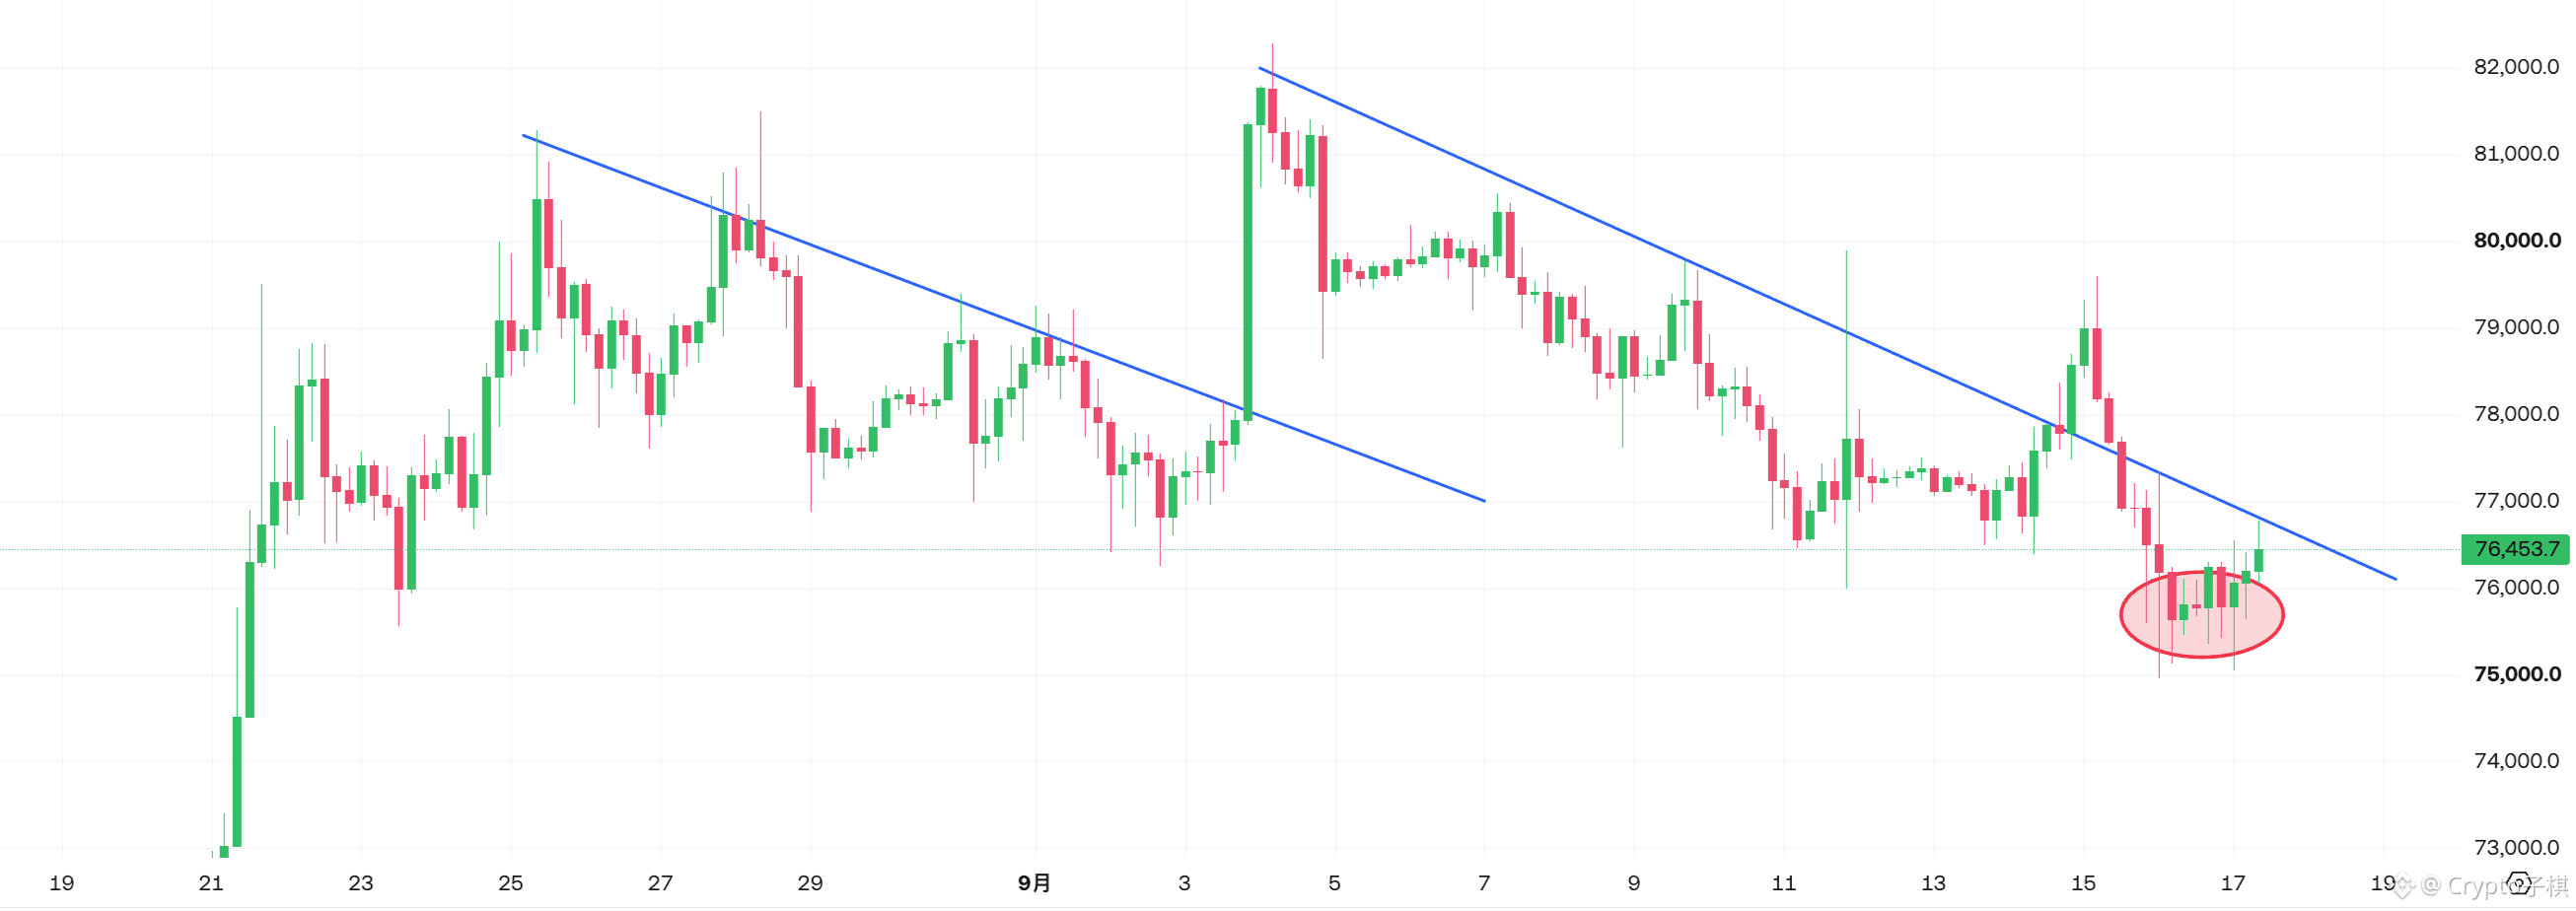
1
1
1.3k
·
--
The Federal Reserve will raise rates by 25 basis points tonight, bringing the target range to 3.75%—4.00%.
In the big picture, this rate hike isn’t that frightening, because the market has already priced it in.
What really deserves attention is the dot plot: by the end of 2026, the median rate rises to 4.1%. Of the 18 officials who submitted forecasts, 16 believe that further rate hikes are still needed this year; by the end of 2027, the median remains around 4.1% as well.
So what does this mean?
It doesn’t end after tonight’s hike. Instead, the Fed is laying out a clearer path for the market: there will likely be one more hike this year; next year may not necessarily bring additional hikes, but rates could stay at elevated levels for longer.
Overall, Wach’s remarks are hawkish.
He emphasized that inflation is still too high and that keeping prices stable is the Fed’s top priority right now. At the same time, he did not commit to consecutive rate hikes, stressing that policy will be adjusted flexibly based on inflation, employment, oil prices, and financial conditions.
So this isn’t a “violent restart of a rate-hike cycle.” It’s more like: hike once tonight, leave room for another hike by year-end, and then observe at higher rate levels.
For BTC, the most important development tonight is this: after the negative news is absorbed, the price does not spiral downward. Instead, it returns to around $76,000, indicating that the market has already digested the 25-basis-point move itself. What traders are truly worried about is “another hike by year-end” and rates staying high for longer.
Next, you only need to watch three levels:
$76,000 is the key short-term line in the sand between bulls and bears. If BTC can hold above it, there’s a chance it could rebound further toward $80,000—$82,000.
$72,400 is the first major line of defense. As long as it doesn’t break below, the market is still in a high-range consolidation phase rather than a trend-breaking collapse.
If $72,400 is effectively lost, it suggests that hawkish pressure is starting to transmit to the coin price in earnest; the next likely step would be a test of $69,600.
My overall assessment is: in the short term, consolidation is slightly bearish; in the medium term, the direction still depends on whether $72,400 can be defended.
One-sentence summary: Don’t chase gains blindly in the short run, and don’t panic just because the Fed hiked rates. Hold $72,400 to continue looking for a consolidation-and-rebound; if $72,400 breaks, defend at $69,600. A true turn for the better requires reclaiming $80,000.
The Federal Reserve will raise rates by 25 basis points tonight, bringing the target range to 3.75%—4.00%.
In the big picture, this rate hike isn’t that frightening, because the market has already priced it in.
What really deserves attention is the dot plot: by the end of 2026, the median rate rises to 4.1%. Of the 18 officials who submitted forecasts, 16 believe that further rate hikes are still needed this year; by the end of 2027, the median remains around 4.1% as well.
So what does this mean?
It doesn’t end after tonight’s hike. Instead, the Fed is laying out a clearer path for the market: there will likely be one more hike this year; next year may not necessarily bring additional hikes, but rates could stay at elevated levels for longer.
Overall, Wach’s remarks are hawkish.
He emphasized that inflation is still too high and that keeping prices stable is the Fed’s top priority right now. At the same time, he did not commit to consecutive rate hikes, stressing that policy will be adjusted flexibly based on inflation, employment, oil prices, and financial conditions.
So this isn’t a “violent restart of a rate-hike cycle.” It’s more like: hike once tonight, leave room for another hike by year-end, and then observe at higher rate levels.
For BTC, the most important development tonight is this: after the negative news is absorbed, the price does not spiral downward. Instead, it returns to around $76,000, indicating that the market has already digested the 25-basis-point move itself. What traders are truly worried about is “another hike by year-end” and rates staying high for longer.
Next, you only need to watch three levels:
$76,000 is the key short-term line in the sand between bulls and bears. If BTC can hold above it, there’s a chance it could rebound further toward $80,000—$82,000.
$72,400 is the first major line of defense. As long as it doesn’t break below, the market is still in a high-range consolidation phase rather than a trend-breaking collapse.
If $72,400 is effectively lost, it suggests that hawkish pressure is starting to transmit to the coin price in earnest; the next likely step would be a test of $69,600.
My overall assessment is: in the short term, consolidation is slightly bearish; in the medium term, the direction still depends on whether $72,400 can be defended.
One-sentence summary: Don’t chase gains blindly in the short run, and don’t panic just because the Fed hiked rates. Hold $72,400 to continue looking for a consolidation-and-rebound; if $72,400 breaks, defend at $69,600. A true turn for the better requires reclaiming $80,000.
In the big picture, this rate hike isn’t that frightening, because the market has already priced it in.
What really deserves attention is the dot plot: by the end of 2026, the median rate rises to 4.1%. Of the 18 officials who submitted forecasts, 16 believe that further rate hikes are still needed this year; by the end of 2027, the median remains around 4.1% as well.
So what does this mean?
It doesn’t end after tonight’s hike. Instead, the Fed is laying out a clearer path for the market: there will likely be one more hike this year; next year may not necessarily bring additional hikes, but rates could stay at elevated levels for longer.
Overall, Wach’s remarks are hawkish.
He emphasized that inflation is still too high and that keeping prices stable is the Fed’s top priority right now. At the same time, he did not commit to consecutive rate hikes, stressing that policy will be adjusted flexibly based on inflation, employment, oil prices, and financial conditions.
So this isn’t a “violent restart of a rate-hike cycle.” It’s more like: hike once tonight, leave room for another hike by year-end, and then observe at higher rate levels.
For BTC, the most important development tonight is this: after the negative news is absorbed, the price does not spiral downward. Instead, it returns to around $76,000, indicating that the market has already digested the 25-basis-point move itself. What traders are truly worried about is “another hike by year-end” and rates staying high for longer.
Next, you only need to watch three levels:
$76,000 is the key short-term line in the sand between bulls and bears. If BTC can hold above it, there’s a chance it could rebound further toward $80,000—$82,000.
$72,400 is the first major line of defense. As long as it doesn’t break below, the market is still in a high-range consolidation phase rather than a trend-breaking collapse.
If $72,400 is effectively lost, it suggests that hawkish pressure is starting to transmit to the coin price in earnest; the next likely step would be a test of $69,600.
My overall assessment is: in the short term, consolidation is slightly bearish; in the medium term, the direction still depends on whether $72,400 can be defended.
One-sentence summary: Don’t chase gains blindly in the short run, and don’t panic just because the Fed hiked rates. Hold $72,400 to continue looking for a consolidation-and-rebound; if $72,400 breaks, defend at $69,600. A true turn for the better requires reclaiming $80,000.
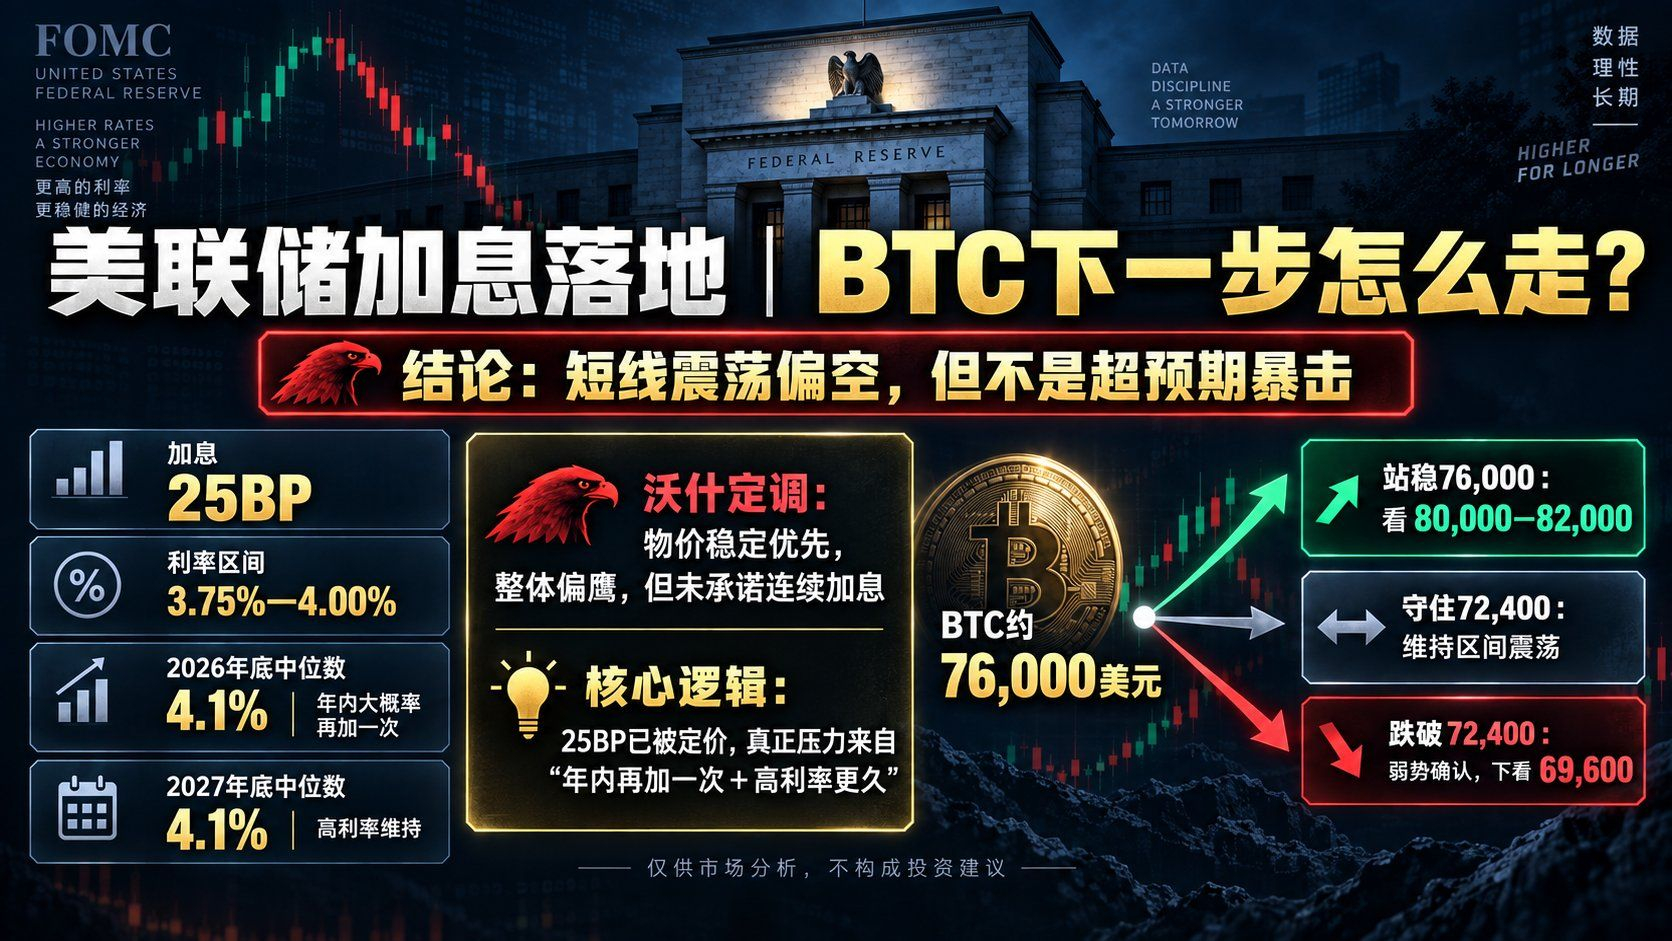
Crypto子棋
·
--
Tonight’s Fed is likely to raise rates by 25 basis points; this is probably already “priced in as a sure thing.” What will truly determine BTC’s direction isn’t whether there’s a hike or not, but whether the dot plot signals to the market that this is just a one-off increase—or the start of a new tightening cycle.
At present, the probability of a 25bp hike tonight is over 90%, with expectations that the target range for rates will rise to 3.75%–4.00%.
Looking at this step alone, the impact on the market may be limited, since expectations have already been well traded.
The real “big move” is the interest-rate median by end-2026.
If the dot plot stays around 3.9%, it would suggest that after tonight’s hike, policymakers would likely pause—an even more dovish outcome. In that case, U.S. Treasury yields and the U.S. dollar could fall, and BTC would be more likely to bounce on a “sell the news / bad news fades” pattern, then retest the $80,000–$82,000 area.
If the median rises to around 4.1%, it would imply that there’s likely another hike before year-end. This is the result I believe is most likely: the tightening cycle has begun, but they won’t hike at every meeting.
BTC’s short-term price action may first face downward pressure. The key test will be support at $75,000–$76,000. Only after holding that level would a technical rebound have a chance.
If the dot plot reaches around 4.4%, it would indicate at least two more hikes before year-end—clearly a hawkish surprise. At that time, Treasury yields and the dollar could continue to strengthen. If BTC breaks below $75,000, the next level to watch would be around 72,400, and in extreme cases, a pullback toward the 69,600 area.
The Fed’s recent comments have been clearly on the hawkish side: inflation is still above target, employment hasn’t clearly deteriorated, and the financial conditions don’t really look like tightening. So I’m more inclined to expect tonight’s most probable combination: a 25bp hike plus an upward adjustment of the dot plot to around 4.1%.
For BTC, the best outcome tonight isn’t necessarily avoiding a rate hike—it’s the post-hike message that “that’s it for now.” The worst outcome isn’t the 25bp increase itself, but the dot plot confirming that this is only the first step.
Tonight, watch three numbers: 3.9% means a bearish “bad news is already out”; 4.1% means a choppy-to-bearish regime; and 4.4% is a level that could signal a new round of downside.
At present, the probability of a 25bp hike tonight is over 90%, with expectations that the target range for rates will rise to 3.75%–4.00%.
Looking at this step alone, the impact on the market may be limited, since expectations have already been well traded.
The real “big move” is the interest-rate median by end-2026.
If the dot plot stays around 3.9%, it would suggest that after tonight’s hike, policymakers would likely pause—an even more dovish outcome. In that case, U.S. Treasury yields and the U.S. dollar could fall, and BTC would be more likely to bounce on a “sell the news / bad news fades” pattern, then retest the $80,000–$82,000 area.
If the median rises to around 4.1%, it would imply that there’s likely another hike before year-end. This is the result I believe is most likely: the tightening cycle has begun, but they won’t hike at every meeting.
BTC’s short-term price action may first face downward pressure. The key test will be support at $75,000–$76,000. Only after holding that level would a technical rebound have a chance.
If the dot plot reaches around 4.4%, it would indicate at least two more hikes before year-end—clearly a hawkish surprise. At that time, Treasury yields and the dollar could continue to strengthen. If BTC breaks below $75,000, the next level to watch would be around 72,400, and in extreme cases, a pullback toward the 69,600 area.
The Fed’s recent comments have been clearly on the hawkish side: inflation is still above target, employment hasn’t clearly deteriorated, and the financial conditions don’t really look like tightening. So I’m more inclined to expect tonight’s most probable combination: a 25bp hike plus an upward adjustment of the dot plot to around 4.1%.
For BTC, the best outcome tonight isn’t necessarily avoiding a rate hike—it’s the post-hike message that “that’s it for now.” The worst outcome isn’t the 25bp increase itself, but the dot plot confirming that this is only the first step.
Tonight, watch three numbers: 3.9% means a bearish “bad news is already out”; 4.1% means a choppy-to-bearish regime; and 4.4% is a level that could signal a new round of downside.
1
558
·
--
Verified
Tonight’s Fed is likely to raise rates by 25 basis points; this is probably already “priced in as a sure thing.” What will truly determine BTC’s direction isn’t whether there’s a hike or not, but whether the dot plot signals to the market that this is just a one-off increase—or the start of a new tightening cycle.
At present, the probability of a 25bp hike tonight is over 90%, with expectations that the target range for rates will rise to 3.75%–4.00%.
Looking at this step alone, the impact on the market may be limited, since expectations have already been well traded.
The real “big move” is the interest-rate median by end-2026.
If the dot plot stays around 3.9%, it would suggest that after tonight’s hike, policymakers would likely pause—an even more dovish outcome. In that case, U.S. Treasury yields and the U.S. dollar could fall, and BTC would be more likely to bounce on a “sell the news / bad news fades” pattern, then retest the $80,000–$82,000 area.
If the median rises to around 4.1%, it would imply that there’s likely another hike before year-end. This is the result I believe is most likely: the tightening cycle has begun, but they won’t hike at every meeting.
BTC’s short-term price action may first face downward pressure. The key test will be support at $75,000–$76,000. Only after holding that level would a technical rebound have a chance.
If the dot plot reaches around 4.4%, it would indicate at least two more hikes before year-end—clearly a hawkish surprise. At that time, Treasury yields and the dollar could continue to strengthen. If BTC breaks below $75,000, the next level to watch would be around 72,400, and in extreme cases, a pullback toward the 69,600 area.
The Fed’s recent comments have been clearly on the hawkish side: inflation is still above target, employment hasn’t clearly deteriorated, and the financial conditions don’t really look like tightening. So I’m more inclined to expect tonight’s most probable combination: a 25bp hike plus an upward adjustment of the dot plot to around 4.1%.
For BTC, the best outcome tonight isn’t necessarily avoiding a rate hike—it’s the post-hike message that “that’s it for now.” The worst outcome isn’t the 25bp increase itself, but the dot plot confirming that this is only the first step.
Tonight, watch three numbers: 3.9% means a bearish “bad news is already out”; 4.1% means a choppy-to-bearish regime; and 4.4% is a level that could signal a new round of downside.
Tonight’s Fed is likely to raise rates by 25 basis points; this is probably already “priced in as a sure thing.” What will truly determine BTC’s direction isn’t whether there’s a hike or not, but whether the dot plot signals to the market that this is just a one-off increase—or the start of a new tightening cycle.
At present, the probability of a 25bp hike tonight is over 90%, with expectations that the target range for rates will rise to 3.75%–4.00%.
Looking at this step alone, the impact on the market may be limited, since expectations have already been well traded.
The real “big move” is the interest-rate median by end-2026.
If the dot plot stays around 3.9%, it would suggest that after tonight’s hike, policymakers would likely pause—an even more dovish outcome. In that case, U.S. Treasury yields and the U.S. dollar could fall, and BTC would be more likely to bounce on a “sell the news / bad news fades” pattern, then retest the $80,000–$82,000 area.
If the median rises to around 4.1%, it would imply that there’s likely another hike before year-end. This is the result I believe is most likely: the tightening cycle has begun, but they won’t hike at every meeting.
BTC’s short-term price action may first face downward pressure. The key test will be support at $75,000–$76,000. Only after holding that level would a technical rebound have a chance.
If the dot plot reaches around 4.4%, it would indicate at least two more hikes before year-end—clearly a hawkish surprise. At that time, Treasury yields and the dollar could continue to strengthen. If BTC breaks below $75,000, the next level to watch would be around 72,400, and in extreme cases, a pullback toward the 69,600 area.
The Fed’s recent comments have been clearly on the hawkish side: inflation is still above target, employment hasn’t clearly deteriorated, and the financial conditions don’t really look like tightening. So I’m more inclined to expect tonight’s most probable combination: a 25bp hike plus an upward adjustment of the dot plot to around 4.1%.
For BTC, the best outcome tonight isn’t necessarily avoiding a rate hike—it’s the post-hike message that “that’s it for now.” The worst outcome isn’t the 25bp increase itself, but the dot plot confirming that this is only the first step.
Tonight, watch three numbers: 3.9% means a bearish “bad news is already out”; 4.1% means a choppy-to-bearish regime; and 4.4% is a level that could signal a new round of downside.
At present, the probability of a 25bp hike tonight is over 90%, with expectations that the target range for rates will rise to 3.75%–4.00%.
Looking at this step alone, the impact on the market may be limited, since expectations have already been well traded.
The real “big move” is the interest-rate median by end-2026.
If the dot plot stays around 3.9%, it would suggest that after tonight’s hike, policymakers would likely pause—an even more dovish outcome. In that case, U.S. Treasury yields and the U.S. dollar could fall, and BTC would be more likely to bounce on a “sell the news / bad news fades” pattern, then retest the $80,000–$82,000 area.
If the median rises to around 4.1%, it would imply that there’s likely another hike before year-end. This is the result I believe is most likely: the tightening cycle has begun, but they won’t hike at every meeting.
BTC’s short-term price action may first face downward pressure. The key test will be support at $75,000–$76,000. Only after holding that level would a technical rebound have a chance.
If the dot plot reaches around 4.4%, it would indicate at least two more hikes before year-end—clearly a hawkish surprise. At that time, Treasury yields and the dollar could continue to strengthen. If BTC breaks below $75,000, the next level to watch would be around 72,400, and in extreme cases, a pullback toward the 69,600 area.
The Fed’s recent comments have been clearly on the hawkish side: inflation is still above target, employment hasn’t clearly deteriorated, and the financial conditions don’t really look like tightening. So I’m more inclined to expect tonight’s most probable combination: a 25bp hike plus an upward adjustment of the dot plot to around 4.1%.
For BTC, the best outcome tonight isn’t necessarily avoiding a rate hike—it’s the post-hike message that “that’s it for now.” The worst outcome isn’t the 25bp increase itself, but the dot plot confirming that this is only the first step.
Tonight, watch three numbers: 3.9% means a bearish “bad news is already out”; 4.1% means a choppy-to-bearish regime; and 4.4% is a level that could signal a new round of downside.
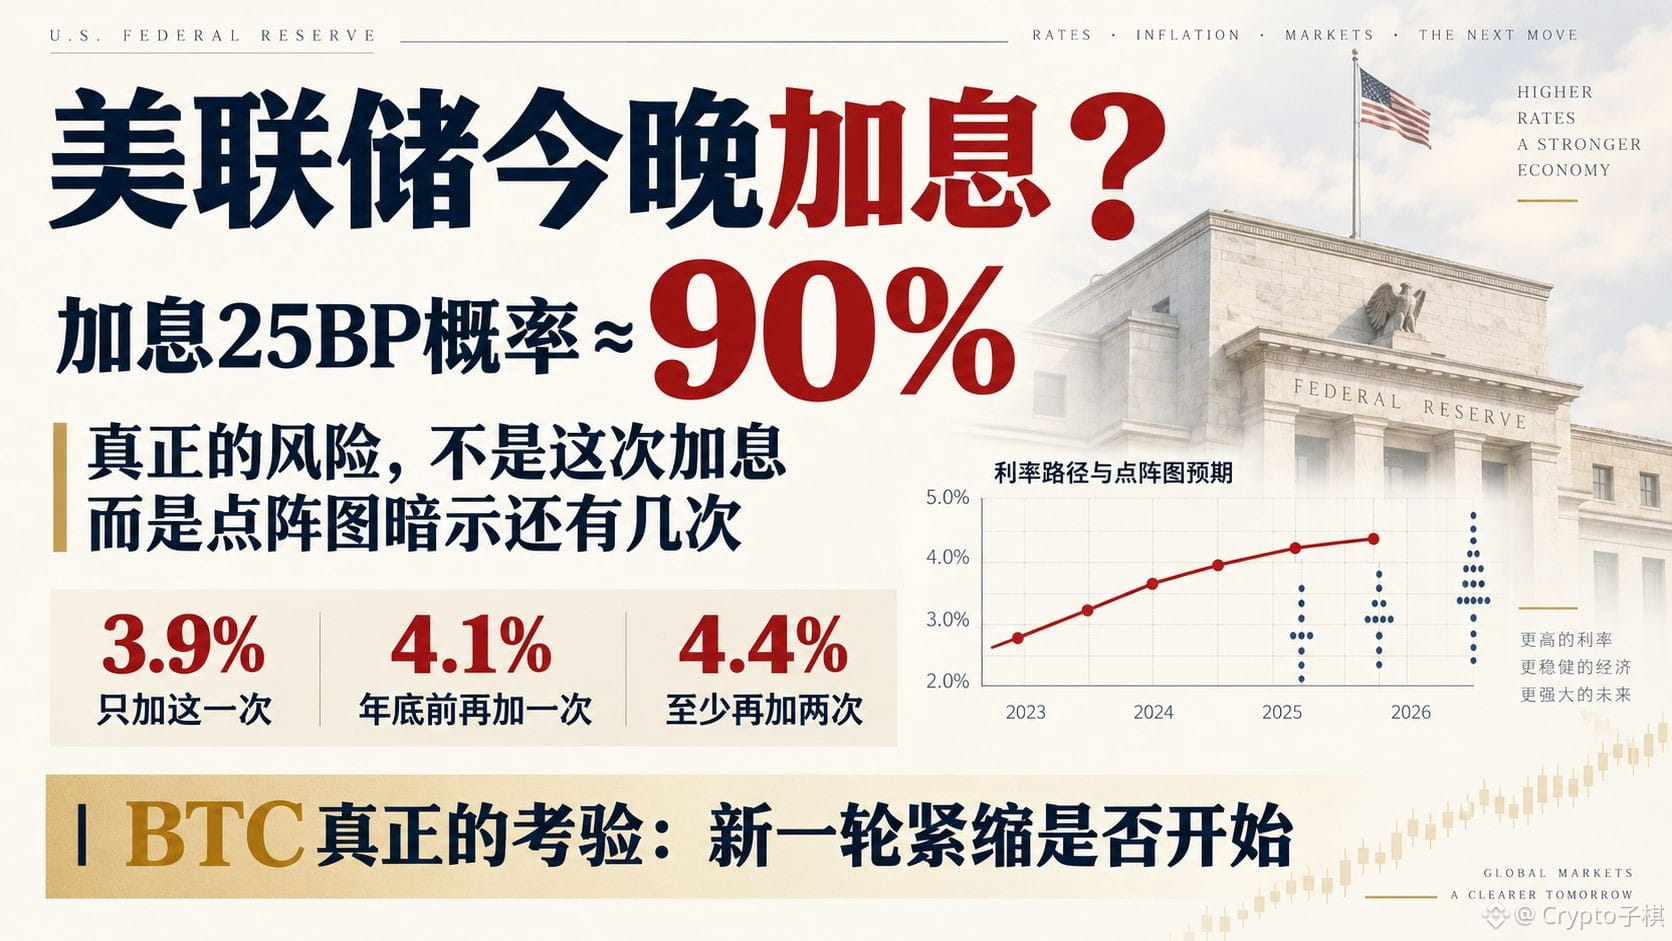
1
13
18.1k
·
--
Why does the longer you research a coin, the easier it becomes to lose objective judgment?
When I first entered the market, I thought the deeper you research, the heavier your position should be—and that this was more reasonable.
I read the whitepaper, listened to team interviews, and got well acquainted with the community. Naturally, I felt that I understood it better than others.
Later, I realized that research increases cognition, but it also creates emotion.
I used to follow a project for a long time. I knew how, with every upgrade, partnership, and unlock, it could even help the team explain every延期 (delay).
When the price fell, I didn’t重新做判断. Instead, I instinctively looked for “good news” to prove that I wasn’t wrong. What others saw was the weakening trend, but what I saw was: “the market still doesn’t understand it.”
The more time I invested, the harder it became to admit that my research conclusions might be invalid. Selling wasn’t just about cutting losses—it also felt like denying the efforts of the past few months.
So I kept adding more, doubling down on the position. My information sources also became increasingly one-sided. In the end, I wasn’t holding on because the project was more certain, but because I had already dug myself too deep.
Truly mature research must allow for conclusions to be overturned. Periodically ask yourself: If I saw it for the first time today, would I still buy it? And if I didn’t hold it, how would I evaluate these data?
Familiarity can only reduce unknowns—it can’t eliminate risk.
Remember: the most dangerous position isn’t necessarily a coin you don’t understand. It’s the one you’re so familiar with that you start explaining everything about it.
Why does the longer you research a coin, the easier it becomes to lose objective judgment?
When I first entered the market, I thought the deeper you research, the heavier your position should be—and that this was more reasonable.
I read the whitepaper, listened to team interviews, and got well acquainted with the community. Naturally, I felt that I understood it better than others.
Later, I realized that research increases cognition, but it also creates emotion.
I used to follow a project for a long time. I knew how, with every upgrade, partnership, and unlock, it could even help the team explain every延期 (delay).
When the price fell, I didn’t重新做判断. Instead, I instinctively looked for “good news” to prove that I wasn’t wrong. What others saw was the weakening trend, but what I saw was: “the market still doesn’t understand it.”
The more time I invested, the harder it became to admit that my research conclusions might be invalid. Selling wasn’t just about cutting losses—it also felt like denying the efforts of the past few months.
So I kept adding more, doubling down on the position. My information sources also became increasingly one-sided. In the end, I wasn’t holding on because the project was more certain, but because I had already dug myself too deep.
Truly mature research must allow for conclusions to be overturned. Periodically ask yourself: If I saw it for the first time today, would I still buy it? And if I didn’t hold it, how would I evaluate these data?
Familiarity can only reduce unknowns—it can’t eliminate risk.
Remember: the most dangerous position isn’t necessarily a coin you don’t understand. It’s the one you’re so familiar with that you start explaining everything about it.
When I first entered the market, I thought the deeper you research, the heavier your position should be—and that this was more reasonable.
I read the whitepaper, listened to team interviews, and got well acquainted with the community. Naturally, I felt that I understood it better than others.
Later, I realized that research increases cognition, but it also creates emotion.
I used to follow a project for a long time. I knew how, with every upgrade, partnership, and unlock, it could even help the team explain every延期 (delay).
When the price fell, I didn’t重新做判断. Instead, I instinctively looked for “good news” to prove that I wasn’t wrong. What others saw was the weakening trend, but what I saw was: “the market still doesn’t understand it.”
The more time I invested, the harder it became to admit that my research conclusions might be invalid. Selling wasn’t just about cutting losses—it also felt like denying the efforts of the past few months.
So I kept adding more, doubling down on the position. My information sources also became increasingly one-sided. In the end, I wasn’t holding on because the project was more certain, but because I had already dug myself too deep.
Truly mature research must allow for conclusions to be overturned. Periodically ask yourself: If I saw it for the first time today, would I still buy it? And if I didn’t hold it, how would I evaluate these data?
Familiarity can only reduce unknowns—it can’t eliminate risk.
Remember: the most dangerous position isn’t necessarily a coin you don’t understand. It’s the one you’re so familiar with that you start explaining everything about it.
1
1k
Log in to explore more content
Join global crypto users on Binance Square
⚡️ Get latest and useful information about crypto.
💬 Trusted by the world’s largest crypto exchange.
👍 Discover real insights from verified creators.
Email / Phone number
Trending Topics
CircleMints500MUSDCOnSolana
76,423 views
1,757 Discussing
#circlemints500musdconsolana
🚨 $500M USDC MINTED ON SOLANA! 💵🔥
Circle Treasury just minted 500M USDC on Solana, pushing total global supply to $75.2B! 📈✨
💡 Quick Reality Check:
🔹 Minting = Fresh Inventory Creation (Not instant buying power!🛒
🔹 Real Trigger = Capital Deployment into DeFi, Exchanges & Pools! 🌐🚀
🎯 Coins to Watch:
⚡ $SOL — Network activity is booming, and fresh liquidity continues to drive ecosystem growth!
💎 $RARE — A high-volatility altcoin that reacts fast to fresh market liquidity and sentiment!🪐
💥 Are you accumulating now or waiting for full capital deployment? Drop your thoughts below! 👇✨
#CircleMints500MUSDCOnSolana
#PolymarketBankFailureBetsDrawFDICConcern
#BlackRockBuildsTokenizedPortfoliosForOndo
#BitwiseFilesToListNEARETFOnNYSEArca
Hifza Rubab
·4 Likes
·4.3k views
PolymarketBankFailureBetsDrawFDICConcern
83,166 views
1,648 Discussing
BlackRockBuildsTokenizedPortfoliosForOndo
73,195 views
1,165 Discussing