
break2001
37 Posts

break2001
Report
Block User
Open Trade
High-Frequency Trader
1.2 Years
19 Following
36 Followers
18 Liked
Posts
Portfolio
·
--
$UAI There aren't many trapped holders left now, so we can push the price up.
$UAI There aren't many trapped holders left now, so we can push the price up.
94
·
--
$UAI I was up 300 U and didn't sell, while you all sold as soon as you broke even.
$UAI I was up 300 U and didn't sell, while you all sold as soon as you broke even.
2
1
334
·
--
$UAI
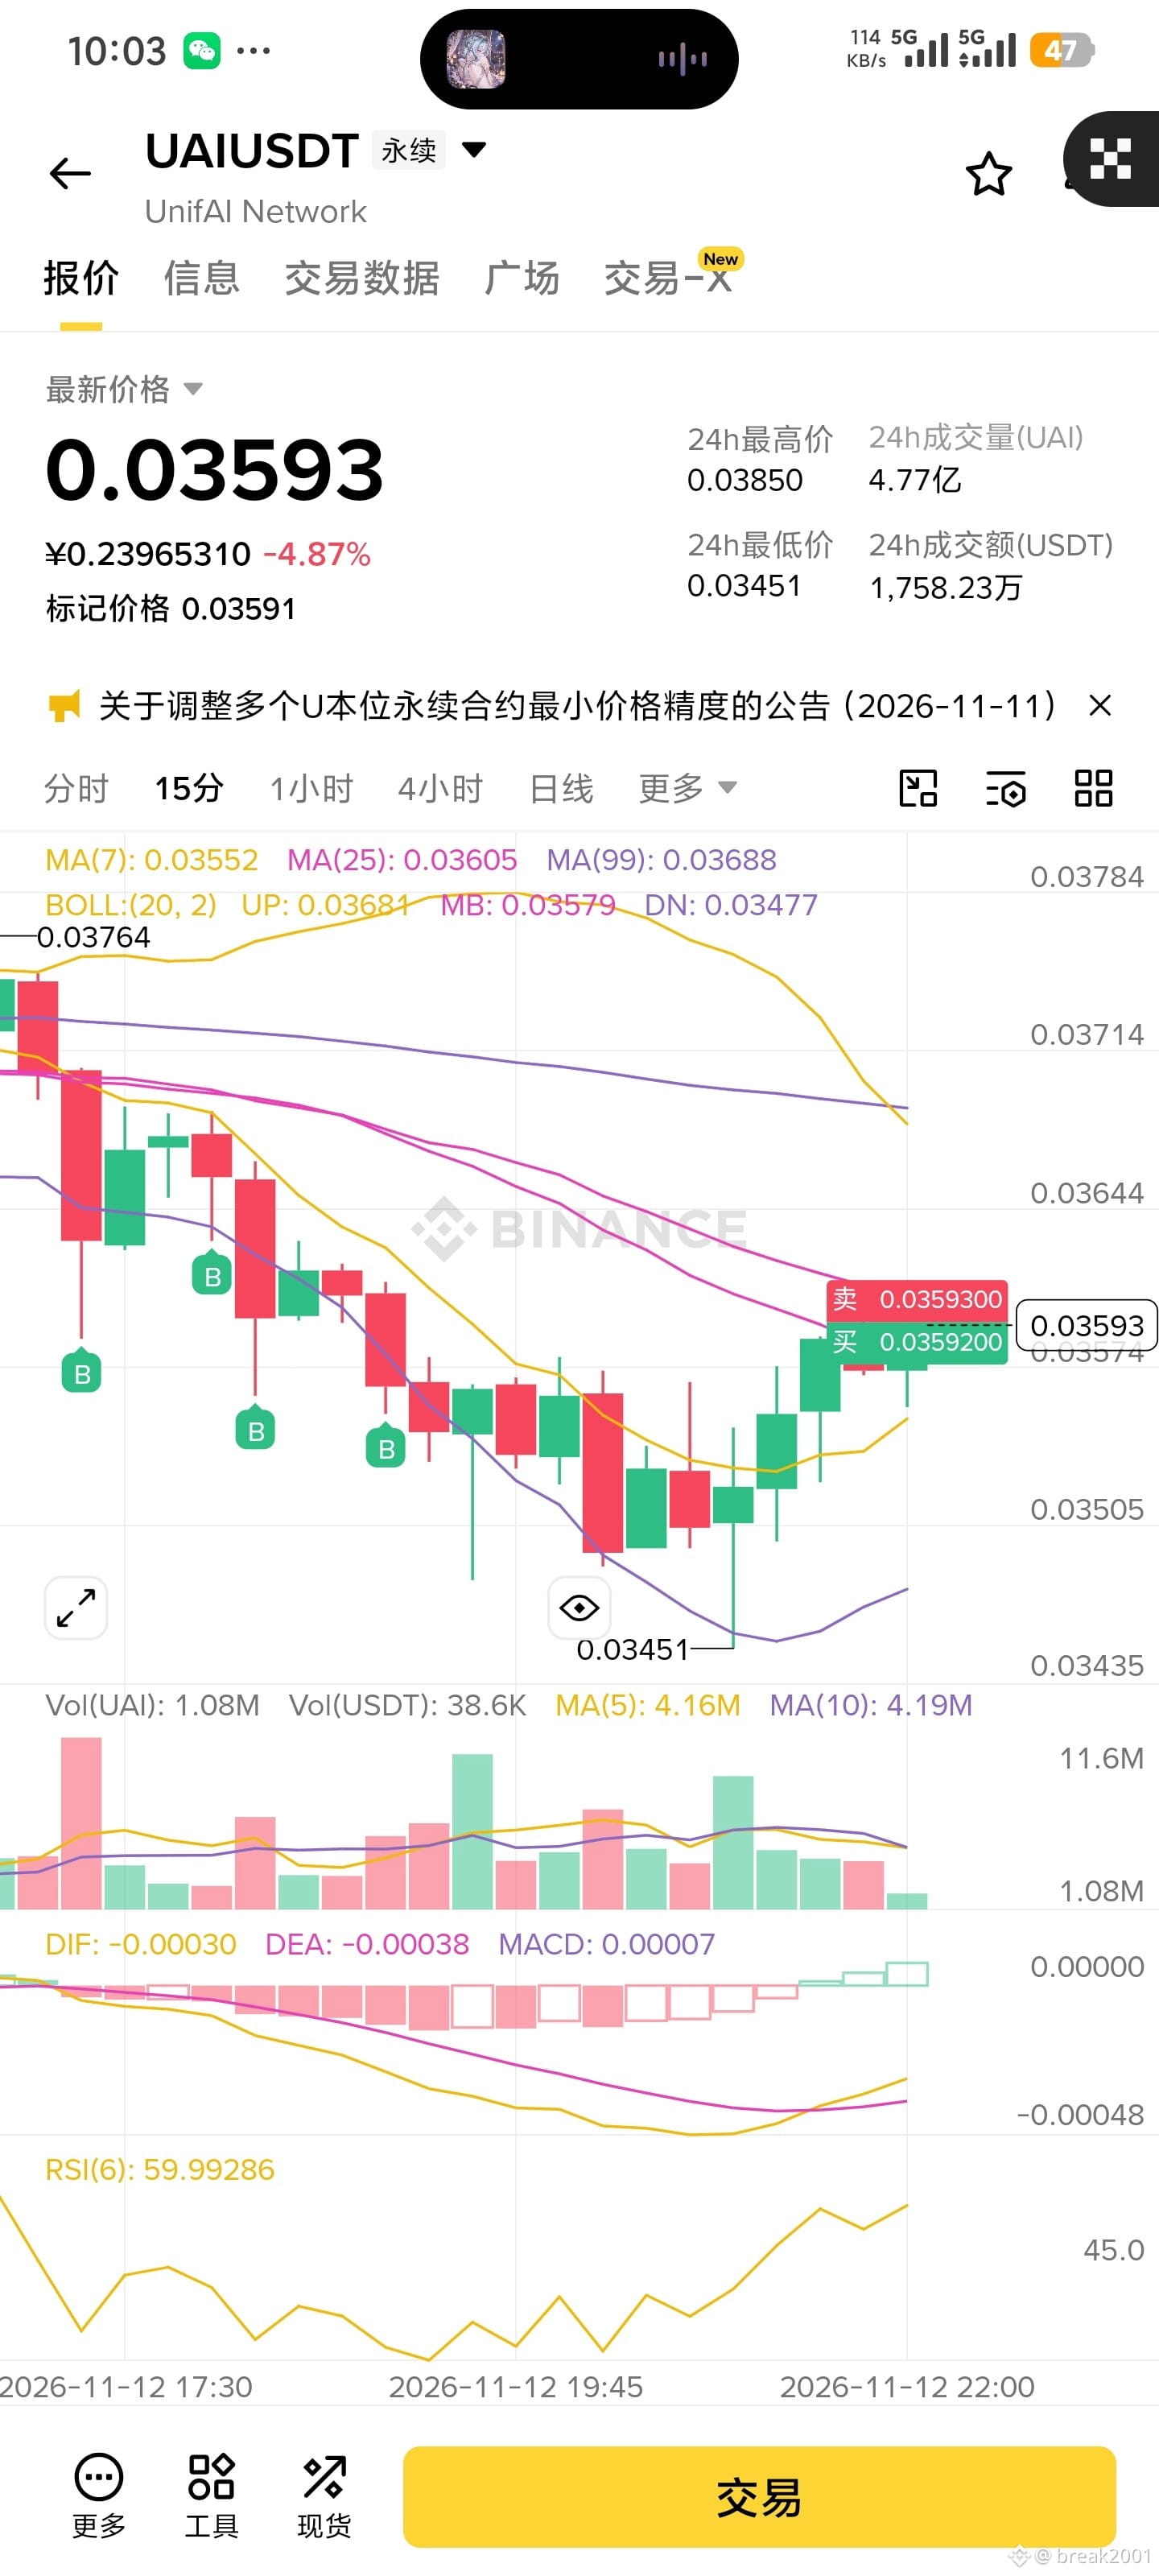
1. Basic Market Information
· Trading pair: UAI/USDT perpetual contract (UnifAI Network).
· Current price: 0.03593 USDT, down 4.87% over 24 hours.
· 24-hour high and low: High 0.03850, low 0.03451. The current price is in the lower-middle part of the 24-hour range.
· Special announcement: A news flash above the chart reads, “Announcement on Adjusting the Minimum Price Precision of Multiple USDT-Margined Perpetual Contracts.” Such adjustments can occasionally cause minor price jumps on the chart, but usually do not affect major technical trends.
2. Technical Chart Features (15-minute timeframe)
· Candlestick patterns and trend:
· Earlier, the price underwent a sharp decline, falling from around 0.0376 to a low of 0.03451.
· After touching the bottom, the price has now staged a V-shaped rebound.
· “B” markers: There are many green “B” letters on the chart. These are typically “buy signals” marked by trading software, or grid/DCA buy points set by users. Looking at the candlesticks in this rebound from the bottom, these “B” markers did indeed catch the short-term rebound gains.
· Moving average system (MA):
· MA(7) = 0.03552 (has turned upward, indicating a warming short-term trend).
· MA(25) = 0.03605 (the current price is trying to challenge this moving average).
· MA(99) = 0.03688 (the long-term moving average is still exerting downward pressure).
· Assessment: The price has successfully moved above MA7 and is currently testing resistance at MA25.
· Bollinger Bands (BOLL):
· The price previously fell below the lower Bollinger Band (DN: 0.03477), then quickly recovered back inside the band. This is a classic “false breakdown,” also commonly known as a “bear trap.” The price is now approaching the middle band (MB: 0.03579) and has already moved above it.
· Trading volume (Vol):
· A clear spike in volume appeared near the bottom at 0.03451. The increase in volume means that buyers stepped in as panic selling emerged.
· During the rebound, trading volume has been relatively moderate, which is a normal volume-price pattern for an “oversold rebound.”
· MACD indicator (key signal):
· DIF crossed above DEA below the zero line, forming a golden cross.
· The red MACD histogram bars turned green (bullish).
· This is a very typical short-term bullish reversal signal, indicating that downward momentum has weakened and rebound momentum is beginning.
· RSI(6) indicator:
· The value is 59.99
$UAI
1. Basic Market Information
· Trading pair: UAI/USDT perpetual contract (UnifAI Network).
· Current price: 0.03593 USDT, down 4.87% over 24 hours.
· 24-hour high and low: High 0.03850, low 0.03451. The current price is in the lower-middle part of the 24-hour range.
· Special announcement: A news flash above the chart reads, “Announcement on Adjusting the Minimum Price Precision of Multiple USDT-Margined Perpetual Contracts.” Such adjustments can occasionally cause minor price jumps on the chart, but usually do not affect major technical trends.
2. Technical Chart Features (15-minute timeframe)
· Candlestick patterns and trend:
· Earlier, the price underwent a sharp decline, falling from around 0.0376 to a low of 0.03451.
· After touching the bottom, the price has now staged a V-shaped rebound.
· “B” markers: There are many green “B” letters on the chart. These are typically “buy signals” marked by trading software, or grid/DCA buy points set by users. Looking at the candlesticks in this rebound from the bottom, these “B” markers did indeed catch the short-term rebound gains.
· Moving average system (MA):
· MA(7) = 0.03552 (has turned upward, indicating a warming short-term trend).
· MA(25) = 0.03605 (the current price is trying to challenge this moving average).
· MA(99) = 0.03688 (the long-term moving average is still exerting downward pressure).
· Assessment: The price has successfully moved above MA7 and is currently testing resistance at MA25.
· Bollinger Bands (BOLL):
· The price previously fell below the lower Bollinger Band (DN: 0.03477), then quickly recovered back inside the band. This is a classic “false breakdown,” also commonly known as a “bear trap.” The price is now approaching the middle band (MB: 0.03579) and has already moved above it.
· Trading volume (Vol):
· A clear spike in volume appeared near the bottom at 0.03451. The increase in volume means that buyers stepped in as panic selling emerged.
· During the rebound, trading volume has been relatively moderate, which is a normal volume-price pattern for an “oversold rebound.”
· MACD indicator (key signal):
· DIF crossed above DEA below the zero line, forming a golden cross.
· The red MACD histogram bars turned green (bullish).
· This is a very typical short-term bullish reversal signal, indicating that downward momentum has weakened and rebound momentum is beginning.
· RSI(6) indicator:
· The value is 59.99
1. Basic Market Information
· Trading pair: UAI/USDT perpetual contract (UnifAI Network).
· Current price: 0.03593 USDT, down 4.87% over 24 hours.
· 24-hour high and low: High 0.03850, low 0.03451. The current price is in the lower-middle part of the 24-hour range.
· Special announcement: A news flash above the chart reads, “Announcement on Adjusting the Minimum Price Precision of Multiple USDT-Margined Perpetual Contracts.” Such adjustments can occasionally cause minor price jumps on the chart, but usually do not affect major technical trends.
2. Technical Chart Features (15-minute timeframe)
· Candlestick patterns and trend:
· Earlier, the price underwent a sharp decline, falling from around 0.0376 to a low of 0.03451.
· After touching the bottom, the price has now staged a V-shaped rebound.
· “B” markers: There are many green “B” letters on the chart. These are typically “buy signals” marked by trading software, or grid/DCA buy points set by users. Looking at the candlesticks in this rebound from the bottom, these “B” markers did indeed catch the short-term rebound gains.
· Moving average system (MA):
· MA(7) = 0.03552 (has turned upward, indicating a warming short-term trend).
· MA(25) = 0.03605 (the current price is trying to challenge this moving average).
· MA(99) = 0.03688 (the long-term moving average is still exerting downward pressure).
· Assessment: The price has successfully moved above MA7 and is currently testing resistance at MA25.
· Bollinger Bands (BOLL):
· The price previously fell below the lower Bollinger Band (DN: 0.03477), then quickly recovered back inside the band. This is a classic “false breakdown,” also commonly known as a “bear trap.” The price is now approaching the middle band (MB: 0.03579) and has already moved above it.
· Trading volume (Vol):
· A clear spike in volume appeared near the bottom at 0.03451. The increase in volume means that buyers stepped in as panic selling emerged.
· During the rebound, trading volume has been relatively moderate, which is a normal volume-price pattern for an “oversold rebound.”
· MACD indicator (key signal):
· DIF crossed above DEA below the zero line, forming a golden cross.
· The red MACD histogram bars turned green (bullish).
· This is a very typical short-term bullish reversal signal, indicating that downward momentum has weakened and rebound momentum is beginning.
· RSI(6) indicator:
· The value is 59.99
413
·
--
$DOGE
1. Market Fundamentals and News
· Current price: 0.06555 USDT, down 4.01% over 24 hours.
· 24-hour high and low: High of 0.06955, low of 0.06452. The current price is very close to the 24-hour low.
· Notable news: A news flash above the chart reads: “DogeOS says mainnet launch is imminent, and it will build a DeFi application layer for Dogecoin.” This is a positive fundamental outlook. However, the price has not risen in response to this news, suggesting that overall market sentiment is weak or that investors are selling into the positive news.
· Timestamp anomaly: The X-axis shows the dates 2026-11-09 to 2026-11-11. This is most likely due to an incorrect phone system time setting or a test environment, and does not affect the assessment of the current technical pattern.
2. Technical Indicator Analysis (1-hour timeframe)
· Moving averages (MA): Showing a standard bearish alignment.
· MA(7) = 0.06664, MA(25) = 0.06758, MA(99) = 0.06886.
· The short-term moving average (7) is below the medium-term (25) and long-term (99) averages, and the price is currently firmly capped below MA7. This indicates very strong bearish pressure and a one-way downtrend.
$DOGE
1. Market Fundamentals and News
· Current price: 0.06555 USDT, down 4.01% over 24 hours.
· 24-hour high and low: High of 0.06955, low of 0.06452. The current price is very close to the 24-hour low.
· Notable news: A news flash above the chart reads: “DogeOS says mainnet launch is imminent, and it will build a DeFi application layer for Dogecoin.” This is a positive fundamental outlook. However, the price has not risen in response to this news, suggesting that overall market sentiment is weak or that investors are selling into the positive news.
· Timestamp anomaly: The X-axis shows the dates 2026-11-09 to 2026-11-11. This is most likely due to an incorrect phone system time setting or a test environment, and does not affect the assessment of the current technical pattern.
2. Technical Indicator Analysis (1-hour timeframe)
· Moving averages (MA): Showing a standard bearish alignment.
· MA(7) = 0.06664, MA(25) = 0.06758, MA(99) = 0.06886.
· The short-term moving average (7) is below the medium-term (25) and long-term (99) averages, and the price is currently firmly capped below MA7. This indicates very strong bearish pressure and a one-way downtrend.
1. Market Fundamentals and News
· Current price: 0.06555 USDT, down 4.01% over 24 hours.
· 24-hour high and low: High of 0.06955, low of 0.06452. The current price is very close to the 24-hour low.
· Notable news: A news flash above the chart reads: “DogeOS says mainnet launch is imminent, and it will build a DeFi application layer for Dogecoin.” This is a positive fundamental outlook. However, the price has not risen in response to this news, suggesting that overall market sentiment is weak or that investors are selling into the positive news.
· Timestamp anomaly: The X-axis shows the dates 2026-11-09 to 2026-11-11. This is most likely due to an incorrect phone system time setting or a test environment, and does not affect the assessment of the current technical pattern.
2. Technical Indicator Analysis (1-hour timeframe)
· Moving averages (MA): Showing a standard bearish alignment.
· MA(7) = 0.06664, MA(25) = 0.06758, MA(99) = 0.06886.
· The short-term moving average (7) is below the medium-term (25) and long-term (99) averages, and the price is currently firmly capped below MA7. This indicates very strong bearish pressure and a one-way downtrend.
152
·
--
$AGT 1. 1. Be cautious about buying the dip or chasing shorts: AGT is up as much as 43% intraday, making it extremely volatile. Although the short-term moving averages have formed a death cross and bears have a slight edge, sudden wicks in either direction (triggering long or short liquidations) are possible at any time. Don’t go all-in on a dip just because the price has “fallen so much.”
2. Watch key levels:
· Support: 0.0654 (lower Bollinger Band) and 0.060 (a large number of buy orders on the depth chart). If the price breaks below 0.060, it may continue searching for a bottom.
· Resistance: 0.068 (MA7) and 0.072 (MA25 and a large sell wall above).
$AGT 1. 1. Be cautious about buying the dip or chasing shorts: AGT is up as much as 43% intraday, making it extremely volatile. Although the short-term moving averages have formed a death cross and bears have a slight edge, sudden wicks in either direction (triggering long or short liquidations) are possible at any time. Don’t go all-in on a dip just because the price has “fallen so much.”
2. Watch key levels:
· Support: 0.0654 (lower Bollinger Band) and 0.060 (a large number of buy orders on the depth chart). If the price breaks below 0.060, it may continue searching for a bottom.
· Resistance: 0.068 (MA7) and 0.072 (MA25 and a large sell wall above).
2. Watch key levels:
· Support: 0.0654 (lower Bollinger Band) and 0.060 (a large number of buy orders on the depth chart). If the price breaks below 0.060, it may continue searching for a bottom.
· Resistance: 0.068 (MA7) and 0.072 (MA25 and a large sell wall above).
202
·
--
$UAI , go to Alpha and buy to push the price up.
$UAI , go to Alpha and buy to push the price up.
1
158
·
--
$UAI If you're looking to buy the dip, once it breaks below that level, wherever you buy will be the top. You might as well trigger a short squeeze.
$UAI If you're looking to buy the dip, once it breaks below that level, wherever you buy will be the top. You might as well trigger a short squeeze.
463
·
--
$UAI has no liquidation price. Just push ahead—we’re holding for the long term anyway. Let’s squeeze the shorts!
$UAI has no liquidation price. Just push ahead—we’re holding for the long term anyway. Let’s squeeze the shorts!
335
·
--
$UAI If you want to push the price up, use the opposing side's price or the market price.
Using a same-direction price is defensive, and you can't even hold the line.
You might as well attack and force a short squeeze.
$UAI If you want to push the price up, use the opposing side's price or the market price.
Using a same-direction price is defensive, and you can't even hold the line.
You might as well attack and force a short squeeze.
Using a same-direction price is defensive, and you can't even hold the line.
You might as well attack and force a short squeeze.
2
914
·
--
$UAI Don't try to buy the dip; the more you do, the further it falls.
$UAI Don't try to buy the dip; the more you do, the further it falls.
77
·
--
I just completed a new trade! Copy my portfolio with one click 👇
I just completed a new trade! Copy my portfolio with one click 👇
break2001
Close Position
AKEUSDT
PNL(USDT)
+4.26
Close Price
0.00570727
·
--
I just completed a new trade! Copy my portfolio with one click 👇
I just completed a new trade! Copy my portfolio with one click 👇
break2001
Close Position
AKEUSDT
PNL(USDT)
+3.78
Close Price
0.005707
1
·
--
I just completed a new trade! Copy my portfolio with one click 👇
I just completed a new trade! Copy my portfolio with one click 👇
break2001
Close Position
AKEUSDT
PNL(USDT)
+1.56
Close Price
0.005981
·
--
I just completed a new trade! Copy my portfolio with one click 👇
I just completed a new trade! Copy my portfolio with one click 👇
break2001
Close Position
AKEUSDT
PNL(USDT)
+0.03
Close Price
0.005981
3
·
--
I just completed a new trade! Copy my portfolio with one click 👇
I just completed a new trade! Copy my portfolio with one click 👇
break2001
Close Position
YBUSDT
PNL(USDT)
+1.91
Close Price
0.05053599
·
--
I just completed a new trade! Copy my portfolio with one click 👇
I just completed a new trade! Copy my portfolio with one click 👇
break2001
Close Position
YBUSDT
PNL(USDT)
+9.45
Close Price
0.05050397

Log in to explore more content
Join global crypto users on Binance Square
⚡️ Get latest and useful information about crypto.
💬 Trusted by the world’s largest crypto exchange.
👍 Discover real insights from verified creators.
Email / Phone number
Trending Topics
USPPIMissMayEaseBTCPressure
81 views
41 Discussing
US PPI Rises 6.5% a Year in October, Slightly Below 6.6% Forecast
Binance News
·8 Likes
·2.6k views
WhatWillDriveCryptoandStocks’NextRebound?
76,201 views
1,074 Discussing
BitcoinBreaksBelow200WeekMovingAverage
4,333 views
147 Discussing