
Trading Different 1
113 Posts

Trading Different 1
Report
Block User
Enhance your investments and trading strategy with our indicators. Optimize your Entry Points. Extend your Take Profits. Minimize your Stop Loss.
0 Following
0 Followers
0 Liked
Posts
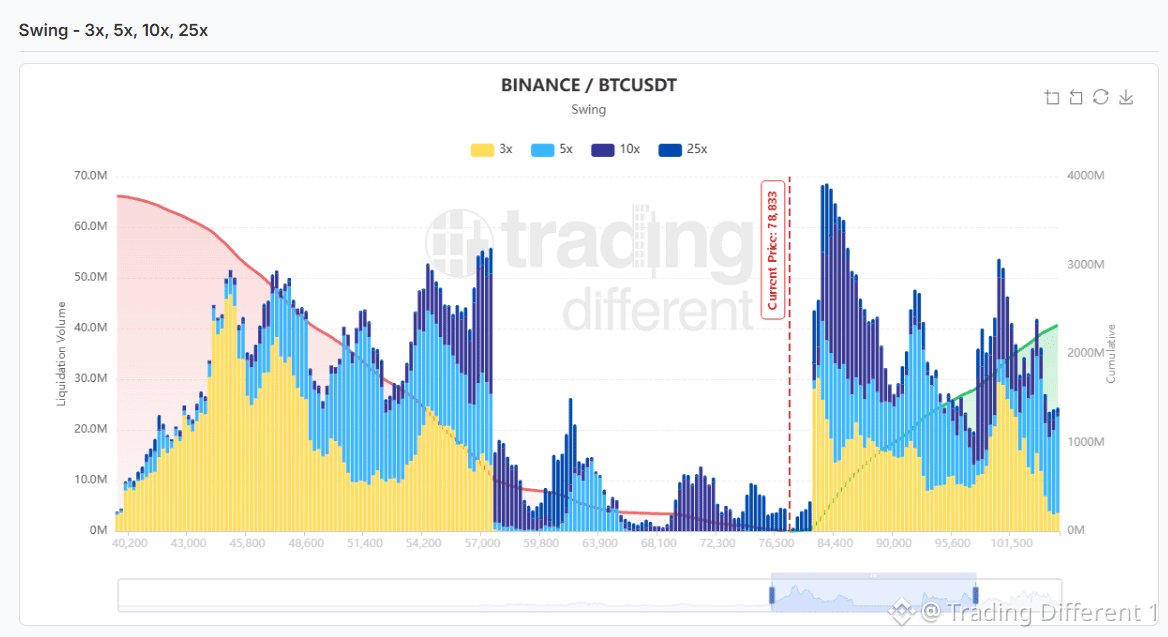
#BTC maintains a strong imbalance on the Swing map. With the price near 78,833, the concentration of short liquidations grows rapidly from 82K–84K, with the most intense block around 84K–87K. Higher up, new accumulations appear toward 91K–94K and 99K–103K. Below, the largest long load continues much farther away, mainly between 44K and 58K. Due to proximity, the main immediate risk is to the upside: a move toward 84K would begin to pressure one of the largest short concentrations on the map.
#BTC maintains a strong imbalance on the Swing map. With the price near 78,833, the concentration of short liquidations grows rapidly from 82K–84K, with the most intense block around 84K–87K. Higher up, new accumulations appear toward 91K–94K and 99K–103K. Below, the largest long load continues much farther away, mainly between 44K and 58K. Due to proximity, the main immediate risk is to the upside: a move toward 84K would begin to pressure one of the largest short concentrations on the map.
46
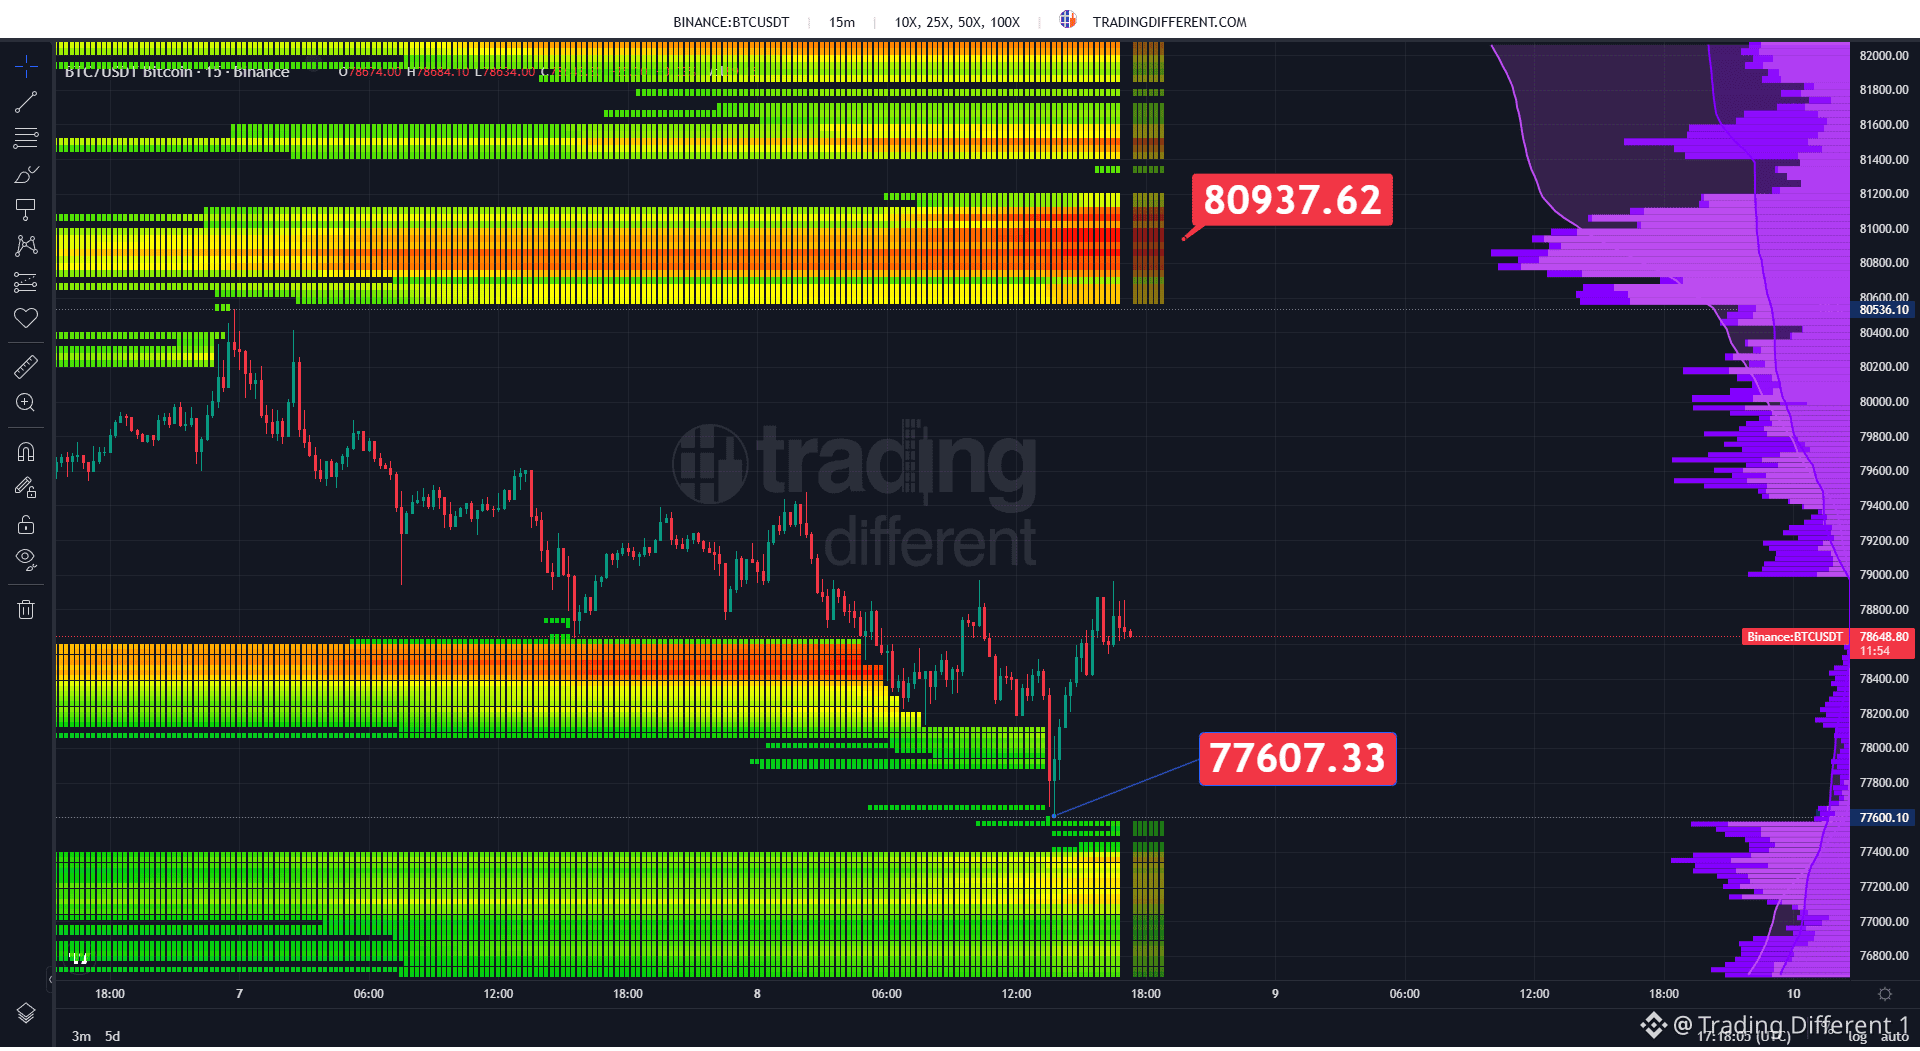
#BTC reacts after sweeping the long zone at 77,607. Price dropped to that block and quickly bounced up toward 78,650, leaving behind some of the closest liquidations. Now the 15m Heatmap maintains a significant concentration of shorts above, with the main block around 80,000–81,000 and a highlighted reference at 80,938. If the recovery continues, that band becomes the main area of immediate exposure.
#BTC reacts after sweeping the long zone at 77,607. Price dropped to that block and quickly bounced up toward 78,650, leaving behind some of the closest liquidations. Now the 15m Heatmap maintains a significant concentration of shorts above, with the main block around 80,000–81,000 and a highlighted reference at 80,938. If the recovery continues, that band becomes the main area of immediate exposure.
48
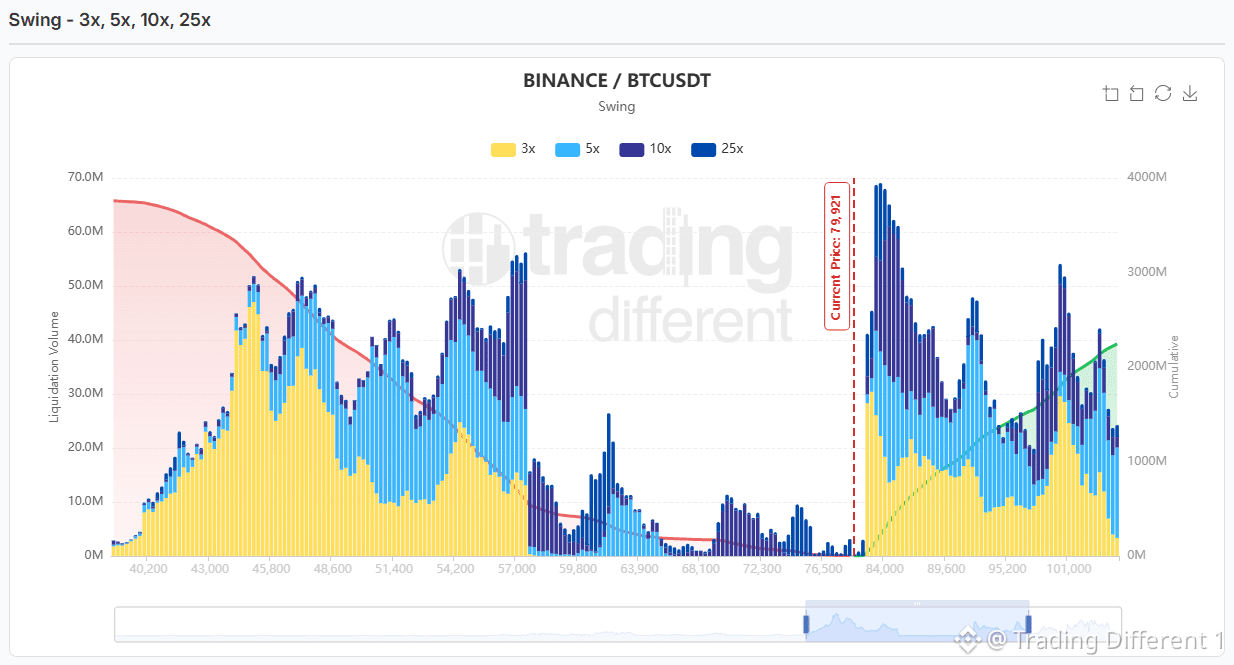
#BTC shows a significant imbalance on the Swing map. With the price near 79,921, short liquidations are rising sharply from 83K–84K, with the most intense cluster around 84K–86K. Higher up, new relevant concentrations appear between 90K–95K and again near 100K–103K. Below, the largest accumulation of longs remains much farther away, mainly between 44K and 58K. By proximity, the first major exposed block is clearly above: an extension toward 84K would put an important concentration of leveraged shorts under pressure.
#BTC shows a significant imbalance on the Swing map. With the price near 79,921, short liquidations are rising sharply from 83K–84K, with the most intense cluster around 84K–86K. Higher up, new relevant concentrations appear between 90K–95K and again near 100K–103K. Below, the largest accumulation of longs remains much farther away, mainly between 44K and 58K. By proximity, the first major exposed block is clearly above: an extension toward 84K would put an important concentration of leveraged shorts under pressure.
149
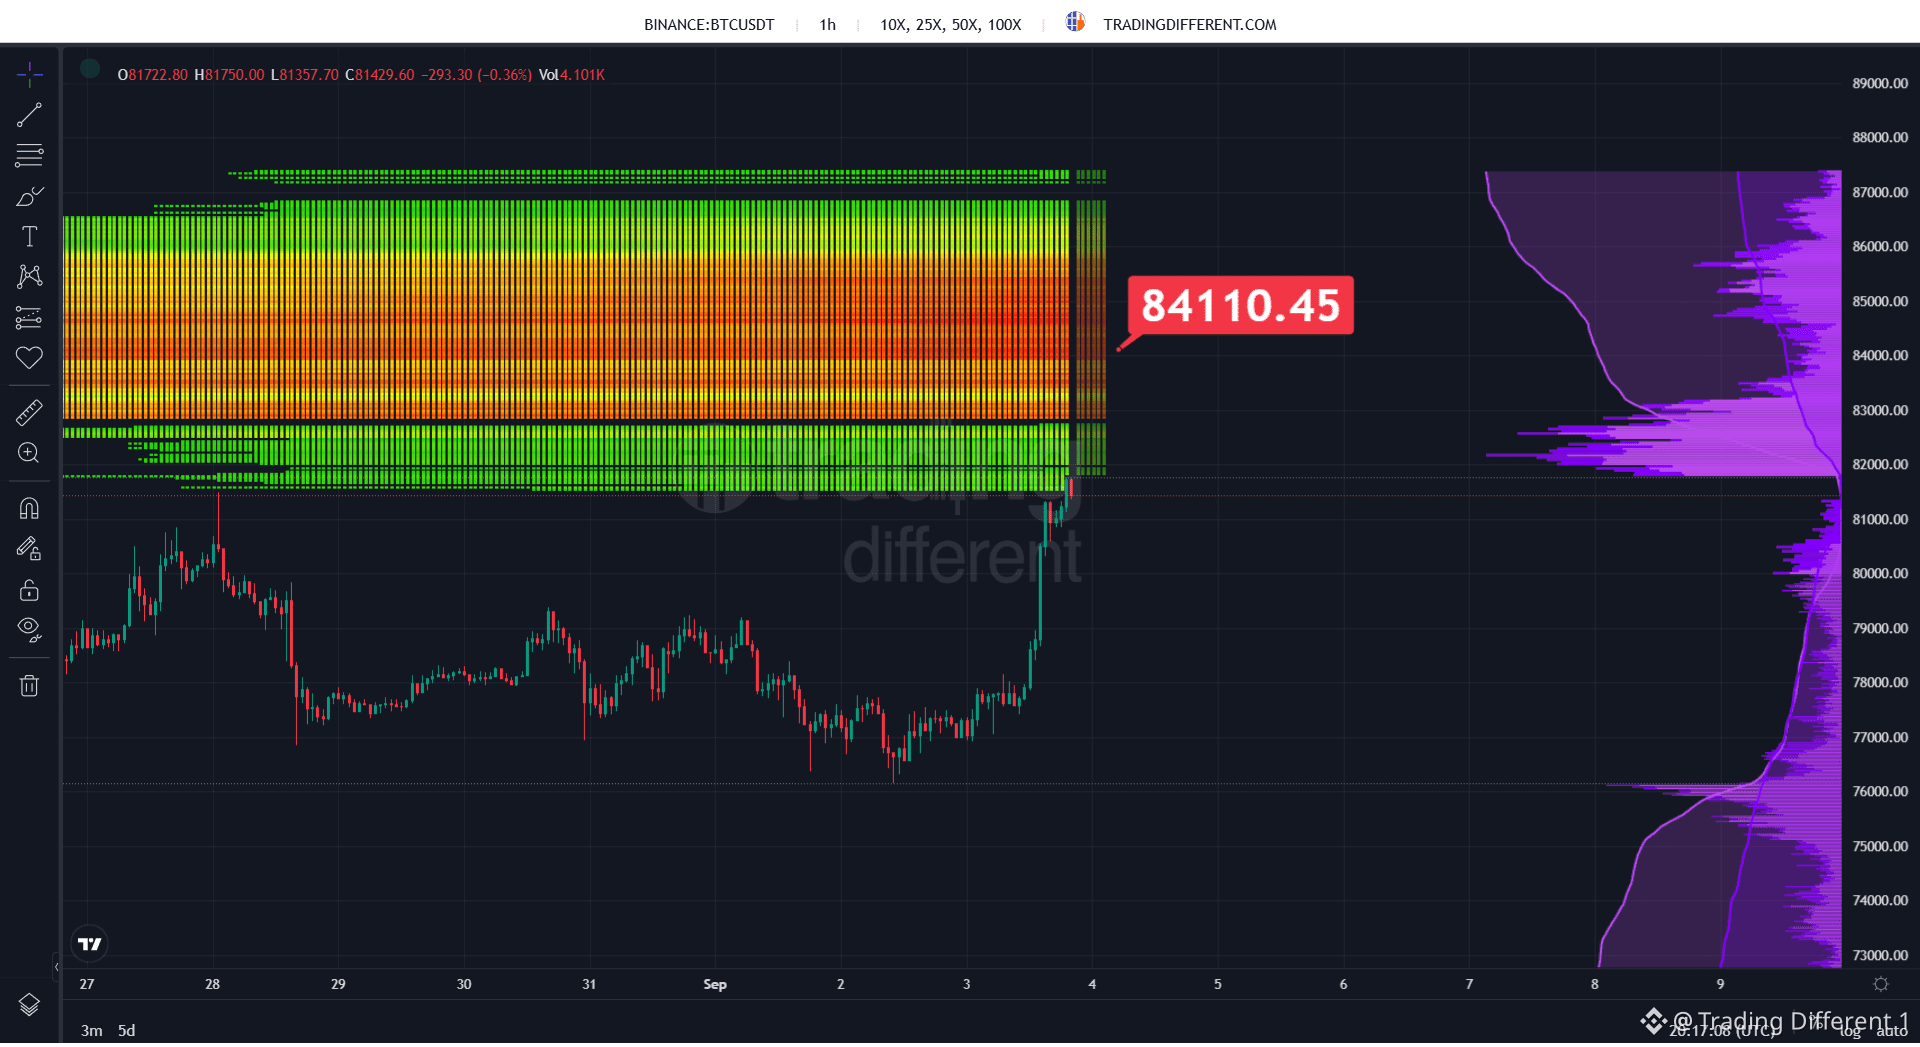
#BTC accelerated from the 77K zone and is already entering an important concentration of short liquidations. With price near 81.430, the 1h Heatmap shows exposure increasing from 82K and intensifying toward 84.110, with a broad block extending approximately to 86K. If the advance continues, that range concentrates the main liquidation risk in the short term.
#BTC accelerated from the 77K zone and is already entering an important concentration of short liquidations. With price near 81.430, the 1h Heatmap shows exposure increasing from 82K and intensifying toward 84.110, with a broad block extending approximately to 86K. If the advance continues, that range concentrates the main liquidation risk in the short term.
75
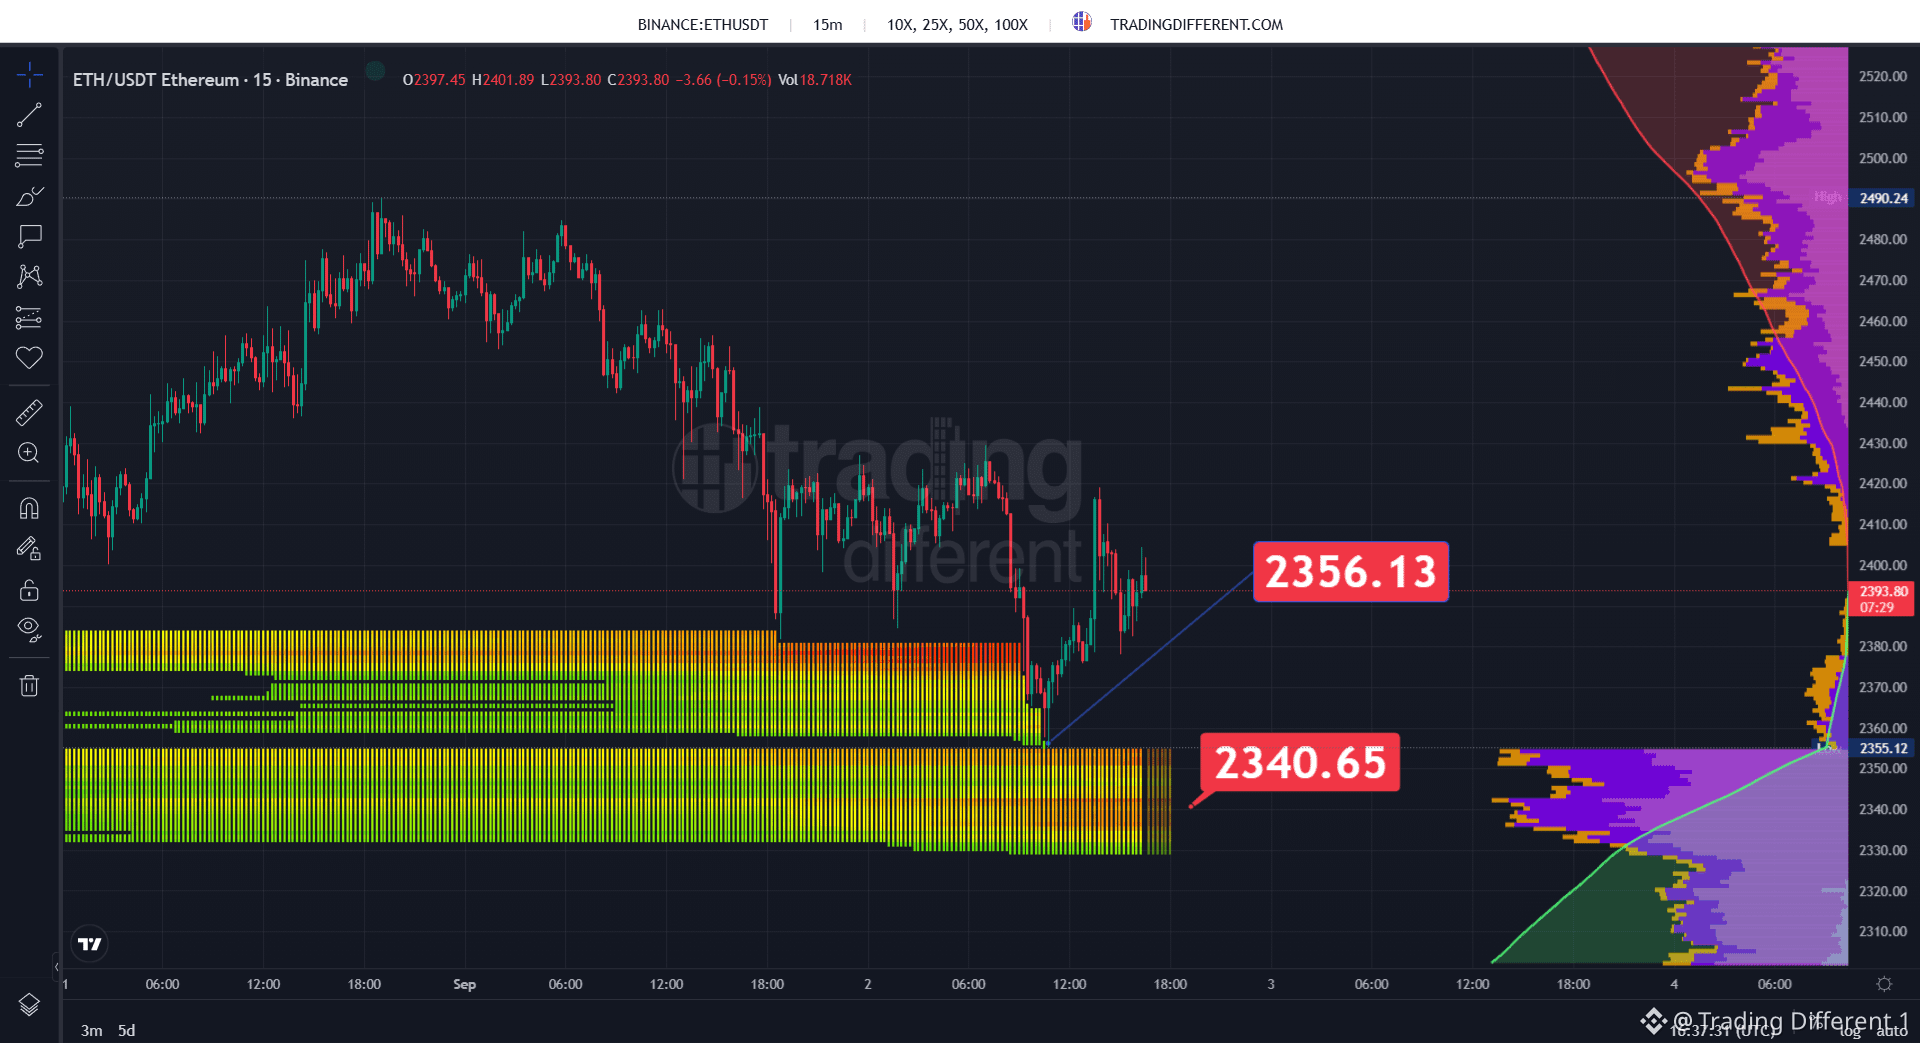
#ETH maintains pressure on an important long liquidation zone. With the price near 2,394, the move has already reached the 2,356 block and reacted from that area. Lower down, there is a second relevant concentration around 2,340, still exposed if bearish pressure returns. In the short term, 2,356–2,340 concentrates the main risk of liquidations shown by the Heatmap.
#ETH maintains pressure on an important long liquidation zone. With the price near 2,394, the move has already reached the 2,356 block and reacted from that area. Lower down, there is a second relevant concentration around 2,340, still exposed if bearish pressure returns. In the short term, 2,356–2,340 concentrates the main risk of liquidations shown by the Heatmap.
72
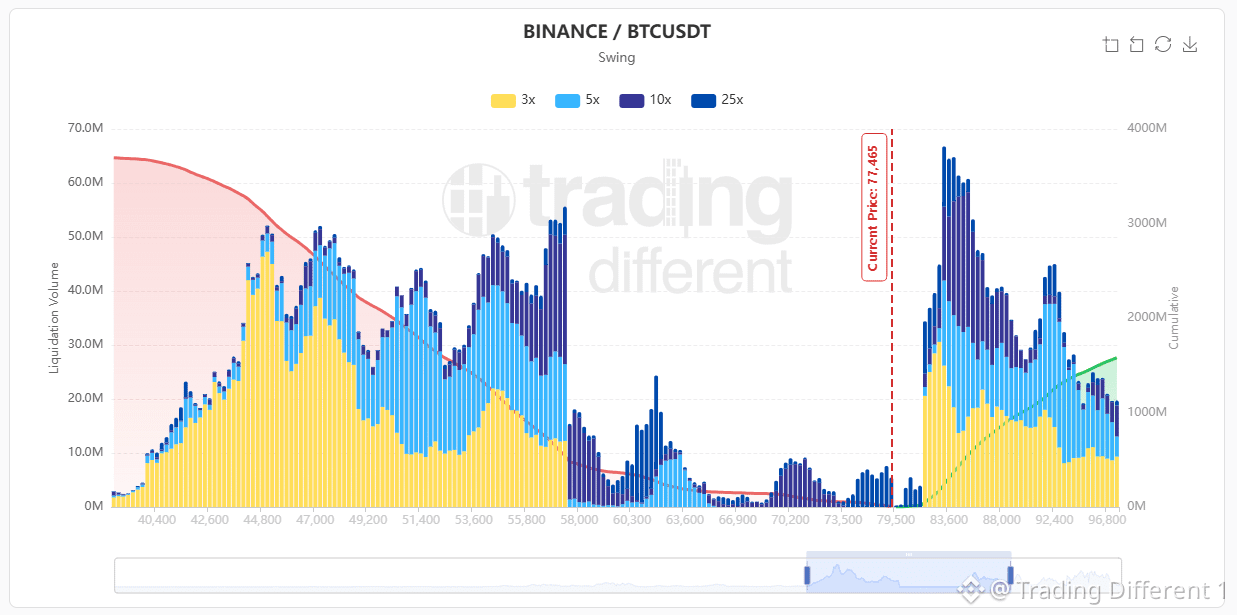
#BTC shows a significant imbalance on the Swing map. With the price near 77,465, short liquidations increase strongly from 82K, with the highest concentration between 83K–86K and new blocks moving toward 88K–93K. Below, long liquidations form a much more extensive structure between 44K–58K, though they are considerably farther from the current price. In cumulative terms, the heaviest load remains underneath, but due to proximity the first major liquidation block is above, from 82K–83K.
#BTC shows a significant imbalance on the Swing map. With the price near 77,465, short liquidations increase strongly from 82K, with the highest concentration between 83K–86K and new blocks moving toward 88K–93K. Below, long liquidations form a much more extensive structure between 44K–58K, though they are considerably farther from the current price. In cumulative terms, the heaviest load remains underneath, but due to proximity the first major liquidation block is above, from 82K–83K.
74
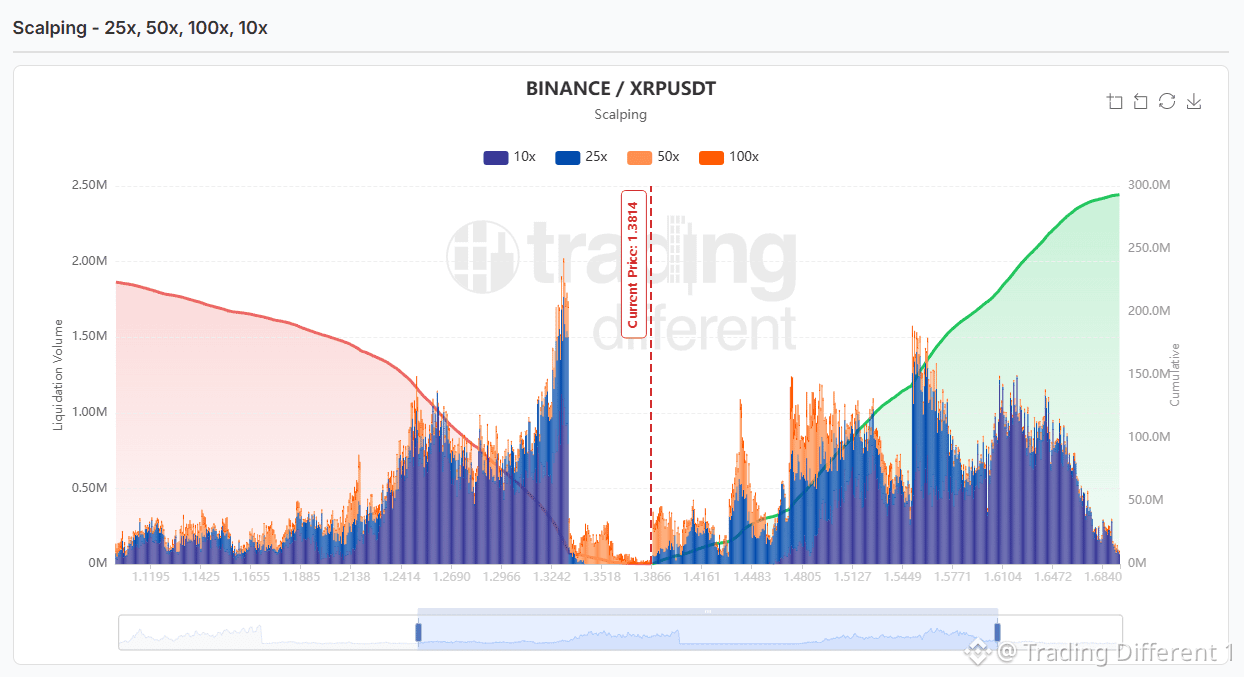
#XRP displays a Scalping map that is fairly split, even though there is a higher total accumulation of liquidations above the current price, around 1.3814. Below, the most relevant block of leveraged longs is concentrated approximately between 1.24 and 1.33, with a particularly strong peak near 1.32–1.33. On the upside, short liquidations start gaining density from 1.44–1.48, but the concentration becomes much more significant between 1.50 and 1.65, with several blocks loaded at 25x, 50x, and 100x. The map leaves meaningful liquidity in both directions, but in accumulated terms, the biggest fuel remains on the upside.
#XRP displays a Scalping map that is fairly split, even though there is a higher total accumulation of liquidations above the current price, around 1.3814. Below, the most relevant block of leveraged longs is concentrated approximately between 1.24 and 1.33, with a particularly strong peak near 1.32–1.33. On the upside, short liquidations start gaining density from 1.44–1.48, but the concentration becomes much more significant between 1.50 and 1.65, with several blocks loaded at 25x, 50x, and 100x. The map leaves meaningful liquidity in both directions, but in accumulated terms, the biggest fuel remains on the upside.
71
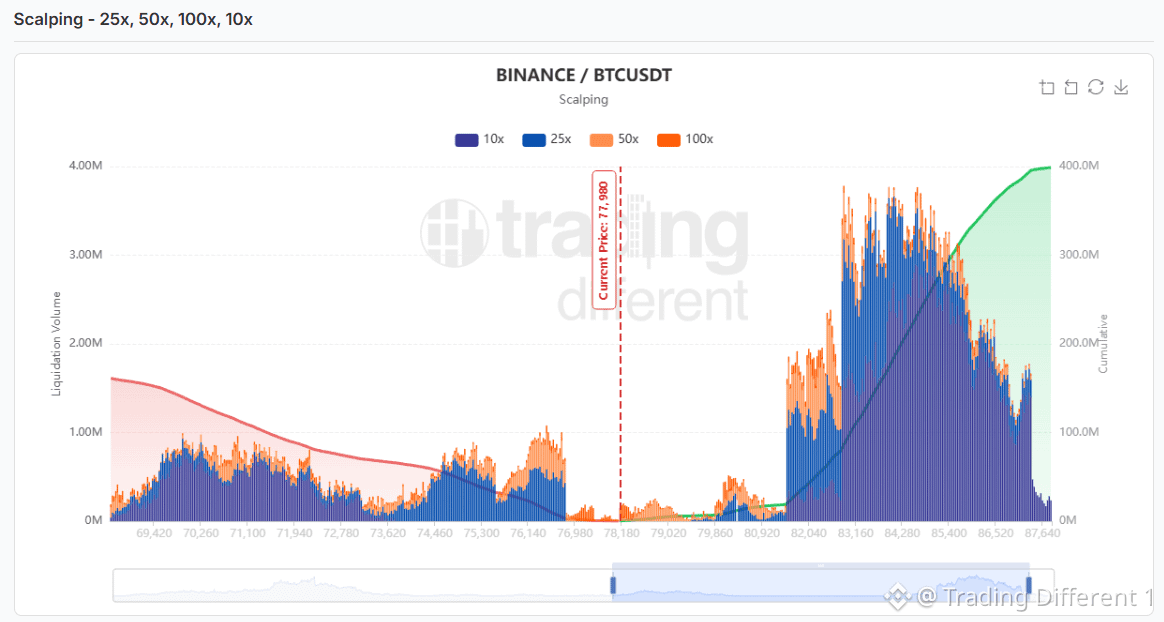
#BTC shows a very clear imbalance on the Scalping liquidation map.
With the price near 77,980, the highest concentration of leveraged positions is above: from approximately 82K it starts to grow strongly, with the main block between 83K and 86K. If the price moves into that area, the shorts would progressively be exposed to liquidations.
Below, there are also vulnerable longs, but the buildup is considerably smaller.
The map doesn’t indicate direction; it shows where the fuel is concentrated. And right now, the heaviest load is on top.
#BTC shows a very clear imbalance on the Scalping liquidation map.
With the price near 77,980, the highest concentration of leveraged positions is above: from approximately 82K it starts to grow strongly, with the main block between 83K and 86K. If the price moves into that area, the shorts would progressively be exposed to liquidations.
Below, there are also vulnerable longs, but the buildup is considerably smaller.
The map doesn’t indicate direction; it shows where the fuel is concentrated. And right now, the heaviest load is on top.
With the price near 77,980, the highest concentration of leveraged positions is above: from approximately 82K it starts to grow strongly, with the main block between 83K and 86K. If the price moves into that area, the shorts would progressively be exposed to liquidations.
Below, there are also vulnerable longs, but the buildup is considerably smaller.
The map doesn’t indicate direction; it shows where the fuel is concentrated. And right now, the heaviest load is on top.
75
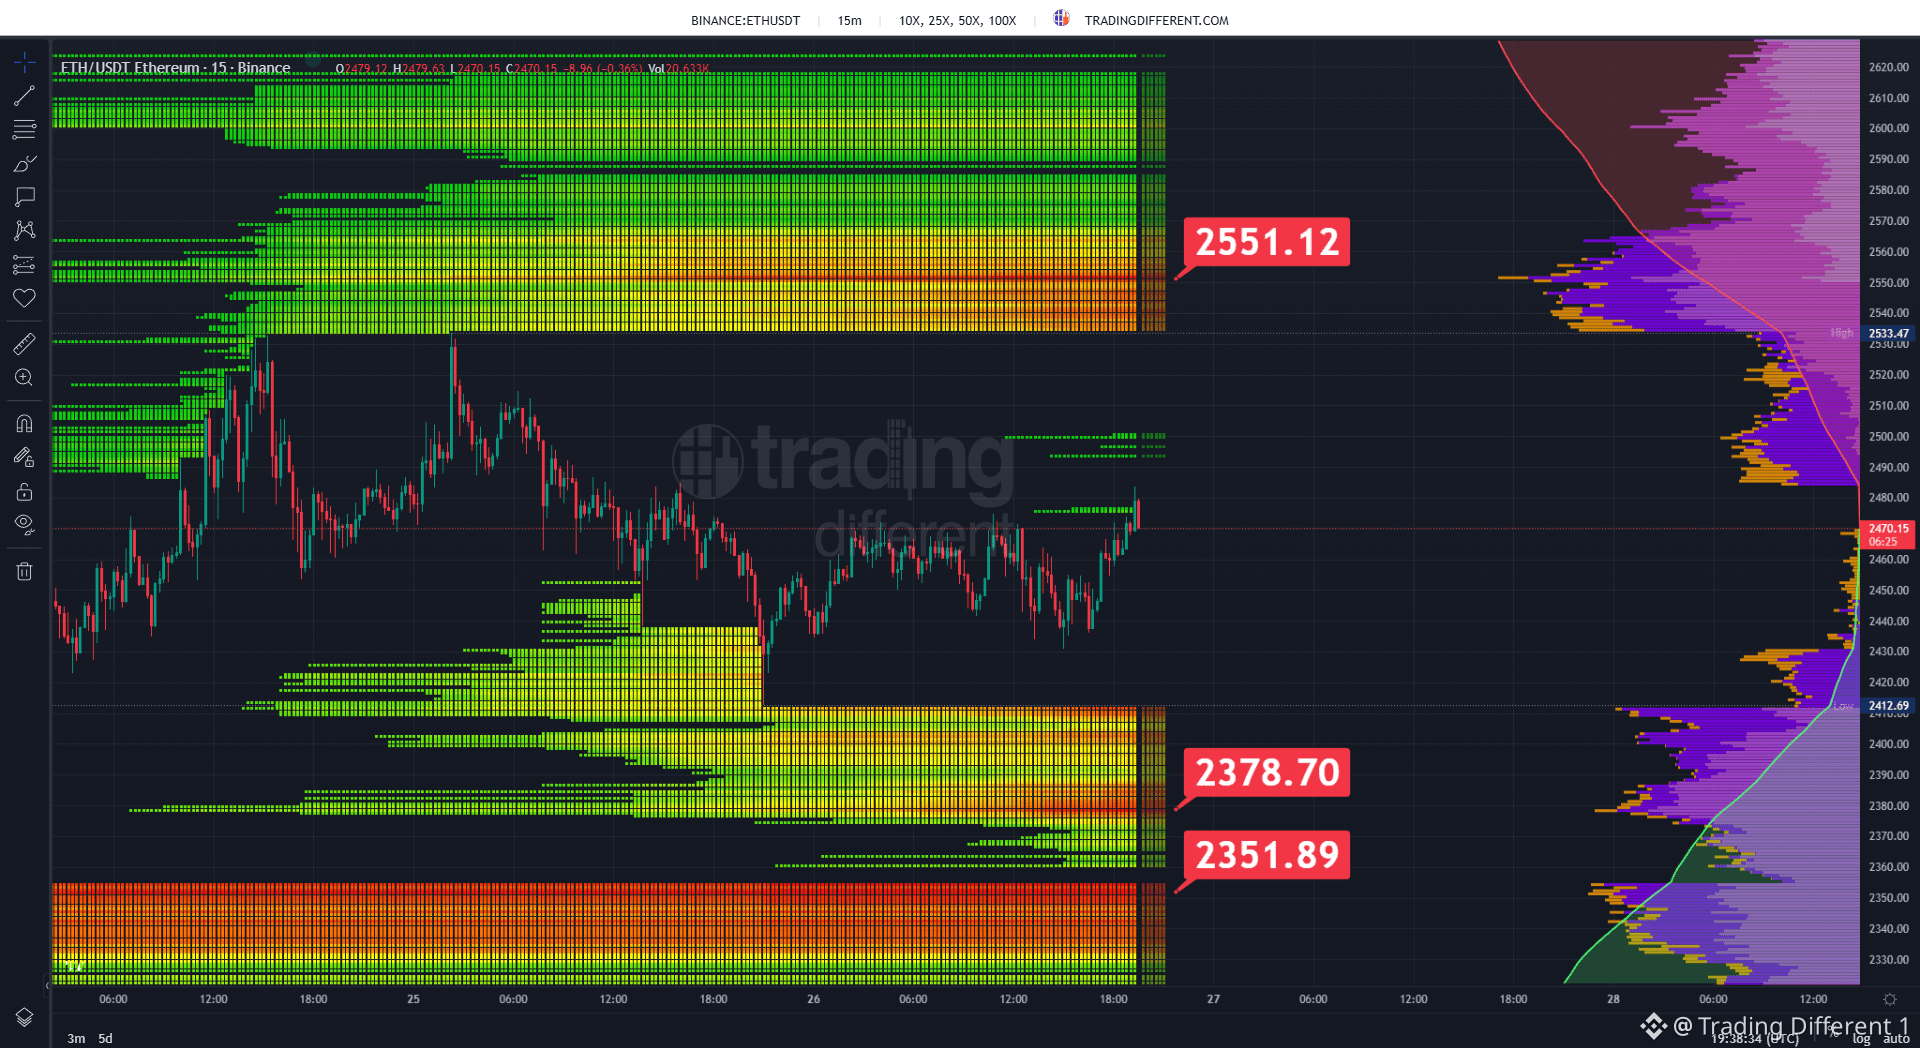
#ETH remains surrounded by relevant liquidation zones. The Liquidation Heatmap shows concentrated leveraged positions on both sides of the price: below, longs are exposed if the market deepens the drop; above, a recovery would begin to put pressure on the accumulated shorts at the higher levels. The key point now is not to anticipate direction, but to observe which block is attacked first. When the price enters a significant concentration of liquidations, the forced closing of positions can accelerate the move. #ETH
#ETH remains surrounded by relevant liquidation zones. The Liquidation Heatmap shows concentrated leveraged positions on both sides of the price: below, longs are exposed if the market deepens the drop; above, a recovery would begin to put pressure on the accumulated shorts at the higher levels. The key point now is not to anticipate direction, but to observe which block is attacked first. When the price enters a significant concentration of liquidations, the forced closing of positions can accelerate the move. #ETH
74
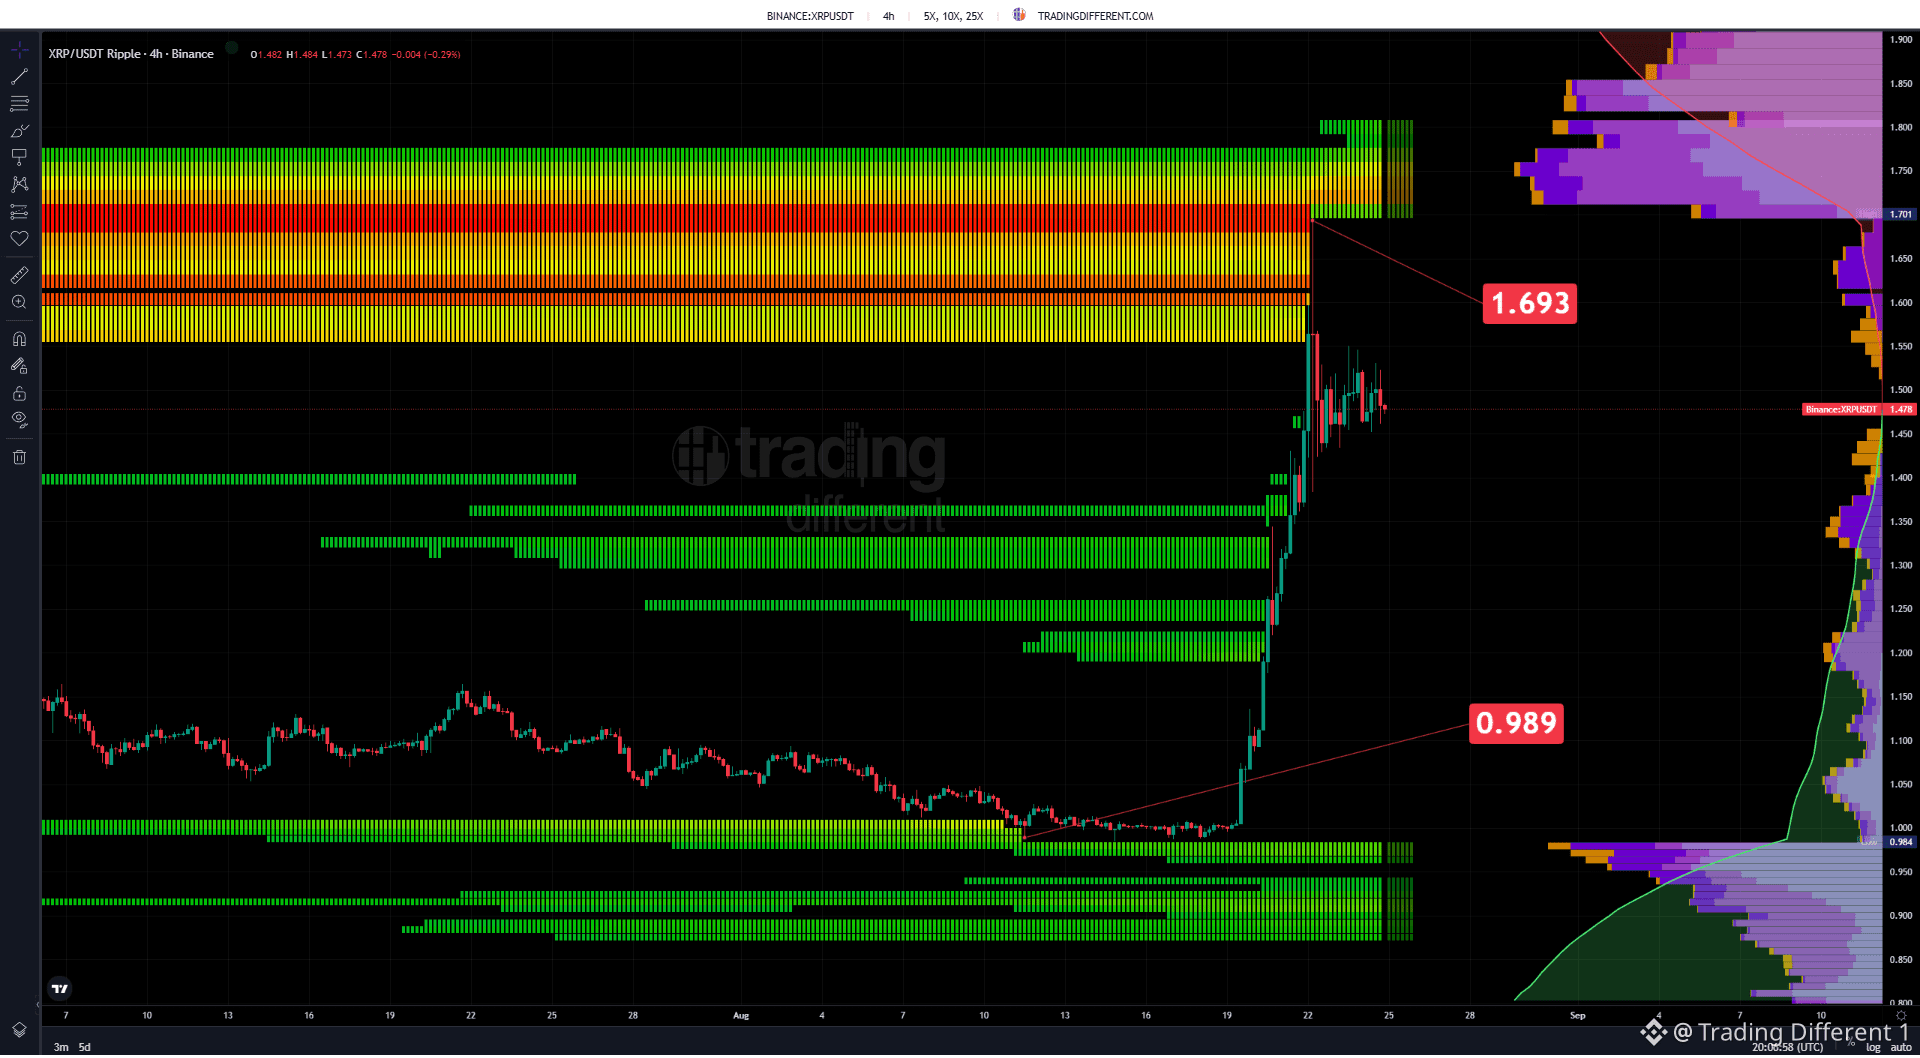
#XRP trades near $1.478 after an explosive move that pushed the price from the $1.00 zone to above $1.50. The 4-hour Liquidation Heatmap now shows the main block of short liquidations above the price, with a particularly strong concentration around $1.60–$1.75 and a key reference at $1.693. Below that, long liquidations are much farther away, with $0.989 as the highlighted level. After such a displacement, the map leaves a highly imbalanced structure: if #XRP regains height, the $1.69 area concentrates significant exposure from leveraged short positions.
#XRP trades near $1.478 after an explosive move that pushed the price from the $1.00 zone to above $1.50. The 4-hour Liquidation Heatmap now shows the main block of short liquidations above the price, with a particularly strong concentration around $1.60–$1.75 and a key reference at $1.693. Below that, long liquidations are much farther away, with $0.989 as the highlighted level. After such a displacement, the map leaves a highly imbalanced structure: if #XRP regains height, the $1.69 area concentrates significant exposure from leveraged short positions.
71
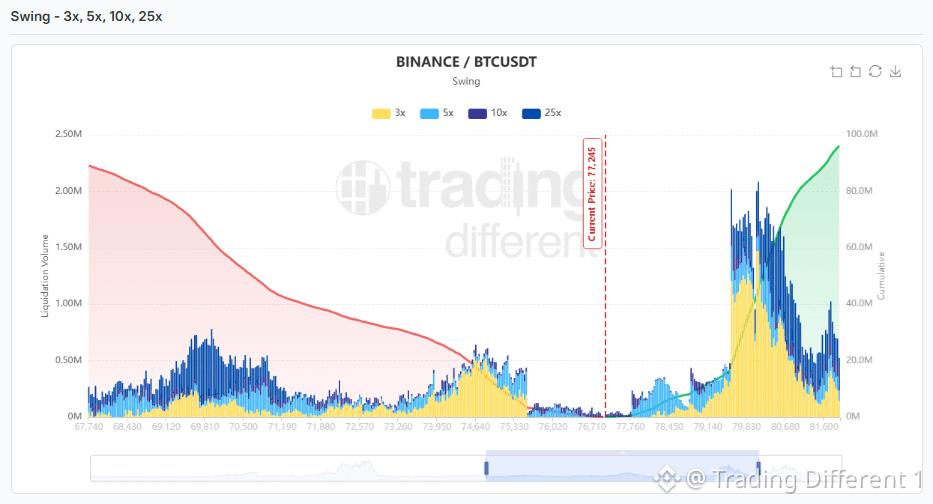
#BTC trades near 77,845 USD and the Liquidation Heatmap Swing shows a very pronounced imbalance above the price. The highest concentration of short liquidations appears approximately between 79,200 and 80,700 USD, with very high peaks in leveraged positions of 3X, 5X, 10X, and 25X; the total on the upper side is close to 100M. Below that, there are long liquidations distributed from the 75,300 USD area down to 67,700 USD, although their accumulated concentration is clearly lower. In the Swing timeframe, the map leaves #BTC relatively close to a large block of leveraged shorts: if price moves toward 79K–81K, exposure increases significantly.
#BTC trades near 77,845 USD and the Liquidation Heatmap Swing shows a very pronounced imbalance above the price. The highest concentration of short liquidations appears approximately between 79,200 and 80,700 USD, with very high peaks in leveraged positions of 3X, 5X, 10X, and 25X; the total on the upper side is close to 100M. Below that, there are long liquidations distributed from the 75,300 USD area down to 67,700 USD, although their accumulated concentration is clearly lower. In the Swing timeframe, the map leaves #BTC relatively close to a large block of leveraged shorts: if price moves toward 79K–81K, exposure increases significantly.
70
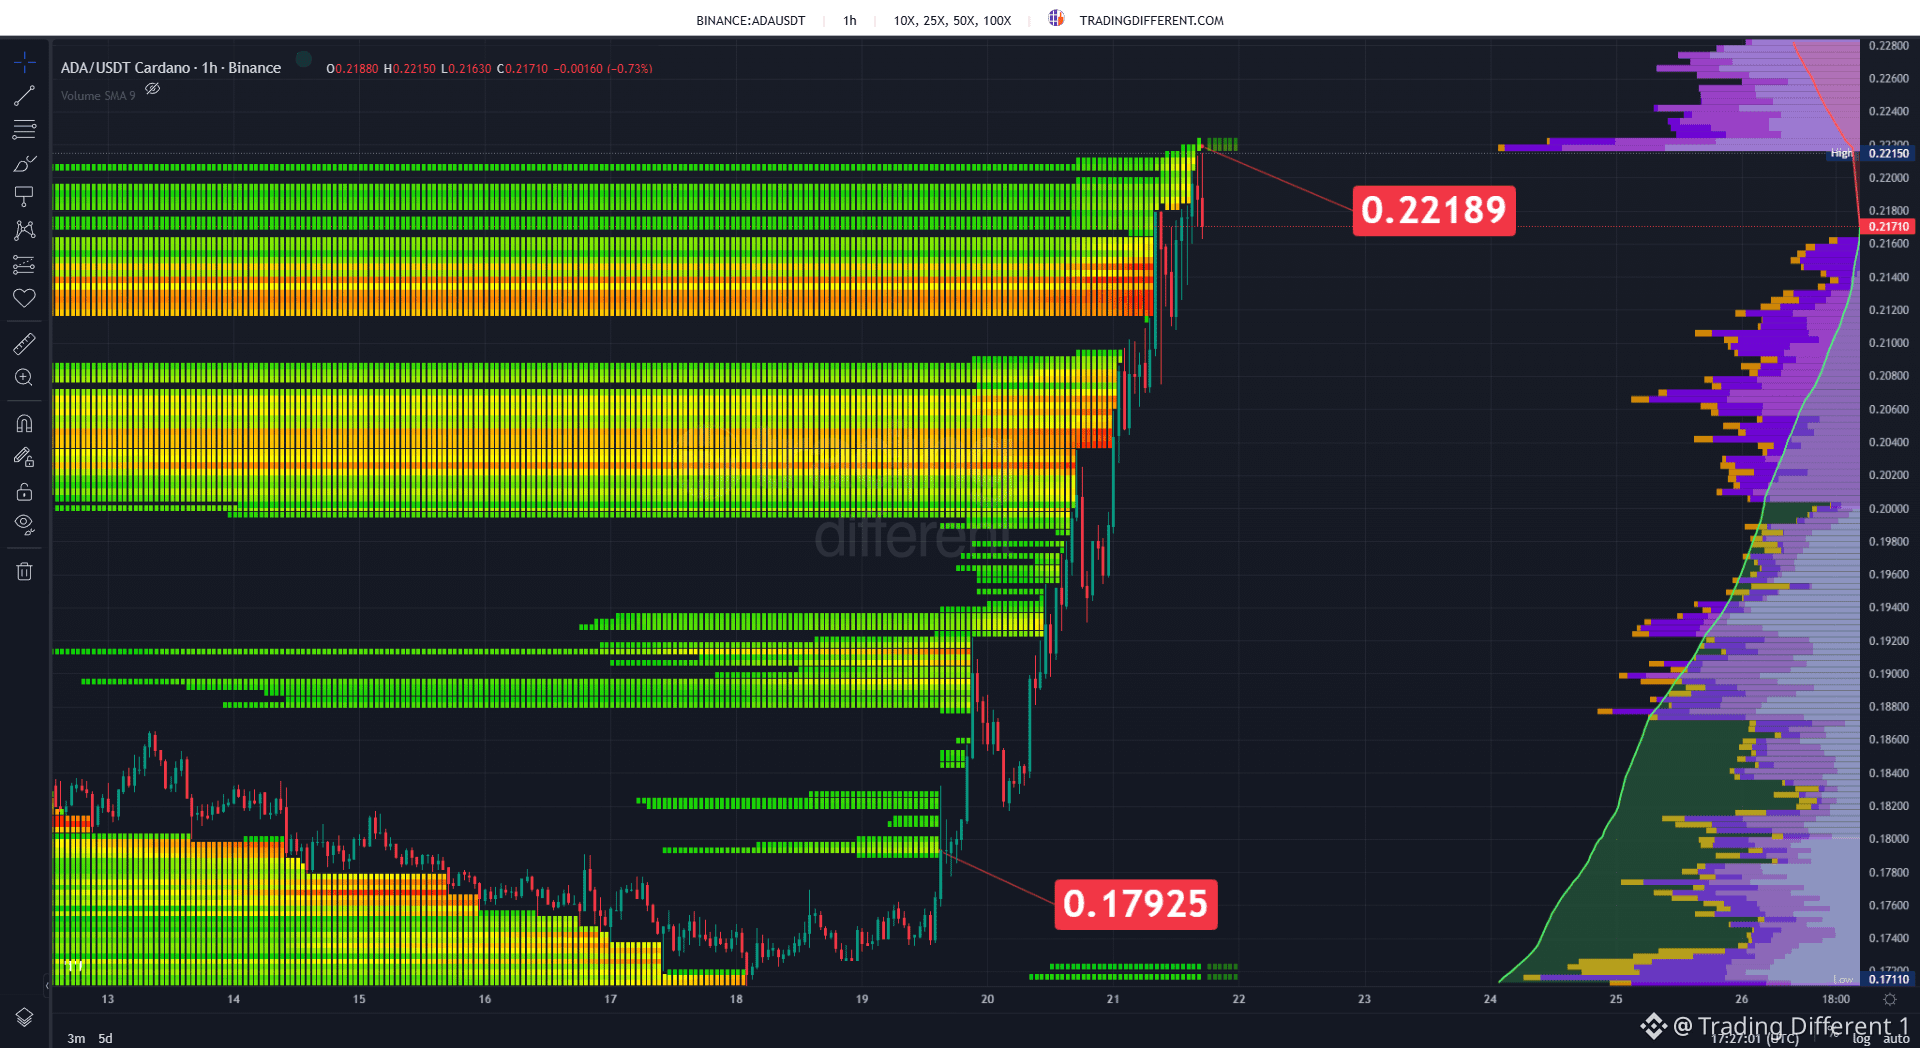
#ADA trades near 0.2171 USD after a strong bullish acceleration from the 0.18 USD zone. The 1H Liquidation Heatmap shows how the price successively broke through large concentrations of short liquidations and ended up reaching the upper block, with a reference close to 0.22189 USD. In this move upward, leveraged positions of 10X, 25X, 50X, and 100X were exposed, while much of the lower zones were left behind as price continued to rise. After touching approximately 0.2215 USD, ADA pulled back to 0.217 USD; now the focus is whether it can break again into the remaining liquidity above 0.22 USD or start to move away from that area following the strong bullish run.
#ADA trades near 0.2171 USD after a strong bullish acceleration from the 0.18 USD zone. The 1H Liquidation Heatmap shows how the price successively broke through large concentrations of short liquidations and ended up reaching the upper block, with a reference close to 0.22189 USD. In this move upward, leveraged positions of 10X, 25X, 50X, and 100X were exposed, while much of the lower zones were left behind as price continued to rise. After touching approximately 0.2215 USD, ADA pulled back to 0.217 USD; now the focus is whether it can break again into the remaining liquidity above 0.22 USD or start to move away from that area following the strong bullish run.
72
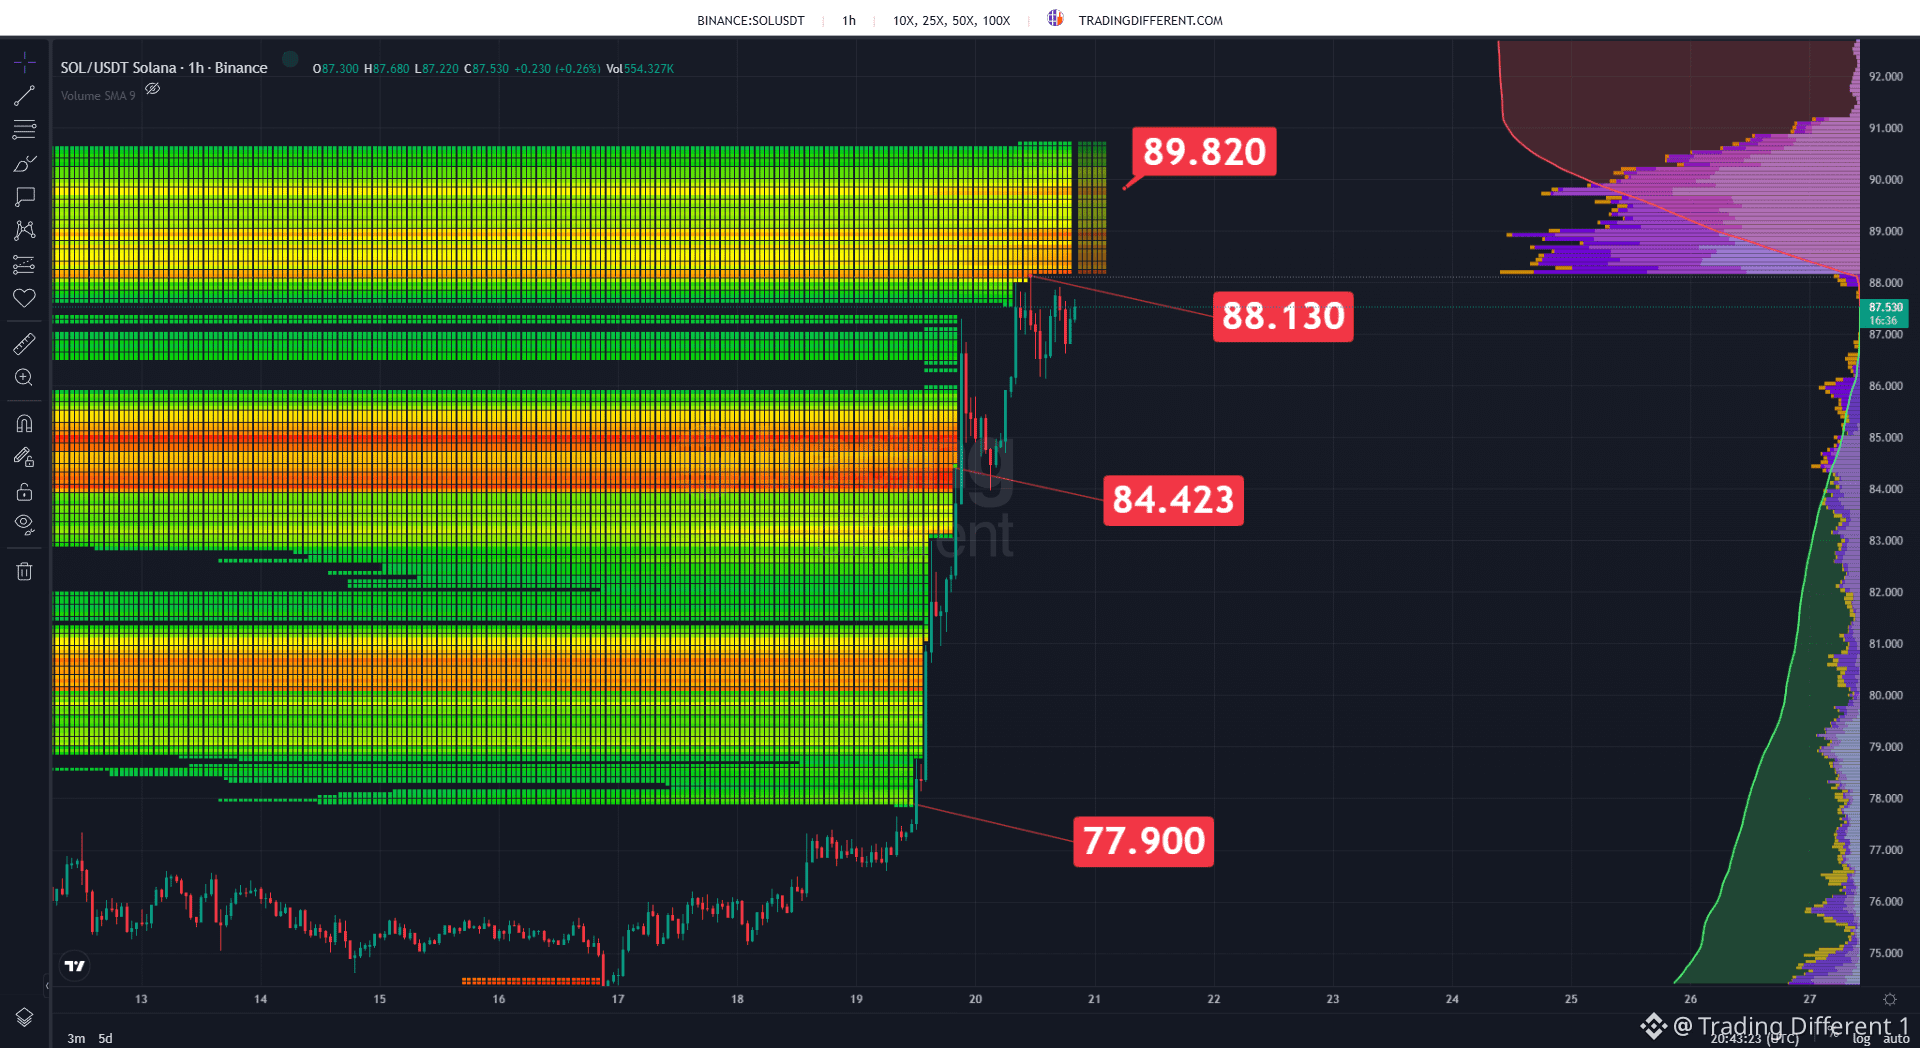
#SOL trades near 87.53 USD after a strong bullish impulse from the 78 USD zone. The 1H Liquidation Heatmap shows that price has already successively swept through short-liquidation areas at 84.42 USD and is now practically sitting on another marked zone around 88.13 USD. Above that, there remains an even more important and dense block, with a heavy concentration of leveraged positions of 10X, 25X, 50X, and 100X up to approximately 89.82 USD. If SOL keeps pushing higher, those shorts become increasingly exposed; whereas a reversal would again put price back below the zones already swept during this fast bullish move.
#SOL trades near 87.53 USD after a strong bullish impulse from the 78 USD zone. The 1H Liquidation Heatmap shows that price has already successively swept through short-liquidation areas at 84.42 USD and is now practically sitting on another marked zone around 88.13 USD. Above that, there remains an even more important and dense block, with a heavy concentration of leveraged positions of 10X, 25X, 50X, and 100X up to approximately 89.82 USD. If SOL keeps pushing higher, those shorts become increasingly exposed; whereas a reversal would again put price back below the zones already swept during this fast bullish move.
65
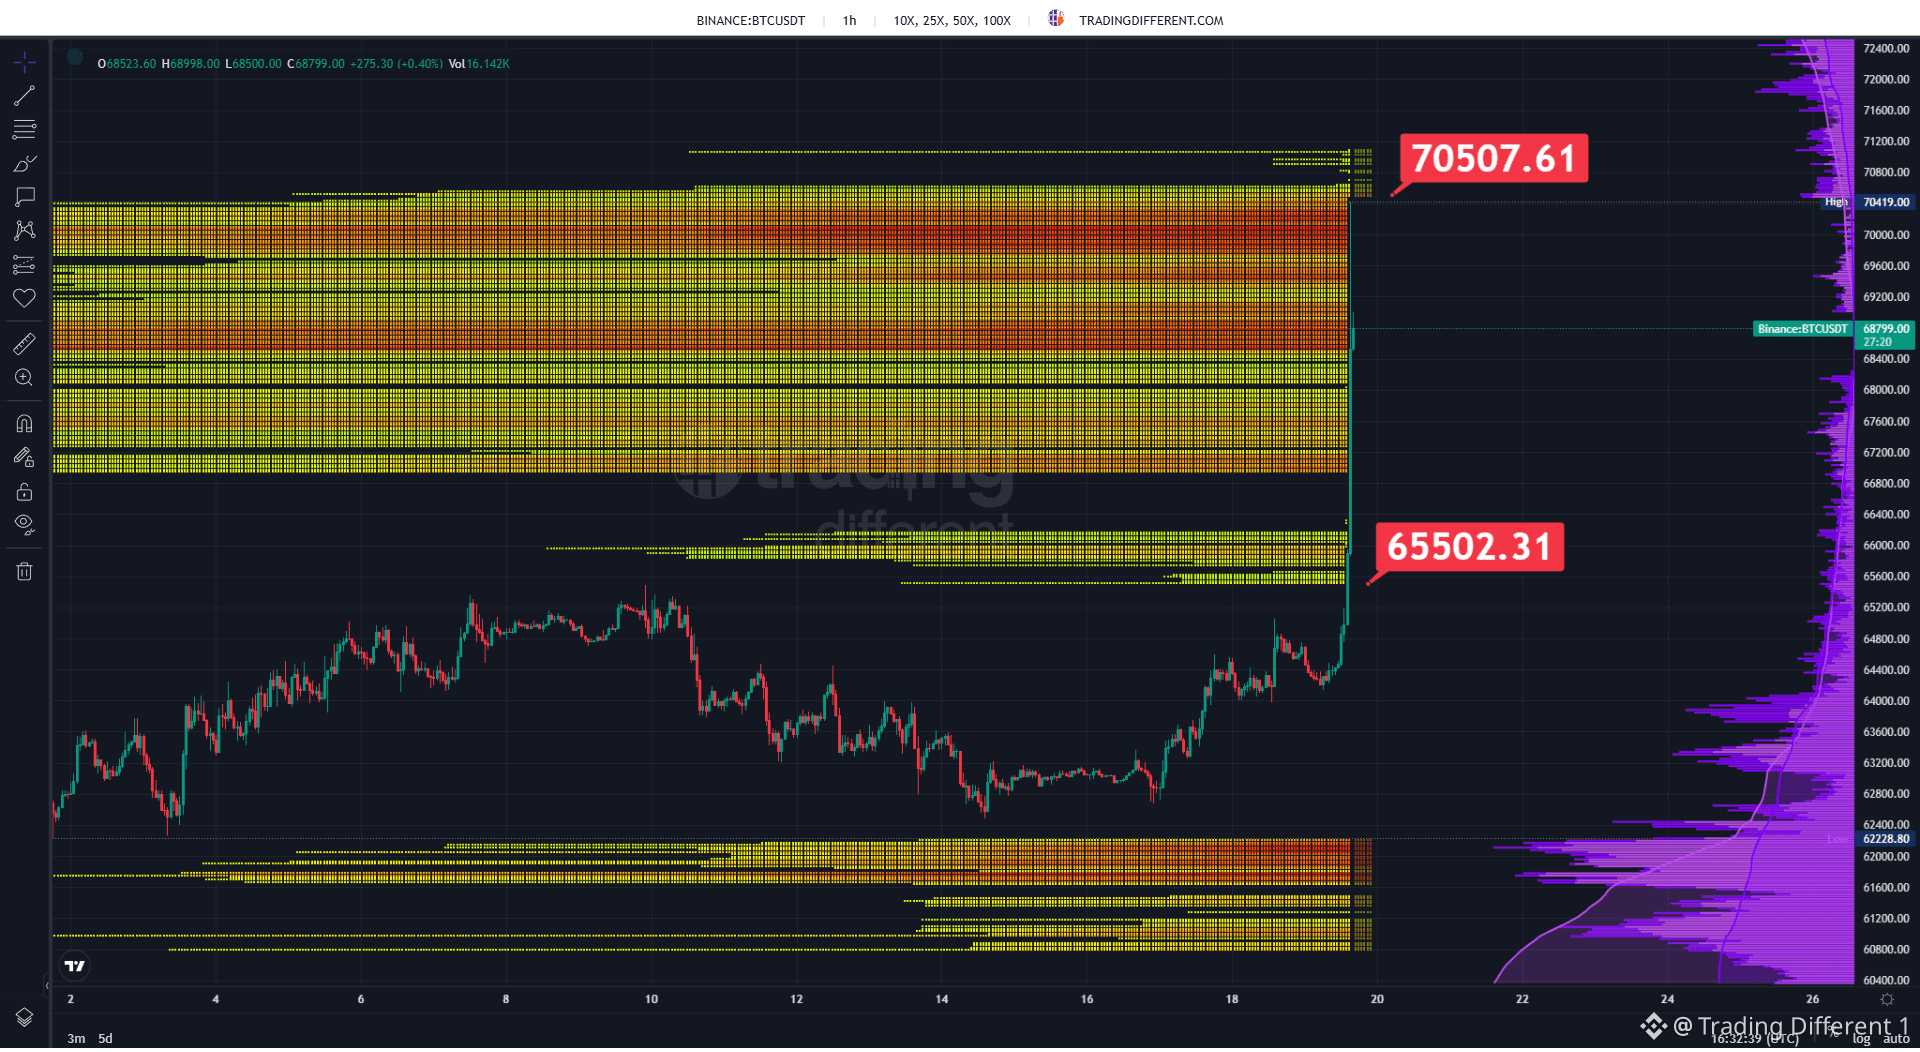
#BTC trades near $68,800 after a strong bullish acceleration that carried it directly toward a massive concentration of short liquidations. The 1H Liquidation Heatmap shows a particularly dense block between approximately $67,000 and $70,500, with the $70,507 level standing out at the upper end. Bitcoin has already moved fully into this zone, exposing leveraged positions of 10X, 25X, 50X, and 100X if it continues upward. Below, the picture is very different: the main concentrations of long liquidations are far from the current price, with a relevant block again around $62,000–$60,800. The current move clearly puts the spotlight on shorts and on how much of that large upper pool could end up liquidating BTC. The current move concentrates the immediate risk on shorts, while a reversal from $70,507 would bring back into play first the nearby long liquidations before reaching the $62,000–$60,800 block.
#BTC trades near $68,800 after a strong bullish acceleration that carried it directly toward a massive concentration of short liquidations. The 1H Liquidation Heatmap shows a particularly dense block between approximately $67,000 and $70,500, with the $70,507 level standing out at the upper end. Bitcoin has already moved fully into this zone, exposing leveraged positions of 10X, 25X, 50X, and 100X if it continues upward. Below, the picture is very different: the main concentrations of long liquidations are far from the current price, with a relevant block again around $62,000–$60,800. The current move clearly puts the spotlight on shorts and on how much of that large upper pool could end up liquidating BTC. The current move concentrates the immediate risk on shorts, while a reversal from $70,507 would bring back into play first the nearby long liquidations before reaching the $62,000–$60,800 block.
59
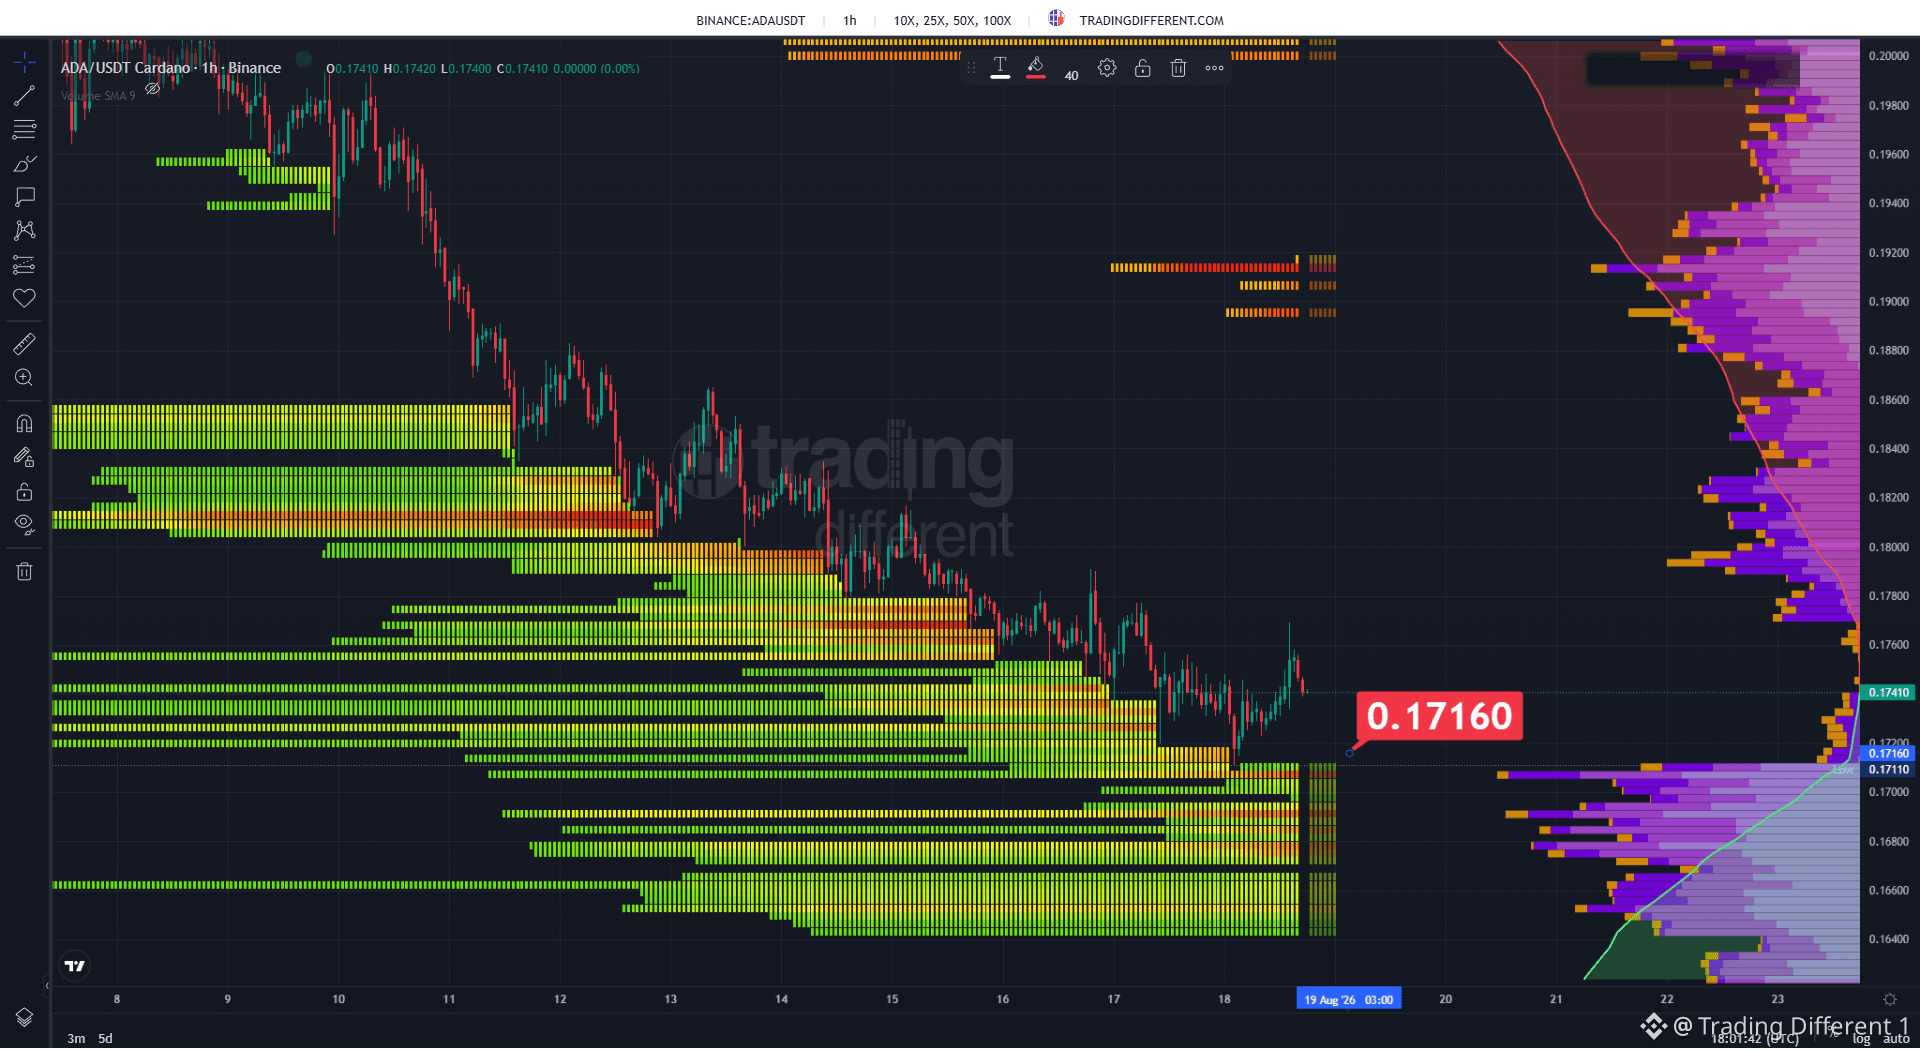
#ADA trades near 0.1741 USD after a sharp drop that progressively displaced and liquidated leveraged positions. The 1H Liquidation Heatmap shows that below, a broad concentration of long liquidations still remains, starting around 0.1716 USD and extending with increasing intensity toward the 0.168–0.164 USD zone.
Above the current price, short liquidations appear more dispersed, with visible clusters around 0.189–0.192 USD and higher levels. With leverage of 10X, 25X, 50X, and 100X, the map leaves ADA very close to the lower block, so another drop would quickly expose the leveraged longs.
#ADA trades near 0.1741 USD after a sharp drop that progressively displaced and liquidated leveraged positions. The 1H Liquidation Heatmap shows that below, a broad concentration of long liquidations still remains, starting around 0.1716 USD and extending with increasing intensity toward the 0.168–0.164 USD zone.
Above the current price, short liquidations appear more dispersed, with visible clusters around 0.189–0.192 USD and higher levels. With leverage of 10X, 25X, 50X, and 100X, the map leaves ADA very close to the lower block, so another drop would quickly expose the leveraged longs.
Above the current price, short liquidations appear more dispersed, with visible clusters around 0.189–0.192 USD and higher levels. With leverage of 10X, 25X, 50X, and 100X, the map leaves ADA very close to the lower block, so another drop would quickly expose the leveraged longs.
71
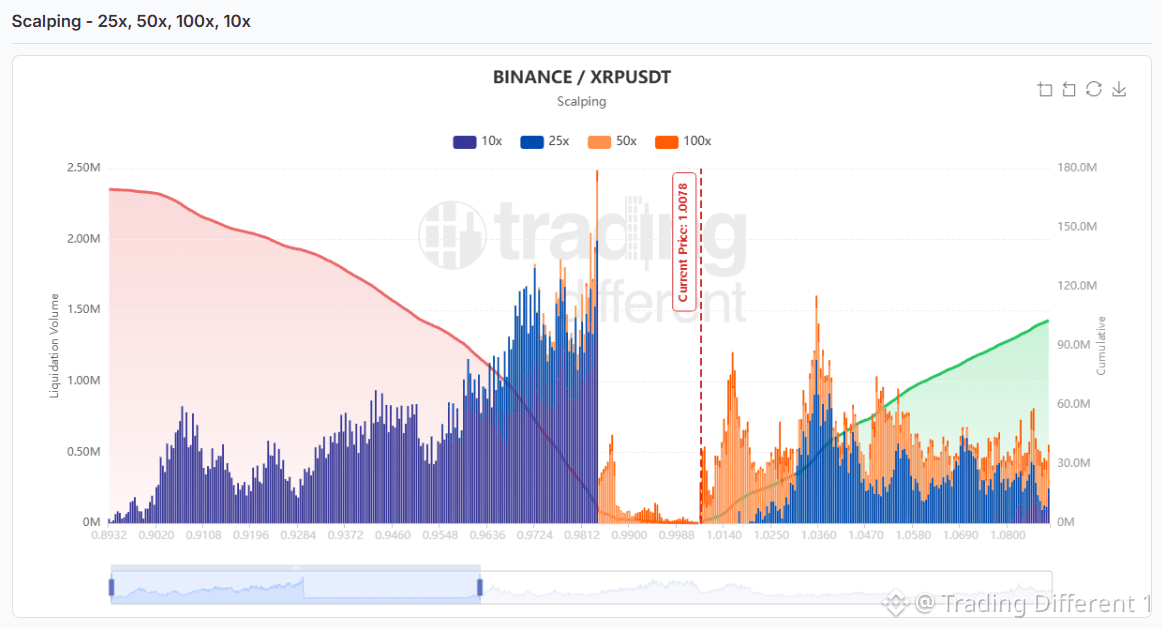
#XRP trades near 1.0078 USD and the scalping Liquidation Heatmap shows strong asymmetry around the current price. Below, the concentration of long liquidations is clearly heavier, especially between approximately 0.96 and 0.985 USD, where numerous blocks of 10X, 25X, 50X, and 100X appear and the cumulative total reaches levels far higher. Above, short liquidations start almost from 1.01 USD and spread toward 1.08 USD, with notable concentrations around 1.035–1.05 USD. In the very short term, XRP is positioned between both sides of liquidity, but the accumulated imbalance remains considerably greater below the price.
#XRP trades near 1.0078 USD and the scalping Liquidation Heatmap shows strong asymmetry around the current price. Below, the concentration of long liquidations is clearly heavier, especially between approximately 0.96 and 0.985 USD, where numerous blocks of 10X, 25X, 50X, and 100X appear and the cumulative total reaches levels far higher. Above, short liquidations start almost from 1.01 USD and spread toward 1.08 USD, with notable concentrations around 1.035–1.05 USD. In the very short term, XRP is positioned between both sides of liquidity, but the accumulated imbalance remains considerably greater below the price.
66
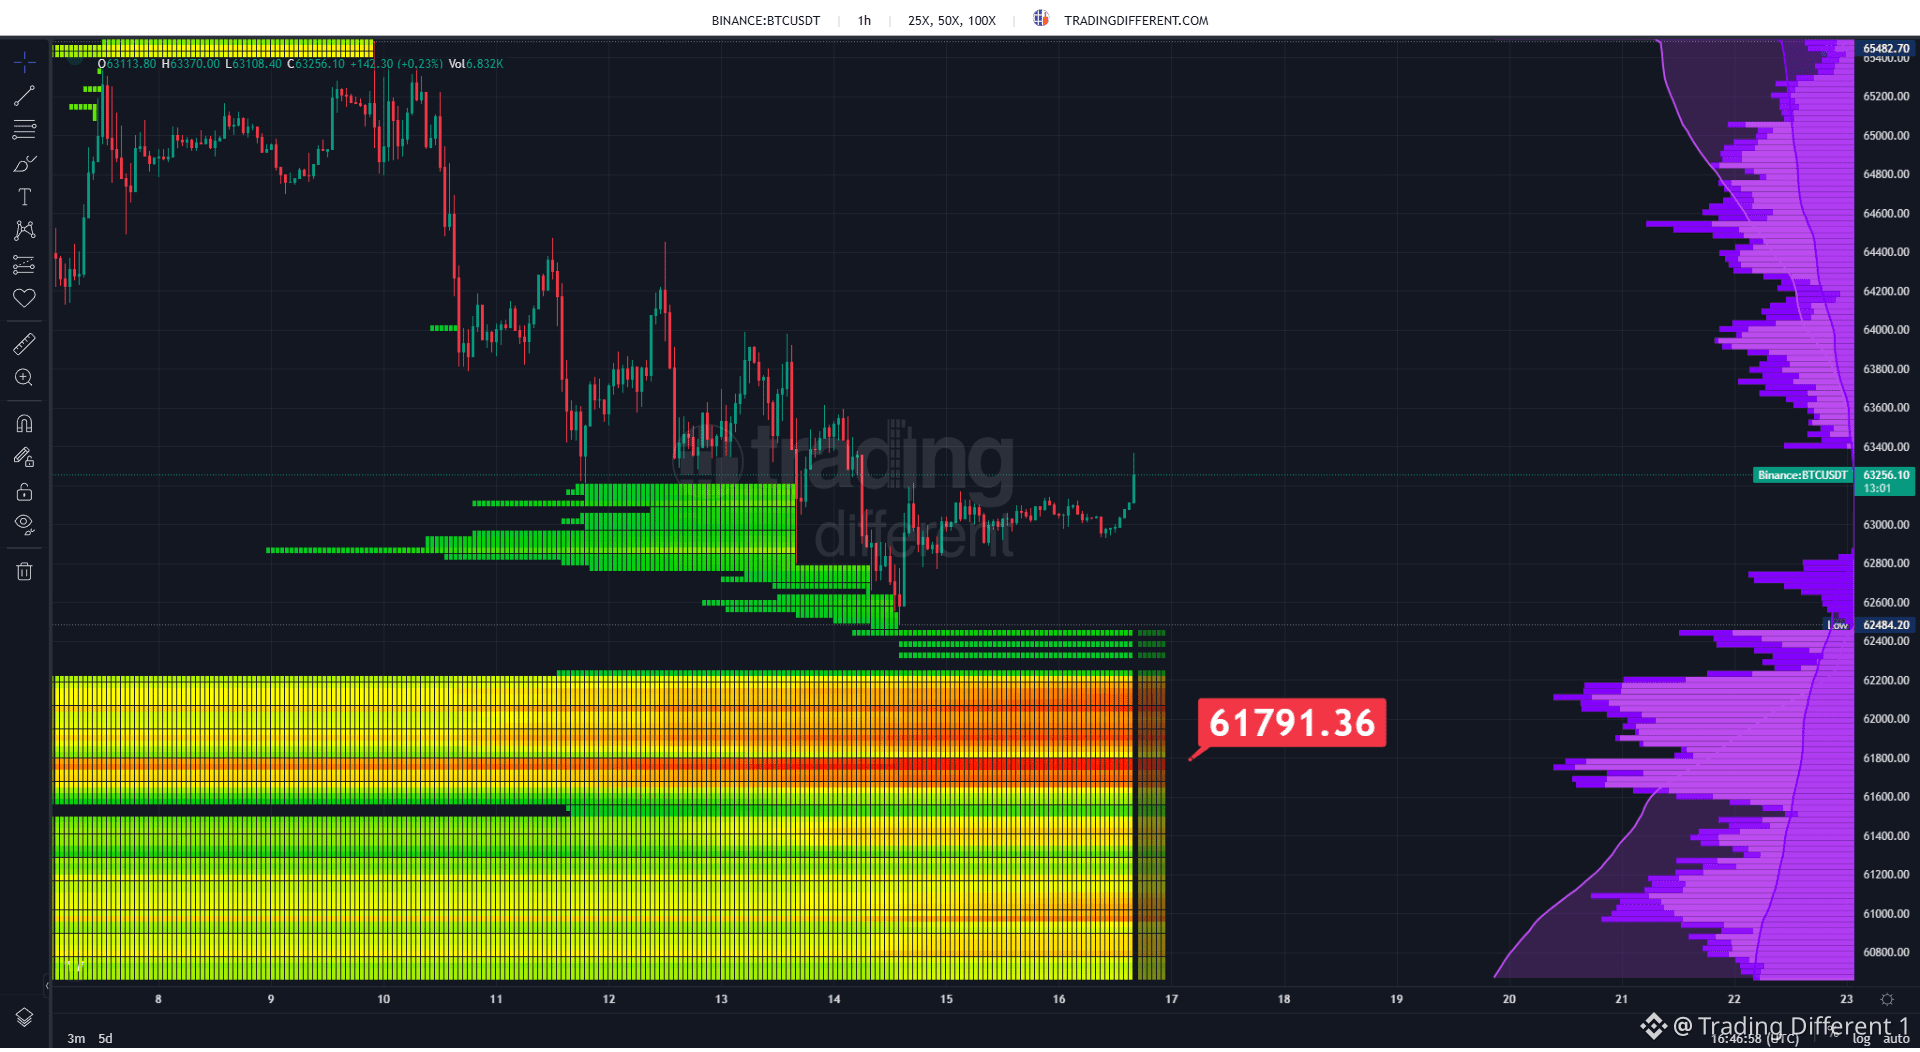
#BTC maintains intact an enormous liquidation pool below. Bitcoin is trading near 63,256 USD and, although it managed to recover from recent lows, the 1H Liquidation Heatmap still shows a very important concentration of leveraged longs below the price. The zone starts to build up strongly from approximately 62,200 USD, but the most intense core remains around 61,791 USD, then extending toward 60,600 USD. These are positions exposed at 25X, 50X, and 100X. If the price again loses the 62,400–62,200 USD area, that large liquidation block is brought back directly into play. For now, BTC keeps away from the pool. The question is how long it can manage to keep it at a distance. 👀
#BTC maintains intact an enormous liquidation pool below. Bitcoin is trading near 63,256 USD and, although it managed to recover from recent lows, the 1H Liquidation Heatmap still shows a very important concentration of leveraged longs below the price. The zone starts to build up strongly from approximately 62,200 USD, but the most intense core remains around 61,791 USD, then extending toward 60,600 USD. These are positions exposed at 25X, 50X, and 100X. If the price again loses the 62,400–62,200 USD area, that large liquidation block is brought back directly into play. For now, BTC keeps away from the pool. The question is how long it can manage to keep it at a distance. 👀
74
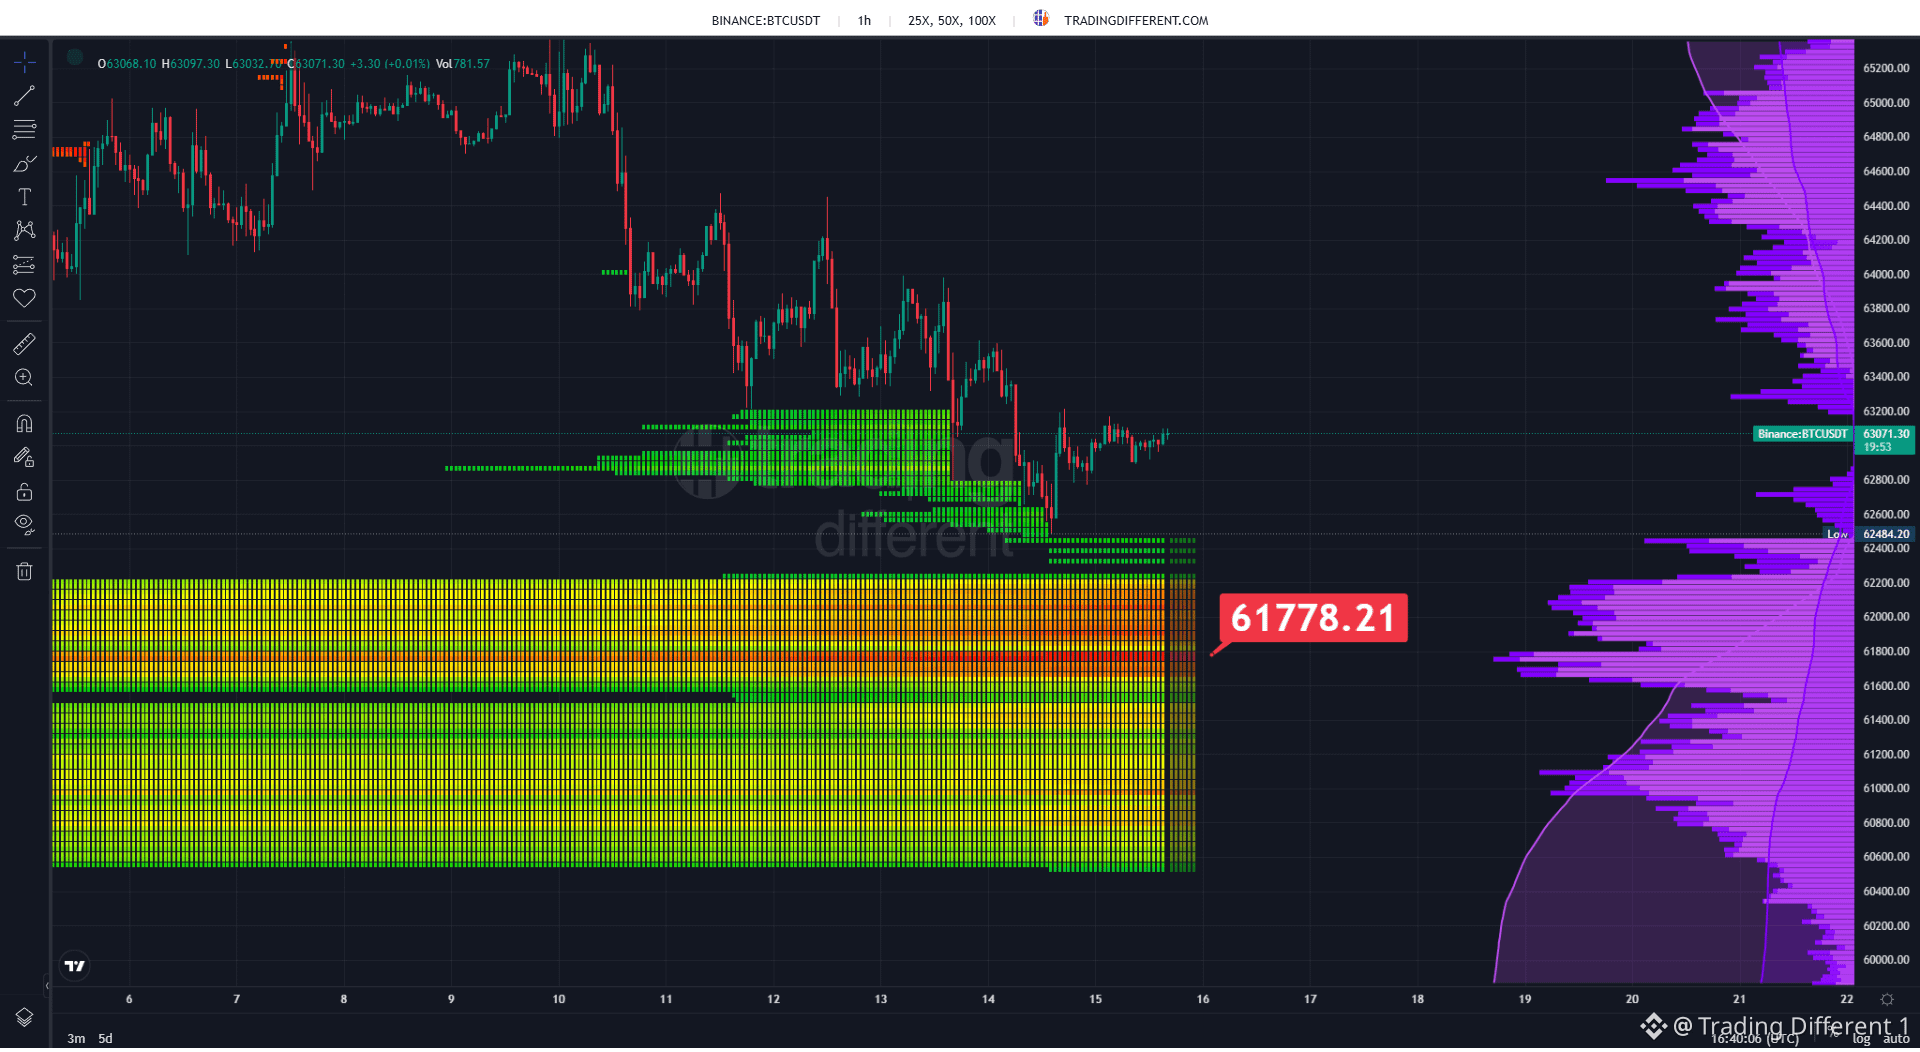
#BTC reclaims a spot in front of a highly loaded zone of leveraged longs. Bitcoin is trading near 63,071 USD after sweeping some of the higher liquidation levels and rebounding from the 62,500 USD area. The 1H Liquidation Heatmap now shows the most important block below the price: an enormous concentration of long liquidations that starts around 62,200 USD, with special intensity near 61,778 USD and extending toward 60,600 USD. As long as BTC stays above 62,500–62,200 USD, that pool remains in play. If it loses that zone again, the 25X, 50X, and 100X leveraged positions will once again take center stage. The map doesn’t predict the next move: it shows where traders will be forced to close if price reaches there.
#BTC reclaims a spot in front of a highly loaded zone of leveraged longs. Bitcoin is trading near 63,071 USD after sweeping some of the higher liquidation levels and rebounding from the 62,500 USD area. The 1H Liquidation Heatmap now shows the most important block below the price: an enormous concentration of long liquidations that starts around 62,200 USD, with special intensity near 61,778 USD and extending toward 60,600 USD. As long as BTC stays above 62,500–62,200 USD, that pool remains in play. If it loses that zone again, the 25X, 50X, and 100X leveraged positions will once again take center stage. The map doesn’t predict the next move: it shows where traders will be forced to close if price reaches there.
78
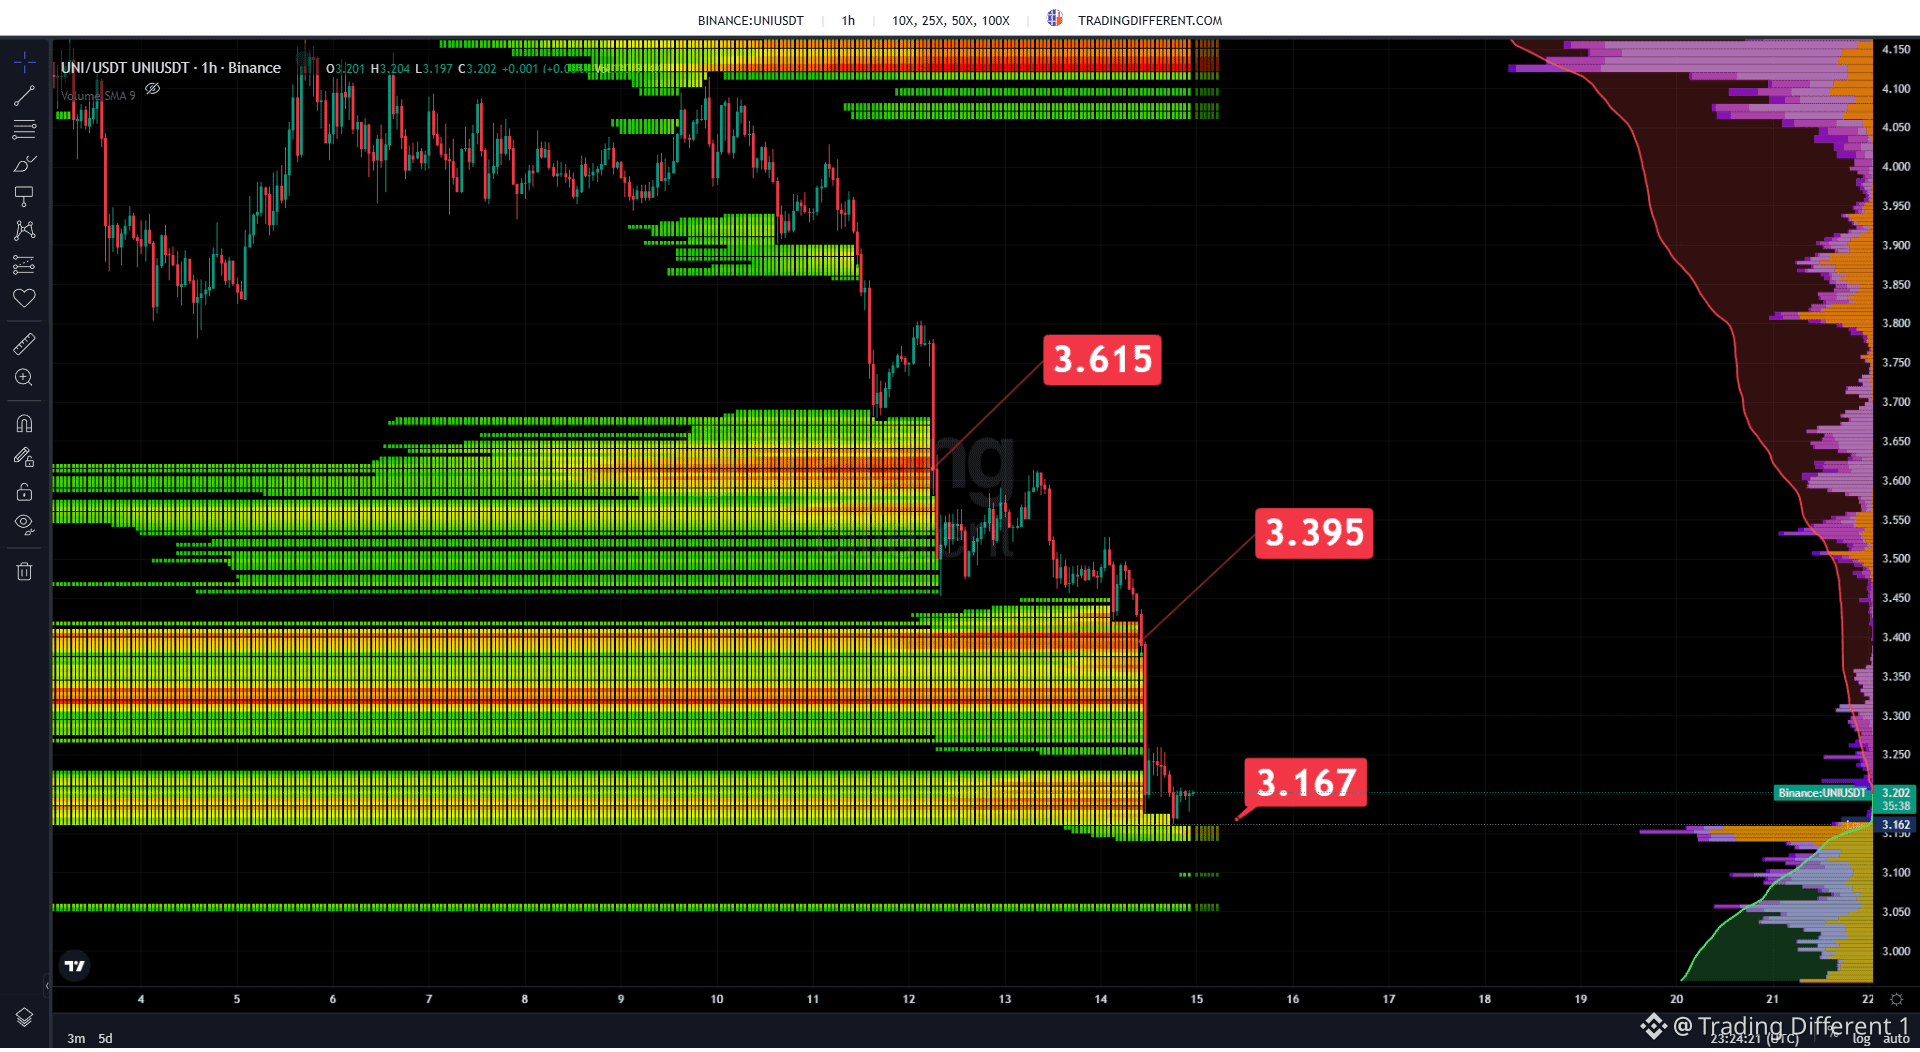
#UNI it quotes around 3.20 USD after a sharp drop that was successively liquidating leveraged longs. The price moved through the marked zones at 3.615 and 3.395 USD and is now practically over the next focus area of the Liquidation Heatmap, around 3.167 USD. The pressure remains concentrated on the longs: if the price continues to fall, that area will be immediately exposed. To ease the situation, UNI would have to reclaim levels it has already lost and move away from this new pool of liquidations. 📉
#UNI it quotes around 3.20 USD after a sharp drop that was successively liquidating leveraged longs. The price moved through the marked zones at 3.615 and 3.395 USD and is now practically over the next focus area of the Liquidation Heatmap, around 3.167 USD. The pressure remains concentrated on the longs: if the price continues to fall, that area will be immediately exposed. To ease the situation, UNI would have to reclaim levels it has already lost and move away from this new pool of liquidations. 📉
19
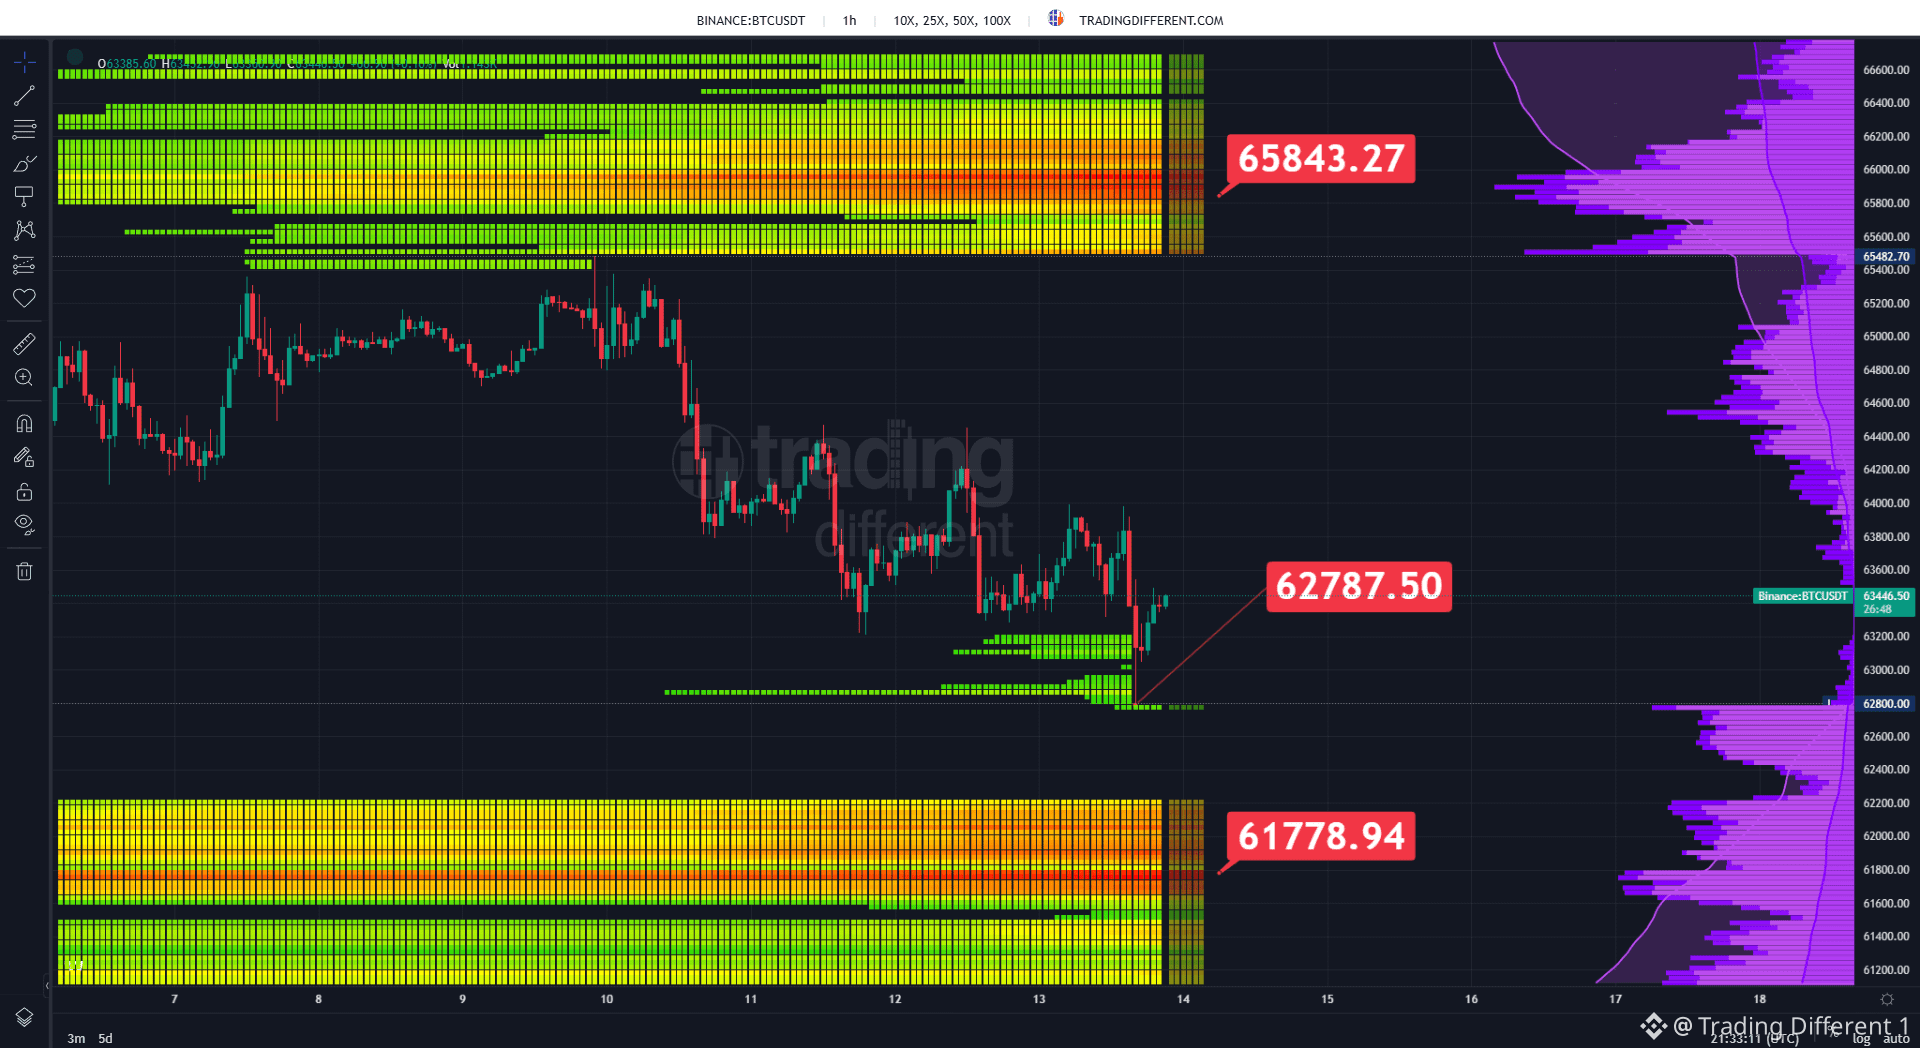
#BTC trades near 63,447 USD after pressing the lower zones of the Liquidation Heatmap again. The closest cluster of long liquidations appears around 62,788 USD, while below that there remains a much larger block near 61,779 USD, where a considerable amount of vulnerable leveraged positions is building up. On the opposite end, the main concentration of short liquidations stays around 65,843 USD. 📊 With BTC trapped between these major liquidity pools, the map maintains relevant targets in both directions, although a new drop would put the longs concentrated near 62,788 USD at risk first.
#BTC trades near 63,447 USD after pressing the lower zones of the Liquidation Heatmap again. The closest cluster of long liquidations appears around 62,788 USD, while below that there remains a much larger block near 61,779 USD, where a considerable amount of vulnerable leveraged positions is building up. On the opposite end, the main concentration of short liquidations stays around 65,843 USD. 📊 With BTC trapped between these major liquidity pools, the map maintains relevant targets in both directions, although a new drop would put the longs concentrated near 62,788 USD at risk first.
68
Log in to explore more content
Join global crypto users on Binance Square
⚡️ Get latest and useful information about crypto.
💬 Trusted by the world’s largest crypto exchange.
👍 Discover real insights from verified creators.
Email / Phone number
Trending Topics
AppleDebutsFoldablePhone
9,580 views
232 Discussing
#appledebutsfoldablephone I Got My Hands on the iPhone Duo, Apple’s First Foldable Phone. Here’s What Stands Out
The palm-size phone is Apple's boldest handset in years, with a 5.4-inch cover screen and a 7.6-inch main display. I spent some time with the Duo before its October launch.It’s finally here: Apple on Wednesday unveiled its first foldable iPhone, called the iPhone Duo.
iPhone Duo design and build
The iPhone Duo is compact, with a passport-size design. It has a 7.6-inch display on the inside and a 5.4-inch outer display. It fits squarely in my palm, with dimensions similar to Samsung’s Galaxy Z Fold 8, which has a 7.6-inch inner display and a 5.5-inch cover display.
Apple says the Duo is the thinnest iPhone ever when open, measuring 5.2mm. It’s 11.3mm thick when closed. A titanium frame keeps it lightweight at 254 grams.
One of the key differences in feel between Apple’s and Samsung’s phones is that the iPhone Duo has a matte, nano-textured finish on the inner display, which reduces the phone’s crease while also curbing reflections. It has a satisfying feel and really makes the crease virtually disappear when the screen is on. I find it even harder to notice than the Z Fold 8’s, which also has an anti-reflective display.$ONG $IMX $TAC
Isabella-I
·4 Likes
·944 views
EUExtendsCentralContactPointToCASPs
30 views
10 Discussing
US10YTreasuryYieldHitsHighestSinceNov2023
13,496 views
252 Discussing