
国泰海通证券
196 Posts

国泰海通证券
Report
Block User
国泰海通证券紫阳东路,很抱歉最近可能大家在大A找不到我的身影,因为流量太大扛不住舆论压力,便转战虚拟货币。
Frequent Trader
2 Years
19 Following
87 Followers
156 Liked
Posts
All
Quotes
Videos
·
--
📊 In-depth INIT analysis: 22x volume-to-market-cap ratio! Warning: whales are in control
📡 Real-time monitoring (14:10 Beijing time)
Source: Binance Futures API + CoinGecko
- Futures price: $0.24278 (24h: +14.557%)
- 24h high: $0.30298 (upper Bollinger Band)
- 24h low: $0.18320 (breakdown in the morning session)
- 24h trading volume: 6.055 billion (USDT)
- 24h trading value: 1.425 billion (USDT)
- Market cap: $63.39M (circulating supply: 219 million)
🔴 This looks blatantly fake: a 22x volume-to-market-cap ratio
Normal projects: 0.5–3x
INIT currently: 22x (1.4 billion/63.4 million)
Conclusion: This is professional whale/market-maker manipulation, not natural liquidity!
【Evidence of whale manipulation (contract on-chain data)】
1️⃣ Funding rate: -1.68% (every 4 hours) = -633% annualized
→ Shorts are being crushed in a massive squeeze (Liquidity Crash)
2️⃣ 12-hour pump-and-dump cycle:
• 11-10 14:00 $0.2133→$0.288 (+35%)
• 11-10 20:00 $0.2782→$0.218 (-22%)
→ One complete “accumulation→pump→dump” operation took place
3️⃣ Futures/spot price inversion: $0.243 vs. $0.289 (-15%)
→ Heavy pressure on short sellers (funding rate is at an extreme)
4️⃣ 7-day surge: $0.1217→$0.2428 (2x), with a 4x spike in a single day
【On-chain whale watch】
⚠️ INIT’s main chains: Initia mainnet (uinit) + Osmosis (IBC).
⚠️ No BSC BEP-20 version found via GoPlus/BSCScan/GoPlus API.
⚠️ IDO/mining: The Initia EPA airdrop just finished, bringing a huge influx of retail traders.
⚠️ Top 10 holdings are not public (early-stage Initia); tracking is not possible.
🔴 What remains unknown
- No tracking of publicly known wallet addresses (GoPlus returned 404)
- Unable to view smart contract call data for contracts deployed on Initia
【Trading recommendations】
① Holders: Immediately reduce positions to a core holding (around $0.24) and wait for selling pressure to ease
② No position: Stay out! Don’t try to catch a falling knife
③ Shorting: If it rebounds above $0.26→$0.28, there’s room to short (stop-loss at $0.30)
④ Rebound confirmation: Consider entering only after the hourly candle holds above $0.24 for more than 30 minutes
⑤ Next pulse: Expected to rally again from $0.24→$0.28 during this cycle; look for confirmation signals and increased volume
#INIT #Initia #WhaleWatch #WhaleTracking #FuturesManipulation #ExtremeVolatility #risque
📊 In-depth INIT analysis: 22x volume-to-market-cap ratio! Warning: whales are in control
📡 Real-time monitoring (14:10 Beijing time)
Source: Binance Futures API + CoinGecko
- Futures price: $0.24278 (24h: +14.557%)
- 24h high: $0.30298 (upper Bollinger Band)
- 24h low: $0.18320 (breakdown in the morning session)
- 24h trading volume: 6.055 billion (USDT)
- 24h trading value: 1.425 billion (USDT)
- Market cap: $63.39M (circulating supply: 219 million)
🔴 This looks blatantly fake: a 22x volume-to-market-cap ratio
Normal projects: 0.5–3x
INIT currently: 22x (1.4 billion/63.4 million)
Conclusion: This is professional whale/market-maker manipulation, not natural liquidity!
【Evidence of whale manipulation (contract on-chain data)】
1️⃣ Funding rate: -1.68% (every 4 hours) = -633% annualized
→ Shorts are being crushed in a massive squeeze (Liquidity Crash)
2️⃣ 12-hour pump-and-dump cycle:
• 11-10 14:00 $0.2133→$0.288 (+35%)
• 11-10 20:00 $0.2782→$0.218 (-22%)
→ One complete “accumulation→pump→dump” operation took place
3️⃣ Futures/spot price inversion: $0.243 vs. $0.289 (-15%)
→ Heavy pressure on short sellers (funding rate is at an extreme)
4️⃣ 7-day surge: $0.1217→$0.2428 (2x), with a 4x spike in a single day
【On-chain whale watch】
⚠️ INIT’s main chains: Initia mainnet (uinit) + Osmosis (IBC).
⚠️ No BSC BEP-20 version found via GoPlus/BSCScan/GoPlus API.
⚠️ IDO/mining: The Initia EPA airdrop just finished, bringing a huge influx of retail traders.
⚠️ Top 10 holdings are not public (early-stage Initia); tracking is not possible.
🔴 What remains unknown
- No tracking of publicly known wallet addresses (GoPlus returned 404)
- Unable to view smart contract call data for contracts deployed on Initia
【Trading recommendations】
① Holders: Immediately reduce positions to a core holding (around $0.24) and wait for selling pressure to ease
② No position: Stay out! Don’t try to catch a falling knife
③ Shorting: If it rebounds above $0.26→$0.28, there’s room to short (stop-loss at $0.30)
④ Rebound confirmation: Consider entering only after the hourly candle holds above $0.24 for more than 30 minutes
⑤ Next pulse: Expected to rally again from $0.24→$0.28 during this cycle; look for confirmation signals and increased volume
#INIT #Initia #WhaleWatch #WhaleTracking #FuturesManipulation #ExtremeVolatility #risque
📡 Real-time monitoring (14:10 Beijing time)
Source: Binance Futures API + CoinGecko
- Futures price: $0.24278 (24h: +14.557%)
- 24h high: $0.30298 (upper Bollinger Band)
- 24h low: $0.18320 (breakdown in the morning session)
- 24h trading volume: 6.055 billion (USDT)
- 24h trading value: 1.425 billion (USDT)
- Market cap: $63.39M (circulating supply: 219 million)
🔴 This looks blatantly fake: a 22x volume-to-market-cap ratio
Normal projects: 0.5–3x
INIT currently: 22x (1.4 billion/63.4 million)
Conclusion: This is professional whale/market-maker manipulation, not natural liquidity!
【Evidence of whale manipulation (contract on-chain data)】
1️⃣ Funding rate: -1.68% (every 4 hours) = -633% annualized
→ Shorts are being crushed in a massive squeeze (Liquidity Crash)
2️⃣ 12-hour pump-and-dump cycle:
• 11-10 14:00 $0.2133→$0.288 (+35%)
• 11-10 20:00 $0.2782→$0.218 (-22%)
→ One complete “accumulation→pump→dump” operation took place
3️⃣ Futures/spot price inversion: $0.243 vs. $0.289 (-15%)
→ Heavy pressure on short sellers (funding rate is at an extreme)
4️⃣ 7-day surge: $0.1217→$0.2428 (2x), with a 4x spike in a single day
【On-chain whale watch】
⚠️ INIT’s main chains: Initia mainnet (uinit) + Osmosis (IBC).
⚠️ No BSC BEP-20 version found via GoPlus/BSCScan/GoPlus API.
⚠️ IDO/mining: The Initia EPA airdrop just finished, bringing a huge influx of retail traders.
⚠️ Top 10 holdings are not public (early-stage Initia); tracking is not possible.
🔴 What remains unknown
- No tracking of publicly known wallet addresses (GoPlus returned 404)
- Unable to view smart contract call data for contracts deployed on Initia
【Trading recommendations】
① Holders: Immediately reduce positions to a core holding (around $0.24) and wait for selling pressure to ease
② No position: Stay out! Don’t try to catch a falling knife
③ Shorting: If it rebounds above $0.26→$0.28, there’s room to short (stop-loss at $0.30)
④ Rebound confirmation: Consider entering only after the hourly candle holds above $0.24 for more than 30 minutes
⑤ Next pulse: Expected to rally again from $0.24→$0.28 during this cycle; look for confirmation signals and increased volume
#INIT #Initia #WhaleWatch #WhaleTracking #FuturesManipulation #ExtremeVolatility #risque
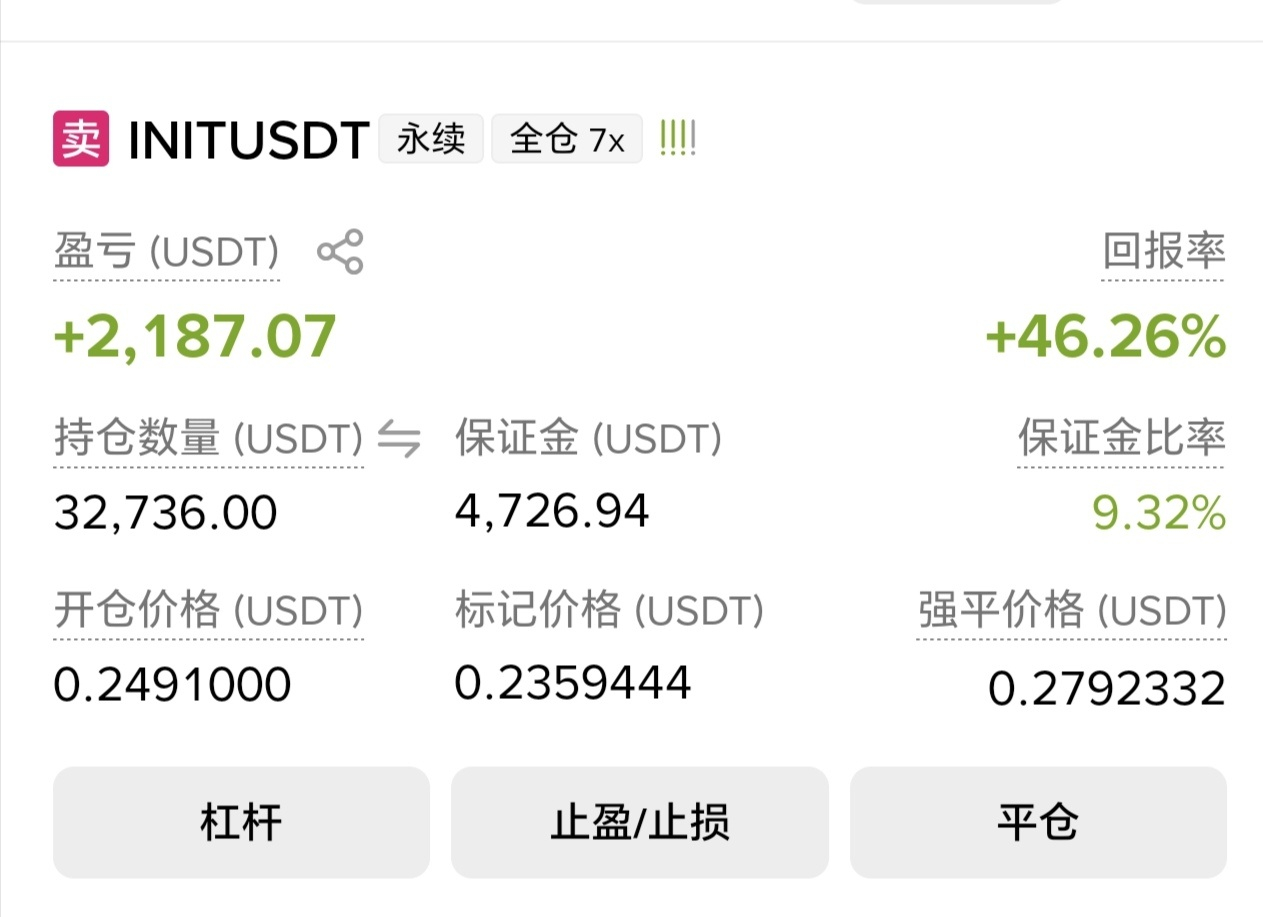
228
·
--
📊 BTC is undergoing a deep correction: from $81,196 down to $73,342. A detailed look at the current situation
🔴 Live monitoring (23:50 Beijing time)
Sources: fapi.binance.com + data-api.binance.vision
- Spot price: $73,342.73 (down 2.82% in 24h)
- Futures price: $73,300.00 (down 2.89% in 24h)
- 24h high: $75,565.86
- 24h low: $72,866.00
- 24h trading volume: 1.047 billion USDT (heavy-volume decline)
【Daily candlestick trend】(last 7 candles)
• 11-04 O:$77,453 H:$81,196 L:$75,736 C:$80,504 (rise on heavy volume)
• 11-05 O:$80,504 H:$80,918 L:$75,208 C:$76,088 (sharp drop of 5.3%)
• 11-06 O:$76,088 H:$76,416 L:$74,888 C:$75,844 (consolidation on very low volume)
• 11-07 O:$75,844 H:$76,250 L:$75,571 C:$75,868 (stabilizing)
• 11-08 O:$75,868 H:$76,200 L:$73,510 C:$74,851 (heavy-volume decline)
• 11-09 O:$74,851 H:$75,599 L:$73,750 C:$75,368 (weak resistance from small buyers)
• 11-10 O:$75,368 H:$75,442 L:$72,866 C:$73,150 (steady decline on heavy volume)
Six consecutive days of declines, totaling as much as 7.8%, with prices retreating from the high of $81,196 to the $73,342 range.
【Trading suggestions】
① Strict flat-position criteria: As long as $72,800 holds, stay flat and wait on the sidelines in the short term.
② Rebound confirmation signal: Wait for an hourly candle to close bullish on increased volume above $74,500.
③ Bearish strategy: Look to sell short on a rebound toward the $73,500–$74,000 area.
④ Support breakdown: If $72,800 breaks, exit with a stop-loss or reverse into a short position.
⚠️ Current trend: The MACD has a bearish crossover, all moving averages are in bearish alignment (EMA5<EMA10<EMA20<EMA60), and the downtrend channel is widening. This means any rebound may be temporary noise; the trend matters most.
#BTC #Bitcoin #MarketAnalysis #ShortSellingStrategy #SupportLevel #BTC下跌
📊 BTC is undergoing a deep correction: from $81,196 down to $73,342. A detailed look at the current situation
🔴 Live monitoring (23:50 Beijing time)
Sources: fapi.binance.com + data-api.binance.vision
- Spot price: $73,342.73 (down 2.82% in 24h)
- Futures price: $73,300.00 (down 2.89% in 24h)
- 24h high: $75,565.86
- 24h low: $72,866.00
- 24h trading volume: 1.047 billion USDT (heavy-volume decline)
【Daily candlestick trend】(last 7 candles)
• 11-04 O:$77,453 H:$81,196 L:$75,736 C:$80,504 (rise on heavy volume)
• 11-05 O:$80,504 H:$80,918 L:$75,208 C:$76,088 (sharp drop of 5.3%)
• 11-06 O:$76,088 H:$76,416 L:$74,888 C:$75,844 (consolidation on very low volume)
• 11-07 O:$75,844 H:$76,250 L:$75,571 C:$75,868 (stabilizing)
• 11-08 O:$75,868 H:$76,200 L:$73,510 C:$74,851 (heavy-volume decline)
• 11-09 O:$74,851 H:$75,599 L:$73,750 C:$75,368 (weak resistance from small buyers)
• 11-10 O:$75,368 H:$75,442 L:$72,866 C:$73,150 (steady decline on heavy volume)
Six consecutive days of declines, totaling as much as 7.8%, with prices retreating from the high of $81,196 to the $73,342 range.
【Trading suggestions】
① Strict flat-position criteria: As long as $72,800 holds, stay flat and wait on the sidelines in the short term.
② Rebound confirmation signal: Wait for an hourly candle to close bullish on increased volume above $74,500.
③ Bearish strategy: Look to sell short on a rebound toward the $73,500–$74,000 area.
④ Support breakdown: If $72,800 breaks, exit with a stop-loss or reverse into a short position.
⚠️ Current trend: The MACD has a bearish crossover, all moving averages are in bearish alignment (EMA5<EMA10<EMA20<EMA60), and the downtrend channel is widening. This means any rebound may be temporary noise; the trend matters most.
#BTC #Bitcoin #MarketAnalysis #ShortSellingStrategy #SupportLevel #BTC下跌
🔴 Live monitoring (23:50 Beijing time)
Sources: fapi.binance.com + data-api.binance.vision
- Spot price: $73,342.73 (down 2.82% in 24h)
- Futures price: $73,300.00 (down 2.89% in 24h)
- 24h high: $75,565.86
- 24h low: $72,866.00
- 24h trading volume: 1.047 billion USDT (heavy-volume decline)
【Daily candlestick trend】(last 7 candles)
• 11-04 O:$77,453 H:$81,196 L:$75,736 C:$80,504 (rise on heavy volume)
• 11-05 O:$80,504 H:$80,918 L:$75,208 C:$76,088 (sharp drop of 5.3%)
• 11-06 O:$76,088 H:$76,416 L:$74,888 C:$75,844 (consolidation on very low volume)
• 11-07 O:$75,844 H:$76,250 L:$75,571 C:$75,868 (stabilizing)
• 11-08 O:$75,868 H:$76,200 L:$73,510 C:$74,851 (heavy-volume decline)
• 11-09 O:$74,851 H:$75,599 L:$73,750 C:$75,368 (weak resistance from small buyers)
• 11-10 O:$75,368 H:$75,442 L:$72,866 C:$73,150 (steady decline on heavy volume)
Six consecutive days of declines, totaling as much as 7.8%, with prices retreating from the high of $81,196 to the $73,342 range.
【Trading suggestions】
① Strict flat-position criteria: As long as $72,800 holds, stay flat and wait on the sidelines in the short term.
② Rebound confirmation signal: Wait for an hourly candle to close bullish on increased volume above $74,500.
③ Bearish strategy: Look to sell short on a rebound toward the $73,500–$74,000 area.
④ Support breakdown: If $72,800 breaks, exit with a stop-loss or reverse into a short position.
⚠️ Current trend: The MACD has a bearish crossover, all moving averages are in bearish alignment (EMA5<EMA10<EMA20<EMA60), and the downtrend channel is widening. This means any rebound may be temporary noise; the trend matters most.
#BTC #Bitcoin #MarketAnalysis #ShortSellingStrategy #SupportLevel #BTC下跌
443
·
--
📊 JCTUSDT’s Catastrophic Crash: From $0.012285 to $0.005834, Breaking Through Every Support Level
📡 Data as of: 2026-11-10 15:44 Beijing Time
Source: fapi.binance.com (Binance Futures API) + on-chain queries
🔴 Current price: $0.0058340
📉 24h change: -30.48% 🔴
🔺 24h high: $0.0117680 (reached today)
🔻 24h low: $0.0057200 (already hit)
💵 24h trading volume: 72.7 billion USDT (heavy-volume decline)
【10 Consecutive Bearish Candles】 (the last 10 candles all closed lower)
• 04:00 0.011291 → 0.010878 (selling at the highs begins)
• 05:00 0.010879 → 0.010737
• 06:00 0.010736 → 0.010597
• 07:00 0.010598 → 0.009600 (heavy-volume breakdown; volume surged to 3.49 billion)
• 08:00 0.009596 → 0.008931
• 09:00 0.008934 → 0.008271
• 10:00 0.008273 → 0.007559
• 11:00 0.007555 → 0.007033
• 12:00 0.007033 → 0.006507
• 13:00 0.006506 → 0.005814 (latest, with volume continuing to rise)
Full price movement:
$0.00350 (launch) → $0.012285 (6x peak) → now $0.005834 (down 52%; the round trip is complete)
【Trading Recommendations: Final Version】
① Existing positions: Close all positions and cut losses, or place an order at $0.00560 and wait for the decline to stop (a price below this level means the downtrend is not over)
② New positions: Stay flat and watch; don't touch it until its total market cap exceeds $10 billion
③ Short signal: The price is currently declining steadily; don't go long below $0.005834
④ Rebound signal: Wait for the first bullish candle to close for confirmation (above 0.005814), then cover your short
【Whale Watch】 (the trend remains under pressure)
The top 5 holders account for about 65% combined (Whale D 17.58% / Whale E 16.08%)
The hourly decline suggests whales are systematically selling their holdings or being liquidated on leverage
【Conclusion】
⚠️ This is a typical Pump & Dump cycle
⚠️ The full 6x surge → 52% crash has already played out
⚠️ The market is now in a “gray area” (oversold), but the trend is extremely weak
💀 Trading advice: Buy when nobody cares; sell when everyone is celebrating. The “nobody cares” phase is now nearing its end. Wait for the gap to fill; don't chase the short.
#JCT #BSC #Futures #FOMO #Analysis #大户追踪
📊 JCTUSDT’s Catastrophic Crash: From $0.012285 to $0.005834, Breaking Through Every Support Level
📡 Data as of: 2026-11-10 15:44 Beijing Time
Source: fapi.binance.com (Binance Futures API) + on-chain queries
🔴 Current price: $0.0058340
📉 24h change: -30.48% 🔴
🔺 24h high: $0.0117680 (reached today)
🔻 24h low: $0.0057200 (already hit)
💵 24h trading volume: 72.7 billion USDT (heavy-volume decline)
【10 Consecutive Bearish Candles】 (the last 10 candles all closed lower)
• 04:00 0.011291 → 0.010878 (selling at the highs begins)
• 05:00 0.010879 → 0.010737
• 06:00 0.010736 → 0.010597
• 07:00 0.010598 → 0.009600 (heavy-volume breakdown; volume surged to 3.49 billion)
• 08:00 0.009596 → 0.008931
• 09:00 0.008934 → 0.008271
• 10:00 0.008273 → 0.007559
• 11:00 0.007555 → 0.007033
• 12:00 0.007033 → 0.006507
• 13:00 0.006506 → 0.005814 (latest, with volume continuing to rise)
Full price movement:
$0.00350 (launch) → $0.012285 (6x peak) → now $0.005834 (down 52%; the round trip is complete)
【Trading Recommendations: Final Version】
① Existing positions: Close all positions and cut losses, or place an order at $0.00560 and wait for the decline to stop (a price below this level means the downtrend is not over)
② New positions: Stay flat and watch; don't touch it until its total market cap exceeds $10 billion
③ Short signal: The price is currently declining steadily; don't go long below $0.005834
④ Rebound signal: Wait for the first bullish candle to close for confirmation (above 0.005814), then cover your short
【Whale Watch】 (the trend remains under pressure)
The top 5 holders account for about 65% combined (Whale D 17.58% / Whale E 16.08%)
The hourly decline suggests whales are systematically selling their holdings or being liquidated on leverage
【Conclusion】
⚠️ This is a typical Pump & Dump cycle
⚠️ The full 6x surge → 52% crash has already played out
⚠️ The market is now in a “gray area” (oversold), but the trend is extremely weak
💀 Trading advice: Buy when nobody cares; sell when everyone is celebrating. The “nobody cares” phase is now nearing its end. Wait for the gap to fill; don't chase the short.
#JCT #BSC #Futures #FOMO #Analysis #大户追踪
📡 Data as of: 2026-11-10 15:44 Beijing Time
Source: fapi.binance.com (Binance Futures API) + on-chain queries
🔴 Current price: $0.0058340
📉 24h change: -30.48% 🔴
🔺 24h high: $0.0117680 (reached today)
🔻 24h low: $0.0057200 (already hit)
💵 24h trading volume: 72.7 billion USDT (heavy-volume decline)
【10 Consecutive Bearish Candles】 (the last 10 candles all closed lower)
• 04:00 0.011291 → 0.010878 (selling at the highs begins)
• 05:00 0.010879 → 0.010737
• 06:00 0.010736 → 0.010597
• 07:00 0.010598 → 0.009600 (heavy-volume breakdown; volume surged to 3.49 billion)
• 08:00 0.009596 → 0.008931
• 09:00 0.008934 → 0.008271
• 10:00 0.008273 → 0.007559
• 11:00 0.007555 → 0.007033
• 12:00 0.007033 → 0.006507
• 13:00 0.006506 → 0.005814 (latest, with volume continuing to rise)
Full price movement:
$0.00350 (launch) → $0.012285 (6x peak) → now $0.005834 (down 52%; the round trip is complete)
【Trading Recommendations: Final Version】
① Existing positions: Close all positions and cut losses, or place an order at $0.00560 and wait for the decline to stop (a price below this level means the downtrend is not over)
② New positions: Stay flat and watch; don't touch it until its total market cap exceeds $10 billion
③ Short signal: The price is currently declining steadily; don't go long below $0.005834
④ Rebound signal: Wait for the first bullish candle to close for confirmation (above 0.005814), then cover your short
【Whale Watch】 (the trend remains under pressure)
The top 5 holders account for about 65% combined (Whale D 17.58% / Whale E 16.08%)
The hourly decline suggests whales are systematically selling their holdings or being liquidated on leverage
【Conclusion】
⚠️ This is a typical Pump & Dump cycle
⚠️ The full 6x surge → 52% crash has already played out
⚠️ The market is now in a “gray area” (oversold), but the trend is extremely weak
💀 Trading advice: Buy when nobody cares; sell when everyone is celebrating. The “nobody cares” phase is now nearing its end. Wait for the gap to fill; don't chase the short.
#JCT #BSC #Futures #FOMO #Analysis #大户追踪
1
423
·
--
📊 $JCT USDT In-Depth Report|54% Pullback After 6x Surge|0xb8e6d3 Continues to Add to Position
📡 Data time: 2026-11-09 21:45 Beijing time
Source: fapi.binance.com + GoPlus on-chain data
🔴 Current price: $0.0091340
📉 24h change: -17.89%
🔺 24h high: $0.0213440 (peaked at 11-08 20:00 UTC)
🔻 24h low: $0.0073700 (bottomed at 11-09 04:00 UTC)
💵 24h trading volume: 1.808 billion USDT
【4h Candlestick Trend】
• 11-06 ~ 11-08 08:00 UTC: Gradual climb from $0.0035 → $0.0118
• 11-08 20:00 UTC: Explosive surge from $0.0118 → $0.0213 (6x peak)
• 11-09 04:00 UTC: Broke through the low at $0.00737 (-54%, 4x retracement)
• Current price of $0.00913 is below the 24h average of $0.01097; the market is in unrealized loss
【Conclusion】Full 6x pump → 54% dump
⚠️ Short-term risk: The explosive rise and fall has played out; volatility is extreme
📈 Mid-term outlook: Major players are still accumulating
【On-Chain Whale Holdings】GoPlus real-time data
• 0x8dac (Whale D) 17.58% ⭐
• 0x69be (Whale E) 16.08% ⭐
• 0x73d8bd (Whale A) 13.54% ⭐
• 0xa4856e (Whale C) 12.09% ⭐
• 0xb8e6d3 5.65% ⬆️|Added to position, increasing from 2.74% to 5.65% (ranked 5th)
The top 5 hold approximately 65% combined; 16,857 holders; 0% tax
【Signal】Token holdings are highly concentrated. 0xb8e6d3 continues to accumulate; watch for trigger points.
$JCT #BSC #Futures #TechnicalAnalysis #WhaleTracking
📊 $JCT USDT In-Depth Report|54% Pullback After 6x Surge|0xb8e6d3 Continues to Add to Position
📡 Data time: 2026-11-09 21:45 Beijing time
Source: fapi.binance.com + GoPlus on-chain data
🔴 Current price: $0.0091340
📉 24h change: -17.89%
🔺 24h high: $0.0213440 (peaked at 11-08 20:00 UTC)
🔻 24h low: $0.0073700 (bottomed at 11-09 04:00 UTC)
💵 24h trading volume: 1.808 billion USDT
【4h Candlestick Trend】
• 11-06 ~ 11-08 08:00 UTC: Gradual climb from $0.0035 → $0.0118
• 11-08 20:00 UTC: Explosive surge from $0.0118 → $0.0213 (6x peak)
• 11-09 04:00 UTC: Broke through the low at $0.00737 (-54%, 4x retracement)
• Current price of $0.00913 is below the 24h average of $0.01097; the market is in unrealized loss
【Conclusion】Full 6x pump → 54% dump
⚠️ Short-term risk: The explosive rise and fall has played out; volatility is extreme
📈 Mid-term outlook: Major players are still accumulating
【On-Chain Whale Holdings】GoPlus real-time data
• 0x8dac (Whale D) 17.58% ⭐
• 0x69be (Whale E) 16.08% ⭐
• 0x73d8bd (Whale A) 13.54% ⭐
• 0xa4856e (Whale C) 12.09% ⭐
• 0xb8e6d3 5.65% ⬆️|Added to position, increasing from 2.74% to 5.65% (ranked 5th)
The top 5 hold approximately 65% combined; 16,857 holders; 0% tax
【Signal】Token holdings are highly concentrated. 0xb8e6d3 continues to accumulate; watch for trigger points.
$JCT #BSC #Futures #TechnicalAnalysis #WhaleTracking
📡 Data time: 2026-11-09 21:45 Beijing time
Source: fapi.binance.com + GoPlus on-chain data
🔴 Current price: $0.0091340
📉 24h change: -17.89%
🔺 24h high: $0.0213440 (peaked at 11-08 20:00 UTC)
🔻 24h low: $0.0073700 (bottomed at 11-09 04:00 UTC)
💵 24h trading volume: 1.808 billion USDT
【4h Candlestick Trend】
• 11-06 ~ 11-08 08:00 UTC: Gradual climb from $0.0035 → $0.0118
• 11-08 20:00 UTC: Explosive surge from $0.0118 → $0.0213 (6x peak)
• 11-09 04:00 UTC: Broke through the low at $0.00737 (-54%, 4x retracement)
• Current price of $0.00913 is below the 24h average of $0.01097; the market is in unrealized loss
【Conclusion】Full 6x pump → 54% dump
⚠️ Short-term risk: The explosive rise and fall has played out; volatility is extreme
📈 Mid-term outlook: Major players are still accumulating
【On-Chain Whale Holdings】GoPlus real-time data
• 0x8dac (Whale D) 17.58% ⭐
• 0x69be (Whale E) 16.08% ⭐
• 0x73d8bd (Whale A) 13.54% ⭐
• 0xa4856e (Whale C) 12.09% ⭐
• 0xb8e6d3 5.65% ⬆️|Added to position, increasing from 2.74% to 5.65% (ranked 5th)
The top 5 hold approximately 65% combined; 16,857 holders; 0% tax
【Signal】Token holdings are highly concentrated. 0xb8e6d3 continues to accumulate; watch for trigger points.
$JCT #BSC #Futures #TechnicalAnalysis #WhaleTracking
349
·
--
🔥 JCT Deep Dive: Whales A/B/C Revealed—Who’s Accumulating and Who’s Dumping?
📊 Latest on-chain data (real-time, GoPlus)
Contract: 0xea37...cb17707 (BSC)
Holders: 16634 (+86)
Combined holdings of top 9: 75.4% (highly concentrated)
Liquidity pools: 88
Tax rate: 0% buy / 0% sell (no tax)
Creator holdings: 0% (fully exited)
I. Changes in the Three Whales’ Holdings
Whale A 0xa485…f10 12.00% → 12.10% ⬆️ (increased holdings)
Whale B 0x53f7…b23 4.04% → 4.27% ⬆️ (increased holdings)
Whale C 0xed9a…a771 2.92% → 2.82% ⬇️ (reduced holdings)
Whales A and B both increased their holdings, while Whale C trimmed slightly. Two signals:
1. Real capital is accumulating against the trend
2. C may be a retail holder or reducing exposure
II. Detailed Analysis of Whale A
Address label: Contract ✅ (contract analysis required; not an EOA wallet)
Share: 12.1%
Assessment: This is a contract address, meaning it’s a one-click deployed wallet. An increase in holdings by a contract address suggests:
① It may be a pre-programmed scheduled buying bot
② Or they may be testing liquidity
III. Top Ten Holdings
1. 0x8dac…1ae18 17.58% (contract + IDEX, sitting tight)
2. 0x69be…236ee 16.08% (contract)
3. 0x73d8…46db 12.11% (contract)
4. Whale A 12.10% (contract address)
5. 0x17a3…cfc4a8 5.28% (contract)
6. Whale B 4.27% (contract address)
7. Whale C 2.82% (contract address)
8. 0xb8e6…c56ce 2.74% (contract)
9. 0xc2e9…50fe2a9 2.42% (contract)
All are contract addresses, suggesting large positions are being traded automatically, with some major influencers also using trading bots.
IV. Conclusion
- Whales A and B are steadily accumulating, while Whale C is reducing its holdings
- There are 88 liquidity pools, and token holdings are not widely distributed
- Suggestion: Watch the flow of funds in whale addresses; entry costs are between $0.004 and $0.014
Do you think JCT could repeat OTOM’s explosive surge? Let’s discuss in the comments 👇
🔥 JCT Deep Dive: Whales A/B/C Revealed—Who’s Accumulating and Who’s Dumping?
📊 Latest on-chain data (real-time, GoPlus)
Contract: 0xea37...cb17707 (BSC)
Holders: 16634 (+86)
Combined holdings of top 9: 75.4% (highly concentrated)
Liquidity pools: 88
Tax rate: 0% buy / 0% sell (no tax)
Creator holdings: 0% (fully exited)
I. Changes in the Three Whales’ Holdings
Whale A 0xa485…f10 12.00% → 12.10% ⬆️ (increased holdings)
Whale B 0x53f7…b23 4.04% → 4.27% ⬆️ (increased holdings)
Whale C 0xed9a…a771 2.92% → 2.82% ⬇️ (reduced holdings)
Whales A and B both increased their holdings, while Whale C trimmed slightly. Two signals:
1. Real capital is accumulating against the trend
2. C may be a retail holder or reducing exposure
II. Detailed Analysis of Whale A
Address label: Contract ✅ (contract analysis required; not an EOA wallet)
Share: 12.1%
Assessment: This is a contract address, meaning it’s a one-click deployed wallet. An increase in holdings by a contract address suggests:
① It may be a pre-programmed scheduled buying bot
② Or they may be testing liquidity
III. Top Ten Holdings
1. 0x8dac…1ae18 17.58% (contract + IDEX, sitting tight)
2. 0x69be…236ee 16.08% (contract)
3. 0x73d8…46db 12.11% (contract)
4. Whale A 12.10% (contract address)
5. 0x17a3…cfc4a8 5.28% (contract)
6. Whale B 4.27% (contract address)
7. Whale C 2.82% (contract address)
8. 0xb8e6…c56ce 2.74% (contract)
9. 0xc2e9…50fe2a9 2.42% (contract)
All are contract addresses, suggesting large positions are being traded automatically, with some major influencers also using trading bots.
IV. Conclusion
- Whales A and B are steadily accumulating, while Whale C is reducing its holdings
- There are 88 liquidity pools, and token holdings are not widely distributed
- Suggestion: Watch the flow of funds in whale addresses; entry costs are between $0.004 and $0.014
Do you think JCT could repeat OTOM’s explosive surge? Let’s discuss in the comments 👇
📊 Latest on-chain data (real-time, GoPlus)
Contract: 0xea37...cb17707 (BSC)
Holders: 16634 (+86)
Combined holdings of top 9: 75.4% (highly concentrated)
Liquidity pools: 88
Tax rate: 0% buy / 0% sell (no tax)
Creator holdings: 0% (fully exited)
I. Changes in the Three Whales’ Holdings
Whale A 0xa485…f10 12.00% → 12.10% ⬆️ (increased holdings)
Whale B 0x53f7…b23 4.04% → 4.27% ⬆️ (increased holdings)
Whale C 0xed9a…a771 2.92% → 2.82% ⬇️ (reduced holdings)
Whales A and B both increased their holdings, while Whale C trimmed slightly. Two signals:
1. Real capital is accumulating against the trend
2. C may be a retail holder or reducing exposure
II. Detailed Analysis of Whale A
Address label: Contract ✅ (contract analysis required; not an EOA wallet)
Share: 12.1%
Assessment: This is a contract address, meaning it’s a one-click deployed wallet. An increase in holdings by a contract address suggests:
① It may be a pre-programmed scheduled buying bot
② Or they may be testing liquidity
III. Top Ten Holdings
1. 0x8dac…1ae18 17.58% (contract + IDEX, sitting tight)
2. 0x69be…236ee 16.08% (contract)
3. 0x73d8…46db 12.11% (contract)
4. Whale A 12.10% (contract address)
5. 0x17a3…cfc4a8 5.28% (contract)
6. Whale B 4.27% (contract address)
7. Whale C 2.82% (contract address)
8. 0xb8e6…c56ce 2.74% (contract)
9. 0xc2e9…50fe2a9 2.42% (contract)
All are contract addresses, suggesting large positions are being traded automatically, with some major influencers also using trading bots.
IV. Conclusion
- Whales A and B are steadily accumulating, while Whale C is reducing its holdings
- There are 88 liquidity pools, and token holdings are not widely distributed
- Suggestion: Watch the flow of funds in whale addresses; entry costs are between $0.004 and $0.014
Do you think JCT could repeat OTOM’s explosive surge? Let’s discuss in the comments 👇
66
·
--
🔥 Nov 9 Perpetual Futures Gainers Breakdown: Can You Chase These Exploding Coins?
📊 Market (01:00): BTC $75,721 | ETH $2,226 | BNB $696 | SOL $88.97
The market is moving sideways with a slight dip. Capital is rotating out of major coins and into newly listed small-cap coins—at times like this, the gainers leaderboard is less an opportunity and more a place to get dumped on.
1. 24h Gainers (USDT-Margined Perpetuals)
JCT +285% ($0.01116)
AIOT +49.8% ($0.1737)
SKYAI +21.5% ($0.0364)
ON +19.9% ($0.1967)
HOT +16.6% ($0.0004161)
TA +13.0% ($0.1092)
HANA +12.6% ($0.01525)
RSR +11.2% ($0.001705)
2. In Focus: JCT (Janction)
📌 Stats: Market cap $123M (#143) | FDV $534M | Circulating supply 11.494B / total supply 50B (just 23%) | 24h volume $209M, volume/market cap 170% | ATH $0.0141 (just set on Nov 8) | ATL $0.00106
📈 Technicals: 24h range 0.002512→0.014888, nearly a 6x swing; current price is down about 25% from the high. After a vertical rally, it’s consolidating near the top with no support structure.
⚙️ Catalysts: Binance Alpha trading competition + newly launched perpetuals. This is event-driven, not performance-driven.
💸 Funding rate (settled every 4 hours): currently 0.23185%/4h ≈ 1.39%/day; the Nov 8 20:00 rate was 0.354%/4h ≈ 2.12%/day, or 775% annualized.
→ If you’re 10x long, funding alone eats up 13%+ of your margin in one day. You’re not fighting the market—you’re paying rent to the shorts.
3. What They Have in Common (Most Important)
They’re all small-cap, new Alpha listings with extremely high turnover, and none are rising on the back of revenue. ON has just $827K in liquidity, and TA just $322K—one red candle could send prices plunging.
4. Suggestions
🟢 Stay out: safest option
🟡 If you trade: day-trade only, position size ≤5%, always use a stop-loss, and never hold overnight and pay funding
🔴 If you hold spot: take half off first when volume spikes and price surges
⚪ Signs the rally is fading: funding falls back to 0.01%, volume halves, or price breaks below the day’s VWAP
5. Risks
⚠️ Volatility in new small-cap perpetuals can be 10x or more than that of major coins.
⚠️ High funding ≠ strong bullish sentiment; it means longs are so crowded they’re paying others to take the other side.
⚠️ Only 23% of JCT is circulating, and token unlocks pose long-term selling pressure.
⚠️ Alpha events have a clearly defined end time—don’t mistake them for a trend.
⚠️ Not investment advice. You are responsible for your own gains and losses.
The gainers leaderboard is a report card for people already holding—not an entry ticket for those sitting out. What do you think? 👇
🔥 Nov 9 Perpetual Futures Gainers Breakdown: Can You Chase These Exploding Coins?
📊 Market (01:00): BTC $75,721 | ETH $2,226 | BNB $696 | SOL $88.97
The market is moving sideways with a slight dip. Capital is rotating out of major coins and into newly listed small-cap coins—at times like this, the gainers leaderboard is less an opportunity and more a place to get dumped on.
1. 24h Gainers (USDT-Margined Perpetuals)
JCT +285% ($0.01116)
AIOT +49.8% ($0.1737)
SKYAI +21.5% ($0.0364)
ON +19.9% ($0.1967)
HOT +16.6% ($0.0004161)
TA +13.0% ($0.1092)
HANA +12.6% ($0.01525)
RSR +11.2% ($0.001705)
2. In Focus: JCT (Janction)
📌 Stats: Market cap $123M (#143) | FDV $534M | Circulating supply 11.494B / total supply 50B (just 23%) | 24h volume $209M, volume/market cap 170% | ATH $0.0141 (just set on Nov 8) | ATL $0.00106
📈 Technicals: 24h range 0.002512→0.014888, nearly a 6x swing; current price is down about 25% from the high. After a vertical rally, it’s consolidating near the top with no support structure.
⚙️ Catalysts: Binance Alpha trading competition + newly launched perpetuals. This is event-driven, not performance-driven.
💸 Funding rate (settled every 4 hours): currently 0.23185%/4h ≈ 1.39%/day; the Nov 8 20:00 rate was 0.354%/4h ≈ 2.12%/day, or 775% annualized.
→ If you’re 10x long, funding alone eats up 13%+ of your margin in one day. You’re not fighting the market—you’re paying rent to the shorts.
3. What They Have in Common (Most Important)
They’re all small-cap, new Alpha listings with extremely high turnover, and none are rising on the back of revenue. ON has just $827K in liquidity, and TA just $322K—one red candle could send prices plunging.
4. Suggestions
🟢 Stay out: safest option
🟡 If you trade: day-trade only, position size ≤5%, always use a stop-loss, and never hold overnight and pay funding
🔴 If you hold spot: take half off first when volume spikes and price surges
⚪ Signs the rally is fading: funding falls back to 0.01%, volume halves, or price breaks below the day’s VWAP
5. Risks
⚠️ Volatility in new small-cap perpetuals can be 10x or more than that of major coins.
⚠️ High funding ≠ strong bullish sentiment; it means longs are so crowded they’re paying others to take the other side.
⚠️ Only 23% of JCT is circulating, and token unlocks pose long-term selling pressure.
⚠️ Alpha events have a clearly defined end time—don’t mistake them for a trend.
⚠️ Not investment advice. You are responsible for your own gains and losses.
The gainers leaderboard is a report card for people already holding—not an entry ticket for those sitting out. What do you think? 👇
📊 Market (01:00): BTC $75,721 | ETH $2,226 | BNB $696 | SOL $88.97
The market is moving sideways with a slight dip. Capital is rotating out of major coins and into newly listed small-cap coins—at times like this, the gainers leaderboard is less an opportunity and more a place to get dumped on.
1. 24h Gainers (USDT-Margined Perpetuals)
JCT +285% ($0.01116)
AIOT +49.8% ($0.1737)
SKYAI +21.5% ($0.0364)
ON +19.9% ($0.1967)
HOT +16.6% ($0.0004161)
TA +13.0% ($0.1092)
HANA +12.6% ($0.01525)
RSR +11.2% ($0.001705)
2. In Focus: JCT (Janction)
📌 Stats: Market cap $123M (#143) | FDV $534M | Circulating supply 11.494B / total supply 50B (just 23%) | 24h volume $209M, volume/market cap 170% | ATH $0.0141 (just set on Nov 8) | ATL $0.00106
📈 Technicals: 24h range 0.002512→0.014888, nearly a 6x swing; current price is down about 25% from the high. After a vertical rally, it’s consolidating near the top with no support structure.
⚙️ Catalysts: Binance Alpha trading competition + newly launched perpetuals. This is event-driven, not performance-driven.
💸 Funding rate (settled every 4 hours): currently 0.23185%/4h ≈ 1.39%/day; the Nov 8 20:00 rate was 0.354%/4h ≈ 2.12%/day, or 775% annualized.
→ If you’re 10x long, funding alone eats up 13%+ of your margin in one day. You’re not fighting the market—you’re paying rent to the shorts.
3. What They Have in Common (Most Important)
They’re all small-cap, new Alpha listings with extremely high turnover, and none are rising on the back of revenue. ON has just $827K in liquidity, and TA just $322K—one red candle could send prices plunging.
4. Suggestions
🟢 Stay out: safest option
🟡 If you trade: day-trade only, position size ≤5%, always use a stop-loss, and never hold overnight and pay funding
🔴 If you hold spot: take half off first when volume spikes and price surges
⚪ Signs the rally is fading: funding falls back to 0.01%, volume halves, or price breaks below the day’s VWAP
5. Risks
⚠️ Volatility in new small-cap perpetuals can be 10x or more than that of major coins.
⚠️ High funding ≠ strong bullish sentiment; it means longs are so crowded they’re paying others to take the other side.
⚠️ Only 23% of JCT is circulating, and token unlocks pose long-term selling pressure.
⚠️ Alpha events have a clearly defined end time—don’t mistake them for a trend.
⚠️ Not investment advice. You are responsible for your own gains and losses.
The gainers leaderboard is a report card for people already holding—not an entry ticket for those sitting out. What do you think? 👇
159
·
--
💰 November 7: In-Depth Analysis of Three Major Markets—BTC, Gold, and U.S. Stocks
📊 Latest Prices:
• BTC 75,971.9 (+2.90%)
• ETH 2,242.99
• Gold XAU 4,080.02
• SOL 89.89 (-0.58%)
I. BTC Price Analysis
Technical Analysis: BTC is holding above $75,000, with short-term support at $73,500 and resistance at $77,000. A MACD golden cross has formed, and the RSI is around 58—not yet overbought. The weekly chart has closed higher for two consecutive weeks, forming an ascending channel.
Policy and Market Factors: This week, the U.S. was hit by a major nonfarm payrolls data shock, and the market is still digesting the signal that “the impact of the token issuance cycle is unavoidable.” Pay attention to tomorrow, Monday—there may be a rebound. Institutions are broadly bullish on Q4, and the odds of a new high this year are substantial.
Strategy: $73,500 is key support; as long as it holds, the outlook is bullish. Consider taking profits near $77,000.
II. Gold Analysis
XAU rose and then continued rising today, holding above $4,080. A weaker dollar and expectations of interest rate cuts are boosting safe-haven demand.
Technical Analysis: The long-term ascending channel remains intact. $4,000 is strong support, and $4,100 is key resistance. A break above $4,100 would put $4,150 in sight.
Policy and Market Factors: The global wave of central bank rate cuts continues, while expectations of Fed rate cuts are lifting gold valuations.
III. U.S. Tech Stocks
NVDA is at 188.26. Silicon Valley giants face strong energy demand amid expectations of annual infrastructure development in the 8K to 10K range. INTEL is up 1.44% at $56.35. Given mixed performance across individual stocks, consider focusing on computing power and AI.
Falling U.S. Treasury yields are a positive for growth stocks. A pullback in U.S. stocks offers an entry opportunity into the tech bull market.
IV. Overall Strategy
Conservative: Accumulate BTC on dips and hold while it remains above $73,500.
Aggressive: Watch for rebound opportunities in altcoins; ETH and SOL are undergoing technical recoveries.
Stop-loss: Exit decisively if BTC falls below $71,000.
The market may be volatile, but the broader trend is upward. Hold quality assets and don't get shaken out.
What do you think? Can BTC hold above $76,000? Share your view.
💰 November 7: In-Depth Analysis of Three Major Markets—BTC, Gold, and U.S. Stocks
📊 Latest Prices:
• BTC 75,971.9 (+2.90%)
• ETH 2,242.99
• Gold XAU 4,080.02
• SOL 89.89 (-0.58%)
I. BTC Price Analysis
Technical Analysis: BTC is holding above $75,000, with short-term support at $73,500 and resistance at $77,000. A MACD golden cross has formed, and the RSI is around 58—not yet overbought. The weekly chart has closed higher for two consecutive weeks, forming an ascending channel.
Policy and Market Factors: This week, the U.S. was hit by a major nonfarm payrolls data shock, and the market is still digesting the signal that “the impact of the token issuance cycle is unavoidable.” Pay attention to tomorrow, Monday—there may be a rebound. Institutions are broadly bullish on Q4, and the odds of a new high this year are substantial.
Strategy: $73,500 is key support; as long as it holds, the outlook is bullish. Consider taking profits near $77,000.
II. Gold Analysis
XAU rose and then continued rising today, holding above $4,080. A weaker dollar and expectations of interest rate cuts are boosting safe-haven demand.
Technical Analysis: The long-term ascending channel remains intact. $4,000 is strong support, and $4,100 is key resistance. A break above $4,100 would put $4,150 in sight.
Policy and Market Factors: The global wave of central bank rate cuts continues, while expectations of Fed rate cuts are lifting gold valuations.
III. U.S. Tech Stocks
NVDA is at 188.26. Silicon Valley giants face strong energy demand amid expectations of annual infrastructure development in the 8K to 10K range. INTEL is up 1.44% at $56.35. Given mixed performance across individual stocks, consider focusing on computing power and AI.
Falling U.S. Treasury yields are a positive for growth stocks. A pullback in U.S. stocks offers an entry opportunity into the tech bull market.
IV. Overall Strategy
Conservative: Accumulate BTC on dips and hold while it remains above $73,500.
Aggressive: Watch for rebound opportunities in altcoins; ETH and SOL are undergoing technical recoveries.
Stop-loss: Exit decisively if BTC falls below $71,000.
The market may be volatile, but the broader trend is upward. Hold quality assets and don't get shaken out.
What do you think? Can BTC hold above $76,000? Share your view.
📊 Latest Prices:
• BTC 75,971.9 (+2.90%)
• ETH 2,242.99
• Gold XAU 4,080.02
• SOL 89.89 (-0.58%)
I. BTC Price Analysis
Technical Analysis: BTC is holding above $75,000, with short-term support at $73,500 and resistance at $77,000. A MACD golden cross has formed, and the RSI is around 58—not yet overbought. The weekly chart has closed higher for two consecutive weeks, forming an ascending channel.
Policy and Market Factors: This week, the U.S. was hit by a major nonfarm payrolls data shock, and the market is still digesting the signal that “the impact of the token issuance cycle is unavoidable.” Pay attention to tomorrow, Monday—there may be a rebound. Institutions are broadly bullish on Q4, and the odds of a new high this year are substantial.
Strategy: $73,500 is key support; as long as it holds, the outlook is bullish. Consider taking profits near $77,000.
II. Gold Analysis
XAU rose and then continued rising today, holding above $4,080. A weaker dollar and expectations of interest rate cuts are boosting safe-haven demand.
Technical Analysis: The long-term ascending channel remains intact. $4,000 is strong support, and $4,100 is key resistance. A break above $4,100 would put $4,150 in sight.
Policy and Market Factors: The global wave of central bank rate cuts continues, while expectations of Fed rate cuts are lifting gold valuations.
III. U.S. Tech Stocks
NVDA is at 188.26. Silicon Valley giants face strong energy demand amid expectations of annual infrastructure development in the 8K to 10K range. INTEL is up 1.44% at $56.35. Given mixed performance across individual stocks, consider focusing on computing power and AI.
Falling U.S. Treasury yields are a positive for growth stocks. A pullback in U.S. stocks offers an entry opportunity into the tech bull market.
IV. Overall Strategy
Conservative: Accumulate BTC on dips and hold while it remains above $73,500.
Aggressive: Watch for rebound opportunities in altcoins; ETH and SOL are undergoing technical recoveries.
Stop-loss: Exit decisively if BTC falls below $71,000.
The market may be volatile, but the broader trend is upward. Hold quality assets and don't get shaken out.
What do you think? Can BTC hold above $76,000? Share your view.
256
·
--
📊 XAU/USD Market Update Today: Gold Is Pulling Back and Consolidating
💰 Latest price: $4,059.68 (XAUUSDT )
📉 24h change: -1.41%
Precious metals are pulling back across the board today. BTC is also down more than 2.8% at $75,187.
ETH is near $2,219, down almost 4%. The broader market is weakening.
Why is gold falling?
1️⃣ The US dollar is rebounding, putting pressure on XAU prices
2️⃣ Some investors are taking profits, creating short-term selling pressure
3️⃣ Expectations for Fed rate cuts have been pushed back somewhat
Short-term support: $4,020 (watch to see if it holds)
Resistance: $4,080 (potential resistance on a rebound)
Strategy suggestions:
✅ Long-term and medium-term investors can build positions on dips (watch the $4,000 range)
✅ Short-term traders should use tight stop-losses
❌ Don’t chase shorts in a downtrend
The overall market is weak today. Stay patient as XAU undergoes a correction.
What do you think? Is $4,000 a short-term bottom, or will prices keep falling?
📊 XAU/USD Market Update Today: Gold Is Pulling Back and Consolidating
💰 Latest price: $4,059.68 (XAUUSDT )
📉 24h change: -1.41%
Precious metals are pulling back across the board today. BTC is also down more than 2.8% at $75,187.
ETH is near $2,219, down almost 4%. The broader market is weakening.
Why is gold falling?
1️⃣ The US dollar is rebounding, putting pressure on XAU prices
2️⃣ Some investors are taking profits, creating short-term selling pressure
3️⃣ Expectations for Fed rate cuts have been pushed back somewhat
Short-term support: $4,020 (watch to see if it holds)
Resistance: $4,080 (potential resistance on a rebound)
Strategy suggestions:
✅ Long-term and medium-term investors can build positions on dips (watch the $4,000 range)
✅ Short-term traders should use tight stop-losses
❌ Don’t chase shorts in a downtrend
The overall market is weak today. Stay patient as XAU undergoes a correction.
What do you think? Is $4,000 a short-term bottom, or will prices keep falling?
💰 Latest price: $4,059.68 (XAUUSDT )
📉 24h change: -1.41%
Precious metals are pulling back across the board today. BTC is also down more than 2.8% at $75,187.
ETH is near $2,219, down almost 4%. The broader market is weakening.
Why is gold falling?
1️⃣ The US dollar is rebounding, putting pressure on XAU prices
2️⃣ Some investors are taking profits, creating short-term selling pressure
3️⃣ Expectations for Fed rate cuts have been pushed back somewhat
Short-term support: $4,020 (watch to see if it holds)
Resistance: $4,080 (potential resistance on a rebound)
Strategy suggestions:
✅ Long-term and medium-term investors can build positions on dips (watch the $4,000 range)
✅ Short-term traders should use tight stop-losses
❌ Don’t chase shorts in a downtrend
The overall market is weak today. Stay patient as XAU undergoes a correction.
What do you think? Is $4,000 a short-term bottom, or will prices keep falling?
646
·
--
🔥BTC Breaks Above $80,000! 3 Key Signals Every Trader Should Watch
BTC decisively broke through the $80,000 mark today, with trading volume surging 60%!
Price action analysis:
1️⃣ Rising volume is the key signal — over the past 7 days, trading volume has consistently exceeded twice its previous level
2️⃣ On-chain data offers support — institutional addresses are accelerating their daily net accumulation
3️⃣ Key resistance has been tested — two strong coins, BNB and EV1, have hit new highs
Trading reminder:
⚠️ Although BTC has reached a new high, it may continue to move sideways in the short term
Be patient! Good traders don’t chase highs. Wait for a pullback to stabilize before entering.
What’s your current BTC cost basis? Share your entry strategy in the comments 📈
#BTC #PriceTrend #TechnicalAnalysis #OnChainData
🔥BTC Breaks Above $80,000! 3 Key Signals Every Trader Should Watch
BTC decisively broke through the $80,000 mark today, with trading volume surging 60%!
Price action analysis:
1️⃣ Rising volume is the key signal — over the past 7 days, trading volume has consistently exceeded twice its previous level
2️⃣ On-chain data offers support — institutional addresses are accelerating their daily net accumulation
3️⃣ Key resistance has been tested — two strong coins, BNB and EV1, have hit new highs
Trading reminder:
⚠️ Although BTC has reached a new high, it may continue to move sideways in the short term
Be patient! Good traders don’t chase highs. Wait for a pullback to stabilize before entering.
What’s your current BTC cost basis? Share your entry strategy in the comments 📈
#BTC #PriceTrend #TechnicalAnalysis #OnChainData
BTC decisively broke through the $80,000 mark today, with trading volume surging 60%!
Price action analysis:
1️⃣ Rising volume is the key signal — over the past 7 days, trading volume has consistently exceeded twice its previous level
2️⃣ On-chain data offers support — institutional addresses are accelerating their daily net accumulation
3️⃣ Key resistance has been tested — two strong coins, BNB and EV1, have hit new highs
Trading reminder:
⚠️ Although BTC has reached a new high, it may continue to move sideways in the short term
Be patient! Good traders don’t chase highs. Wait for a pullback to stabilize before entering.
What’s your current BTC cost basis? Share your entry strategy in the comments 📈
#BTC #PriceTrend #TechnicalAnalysis #OnChainData
177
·
--
🔥Year-end market outlook for 2026: Why focus on “real returns” rather than “short-term volatility” now?
Market volatility has picked up recently, and many people have asked me: What’s the outlook for the year-end market?
My view is: In the short term, it’s all about sentiment; over the year, it’s all about returns.
📊A few key signals:
1️⃣Layer 2 ecosystem boom — System-level scaling solutions are reshaping the gas cost structure, breaking through DeFi’s efficiency ceiling
2️⃣Bitcoin enters a new phase — Institutional holdings are at record highs, and demand for investment products is strong, but retail investors can easily lose patience amid market swings
3️⃣AI × blockchain — This trend won’t end in 2026. Protocols with real-world use cases are worth watching for the long term
💬In a volatile market, the biggest mistake is to “lose confidence after chasing rallies and selling off during dips.” Good projects need time to prove themselves—you don’t need to watch the charts every day and fixate on every price move.
What will you be counting on as we head into year-end?
🔥Year-end market outlook for 2026: Why focus on “real returns” rather than “short-term volatility” now?
Market volatility has picked up recently, and many people have asked me: What’s the outlook for the year-end market?
My view is: In the short term, it’s all about sentiment; over the year, it’s all about returns.
📊A few key signals:
1️⃣Layer 2 ecosystem boom — System-level scaling solutions are reshaping the gas cost structure, breaking through DeFi’s efficiency ceiling
2️⃣Bitcoin enters a new phase — Institutional holdings are at record highs, and demand for investment products is strong, but retail investors can easily lose patience amid market swings
3️⃣AI × blockchain — This trend won’t end in 2026. Protocols with real-world use cases are worth watching for the long term
💬In a volatile market, the biggest mistake is to “lose confidence after chasing rallies and selling off during dips.” Good projects need time to prove themselves—you don’t need to watch the charts every day and fixate on every price move.
What will you be counting on as we head into year-end?
Market volatility has picked up recently, and many people have asked me: What’s the outlook for the year-end market?
My view is: In the short term, it’s all about sentiment; over the year, it’s all about returns.
📊A few key signals:
1️⃣Layer 2 ecosystem boom — System-level scaling solutions are reshaping the gas cost structure, breaking through DeFi’s efficiency ceiling
2️⃣Bitcoin enters a new phase — Institutional holdings are at record highs, and demand for investment products is strong, but retail investors can easily lose patience amid market swings
3️⃣AI × blockchain — This trend won’t end in 2026. Protocols with real-world use cases are worth watching for the long term
💬In a volatile market, the biggest mistake is to “lose confidence after chasing rallies and selling off during dips.” Good projects need time to prove themselves—you don’t need to watch the charts every day and fixate on every price move.
What will you be counting on as we head into year-end?
188
·
--
#Year-End Investment Strategy #EmbraceWeb3 The Future Is Here
At the end of 2026, the market has moved on from the frenzy around 78,000U and entered a new period of equilibrium. Here’s what’s worth watching at this stage:
📊 On-chain data is recovering
- BTC holdings are becoming less concentrated
- Layer2 TVL has reached a new high
- DeFi yields are stable
🎯 Areas to focus on:
1. Layer2 ecosystem — Fees are falling as adoption grows
2. DeFi with real-world use cases — Sustainable yields
3. AI + Crypto — An innovative intersection
Remember: Good projects need time to prove themselves. Hold patiently, and wait for them to bloom.
#BSC #DeFi #Layer2 #Bitcoin #Ethereum #web3兼职 #币安10月31日储备金证明快照零知识证明已生成 #
#Year-End Investment Strategy #EmbraceWeb3 The Future Is Here
At the end of 2026, the market has moved on from the frenzy around 78,000U and entered a new period of equilibrium. Here’s what’s worth watching at this stage:
📊 On-chain data is recovering
- BTC holdings are becoming less concentrated
- Layer2 TVL has reached a new high
- DeFi yields are stable
🎯 Areas to focus on:
1. Layer2 ecosystem — Fees are falling as adoption grows
2. DeFi with real-world use cases — Sustainable yields
3. AI + Crypto — An innovative intersection
Remember: Good projects need time to prove themselves. Hold patiently, and wait for them to bloom.
#BSC #DeFi #Layer2 #Bitcoin #Ethereum #web3兼职 #币安10月31日储备金证明快照零知识证明已生成 #
At the end of 2026, the market has moved on from the frenzy around 78,000U and entered a new period of equilibrium. Here’s what’s worth watching at this stage:
📊 On-chain data is recovering
- BTC holdings are becoming less concentrated
- Layer2 TVL has reached a new high
- DeFi yields are stable
🎯 Areas to focus on:
1. Layer2 ecosystem — Fees are falling as adoption grows
2. DeFi with real-world use cases — Sustainable yields
3. AI + Crypto — An innovative intersection
Remember: Good projects need time to prove themselves. Hold patiently, and wait for them to bloom.
#BSC #DeFi #Layer2 #Bitcoin #Ethereum #web3兼职 #币安10月31日储备金证明快照零知识证明已生成 #
248



·
--
🚀New opportunities in the BSC ecosystem! Developers, are you paying attention?
The BSC ecosystem has been quietly gaining momentum lately. Here are a few areas worth watching:
1️⃣ DeFi 3.0 — Yield-enhancing protocols
2️⃣ GameFi — Tokenization of in-game assets
3️⃣ Modular Layer 2 — Lower gas fees
My token selection criteria:
- Projects with real revenue (TVL > $10 million)
- Strong team backgrounds and active communities
- Healthy tokenomics
#BSC #DeFi #Web3 #Binance #Crypto
🚀New opportunities in the BSC ecosystem! Developers, are you paying attention?
The BSC ecosystem has been quietly gaining momentum lately. Here are a few areas worth watching:
1️⃣ DeFi 3.0 — Yield-enhancing protocols
2️⃣ GameFi — Tokenization of in-game assets
3️⃣ Modular Layer 2 — Lower gas fees
My token selection criteria:
- Projects with real revenue (TVL > $10 million)
- Strong team backgrounds and active communities
- Healthy tokenomics
#BSC #DeFi #Web3 #Binance #Crypto
The BSC ecosystem has been quietly gaining momentum lately. Here are a few areas worth watching:
1️⃣ DeFi 3.0 — Yield-enhancing protocols
2️⃣ GameFi — Tokenization of in-game assets
3️⃣ Modular Layer 2 — Lower gas fees
My token selection criteria:
- Projects with real revenue (TVL > $10 million)
- Strong team backgrounds and active communities
- Healthy tokenomics
#BSC #DeFi #Web3 #Binance #Crypto
72
·
--
💡 Bitcoin is at a critical balance zone. Retail investors, don't let short-term volatility scare you away.
Markets have been choppy lately, and some friends have asked me which coins to choose. Here's my take:
✅ In the long run, BTC remains the backbone
✅ Altseason hasn't truly arrived yet, so getting positioned early can be a good move
✅ But remember: only invest what you can afford to lose, and manage your position size
Here's a practical tip for choosing coins today: look for Layer 2 projects with real-world business activity and active communities.
#Bitcoin #BSC #DeFi #Layer2 #Blockchain
💡 Bitcoin is at a critical balance zone. Retail investors, don't let short-term volatility scare you away.
Markets have been choppy lately, and some friends have asked me which coins to choose. Here's my take:
✅ In the long run, BTC remains the backbone
✅ Altseason hasn't truly arrived yet, so getting positioned early can be a good move
✅ But remember: only invest what you can afford to lose, and manage your position size
Here's a practical tip for choosing coins today: look for Layer 2 projects with real-world business activity and active communities.
#Bitcoin #BSC #DeFi #Layer2 #Blockchain
Markets have been choppy lately, and some friends have asked me which coins to choose. Here's my take:
✅ In the long run, BTC remains the backbone
✅ Altseason hasn't truly arrived yet, so getting positioned early can be a good move
✅ But remember: only invest what you can afford to lose, and manage your position size
Here's a practical tip for choosing coins today: look for Layer 2 projects with real-world business activity and active communities.
#Bitcoin #BSC #DeFi #Layer2 #Blockchain
261
·
--
$HEI The shorts have been liquidated, now it's time to liquidate the long positions too.
$HEI The shorts have been liquidated, now it's time to liquidate the long positions too.
80
·
--
$RAVE 1. Core Behavior: Concentrated Liquidity
The screenshot shows a large number of interactions with the PancakeSwap V3 Pool. Unlike the earlier V2 version, V3 allows users to provide liquidity within specific price ranges.
Frequent Adjustments: You will see paired trades, usually "Add Liquidity" and "Remove Liquidity". This indicates that the address is frequently adjusting its position price range according to market fluctuations to ensure funds are always in a "market-making state" to earn transaction fees.
Main Assets: The screenshot frequently shows USDI (a stablecoin or related derivative asset) as well as some token pairs. This address seems to be managing deep liquidity around specific trading pairs.
2. Fund Scale and Characteristics
Single Amount: Observe the dollar value on the right; individual positions are usually between $1,000 and $5,000.
Automation of Operations: The trading frequency is extremely high (you can see dense transaction records like "2M AGO", "5M AGO", etc.). Such frequency is difficult to achieve manually and is highly likely to be using quantitative trading bots or liquidity management strategy scripts.
3. Profit Model of the Address
This address primarily profits through the following three methods:
Transaction Fees: This is the main purpose. By providing funds in the most active trading ranges, it earns the fees paid by retail traders.
Farming Rewards: If the trading pair has Cake rewards on PancakeSwap, it also earns these additional yields.
Arbitrage Coordination: Frequent entries and exits may also be coordinating with price differences on other platforms for arbitrage.
4. Potential Risk Analysis
Although the flow seems high, this address faces the following challenges:
Impermanent Loss: If the prices of the relevant tokens rise or fall sharply, the value of the liquidity provided will be affected.
Gas Fee Consumption: With such high-frequency operations, if deployed on the BNB Chain, costs are manageable; if on Ethereum mainnet, extremely high yields are needed to cover costs.
Slippage and Sandwich Attacks: When adjusting positions frequently, if trade settings are improperly configured, profits can easily be exploited by MEV bots (sandwich attackers).
Can you outplay the market-making bots?
$RAVE 1. Core Behavior: Concentrated Liquidity
The screenshot shows a large number of interactions with the PancakeSwap V3 Pool. Unlike the earlier V2 version, V3 allows users to provide liquidity within specific price ranges.
Frequent Adjustments: You will see paired trades, usually "Add Liquidity" and "Remove Liquidity". This indicates that the address is frequently adjusting its position price range according to market fluctuations to ensure funds are always in a "market-making state" to earn transaction fees.
Main Assets: The screenshot frequently shows USDI (a stablecoin or related derivative asset) as well as some token pairs. This address seems to be managing deep liquidity around specific trading pairs.
2. Fund Scale and Characteristics
Single Amount: Observe the dollar value on the right; individual positions are usually between $1,000 and $5,000.
Automation of Operations: The trading frequency is extremely high (you can see dense transaction records like "2M AGO", "5M AGO", etc.). Such frequency is difficult to achieve manually and is highly likely to be using quantitative trading bots or liquidity management strategy scripts.
3. Profit Model of the Address
This address primarily profits through the following three methods:
Transaction Fees: This is the main purpose. By providing funds in the most active trading ranges, it earns the fees paid by retail traders.
Farming Rewards: If the trading pair has Cake rewards on PancakeSwap, it also earns these additional yields.
Arbitrage Coordination: Frequent entries and exits may also be coordinating with price differences on other platforms for arbitrage.
4. Potential Risk Analysis
Although the flow seems high, this address faces the following challenges:
Impermanent Loss: If the prices of the relevant tokens rise or fall sharply, the value of the liquidity provided will be affected.
Gas Fee Consumption: With such high-frequency operations, if deployed on the BNB Chain, costs are manageable; if on Ethereum mainnet, extremely high yields are needed to cover costs.
Slippage and Sandwich Attacks: When adjusting positions frequently, if trade settings are improperly configured, profits can easily be exploited by MEV bots (sandwich attackers).
Can you outplay the market-making bots?
The screenshot shows a large number of interactions with the PancakeSwap V3 Pool. Unlike the earlier V2 version, V3 allows users to provide liquidity within specific price ranges.
Frequent Adjustments: You will see paired trades, usually "Add Liquidity" and "Remove Liquidity". This indicates that the address is frequently adjusting its position price range according to market fluctuations to ensure funds are always in a "market-making state" to earn transaction fees.
Main Assets: The screenshot frequently shows USDI (a stablecoin or related derivative asset) as well as some token pairs. This address seems to be managing deep liquidity around specific trading pairs.
2. Fund Scale and Characteristics
Single Amount: Observe the dollar value on the right; individual positions are usually between $1,000 and $5,000.
Automation of Operations: The trading frequency is extremely high (you can see dense transaction records like "2M AGO", "5M AGO", etc.). Such frequency is difficult to achieve manually and is highly likely to be using quantitative trading bots or liquidity management strategy scripts.
3. Profit Model of the Address
This address primarily profits through the following three methods:
Transaction Fees: This is the main purpose. By providing funds in the most active trading ranges, it earns the fees paid by retail traders.
Farming Rewards: If the trading pair has Cake rewards on PancakeSwap, it also earns these additional yields.
Arbitrage Coordination: Frequent entries and exits may also be coordinating with price differences on other platforms for arbitrage.
4. Potential Risk Analysis
Although the flow seems high, this address faces the following challenges:
Impermanent Loss: If the prices of the relevant tokens rise or fall sharply, the value of the liquidity provided will be affected.
Gas Fee Consumption: With such high-frequency operations, if deployed on the BNB Chain, costs are manageable; if on Ethereum mainnet, extremely high yields are needed to cover costs.
Slippage and Sandwich Attacks: When adjusting positions frequently, if trade settings are improperly configured, profits can easily be exploited by MEV bots (sandwich attackers).
Can you outplay the market-making bots?
707
·
--
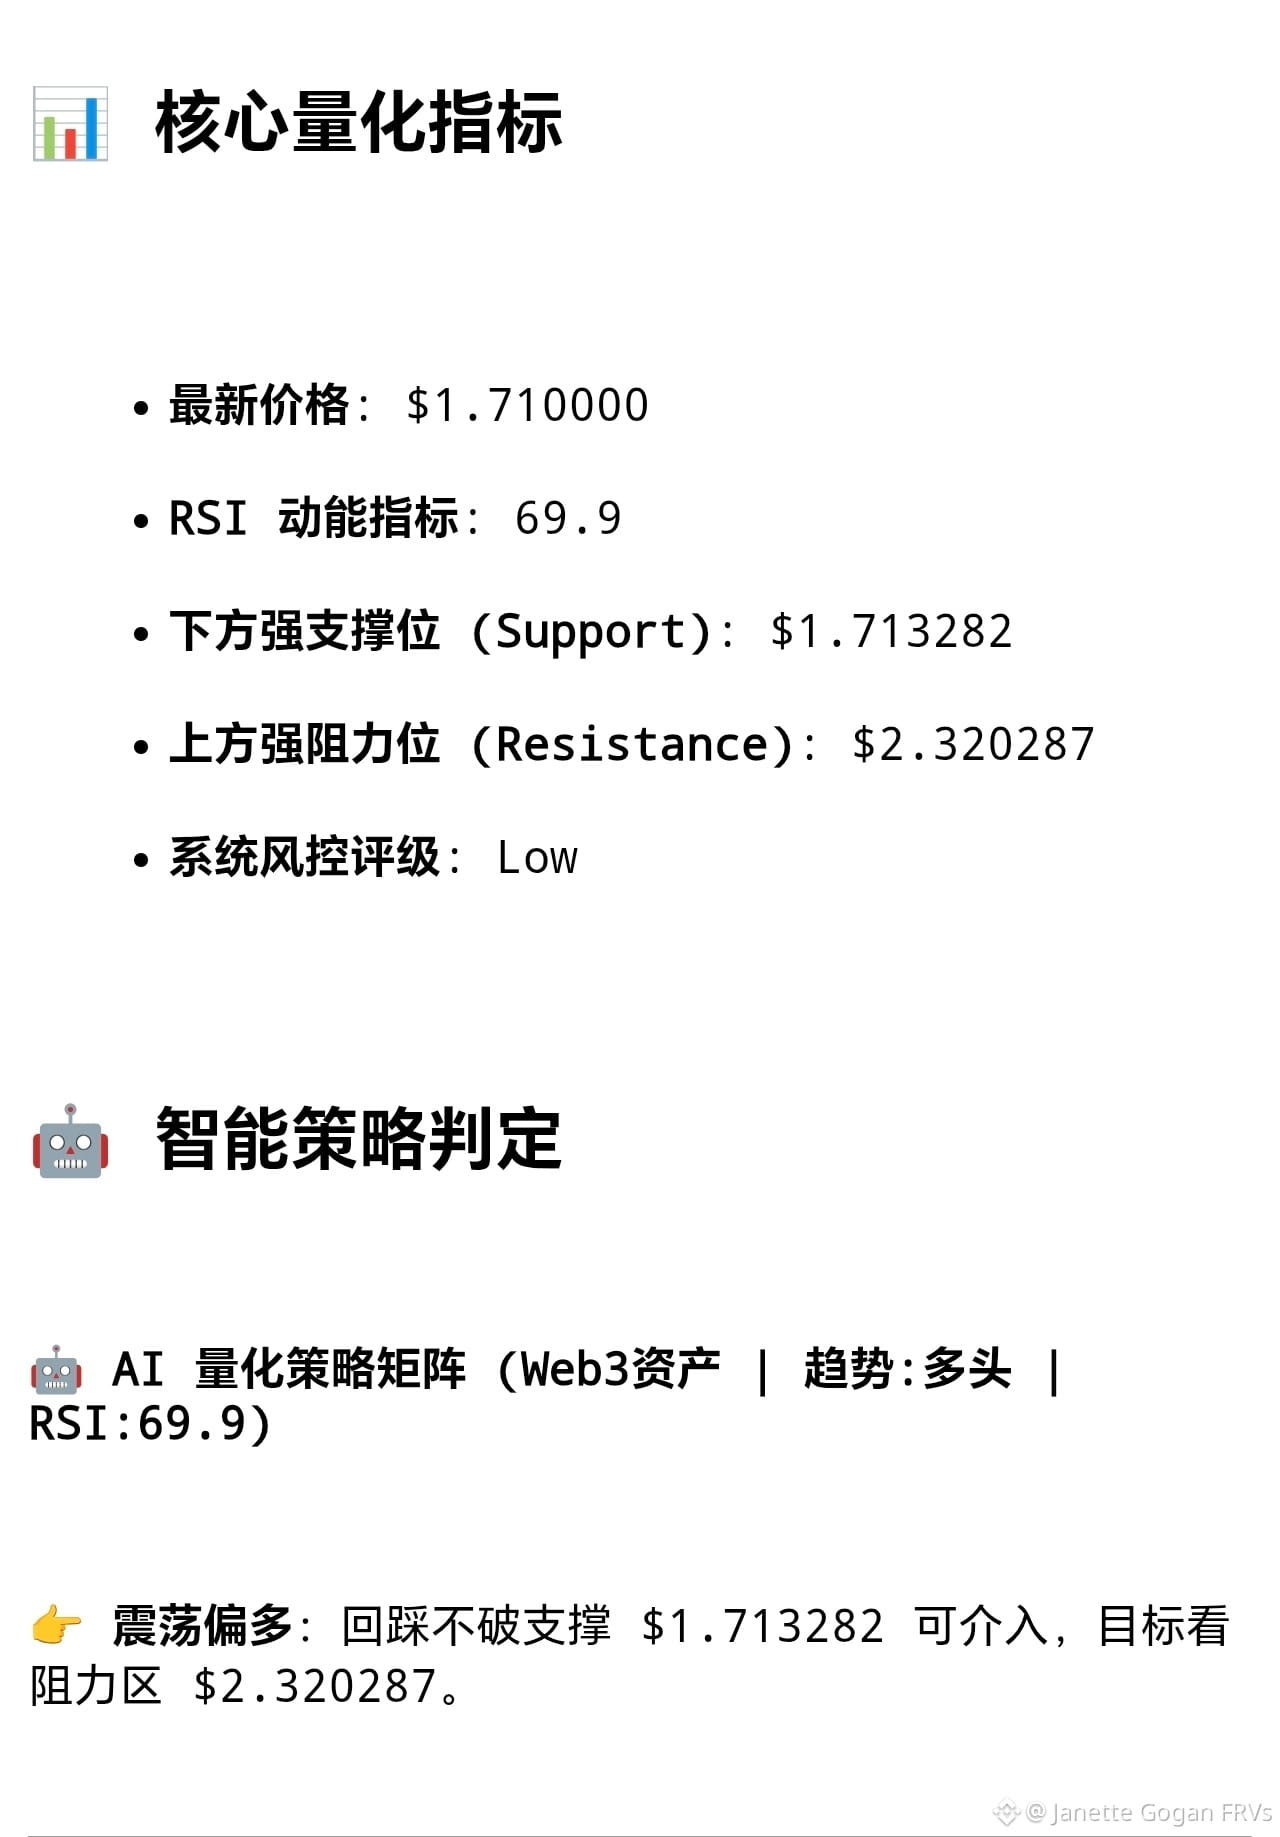
Bullish
$SIREN Support level at 1.71, open long at 2.3 take profit.
$SIREN Support level at 1.71, open long at 2.3 take profit.
311
·
--
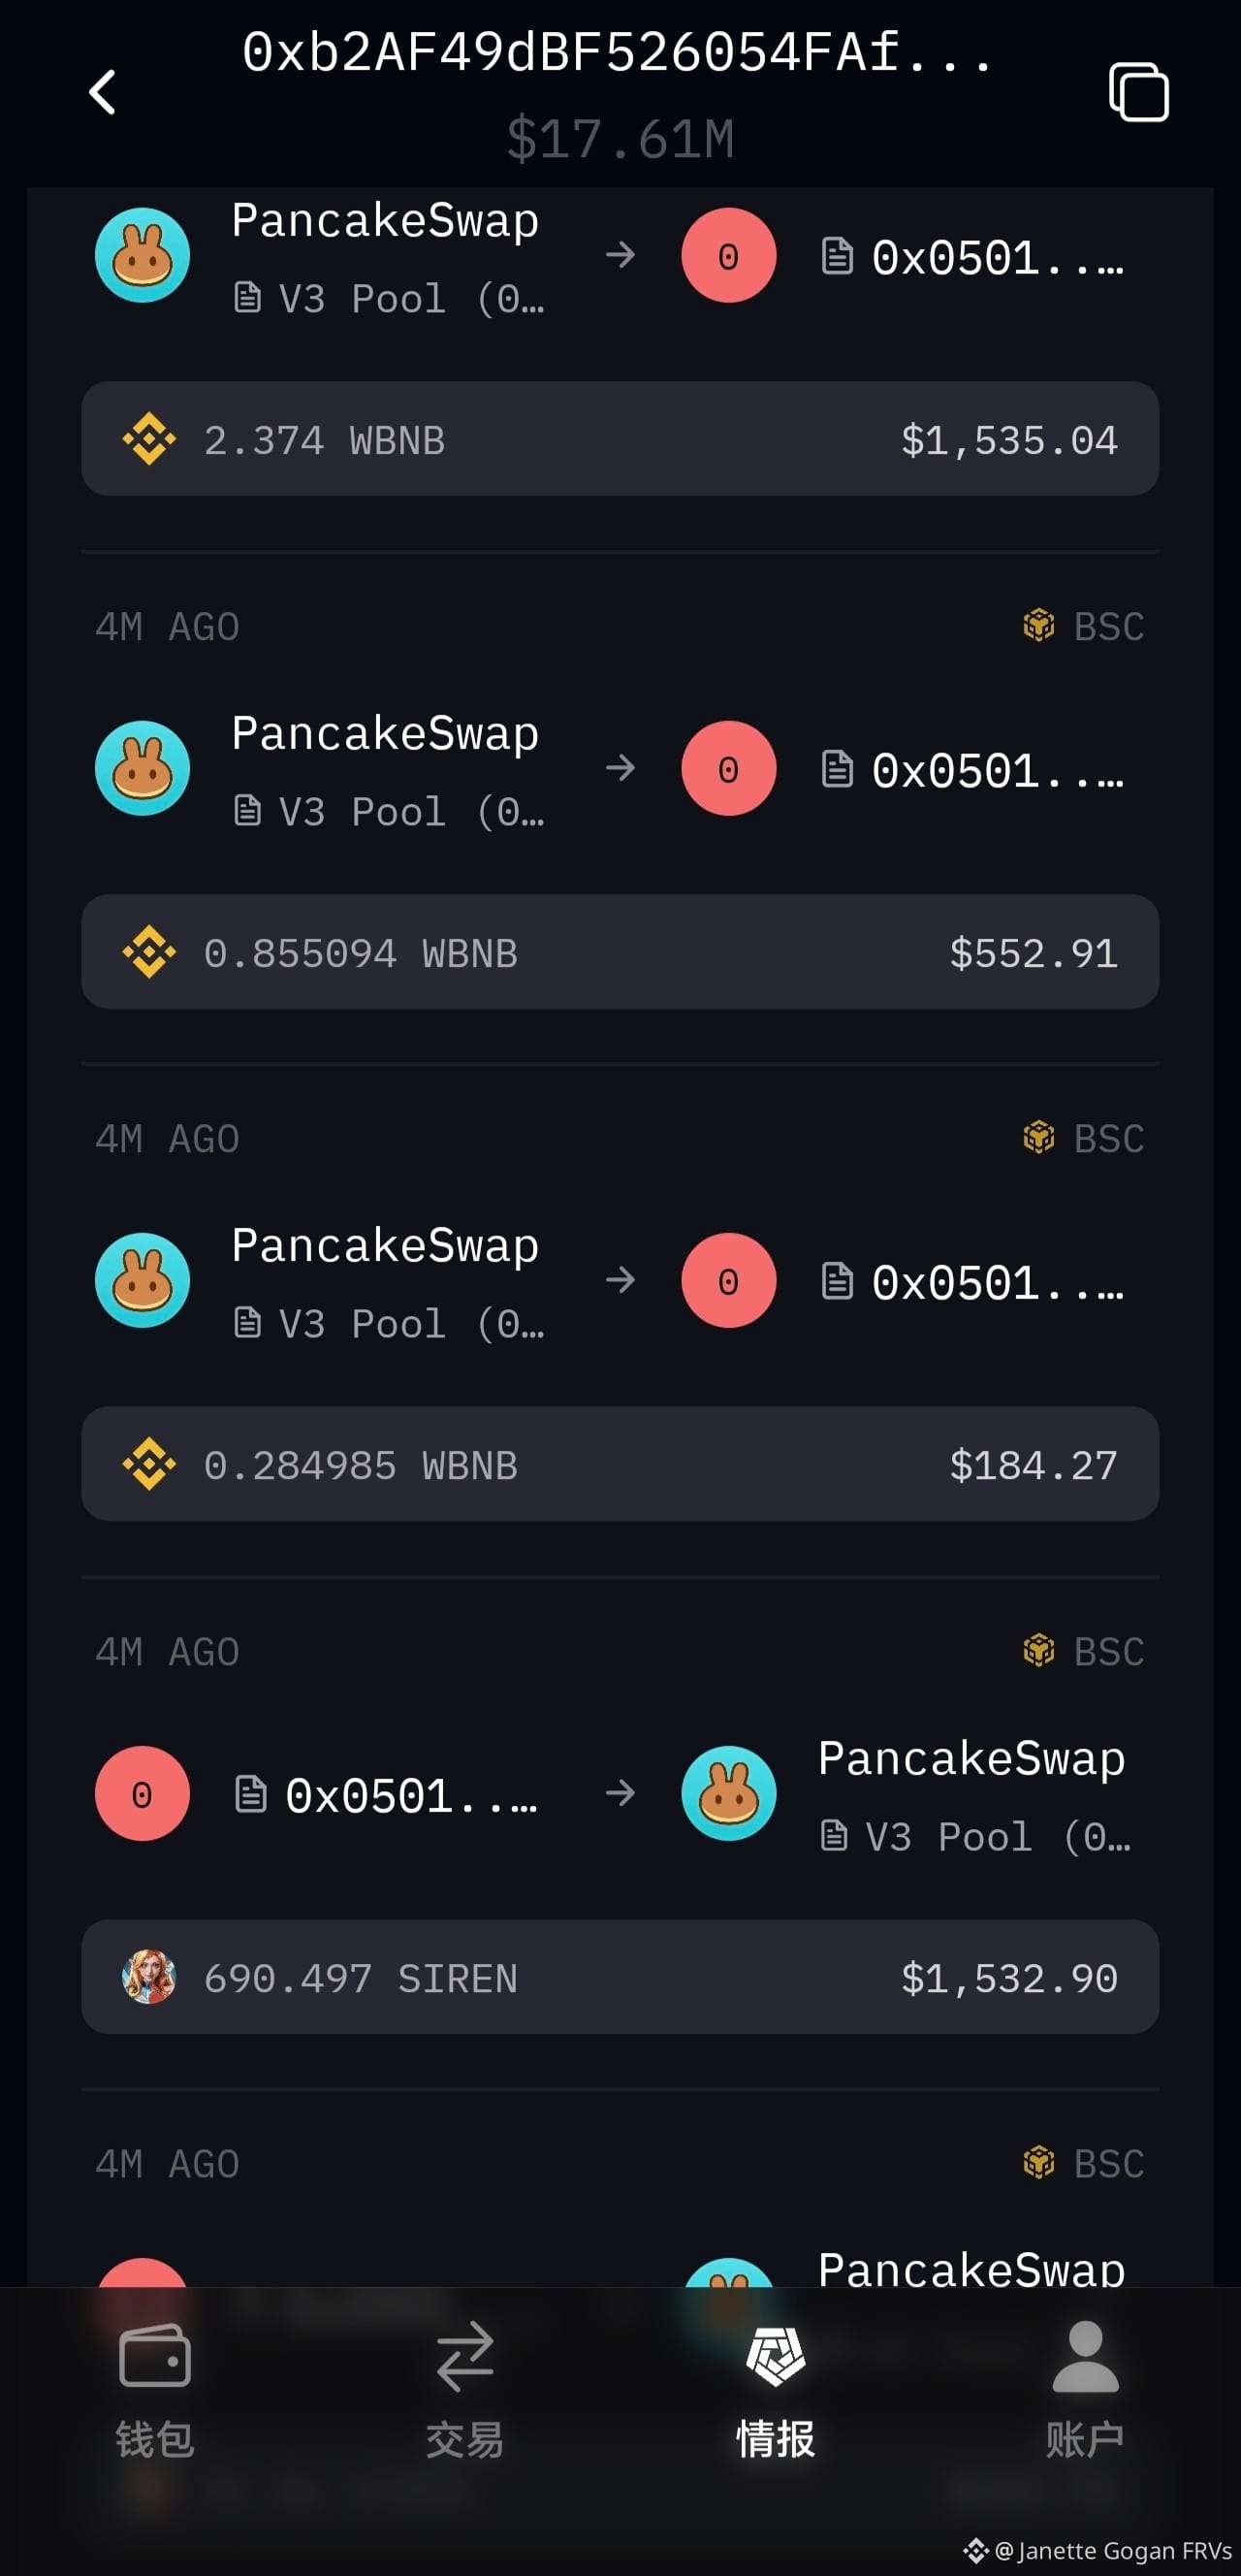
$SIREN Is this person crazy for doing t? There are still 12 million dollars worth of chips that haven't been sold?
$SIREN Is this person crazy for doing t? There are still 12 million dollars worth of chips that haven't been sold?
337
·
--
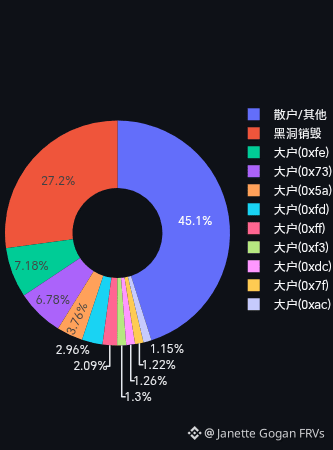
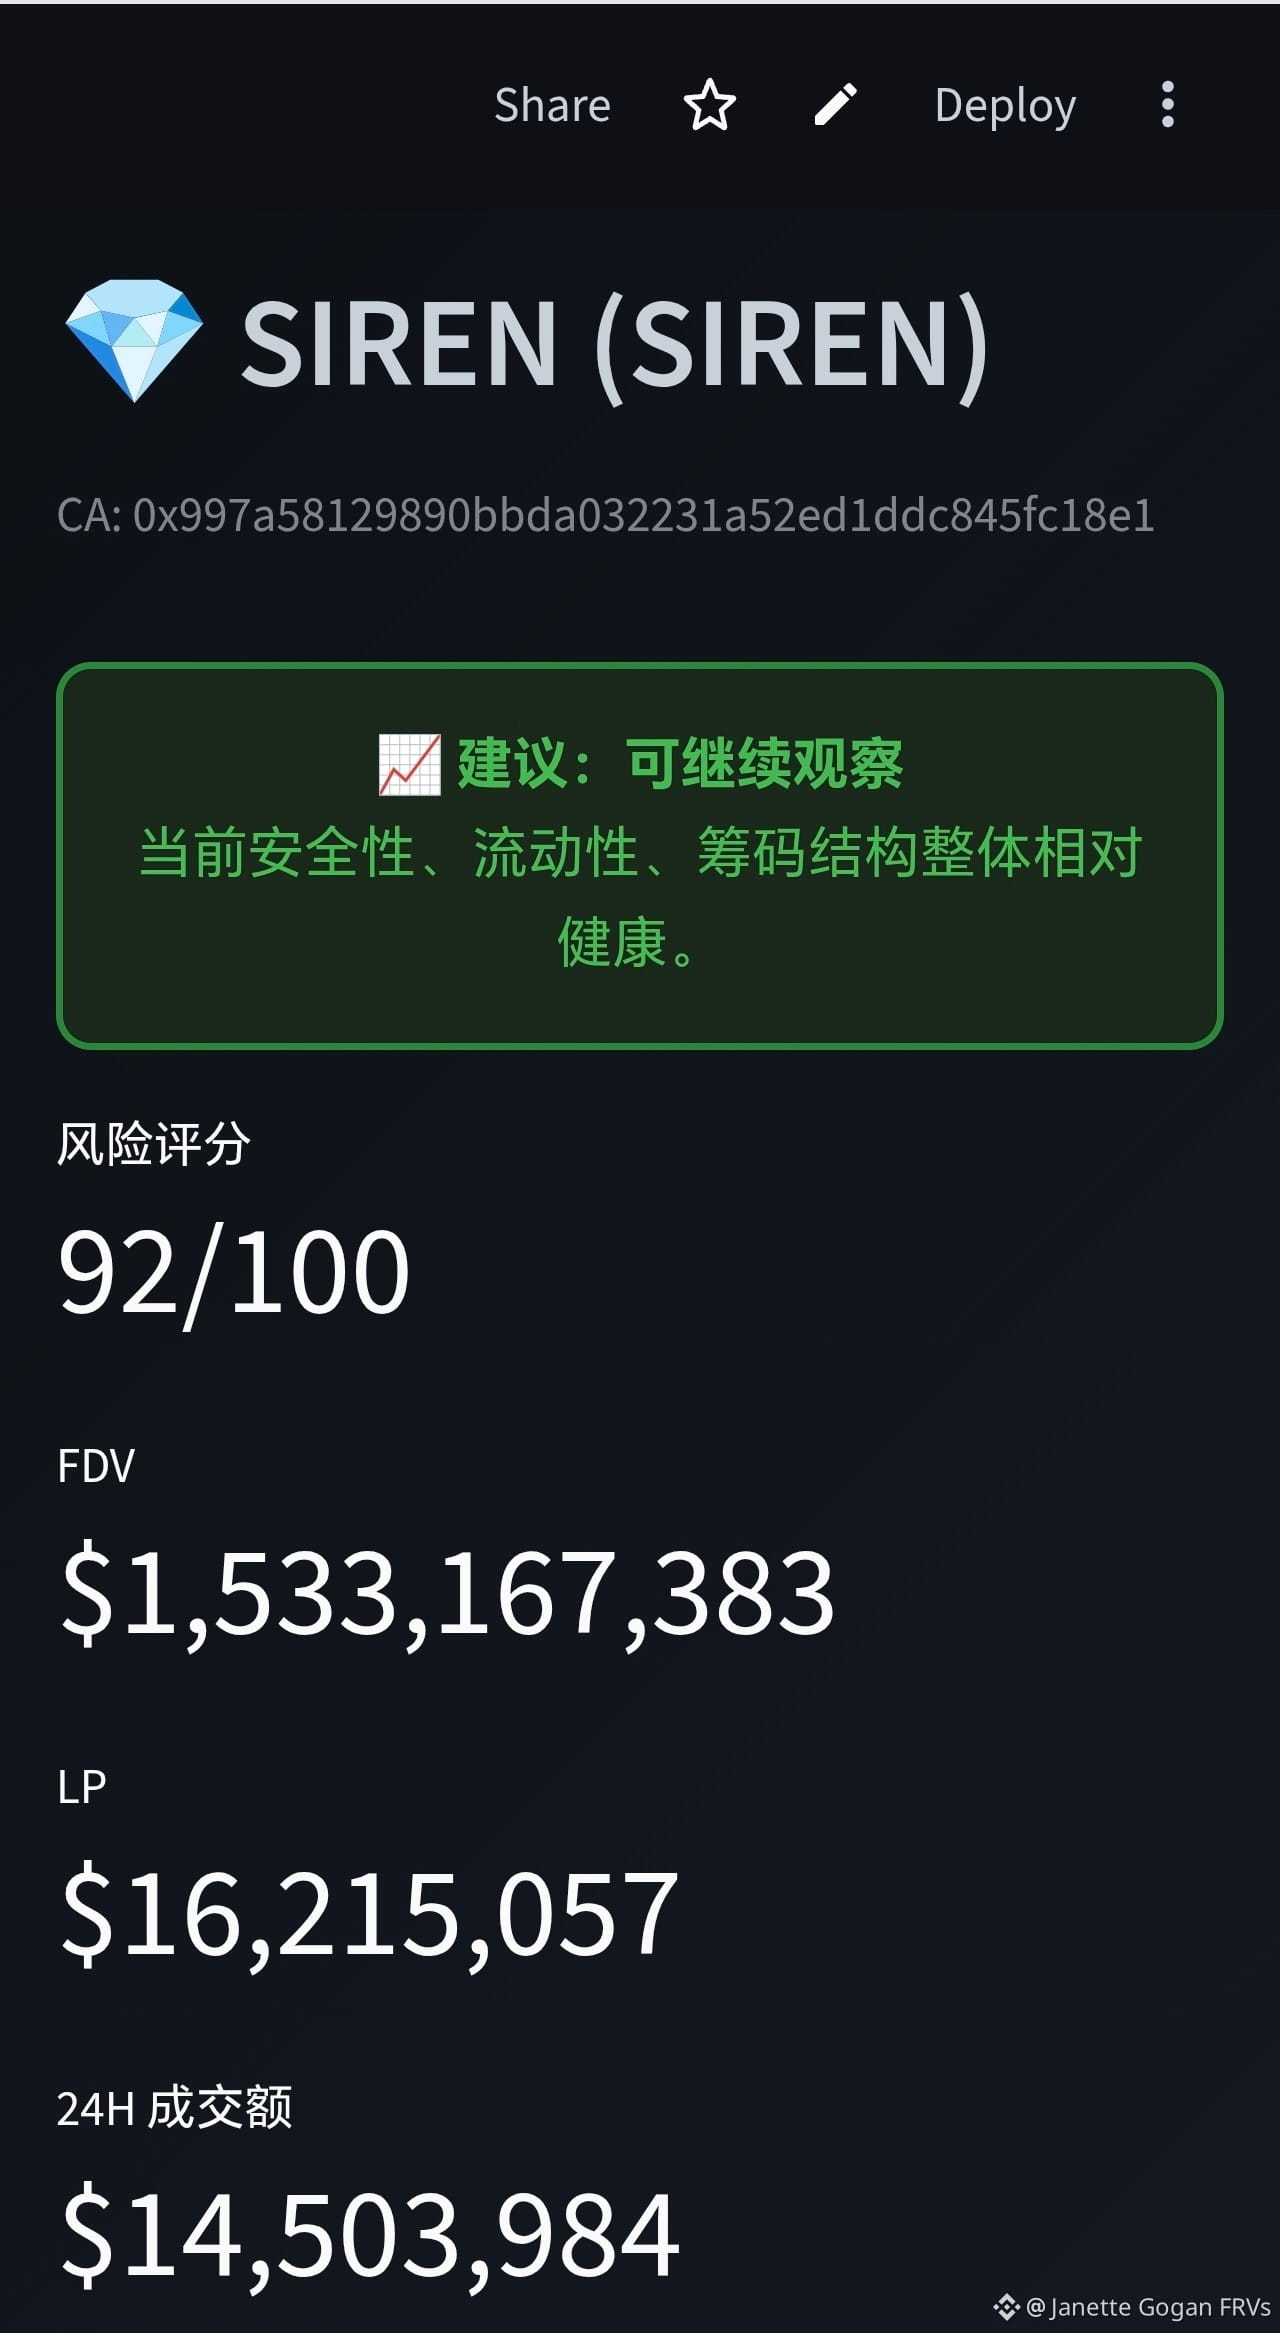
$SIREN This is the data analysis that AI gave me, and I think we should not easily short it.
$SIREN This is the data analysis that AI gave me, and I think we should not easily short it.
1
614
Log in to explore more content
Join global crypto users on Binance Square
⚡️ Get latest and useful information about crypto.
💬 Trusted by the world’s largest crypto exchange.
👍 Discover real insights from verified creators.
Email / Phone number
Trending Topics
HuangExitNvidiaStrategyInFocus
25,987 views
569 Discussing
STOCKS | Nvidia’s Jensen Huang Resigns, Colette Kress Named as Interim CEO
Binance News
·14 Likes
·16.2k views
AnthropicRejectsIPODelayValuationinQuestion
592,309 views
4,906 Discussing
BitMineReports$6.3BNetLossForFiscal2026
3,229 views
77 Discussing