

华尔街新生代
16.9k Posts

华尔街新生代
Report
Block User
加密世界,解码未来,币圈在手,财富自由。
Open Trade
1.6 Months
0 Following
65 Followers
152 Liked
Posts
Portfolio
·
--
Bearish
See translation
比特币收复8万、以太坊站稳2300,三浪才真正临近
比特币跌穿8万美元后,市场最需要的不是猜底,而是等待修复确认。若比特币能反弹至8万美元并连续企稳,说明此前的破位更接近假突破与流动性清洗;以太坊则需先在2200美元上方止跌回升,进一步站上2300美元并企稳,才能摆脱弱势磨底结构。
这两个条件同时成立,三浪行情的技术前提才算搭好:$BTC 8万美元由压力转为支撑,$ETH 2300美元由阻力转为踏板,市场情绪也会从防御转向试探性进攻。三浪之所以值得期待,在于它通常是主升段中力度最强、持续性最好的一浪,但前提是回踩不再破位。
止跌是入场券,企稳是发令枪。 比特币守住8万、以太坊站稳2300,三浪才会从“可能”变成“可交易”。若再次跌回关键位下方,则仍应视为反弹而非反转。三浪值得等,但更要在确认后动手。
美联储官员释放加息信号,12月预期仍存分歧

·
--
$ETH Ethereum has plunged 17% in this pullback, while Bitcoin is down less than 9%.
ETFs are seeing net outflows every day, and whales are still moving their holdings onto exchanges. Bitcoin is still some distance from its weekly support, but Ethereum has already been pushed below support ahead of time.
Bulls are completely just stubbornly holding on at this level. If the broader market dips even a little further, there are no dense clusters of buy orders below Ethereum to catch it. A single sell-off in the spot order book could send it straight through.
ETH
ETH

2
·
--
Bullish
$BNB The funding rate is so deeply negative that shorts are paying longs interest every day. Several major whales are still holding millions of tokens steady above 600, and the long-short ratio has climbed past 3. The market makes it clear that shorts are stubbornly hanging on. If the bulls step on the gas a little at this level, the shorts will be lining up to meet their margin calls.
BNB
BNB
BNB
BNB

·
--
If you thought $HYPE was worth buying at $97, then at $91 it should have you absolutely drooling 🎯
That’s what buying the dip is all about, but most people do the exact opposite—hilarious. They rush in at the highs, afraid of missing out, then panic-sell at the lows.
Same asset, better price. The math isn’t that hard. HYPE ETH BTC
That’s what buying the dip is all about, but most people do the exact opposite—hilarious. They rush in at the highs, afraid of missing out, then panic-sell at the lows.
Same asset, better price. The math isn’t that hard. HYPE ETH BTC

18
·
--
1101 $RSR 🫀Liquidation Loss Review
A review of RSR. I’ve lost quite a bit on this coin myself, so this time the lesson came at a real financial cost.
Earlier, it surged on heavy volume from around 0.00140 to 0.001743. It looked strong, but coins that suddenly shoot up like this can easily get people caught up in the hype. I got burned myself: I was afraid of missing out if I didn’t chase the rally, then when it fell, I wanted to short it right away to make back my losses. In the end, it’s easy to get hit from both sides.
The price is now back around 0.00159. Resistance remains near 0.00164 above, while the first level to watch below is around 0.00150.
So this time, I’m not rushing in.
Don’t chase the rally, and don’t chase the short either.
If you chase after a sharp rise, you may end up buying someone else’s holdings; if you immediately short after a drop, a single rebound can easily stop you out. The right move is to wait until the price reaches a suitable level, then trade once the risk-reward ratio is favorable.
This coin has already cost me a lot in tuition.
There’s no end to the money you can make in the market, but you really can lose all your principal.
Stay level-headed, and wait for a better entry.
The broader market is fairly stable. $BTC and $ETH are still trading within a range.

15
·
--
Bullish
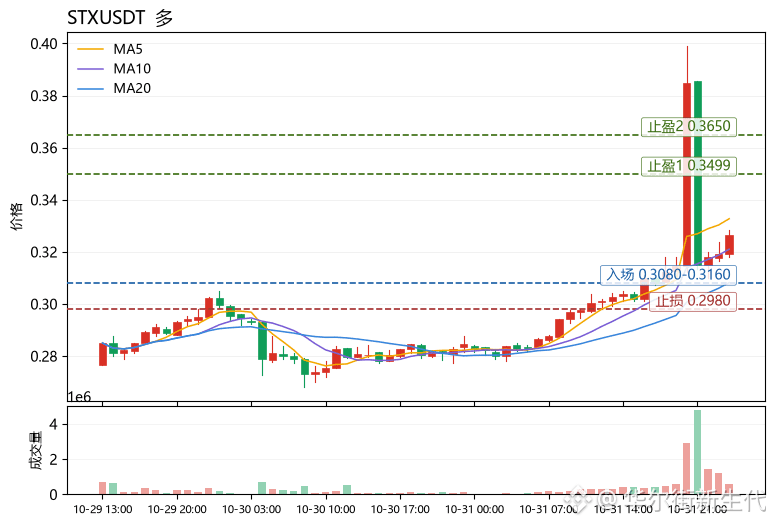
Many people see a sharp one-day rally and assume the “trend is confirmed,” then jump in only to get stopped out on a single pullback. The gain itself is not a reason to enter; the moving-average structure and momentum levels are what matter. $STX is up 15.81% over 24h at 0.3267. MA5=0.33272 remains above the current price, but MA5 is above MA20=0.3082, so the medium-term structure is bullish. The MACD histogram at +0.001409 remains bullish, while RSI at 57.2 is neutral to strong and not overbought. The Bollinger upper band at 0.349923 is the first overhead resistance. Notably, the funding rate is -0.1535%, meaning shorts are paying. This suggests the rally is not being driven by crowded leveraged longs, so a pullback is more likely to be a shakeout than a reversal. The Fear & Greed Index is 30 (Fear); sentiment is not overheated, which also favors buying pullbacks rather than chasing the price higher.
The bias is bullish; wait for a pullback into the area above MA20 before entering: Entry 0.3080–0.3160 (MA20 support and the gap below the current price; the non-overbought RSI provides some room for error); Take profit 1: 0.3499 (Bollinger upper-band resistance, corresponding to a dense prior-high zone); Take profit 2: 0.3650 (an extension target after a breakout above the upper band, requiring continued expansion in the MACD histogram); Stop loss: 0.2980 (a break below MA20 with a weakening MACD would invalidate the structure; this also limits volatility risk from the 37.21% amplitude over 30 candlesticks). If price moves above 0.3499 on increased volume, that may signal trend acceleration, but avoid chasing longs near the upper band.
Also watching: $BEAMX and $RSR. The former's MACD histogram remains negative, indicating relative weakness; the latter's RSI at 59.7 is stronger than STX, with greater short-term momentum.
(Personal opinion only, for reference; this is not investment advice. Futures trading carries extremely high risk. Please manage position sizes strictly.)
【Data】
Token: STXUSDT
Direction: Long
Entry: 0.3080-0.3160
Take profit 1: 0.3499
Take profit 2: 0.3650
Stop loss: 0.2980
4
·
--
$SOPH SOPH’s chain is about to pull the plug at the end of the month, and the price is still somehow being pumped over 40%.
The official announcement made it crystal clear: withdrawals will be shut off on the 25th. There are only a few days left.
This sudden, aggressive pump is purely the big players manufacturing liquidity to dump into before the doors close.
A classic last-gasp liquidity grab. And some people really think they can catch the falling knife and hold on for the long term.
SOPH
SOPH

3
·
--
Bullish
$HYPE Market cap plunged from $200 million to just $1,000, and the project team then announced it was shutting down.
All of this was triggered by an old vulnerability that had been shelved since 2019 and that nobody had taken seriously.
One ancient bug, and $200 million in market value vanished in an instant.
All of this was triggered by an old vulnerability that had been shelved since 2019 and that nobody had taken seriously.
One ancient bug, and $200 million in market value vanished in an instant.
2
·
--
Bearish
I got badly burned by $DOGE !
After the hacking incident, DOGE has fallen below all its moving averages. Its RSI is a weak 38.3, and it’s down 19.9% over the past 30 days.
The only support left below is the previous low of 0.0722. If that breaks, it’ll head straight for 0.07.
$PEPE has still far exceeded my expectations: it managed to absorb the hackers’ selling pressure and strengthen against the trend, with an RSI of 68.4 approaching overbought territory. Its ATR is a wild 10.2%, and 0.000006 is the previous high resistance.
$DOOD has also held up pretty well since the hacking incident. It’s now above all its moving averages, and its technical outlook is even stronger than PEPE’s.
The NFT project’s narrative is driving it, but an ATR of 38.5% makes it perilous. This rally is being driven by speculative money, not safe-haven demand. Chasing it at these highs is like catching a falling knife, so I haven’t bought it and wouldn’t recommend that anyone else do so.
In a nutshell: DOGE was hammered by panic over the hacking incident; PEPE was pumped by expectations of an ETF listing and Justin Sun’s accumulation; and DOOD is being treated by some as a high-risk lottery ticket.

9
·
--
1031 Mainstream Coins Monthly Close Review 🫀
Tonight, the main focus is the monthly close.
First, Bitcoin. After falling all the way from 126,000, the monthly price has now returned to around 77,000, but this rebound has yet to truly change the larger-scale structure. The area around 83,000 remains clear resistance. The monthly MACD is still in bearish territory. Although the green bars show signs of contracting, a genuine reversal is still some way off.
Ethereum $ETH is a little weaker. Since dropping from 4,958, it has yet to form a convincing reversal structure on the larger scale. It’s moving sideways around 2,240 and looks quite stable, but the monthly MACD remains below the zero line. Until it can reclaim the 2,260–2,300 area, this can only be seen as a recovery after the decline, not the start of a new major rally.
So I’m not going to declare the bull market is back just because we’ve had a few days of sideways trading.
For Bitcoin $BTC , the key level to watch is 83,000. Only after it truly reclaims that level on the monthly timeframe will the market have grounds to talk about strengthening. Below, keep an eye on the major support around 66,000.
Ethereum needs to reclaim 2,300 first. Otherwise, a retest around 2,140 or even 2,000 remains possible.
A short-term rebound is possible, but the larger-scale trend has not yet moved out of the danger zone.
Once this monthly candle closes, November will be the month that truly determines the direction.

6
·
--
$SOL SOL's move back above 101 looks unusually clean.
Total liquidations across the market in the past 24 hours were only a little over $3 million, and open interest has stayed low. That shows hardly anyone is using leverage to chase longs—it's all spot buying driving the price up.
The most awkward part for shorts is that they can't find a long capitulation to use as fuel, and they can't push the price down either.
If this keeps grinding higher, the shorts themselves will be the ones who get squeezed first.
SOL
SOL

2
·
--
10/31 Analysis: Getting Caught Holding U.S. Tech Stocks
🫀Trying to buy the dip at this point actually carries quite a bit of risk.
$SNDK and $SOXL have already taken such a beating that it’s easy to think, “After falling this much, they must be due for a rebound.” But the more things feel this way, the more important it is not to get carried away. If you do decide to buy, do it gradually with a small position, and always leave yourself room to hedge. If the broader market keeps plunging, at least you won’t get wiped out all at once.
👀Intel $INTC has been genuinely weak lately—weak enough to make you question everything. But I’ll say it again: don’t get too discouraged. It takes time for both the fundamentals and sentiment to recover. Don’t expect it to bounce all the way back in a single day.
With highly volatile assets like tech stocks, I personally think holding around three at a time is enough. There’s really no need to hold more. A larger position may seem like it diversifies risk, but it can easily turn into running a supermarket: you can’t bring yourself to sell any of them, and in the end, they all go down together.
The most important thing right now isn’t trying to buy at the absolute bottom—it’s surviving first.
Keep positions small, leave yourself some powder, and be ready to hedge at any time.
People who turn their portfolio into a supermarket often end up going down together.

15
·
--
Bearish
$SUI The broader market has been getting hammered for days, and funds have been sitting on their hands. Yet SUI bucked the trend and rallied on heavy volume near 0.9.
After breaking above the 200-day moving average on the daily chart, it held firm on this pullback. Sellers can’t push it down, and buyers are aggressively stepping in below.
While the broader market bleeds, SUI is holding its ground against the trend. Funds are clearly rotating into it.
When a pullback holds the moving average this well, all it takes is a slight breather in the broader market for SUI to be the first to bounce.
SUI
SUI

1
·
--
Bearish
Another day of falling in the morning, then rising a little in the evening. It’ll start falling again tomorrow.
$BTC It’s around 77,500 now, up from around 76,000 this morning
It looked like it was stabilizing for a bit, then slowly climbing. Anyone paying attention can see
this is a classic bull trap. There’s still plenty of room for it to fall.
$ETH It’s going up too, but it can’t break through $2,300.
As long as it hasn’t broken through this level, I’m still bearish on Ethereum 📉
Now expectations of another rate hike are cropping up again. It’s absolutely agonizing.
When a rate hike actually becomes likely, it’s not so scary.
It’s the rate-hike expectations that are so annoying! As long as it hasn’t broken a key level, don’t buy!
Fed officials signal rate hike, with divisions remaining over December expectations

9
·
--
$AKE
I was just about to open a position, but I held back.
I was planning to open a position in Zhuocang $ETH and go all in with 50 USDT.
But then I looked at the three positions I still have open.
I held back. I was worried that if I lost that 50 USDT, I wouldn’t be able to hold on to these three positions. My plan is to find out how long you can hold altcoins before making a profit or getting liquidated. Let’s run an experiment: I’ll let these three positions run wild and see how they grow. Whether things go well or badly, I won’t make any other moves except adding margin—or reducing it if necessary. This post is my proof!

·
--
Bullish
$ZEC Let’s just add another 10 lots.
1282 This isn’t my ideal entry point,
but it feels like it’s not worth holding on to and a shame to give up.
I just added a few lots on a whim. That’ll do.
1340 is where I’d ideally add to my position.
$HYPE It probably won’t go up any further, right?
A downtrend is inevitable. It did rise along the way,
but what matters most is the final outcome if you hold the position.
First, you have to be able to withstand the price fluctuations during the rise.
Fed officials signal rate hikes, while expectations for December remain divided.

4
·
--
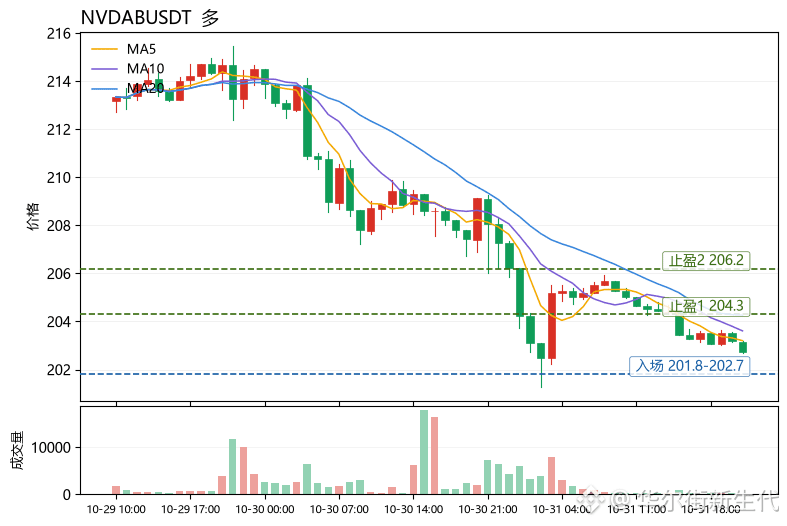
Many people treat “buy the dip after it falls” as discipline, but every rebound before the moving averages flatten is just bears rotating positions. $NVDAB is exactly in that state now: current price is 202.71, MA5=203.202 is still below MA20=204.265, and the moving average structure has not repaired, indicating the medium-term center of gravity is still shifting downward; RSI=31.8 is already close to the weak zone, but has not yet entered extreme oversold territory, so it is “weak but not broken.”
What is truly worth noting is that the MACD histogram has turned positive to +0.05803, yet price is still grinding near the lower Bollinger Band at 202.285, which is a classic early sign of bullish divergence—the bearish momentum is fading, but the bulls have not taken control yet. The Fear & Greed Index at 30 (fear) also confirms a subdued mood; at this position, shorting has poor risk-reward, so waiting for a cleaner pullback is more stable.
My bias is bullish, but I only buy on dips and do not chase upside: the entry reference is 201.8–202.7, i.e. around the lower Bollinger Band and current price area; stop loss at 199.5, and a break below that means the lower band has been lost and the divergence logic is invalidated; take profit 1 at 204.3, corresponding to MA20 resistance; take profit 2 at 206.2, near the upper Bollinger Band at 206.245, where momentum tends to fade once RSI returns to the midline.
Also watch: $WLD and $OP. Both are likewise capped by MA20; WLD is relatively weaker, while OP has rebounded nearly 7% but MACD is still negative. Neither is strong enough to drive NVDAB into an independent trend.
( ব্যক্তিগত opinion, for reference only, not constituting any investment advice. Futures are extremely risky; please strictly control position size.)
【Data】
Coin: NVDABUSDT
Direction: Long
Entry: 201.8-202.7
Take Profit 1: 204.3
Take Profit 2: 206.2
Stop Loss: 199.5
7
·
--
For such a simple question, even DeepSeek needs two seconds, while we ordinary people took 0 seconds $ETH $BTC $SOL
For such a simple question, even DeepSeek needs two seconds, while we ordinary people took 0 seconds $ETH $BTC $SOL

1
·
--
Bearish
The longer it moves sideways, the more likely it is to rise—the breakout could happen in an instant!
This market is so stifling it’s hard to breathe. The big players are secretly gearing up for a major move!
Don’t let that earlier wick scare you. The bears are like grasshoppers in autumn—they won’t be around for much longer!
Look at the chart: after an extremely fearful shakeout from 2378 to 2171, $ETH now has the MA5, MA10, and MA20 tightly converging at 2243.
It’s like a spring compressed to its limit. This is the last calm before the storm—the market could turn at any moment!
And look at the news above: Ethereum has introduced another proposal to improve wallet functionality.
The fundamentals keep moving forward, and that’s our biggest source of confidence!
Here’s how the play unfolds:
Keep the hard floor firmly at 2210. If the candle body breaks below this consolidation range, cut losses immediately and get out—no holding on stubbornly.
But if it breaks decisively above the key resistance at 2260 on strong volume, the next targets are 2300 to 2350! Weld the doors shut—nobody’s getting off!
There’s a famous Wall Street saying: “Wait patiently for a clear signal to emerge, and avoid periods of high-risk ambiguity.”
Right now, this sideways movement is the big players building up for a move. We’ve already secured our positions near the bottom; now we just let time do its work!
$BTC
$ZEC
Fed officials signal rate hikes, while expectations for December remain divided

1
·
--
Bullish
1031 afternoon market analysis
Bitcoin is still hovering around 77,000, and ETH has climbed back above 2,240.
But I still feel the same way: I don't want to chase at these levels.
After liquidating so many longs, the whales aren't going to push the price up that easily. There's probably one last wick down coming to shake out those who just bought the dip and those holding losing positions.
Bitcoin $BTC is eyeing around 76,000, and ETH $ETH is eyeing around 2,220.
If we get another wick down that quickly recovers, then I think we're about there.
Wait for that final drop.
Once the wick is in, we can get ready to enter.

3
Log in to explore more content
Join global crypto users on Binance Square
⚡️ Get latest and useful information about crypto.
💬 Trusted by the world’s largest crypto exchange.
👍 Discover real insights from verified creators.
Email / Phone number
Trending Topics
BinanceSAFUFundTransferCompleted7499BTC
5,248 views
240 Discussing
BREAKING: Binance Recovers 90% of $6.3B - My Take
Guys, biggest recovery in crypto history just happened.
Binance just confirmed in its 3rd security update on Oct 31:
90% of the stolen assets have been replenished - up from 80% yesterday.
What happened?
Total breach: ∼$6.3B on Oct 29 (hot wallets)Binance set aside $6.34B from company funds to cover itSources used: Corporate Treasury + SAFU Fund ($1B fund) + Futures Insurance FundResult: 10 major tokens now 100% backed: $BTC, $ETH, $USDT, $BNB, $SOL, $USDC, $XRP, $USD1, $RLUSD, $ZECRemaining 10% are less liquid tokens, will take more time to sourceWithdrawals expected to resume Nov 1
My analysis: This is why Binance is still #1. No other exchange could cover $6.3B from its own pocket in 2 days. This shows SAFU actually works.
Is this enough to bring back trust? Or you are still worried?
Drop your opinion below - I will read all comments.
Binance #SAFU #CryptoRecovery #BinanceSecurity #BTC#binancesafufundtransfercompleted7499btc
True News
·13 Likes
·5.6k views
BinanceRecovery90% of stolen assets
38,757 views
94 Discussing
YiHe:ProofOfReserves:10TokensAt100%Backing
76,490 views
414 Discussing