
烤鸡翅
255 Posts

烤鸡翅
Report
Block User
我将无我,不负币安,一个勤劳的聪明的愚昧的长期交易员,我想和时间交朋友。
Open Trade

VIRTUAL Holder
High-Frequency Trader
5.3 Years
41 Following
154 Followers
394 Liked
Posts
Portfolio
·
--
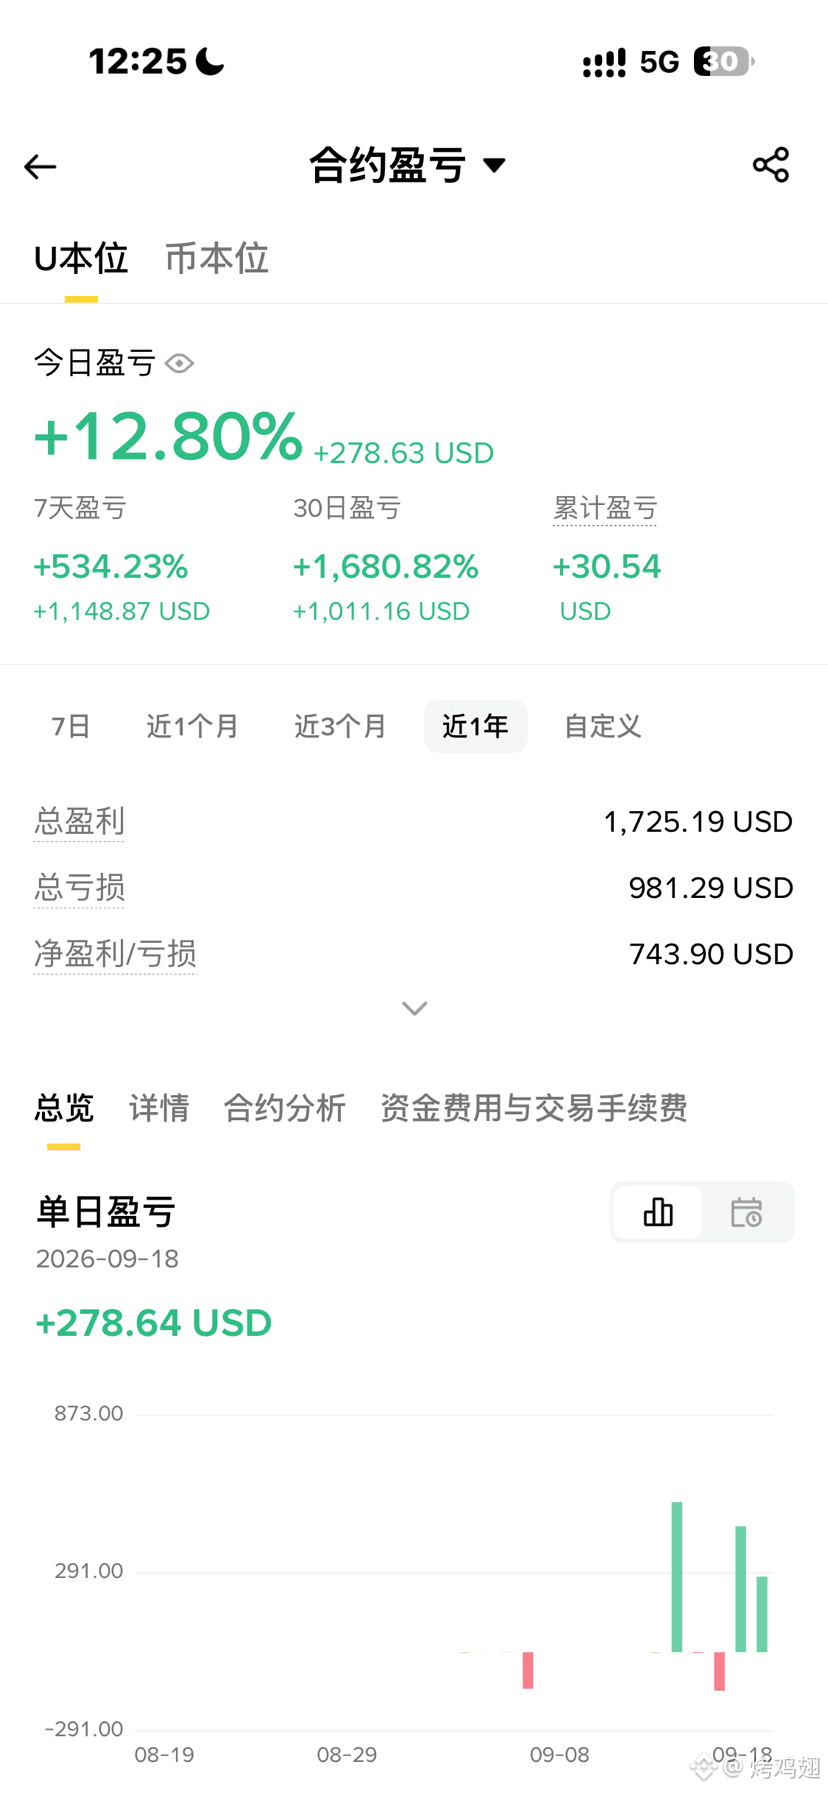
The recent trades got back the $800 I lost when I was in college (but I'm still down about 10%, around $15,000; other accounts' contracts and spot are also up by $2,500)
Fafa fa fa, follow Brother Guozi
The recent trades got back the $800 I lost when I was in college (but I'm still down about 10%, around $15,000; other accounts' contracts and spot are also up by $2,500)
Fafa fa fa, follow Brother Guozi
Fafa fa fa, follow Brother Guozi
18
·
--
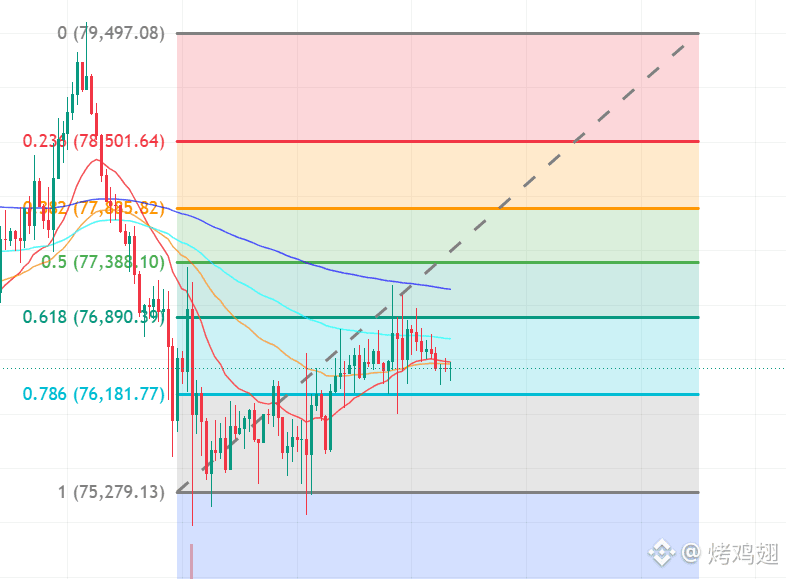
Although Ethereum’s 1-hour candle this time has reclaimed, it first broke down through the invalidation price of the most recent “draft” at 2,436.33. The original long-entry plan has already expired; you can’t just treat it as still valid because there was a subsequent rebound. Now it’s trading around 2,455 intraday—I’d rather wait for the pullback and then look for the follow-through. Everyone can also chase directly; just get in first and think it out—set your stop at the previous low.
New complete 1H: low 2,435.55, close 2,447.47. It has reclaimed and is now watching support at 2,441.98, and it has also reclaimed the old resistance at 2,445.57. This is fresh evidence of the hourly reclaim. The background of the 4H highs continuing to step down hasn’t changed; this one hour is still not enough to indicate the correction has ended. If it can stand above, then the bigger move will start.
For Ethereum’s 4H chart, EMA20 is still below EMA50. RSI is around 48.5; the “repair” hasn’t flipped into a bullish advantage yet. The latest complete 4H volume is only 0.27 times the average volume of the previous 20 candles. The total volume of the most recent 6 candles is 0.79 times that of the prior 6 candles. There are signs of support, but we still lack evidence to confirm sustained continuation.
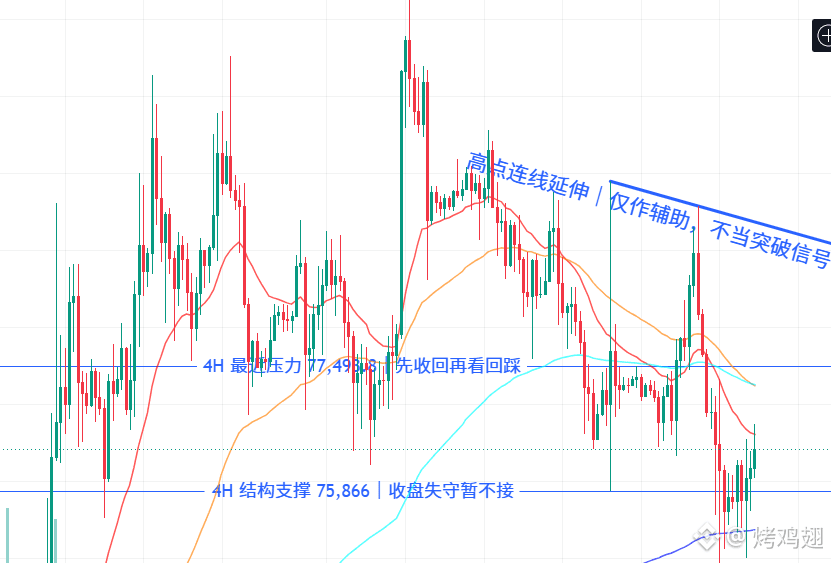
For Bitcoin, the new 1H close is 76,559.4, and it has also reclaimed above 76,543.7, but the latest 4H is still closing below it. Intraday 76,666.2 has already approached the 76,706.2—76,938 recent high zone. I won’t take it for now; I’ll wait to see how price reacts when it retests that old resistance on the hourly. Main support to keep is 75,866; if the 4H closes below, I’ll give up the original continuation plan.
But honestly, I do have an altcoin long position. If BTC can break above 77400—like it’s holding above 76600 right now—I’m really expecting the next leg of the move to really take off. And at that time, my spot position’s highest point I didn’t exit, but now I’ve given it all back and I’m in the red again. It’s so damn frustrating!!!
$BTC $ETH
Although Ethereum’s 1-hour candle this time has reclaimed, it first broke down through the invalidation price of the most recent “draft” at 2,436.33. The original long-entry plan has already expired; you can’t just treat it as still valid because there was a subsequent rebound. Now it’s trading around 2,455 intraday—I’d rather wait for the pullback and then look for the follow-through. Everyone can also chase directly; just get in first and think it out—set your stop at the previous low.
New complete 1H: low 2,435.55, close 2,447.47. It has reclaimed and is now watching support at 2,441.98, and it has also reclaimed the old resistance at 2,445.57. This is fresh evidence of the hourly reclaim. The background of the 4H highs continuing to step down hasn’t changed; this one hour is still not enough to indicate the correction has ended. If it can stand above, then the bigger move will start.
For Ethereum’s 4H chart, EMA20 is still below EMA50. RSI is around 48.5; the “repair” hasn’t flipped into a bullish advantage yet. The latest complete 4H volume is only 0.27 times the average volume of the previous 20 candles. The total volume of the most recent 6 candles is 0.79 times that of the prior 6 candles. There are signs of support, but we still lack evidence to confirm sustained continuation.
For Bitcoin, the new 1H close is 76,559.4, and it has also reclaimed above 76,543.7, but the latest 4H is still closing below it. Intraday 76,666.2 has already approached the 76,706.2—76,938 recent high zone. I won’t take it for now; I’ll wait to see how price reacts when it retests that old resistance on the hourly. Main support to keep is 75,866; if the 4H closes below, I’ll give up the original continuation plan.
But honestly, I do have an altcoin long position. If BTC can break above 77400—like it’s holding above 76600 right now—I’m really expecting the next leg of the move to really take off. And at that time, my spot position’s highest point I didn’t exit, but now I’ve given it all back and I’m in the red again. It’s so damn frustrating!!!
$BTC $ETH
New complete 1H: low 2,435.55, close 2,447.47. It has reclaimed and is now watching support at 2,441.98, and it has also reclaimed the old resistance at 2,445.57. This is fresh evidence of the hourly reclaim. The background of the 4H highs continuing to step down hasn’t changed; this one hour is still not enough to indicate the correction has ended. If it can stand above, then the bigger move will start.
For Ethereum’s 4H chart, EMA20 is still below EMA50. RSI is around 48.5; the “repair” hasn’t flipped into a bullish advantage yet. The latest complete 4H volume is only 0.27 times the average volume of the previous 20 candles. The total volume of the most recent 6 candles is 0.79 times that of the prior 6 candles. There are signs of support, but we still lack evidence to confirm sustained continuation.
For Bitcoin, the new 1H close is 76,559.4, and it has also reclaimed above 76,543.7, but the latest 4H is still closing below it. Intraday 76,666.2 has already approached the 76,706.2—76,938 recent high zone. I won’t take it for now; I’ll wait to see how price reacts when it retests that old resistance on the hourly. Main support to keep is 75,866; if the 4H closes below, I’ll give up the original continuation plan.
But honestly, I do have an altcoin long position. If BTC can break above 77400—like it’s holding above 76600 right now—I’m really expecting the next leg of the move to really take off. And at that time, my spot position’s highest point I didn’t exit, but now I’ve given it all back and I’m in the red again. It’s so damn frustrating!!!
$BTC $ETH
1
253
·
--
This square—anyone who lets you pay an entry fee and then tells you how to trade is a scammer. Don’t look at them.
So many high-quality bloggers—ignore them.
Nuts (nuts), Beijing big shots
Dan Zong, a funny blogger on this square
………
A whole bunch
Add to the comments: who do you think is a high-quality blogger, and who is a scammer?🤥$BTC
This square—anyone who lets you pay an entry fee and then tells you how to trade is a scammer. Don’t look at them.
So many high-quality bloggers—ignore them.
Nuts (nuts), Beijing big shots
Dan Zong, a funny blogger on this square
………
A whole bunch
Add to the comments: who do you think is a high-quality blogger, and who is a scammer?🤥$BTC
So many high-quality bloggers—ignore them.
Nuts (nuts), Beijing big shots
Dan Zong, a funny blogger on this square
………
A whole bunch
Add to the comments: who do you think is a high-quality blogger, and who is a scammer?🤥$BTC
112
·
--
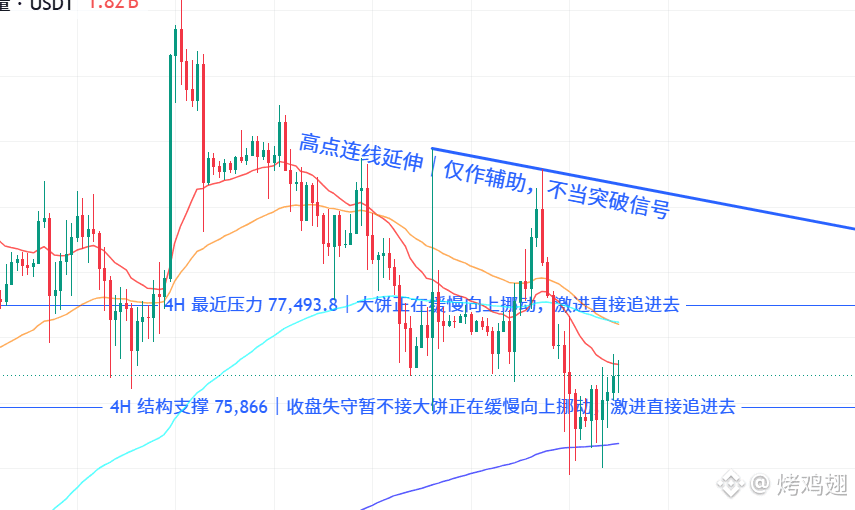
The big coin has already reported 76,985.9, and Ethereum is also at 2,467.98, but the just-finished 4 hours did not close at any of these levels. The most worth paying attention to is this current rally: can it truly reclaim the overhead pressure that previously surged through but failed to hold? For now, I’m not chasing—both coins still haven’t confirmed any new 4-hour breakout.
Ethereum is more deserving of close scrutiny. The new candle’s low is 2,426.26, higher than the previous one’s 2,423.47; however, its high dropped from 2,454.88 down to 2,448.56, and the close slipped from 2,443.54 to 2,441.48. The up-and-down fluctuations have narrowed, which suggests the old pressure area still has bids absorbing—yet buyers haven’t pushed the price upward strongly enough to lift the lows, so you can’t just label it as a reversal.
The 2,429.99 level mentioned in the last post was broken through again during the session this time, but the price still closed back above it. That means the earlier assessment about support/absorption hasn’t been invalidated. Still, resistance above at 2,445.57 wasn’t reclaimed; afterwards there were two actual highs at 2,447.81 and 2,454.88. By complete closing prices, the first resistance is only about $4 away—roughly 0.10 times ATR14 (about 40.4). This kind of room isn’t worth taking risks for.
Volume hasn’t provided confidence to chase. Ethereum’s latest fully formed candle has only 0.49 times the average volume of the previous 20 candles, down from 0.53 times the previous one; and the ratio of the total volume of the recent 6 candles versus the prior 6 has fallen from 0.86 to 0.80. A low-volume consolidation can continue to be observed, but you can’t conclude from that alone that sellers’ supply has been exhausted. The close is still below the EMA20 (around 2,444), and EMA20 is still below EMA50 (around 2,464). RSI14 is about 47, and momentum is still not in a clearly bullish advantage state.
If I’m going to get long, I’ll wait for this intraday upswing to play out into a full close: first, see whether it can close back over these nearby resistance levels, then watch whether the pullback can hold. If it returns near 2,429.99, I’ll still wait for the selloff to stop dipping and for the price to reclaim—then reassess the upside room. If it closes back below that level again, I’ll abandon this support-holding thesis and won’t move the defensive level lower.
For the big coin, the new closing price is 76,448.2, which is $14.2 higher than the previous one. The latest high at 76,744.8 is slightly higher, but the close is still below the original observation resistance of 76,543.7 — about 0.11 ATR away. Just crossing intraday doesn’t mean it’s established. EMA20 is around 76,572, still below EMA50 around 77,172. RSI14 is about 46, and the rebound structure hasn’t changed materially.
The big coin’s single-candle volume ratio rebounded from 0.38 to 0.52, but the total volume over the last 6 candles is still only 0.69—there hasn’t been sustained expansion to push forward. First, wait for 76,543.7 to be reclaimed and for price to pull back and hold. Then we can look at 76,744.8—don’t jump directly to 77,493.8. Major support still continues to use 75,866; if it closes back below and breaks it again, I’ll temporarily not enter. The current quote looks stronger, but the conditions for going long still need to be confirmed by the close and a successful pullback.
$BTC $ETH
The big coin has already reported 76,985.9, and Ethereum is also at 2,467.98, but the just-finished 4 hours did not close at any of these levels. The most worth paying attention to is this current rally: can it truly reclaim the overhead pressure that previously surged through but failed to hold? For now, I’m not chasing—both coins still haven’t confirmed any new 4-hour breakout.
Ethereum is more deserving of close scrutiny. The new candle’s low is 2,426.26, higher than the previous one’s 2,423.47; however, its high dropped from 2,454.88 down to 2,448.56, and the close slipped from 2,443.54 to 2,441.48. The up-and-down fluctuations have narrowed, which suggests the old pressure area still has bids absorbing—yet buyers haven’t pushed the price upward strongly enough to lift the lows, so you can’t just label it as a reversal.
The 2,429.99 level mentioned in the last post was broken through again during the session this time, but the price still closed back above it. That means the earlier assessment about support/absorption hasn’t been invalidated. Still, resistance above at 2,445.57 wasn’t reclaimed; afterwards there were two actual highs at 2,447.81 and 2,454.88. By complete closing prices, the first resistance is only about $4 away—roughly 0.10 times ATR14 (about 40.4). This kind of room isn’t worth taking risks for.
Volume hasn’t provided confidence to chase. Ethereum’s latest fully formed candle has only 0.49 times the average volume of the previous 20 candles, down from 0.53 times the previous one; and the ratio of the total volume of the recent 6 candles versus the prior 6 has fallen from 0.86 to 0.80. A low-volume consolidation can continue to be observed, but you can’t conclude from that alone that sellers’ supply has been exhausted. The close is still below the EMA20 (around 2,444), and EMA20 is still below EMA50 (around 2,464). RSI14 is about 47, and momentum is still not in a clearly bullish advantage state.
If I’m going to get long, I’ll wait for this intraday upswing to play out into a full close: first, see whether it can close back over these nearby resistance levels, then watch whether the pullback can hold. If it returns near 2,429.99, I’ll still wait for the selloff to stop dipping and for the price to reclaim—then reassess the upside room. If it closes back below that level again, I’ll abandon this support-holding thesis and won’t move the defensive level lower.
For the big coin, the new closing price is 76,448.2, which is $14.2 higher than the previous one. The latest high at 76,744.8 is slightly higher, but the close is still below the original observation resistance of 76,543.7 — about 0.11 ATR away. Just crossing intraday doesn’t mean it’s established. EMA20 is around 76,572, still below EMA50 around 77,172. RSI14 is about 46, and the rebound structure hasn’t changed materially.
The big coin’s single-candle volume ratio rebounded from 0.38 to 0.52, but the total volume over the last 6 candles is still only 0.69—there hasn’t been sustained expansion to push forward. First, wait for 76,543.7 to be reclaimed and for price to pull back and hold. Then we can look at 76,744.8—don’t jump directly to 77,493.8. Major support still continues to use 75,866; if it closes back below and breaks it again, I’ll temporarily not enter. The current quote looks stronger, but the conditions for going long still need to be confirmed by the close and a successful pullback.
$BTC $ETH
Ethereum is more deserving of close scrutiny. The new candle’s low is 2,426.26, higher than the previous one’s 2,423.47; however, its high dropped from 2,454.88 down to 2,448.56, and the close slipped from 2,443.54 to 2,441.48. The up-and-down fluctuations have narrowed, which suggests the old pressure area still has bids absorbing—yet buyers haven’t pushed the price upward strongly enough to lift the lows, so you can’t just label it as a reversal.
The 2,429.99 level mentioned in the last post was broken through again during the session this time, but the price still closed back above it. That means the earlier assessment about support/absorption hasn’t been invalidated. Still, resistance above at 2,445.57 wasn’t reclaimed; afterwards there were two actual highs at 2,447.81 and 2,454.88. By complete closing prices, the first resistance is only about $4 away—roughly 0.10 times ATR14 (about 40.4). This kind of room isn’t worth taking risks for.
Volume hasn’t provided confidence to chase. Ethereum’s latest fully formed candle has only 0.49 times the average volume of the previous 20 candles, down from 0.53 times the previous one; and the ratio of the total volume of the recent 6 candles versus the prior 6 has fallen from 0.86 to 0.80. A low-volume consolidation can continue to be observed, but you can’t conclude from that alone that sellers’ supply has been exhausted. The close is still below the EMA20 (around 2,444), and EMA20 is still below EMA50 (around 2,464). RSI14 is about 47, and momentum is still not in a clearly bullish advantage state.
If I’m going to get long, I’ll wait for this intraday upswing to play out into a full close: first, see whether it can close back over these nearby resistance levels, then watch whether the pullback can hold. If it returns near 2,429.99, I’ll still wait for the selloff to stop dipping and for the price to reclaim—then reassess the upside room. If it closes back below that level again, I’ll abandon this support-holding thesis and won’t move the defensive level lower.
For the big coin, the new closing price is 76,448.2, which is $14.2 higher than the previous one. The latest high at 76,744.8 is slightly higher, but the close is still below the original observation resistance of 76,543.7 — about 0.11 ATR away. Just crossing intraday doesn’t mean it’s established. EMA20 is around 76,572, still below EMA50 around 77,172. RSI14 is about 46, and the rebound structure hasn’t changed materially.
The big coin’s single-candle volume ratio rebounded from 0.38 to 0.52, but the total volume over the last 6 candles is still only 0.69—there hasn’t been sustained expansion to push forward. First, wait for 76,543.7 to be reclaimed and for price to pull back and hold. Then we can look at 76,744.8—don’t jump directly to 77,493.8. Major support still continues to use 75,866; if it closes back below and breaks it again, I’ll temporarily not enter. The current quote looks stronger, but the conditions for going long still need to be confirmed by the close and a successful pullback.
$BTC $ETH
224
·
--
This time, Ether provided the pullback that the previous draft was waiting for: after reclaiming 2,429.99, the latest 4-hour low dipped to 2,423.47, and it ultimately closed at 2,443.54. During the pullback, it did break below the old resistance, but the close moved back above it, and local follow-through is showing. However, price is now very close to the resistance overhead, so I’ll keep looking for opportunities to go long—I won’t chase.
Comparing to the actual previously published post, Ether went from not yet reclaiming 2,430 to reclaiming and then testing again. Comparing to the most recent generated draft, an additional complete 4-hour candlestick has formed, so we can’t say “the pullback hasn’t appeared yet.” This step is worth acknowledging, but what it confirms is that someone is stepping in around the old resistance—it doesn’t mean the entire decline has already reversed.
The volume makes this follow-through look relatively mild. The latest complete candle’s trading volume is 0.53 times the average volume of the prior 20 candles, lower than the previous candle’s 0.70 times; and the total volume over the last 6 candles improved from 0.80 times (the prior 6) to 0.86 times. Short-term activity has recovered somewhat, but there’s not yet evidence of sustained volume expansion pushing higher. A pullback with reduced volume followed by a reclaim is a good sign, but it doesn’t directly imply that selling pressure has run out.
Ether’s close is still slightly below the EMA20 around 2,444, and EMA20 is still below the EMA50 around 2,465. RSI14 has risen to around 48, indicating momentum is moving toward neutral—not a clear long-dominant advantage yet. The low has lifted from 2,356.18 to 2,366.01, but that only suggests an improvement in local downside stabilization; two higher lows aren’t enough to confirm a bottom.
For now, first look at the prior high at 2,445.57: the latest candle pushed up to 2,454.88, but it closed back below it. With only about $2 distance from the complete close, less than 0.05x of the ATR14 (about 41.8), and with another level at 2,447.81—an earlier rebound high—just above, we can’t simply skip over it and look further.
Next, use 2,429.99 as the main area to observe the follow-through. Only if it pulls back and can reclaim the level while the low doesn’t keep moving lower should you combine it with nearby resistance to consider going long; or alternatively, wait for those overhead highs to be fully reclaimed on complete 4-hour closes, then reassess the pullback. If it closes back below 2,429.99, then give up the new long-take on this pullback idea. The original support at 2,413.56 is still intact; once it’s lost, I won’t take a long for the moment and won’t expand the defensive range.
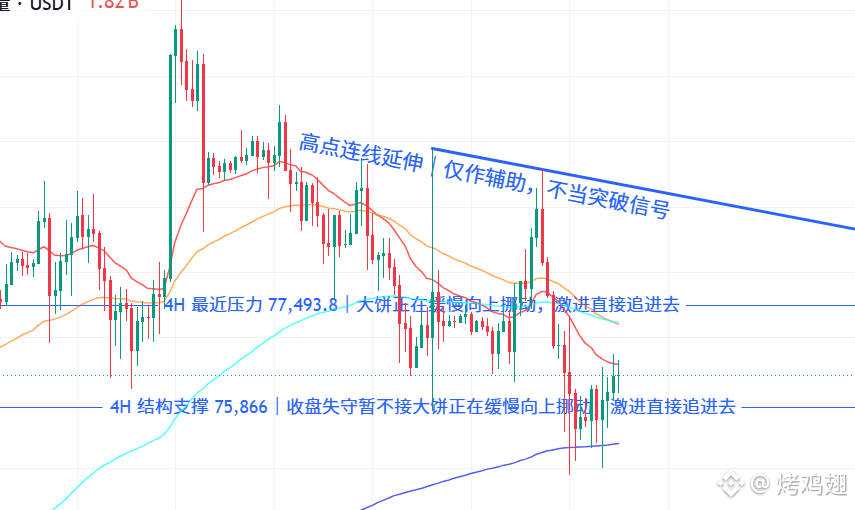
As for the big coin (BTC), progress is much smaller: the latest complete close is 76,434, only about $27 higher than the prior one. It’s still below the EMA20 around 76,585 and the EMA50 around 77,201, and RSI is around 46. The latest volume ratio is only 0.38; the total volume over the last 6 candles is 0.70, so the rebound still lacks strength. First watch 76,543.7—if the latest candle breaks above it but then closes back below, the space to chase is very narrow (about 0.12 ATR from the close).
The earlier condition of waiting for a reclaim after 77,493.8 has not appeared. 75,866 was previously broken to the downside on a close; it was later reclaimed. Now it continues to act as a defensive observation level—if it breaks again, don’t go long. Ether has shown follow-through already, but BTC hasn’t provided long confirmation in sync yet.
$BTC $ETH
This time, Ether provided the pullback that the previous draft was waiting for: after reclaiming 2,429.99, the latest 4-hour low dipped to 2,423.47, and it ultimately closed at 2,443.54. During the pullback, it did break below the old resistance, but the close moved back above it, and local follow-through is showing. However, price is now very close to the resistance overhead, so I’ll keep looking for opportunities to go long—I won’t chase.
Comparing to the actual previously published post, Ether went from not yet reclaiming 2,430 to reclaiming and then testing again. Comparing to the most recent generated draft, an additional complete 4-hour candlestick has formed, so we can’t say “the pullback hasn’t appeared yet.” This step is worth acknowledging, but what it confirms is that someone is stepping in around the old resistance—it doesn’t mean the entire decline has already reversed.
The volume makes this follow-through look relatively mild. The latest complete candle’s trading volume is 0.53 times the average volume of the prior 20 candles, lower than the previous candle’s 0.70 times; and the total volume over the last 6 candles improved from 0.80 times (the prior 6) to 0.86 times. Short-term activity has recovered somewhat, but there’s not yet evidence of sustained volume expansion pushing higher. A pullback with reduced volume followed by a reclaim is a good sign, but it doesn’t directly imply that selling pressure has run out.
Ether’s close is still slightly below the EMA20 around 2,444, and EMA20 is still below the EMA50 around 2,465. RSI14 has risen to around 48, indicating momentum is moving toward neutral—not a clear long-dominant advantage yet. The low has lifted from 2,356.18 to 2,366.01, but that only suggests an improvement in local downside stabilization; two higher lows aren’t enough to confirm a bottom.
For now, first look at the prior high at 2,445.57: the latest candle pushed up to 2,454.88, but it closed back below it. With only about $2 distance from the complete close, less than 0.05x of the ATR14 (about 41.8), and with another level at 2,447.81—an earlier rebound high—just above, we can’t simply skip over it and look further.
Next, use 2,429.99 as the main area to observe the follow-through. Only if it pulls back and can reclaim the level while the low doesn’t keep moving lower should you combine it with nearby resistance to consider going long; or alternatively, wait for those overhead highs to be fully reclaimed on complete 4-hour closes, then reassess the pullback. If it closes back below 2,429.99, then give up the new long-take on this pullback idea. The original support at 2,413.56 is still intact; once it’s lost, I won’t take a long for the moment and won’t expand the defensive range.
As for the big coin (BTC), progress is much smaller: the latest complete close is 76,434, only about $27 higher than the prior one. It’s still below the EMA20 around 76,585 and the EMA50 around 77,201, and RSI is around 46. The latest volume ratio is only 0.38; the total volume over the last 6 candles is 0.70, so the rebound still lacks strength. First watch 76,543.7—if the latest candle breaks above it but then closes back below, the space to chase is very narrow (about 0.12 ATR from the close).
The earlier condition of waiting for a reclaim after 77,493.8 has not appeared. 75,866 was previously broken to the downside on a close; it was later reclaimed. Now it continues to act as a defensive observation level—if it breaks again, don’t go long. Ether has shown follow-through already, but BTC hasn’t provided long confirmation in sync yet.
$BTC $ETH
Comparing to the actual previously published post, Ether went from not yet reclaiming 2,430 to reclaiming and then testing again. Comparing to the most recent generated draft, an additional complete 4-hour candlestick has formed, so we can’t say “the pullback hasn’t appeared yet.” This step is worth acknowledging, but what it confirms is that someone is stepping in around the old resistance—it doesn’t mean the entire decline has already reversed.
The volume makes this follow-through look relatively mild. The latest complete candle’s trading volume is 0.53 times the average volume of the prior 20 candles, lower than the previous candle’s 0.70 times; and the total volume over the last 6 candles improved from 0.80 times (the prior 6) to 0.86 times. Short-term activity has recovered somewhat, but there’s not yet evidence of sustained volume expansion pushing higher. A pullback with reduced volume followed by a reclaim is a good sign, but it doesn’t directly imply that selling pressure has run out.
Ether’s close is still slightly below the EMA20 around 2,444, and EMA20 is still below the EMA50 around 2,465. RSI14 has risen to around 48, indicating momentum is moving toward neutral—not a clear long-dominant advantage yet. The low has lifted from 2,356.18 to 2,366.01, but that only suggests an improvement in local downside stabilization; two higher lows aren’t enough to confirm a bottom.
For now, first look at the prior high at 2,445.57: the latest candle pushed up to 2,454.88, but it closed back below it. With only about $2 distance from the complete close, less than 0.05x of the ATR14 (about 41.8), and with another level at 2,447.81—an earlier rebound high—just above, we can’t simply skip over it and look further.
Next, use 2,429.99 as the main area to observe the follow-through. Only if it pulls back and can reclaim the level while the low doesn’t keep moving lower should you combine it with nearby resistance to consider going long; or alternatively, wait for those overhead highs to be fully reclaimed on complete 4-hour closes, then reassess the pullback. If it closes back below 2,429.99, then give up the new long-take on this pullback idea. The original support at 2,413.56 is still intact; once it’s lost, I won’t take a long for the moment and won’t expand the defensive range.
As for the big coin (BTC), progress is much smaller: the latest complete close is 76,434, only about $27 higher than the prior one. It’s still below the EMA20 around 76,585 and the EMA50 around 77,201, and RSI is around 46. The latest volume ratio is only 0.38; the total volume over the last 6 candles is 0.70, so the rebound still lacks strength. First watch 76,543.7—if the latest candle breaks above it but then closes back below, the space to chase is very narrow (about 0.12 ATR from the close).
The earlier condition of waiting for a reclaim after 77,493.8 has not appeared. 75,866 was previously broken to the downside on a close; it was later reclaimed. Now it continues to act as a defensive observation level—if it breaks again, don’t go long. Ether has shown follow-through already, but BTC hasn’t provided long confirmation in sync yet.
$BTC $ETH
131
·
--
Circle announced that the Arc public mainnet would go live on September 16, pushing stablecoin financial infrastructure one step closer to real-world use. My view is that this is worth tracking, but any long opportunity should be found in cash flows and revenue—not by seeing a new chain launch and assuming there is an “official beneficiary coin” you can buy immediately.
There are two facts this time that particularly affect my judgment: network fees are paid in USDC; and while Circle has disclosed that it completed ARC token genesis minting, it also explicitly stated that this does not constitute a commitment to publicly launch a token. Therefore, mainnet launch, token minting, and public circulation are three different things; you can’t combine them into a single trade-time narrative like “a new coin is here.”
Arc’s significance lies in its attempt to put payments, trading, and borrowing into the same stablecoin settlement environment. If businesses’ settlement funds and users’ balances are willing to stay, applications may be able to generate sustained trading and borrowing demand—leading to fee and interest income. That is the logic behind why I’m interested in this direction, but the opening of the mainnet itself has not yet proven that this business loop is already working.
Who truly benefits needs to be assessed in layers. USDC may gain more usage scenarios, but its goal is to maintain the value of the U.S. dollar; usage growth does not automatically mean coinholders’ value increases. Only Circle and the real service-providing applications—those that actually generate and deliver services—could potentially earn economic benefits from new business. As for related protocol tokens, you still need to verify whether income is transferred to token holders through effective mechanisms; you can’t skip this step.
I also won’t treat the ecosystem list as an investment list directly. Integrating a chain might simply add another entry point. If money is merely moved from elsewhere and the project’s total revenue doesn’t increase, the valuation may not necessarily deserve an upgrade. Even if there are many new transactions, you still need to distinguish how much comes from subsidies and short-term speculation versus how much comes from users who are willing to pay long-term.
There’s another boundary in the announcement that’s worth reading carefully: the optional privacy features for the entire network are still under development. The functions that institutions need won’t all be completed alongside the mainnet launch. When assessing adoption speed, you should confirm item by item whether the product is usable and whether customers are actually using it—not assume that every capability in the roadmap should be counted as today’s value.
Next, I’ll look at the net capital inflow after the mainnet goes live, the retention of stablecoin balances, genuine borrowing demand, and the application’s income after deducting incentives. Only if funds enter and are then used continuously—and if a token has a clear value-capture mechanism—it would be worth adding to a long watchlist. On price action, I’ll wait for buy support after a pullback, rather than chasing on the initial-day hype.
If what we see is just short-term capital migration and subsidy-driven trading, or if the token price rises but the business evidence doesn’t arrive for a long time, I’ll continue to wait. Arc offers a new market worth studying; the most valuable next step is identifying who can turn settlement demand into revenue, and then deciding what to buy. #Arc #stablecoin
Circle announced that the Arc public mainnet would go live on September 16, pushing stablecoin financial infrastructure one step closer to real-world use. My view is that this is worth tracking, but any long opportunity should be found in cash flows and revenue—not by seeing a new chain launch and assuming there is an “official beneficiary coin” you can buy immediately.
There are two facts this time that particularly affect my judgment: network fees are paid in USDC; and while Circle has disclosed that it completed ARC token genesis minting, it also explicitly stated that this does not constitute a commitment to publicly launch a token. Therefore, mainnet launch, token minting, and public circulation are three different things; you can’t combine them into a single trade-time narrative like “a new coin is here.”
Arc’s significance lies in its attempt to put payments, trading, and borrowing into the same stablecoin settlement environment. If businesses’ settlement funds and users’ balances are willing to stay, applications may be able to generate sustained trading and borrowing demand—leading to fee and interest income. That is the logic behind why I’m interested in this direction, but the opening of the mainnet itself has not yet proven that this business loop is already working.
Who truly benefits needs to be assessed in layers. USDC may gain more usage scenarios, but its goal is to maintain the value of the U.S. dollar; usage growth does not automatically mean coinholders’ value increases. Only Circle and the real service-providing applications—those that actually generate and deliver services—could potentially earn economic benefits from new business. As for related protocol tokens, you still need to verify whether income is transferred to token holders through effective mechanisms; you can’t skip this step.
I also won’t treat the ecosystem list as an investment list directly. Integrating a chain might simply add another entry point. If money is merely moved from elsewhere and the project’s total revenue doesn’t increase, the valuation may not necessarily deserve an upgrade. Even if there are many new transactions, you still need to distinguish how much comes from subsidies and short-term speculation versus how much comes from users who are willing to pay long-term.
There’s another boundary in the announcement that’s worth reading carefully: the optional privacy features for the entire network are still under development. The functions that institutions need won’t all be completed alongside the mainnet launch. When assessing adoption speed, you should confirm item by item whether the product is usable and whether customers are actually using it—not assume that every capability in the roadmap should be counted as today’s value.
Next, I’ll look at the net capital inflow after the mainnet goes live, the retention of stablecoin balances, genuine borrowing demand, and the application’s income after deducting incentives. Only if funds enter and are then used continuously—and if a token has a clear value-capture mechanism—it would be worth adding to a long watchlist. On price action, I’ll wait for buy support after a pullback, rather than chasing on the initial-day hype.
If what we see is just short-term capital migration and subsidy-driven trading, or if the token price rises but the business evidence doesn’t arrive for a long time, I’ll continue to wait. Arc offers a new market worth studying; the most valuable next step is identifying who can turn settlement demand into revenue, and then deciding what to buy. #Arc #stablecoin
There are two facts this time that particularly affect my judgment: network fees are paid in USDC; and while Circle has disclosed that it completed ARC token genesis minting, it also explicitly stated that this does not constitute a commitment to publicly launch a token. Therefore, mainnet launch, token minting, and public circulation are three different things; you can’t combine them into a single trade-time narrative like “a new coin is here.”
Arc’s significance lies in its attempt to put payments, trading, and borrowing into the same stablecoin settlement environment. If businesses’ settlement funds and users’ balances are willing to stay, applications may be able to generate sustained trading and borrowing demand—leading to fee and interest income. That is the logic behind why I’m interested in this direction, but the opening of the mainnet itself has not yet proven that this business loop is already working.
Who truly benefits needs to be assessed in layers. USDC may gain more usage scenarios, but its goal is to maintain the value of the U.S. dollar; usage growth does not automatically mean coinholders’ value increases. Only Circle and the real service-providing applications—those that actually generate and deliver services—could potentially earn economic benefits from new business. As for related protocol tokens, you still need to verify whether income is transferred to token holders through effective mechanisms; you can’t skip this step.
I also won’t treat the ecosystem list as an investment list directly. Integrating a chain might simply add another entry point. If money is merely moved from elsewhere and the project’s total revenue doesn’t increase, the valuation may not necessarily deserve an upgrade. Even if there are many new transactions, you still need to distinguish how much comes from subsidies and short-term speculation versus how much comes from users who are willing to pay long-term.
There’s another boundary in the announcement that’s worth reading carefully: the optional privacy features for the entire network are still under development. The functions that institutions need won’t all be completed alongside the mainnet launch. When assessing adoption speed, you should confirm item by item whether the product is usable and whether customers are actually using it—not assume that every capability in the roadmap should be counted as today’s value.
Next, I’ll look at the net capital inflow after the mainnet goes live, the retention of stablecoin balances, genuine borrowing demand, and the application’s income after deducting incentives. Only if funds enter and are then used continuously—and if a token has a clear value-capture mechanism—it would be worth adding to a long watchlist. On price action, I’ll wait for buy support after a pullback, rather than chasing on the initial-day hype.
If what we see is just short-term capital migration and subsidy-driven trading, or if the token price rises but the business evidence doesn’t arrive for a long time, I’ll continue to wait. Arc offers a new market worth studying; the most valuable next step is identifying who can turn settlement demand into revenue, and then deciding what to buy. #Arc #stablecoin
129
·
--
On September 16, the U.S. Federal Reserve announced a 25-basis-point rate hike, raising the target range for the federal funds rate to 3.75%–4%. My view is that the threshold for going long on crypto assets has increased. It’s worth putting on the watchlist for now, but there’s still no reason to rush into a rebound just because the “shoe has dropped.”
This decision should be read together with the dot plot released on the same day. In the Fed’s official projections, the median federal funds rate at the end of 2026 is 4.1%, which is higher than the midpoint of the range adjusted this time. However, the dot plot is just officials’ projections based on their individual assumptions—it doesn’t mean the timing of the next rate hike has already been voted through. Reading it as a certain trading calendar would underestimate how future data could change the outlook.
When this filters into crypto prices, it first affects the cost of capital. With higher return thresholds for short-term U.S. dollar assets, investors holding bitcoin that yields no interest will demand stronger reasons for price strength. Similarly, leveraged positions need to cover higher costs. If these changes reduce risk exposure, selling pressure will further transmit to spot markets. That is the transmission path—not everything has already happened at every step.
Another easy misread is equating a rate hike directly with an economic recession. The statement also describes resilient expansion in economic activity and durable domestic spending. For the crypto market, the challenge may be that the economy can still withstand higher rates while easing takes longer to arrive, rather than that the economy will immediately lose momentum. This will test valuations that mainly rely on cheap liquidity.
If I really want to find opportunities to go long, I would first observe bitcoin. The reason is that it’s better suited to test whether overall buy-side demand in the crypto market has returned—rather than whether bitcoin benefits directly from the rate hike. Altcoins have an additional hurdle: whether the projects have sustained demand for their use cases, and whether the tokens can capture revenue or other value. Just having a macro rebound expectation isn’t enough to fill that link for every project.
The market moves I’d like to see are: after the negative news, prices gradually stabilize; pullbacks are met and absorbed by spot buyers; and upward pressure from the U.S. dollar and U.S. Treasury yields eases. One sharp rally isn’t enough. If the move is mainly driven by chasing in futures while spot capital doesn’t follow, the rebound won’t have staying power. These are conditions that need to be validated, and they can’t be treated as already occurring.
The evidence that would support a long-biased view going forward includes easing inflation pressures, cooling expectations for further hikes, and continued spot inflows. Conversely, if inflation keeps sticking and the policy path continues to be revised upward, even if crypto prices strengthen temporarily, I would lower my expectations for upside and wouldn’t rush to add to positions.
This event did not deliver any direct positive catalyst for crypto assets. My approach is to preserve the ability to buy: only consider gradually participating once price is supported and capital flows improve. If I don’t see that, I won’t chase. #比特币 #Federal Reserve
On September 16, the U.S. Federal Reserve announced a 25-basis-point rate hike, raising the target range for the federal funds rate to 3.75%–4%. My view is that the threshold for going long on crypto assets has increased. It’s worth putting on the watchlist for now, but there’s still no reason to rush into a rebound just because the “shoe has dropped.”
This decision should be read together with the dot plot released on the same day. In the Fed’s official projections, the median federal funds rate at the end of 2026 is 4.1%, which is higher than the midpoint of the range adjusted this time. However, the dot plot is just officials’ projections based on their individual assumptions—it doesn’t mean the timing of the next rate hike has already been voted through. Reading it as a certain trading calendar would underestimate how future data could change the outlook.
When this filters into crypto prices, it first affects the cost of capital. With higher return thresholds for short-term U.S. dollar assets, investors holding bitcoin that yields no interest will demand stronger reasons for price strength. Similarly, leveraged positions need to cover higher costs. If these changes reduce risk exposure, selling pressure will further transmit to spot markets. That is the transmission path—not everything has already happened at every step.
Another easy misread is equating a rate hike directly with an economic recession. The statement also describes resilient expansion in economic activity and durable domestic spending. For the crypto market, the challenge may be that the economy can still withstand higher rates while easing takes longer to arrive, rather than that the economy will immediately lose momentum. This will test valuations that mainly rely on cheap liquidity.
If I really want to find opportunities to go long, I would first observe bitcoin. The reason is that it’s better suited to test whether overall buy-side demand in the crypto market has returned—rather than whether bitcoin benefits directly from the rate hike. Altcoins have an additional hurdle: whether the projects have sustained demand for their use cases, and whether the tokens can capture revenue or other value. Just having a macro rebound expectation isn’t enough to fill that link for every project.
The market moves I’d like to see are: after the negative news, prices gradually stabilize; pullbacks are met and absorbed by spot buyers; and upward pressure from the U.S. dollar and U.S. Treasury yields eases. One sharp rally isn’t enough. If the move is mainly driven by chasing in futures while spot capital doesn’t follow, the rebound won’t have staying power. These are conditions that need to be validated, and they can’t be treated as already occurring.
The evidence that would support a long-biased view going forward includes easing inflation pressures, cooling expectations for further hikes, and continued spot inflows. Conversely, if inflation keeps sticking and the policy path continues to be revised upward, even if crypto prices strengthen temporarily, I would lower my expectations for upside and wouldn’t rush to add to positions.
This event did not deliver any direct positive catalyst for crypto assets. My approach is to preserve the ability to buy: only consider gradually participating once price is supported and capital flows improve. If I don’t see that, I won’t chase. #比特币 #Federal Reserve
This decision should be read together with the dot plot released on the same day. In the Fed’s official projections, the median federal funds rate at the end of 2026 is 4.1%, which is higher than the midpoint of the range adjusted this time. However, the dot plot is just officials’ projections based on their individual assumptions—it doesn’t mean the timing of the next rate hike has already been voted through. Reading it as a certain trading calendar would underestimate how future data could change the outlook.
When this filters into crypto prices, it first affects the cost of capital. With higher return thresholds for short-term U.S. dollar assets, investors holding bitcoin that yields no interest will demand stronger reasons for price strength. Similarly, leveraged positions need to cover higher costs. If these changes reduce risk exposure, selling pressure will further transmit to spot markets. That is the transmission path—not everything has already happened at every step.
Another easy misread is equating a rate hike directly with an economic recession. The statement also describes resilient expansion in economic activity and durable domestic spending. For the crypto market, the challenge may be that the economy can still withstand higher rates while easing takes longer to arrive, rather than that the economy will immediately lose momentum. This will test valuations that mainly rely on cheap liquidity.
If I really want to find opportunities to go long, I would first observe bitcoin. The reason is that it’s better suited to test whether overall buy-side demand in the crypto market has returned—rather than whether bitcoin benefits directly from the rate hike. Altcoins have an additional hurdle: whether the projects have sustained demand for their use cases, and whether the tokens can capture revenue or other value. Just having a macro rebound expectation isn’t enough to fill that link for every project.
The market moves I’d like to see are: after the negative news, prices gradually stabilize; pullbacks are met and absorbed by spot buyers; and upward pressure from the U.S. dollar and U.S. Treasury yields eases. One sharp rally isn’t enough. If the move is mainly driven by chasing in futures while spot capital doesn’t follow, the rebound won’t have staying power. These are conditions that need to be validated, and they can’t be treated as already occurring.
The evidence that would support a long-biased view going forward includes easing inflation pressures, cooling expectations for further hikes, and continued spot inflows. Conversely, if inflation keeps sticking and the policy path continues to be revised upward, even if crypto prices strengthen temporarily, I would lower my expectations for upside and wouldn’t rush to add to positions.
This event did not deliver any direct positive catalyst for crypto assets. My approach is to preserve the ability to buy: only consider gradually participating once price is supported and capital flows improve. If I don’t see that, I won’t chase. #比特币 #Federal Reserve
62
·
--
Big Cake’s latest 4-hour close is higher than the previous candle, but I still won’t treat this bounce as a reversal. What matters more now is whether the sell pressure above has truly eased up.
Pull the camera back a bit. Big Cake’s recent two confirmed highs and lows haven’t formed a consistent higher-highs/higher-lows structure yet. A local rebound that’s not strong enough isn’t proof that the bigger direction has already changed. Support comes from the confirmed 4-hour low, while resistance should be prioritized by the most recent historical high level above the close. These horizontal price areas are more worth watching than a downward-sloping trendline.
Moving averages can also help clarify the positioning: Big Cake’s full 4-hour close is 76,168, with the 20- and 50-day moving averages around 76,622 and 77,266. Price is still below both moving averages, and the rebound hasn’t shaken off the resistance overhead. RSI14 is around 43, and momentum still looks weak—I’m treating it as the supporting character.
Looking at volume specifically: the latest complete candle’s volume is about 0.46x the average volume of the previous 20 candles, and the total volume over the most recent 6 candles is about 0.62x that of the earlier 6. This volume hasn’t exceeded the average of the prior 20 candles yet, and the rebound’s volume power hasn’t caught up. Next, when price approaches resistance, watch whether volume increases in sync. If it only spikes intraday but the close falls back again, I won’t count it as an effective reclaim.
For now, I’m watching 77,494: once 4-hour closes reclaim it, then I’ll consider going long only after the subsequent 4-hour pullback reaches there and still closes above it.
Ethereum hasn’t provided a clearer edge either. First, I want to see whether the recent resistance at 2,430 can be reclaimed. Ethereum’s full 4-hour close is 2,417, which is only about 0.5% below that resistance. Volume is at about 0.48x. This room is too small to even cover a normal fluctuation, so chasing it offers poor cost-performance.
For the high and low points mentioned here, both the left and right sides need to have complete candles for comparison; the newly formed needle tip doesn’t count yet. A higher low only suggests that sell pressure in that segment has weakened. If you want to say the structure is turning stronger, you still need to see whether the prior highs can be reclaimed. During pullbacks, I don’t just check whether price touched a level—I look at which side the 4-hour close ends up on, and whether it then makes another lower low. A narrowing-volume pullback can be a clue, but it can’t on its own prove that selling has been exhausted. One big bullish candle on rising volume can’t replace the subsequent confirmation and follow-through.
Big Cake’s ATR14 is around 936—this is the recent 4-hour single-candle volatility scale, not a guaranteed target to reach. Once the pullback pattern appears, I’ll put the invalidation low, the nearest resistance, and the trading fees into the same calculation. After deducting costs, if there isn’t enough upside room, I’d rather miss the trade than try to force a 1:2-like farther target.
If the 75,866 support is broken again by a 4-hour close, I won’t enter long first. A rally intraday doesn’t count as standing firm.
$BTC $ETH
Big Cake’s latest 4-hour close is higher than the previous candle, but I still won’t treat this bounce as a reversal. What matters more now is whether the sell pressure above has truly eased up.
Pull the camera back a bit. Big Cake’s recent two confirmed highs and lows haven’t formed a consistent higher-highs/higher-lows structure yet. A local rebound that’s not strong enough isn’t proof that the bigger direction has already changed. Support comes from the confirmed 4-hour low, while resistance should be prioritized by the most recent historical high level above the close. These horizontal price areas are more worth watching than a downward-sloping trendline.
Moving averages can also help clarify the positioning: Big Cake’s full 4-hour close is 76,168, with the 20- and 50-day moving averages around 76,622 and 77,266. Price is still below both moving averages, and the rebound hasn’t shaken off the resistance overhead. RSI14 is around 43, and momentum still looks weak—I’m treating it as the supporting character.
Looking at volume specifically: the latest complete candle’s volume is about 0.46x the average volume of the previous 20 candles, and the total volume over the most recent 6 candles is about 0.62x that of the earlier 6. This volume hasn’t exceeded the average of the prior 20 candles yet, and the rebound’s volume power hasn’t caught up. Next, when price approaches resistance, watch whether volume increases in sync. If it only spikes intraday but the close falls back again, I won’t count it as an effective reclaim.
For now, I’m watching 77,494: once 4-hour closes reclaim it, then I’ll consider going long only after the subsequent 4-hour pullback reaches there and still closes above it.
Ethereum hasn’t provided a clearer edge either. First, I want to see whether the recent resistance at 2,430 can be reclaimed. Ethereum’s full 4-hour close is 2,417, which is only about 0.5% below that resistance. Volume is at about 0.48x. This room is too small to even cover a normal fluctuation, so chasing it offers poor cost-performance.
For the high and low points mentioned here, both the left and right sides need to have complete candles for comparison; the newly formed needle tip doesn’t count yet. A higher low only suggests that sell pressure in that segment has weakened. If you want to say the structure is turning stronger, you still need to see whether the prior highs can be reclaimed. During pullbacks, I don’t just check whether price touched a level—I look at which side the 4-hour close ends up on, and whether it then makes another lower low. A narrowing-volume pullback can be a clue, but it can’t on its own prove that selling has been exhausted. One big bullish candle on rising volume can’t replace the subsequent confirmation and follow-through.
Big Cake’s ATR14 is around 936—this is the recent 4-hour single-candle volatility scale, not a guaranteed target to reach. Once the pullback pattern appears, I’ll put the invalidation low, the nearest resistance, and the trading fees into the same calculation. After deducting costs, if there isn’t enough upside room, I’d rather miss the trade than try to force a 1:2-like farther target.
If the 75,866 support is broken again by a 4-hour close, I won’t enter long first. A rally intraday doesn’t count as standing firm.
$BTC $ETH
Pull the camera back a bit. Big Cake’s recent two confirmed highs and lows haven’t formed a consistent higher-highs/higher-lows structure yet. A local rebound that’s not strong enough isn’t proof that the bigger direction has already changed. Support comes from the confirmed 4-hour low, while resistance should be prioritized by the most recent historical high level above the close. These horizontal price areas are more worth watching than a downward-sloping trendline.
Moving averages can also help clarify the positioning: Big Cake’s full 4-hour close is 76,168, with the 20- and 50-day moving averages around 76,622 and 77,266. Price is still below both moving averages, and the rebound hasn’t shaken off the resistance overhead. RSI14 is around 43, and momentum still looks weak—I’m treating it as the supporting character.
Looking at volume specifically: the latest complete candle’s volume is about 0.46x the average volume of the previous 20 candles, and the total volume over the most recent 6 candles is about 0.62x that of the earlier 6. This volume hasn’t exceeded the average of the prior 20 candles yet, and the rebound’s volume power hasn’t caught up. Next, when price approaches resistance, watch whether volume increases in sync. If it only spikes intraday but the close falls back again, I won’t count it as an effective reclaim.
For now, I’m watching 77,494: once 4-hour closes reclaim it, then I’ll consider going long only after the subsequent 4-hour pullback reaches there and still closes above it.
Ethereum hasn’t provided a clearer edge either. First, I want to see whether the recent resistance at 2,430 can be reclaimed. Ethereum’s full 4-hour close is 2,417, which is only about 0.5% below that resistance. Volume is at about 0.48x. This room is too small to even cover a normal fluctuation, so chasing it offers poor cost-performance.
For the high and low points mentioned here, both the left and right sides need to have complete candles for comparison; the newly formed needle tip doesn’t count yet. A higher low only suggests that sell pressure in that segment has weakened. If you want to say the structure is turning stronger, you still need to see whether the prior highs can be reclaimed. During pullbacks, I don’t just check whether price touched a level—I look at which side the 4-hour close ends up on, and whether it then makes another lower low. A narrowing-volume pullback can be a clue, but it can’t on its own prove that selling has been exhausted. One big bullish candle on rising volume can’t replace the subsequent confirmation and follow-through.
Big Cake’s ATR14 is around 936—this is the recent 4-hour single-candle volatility scale, not a guaranteed target to reach. Once the pullback pattern appears, I’ll put the invalidation low, the nearest resistance, and the trading fees into the same calculation. After deducting costs, if there isn’t enough upside room, I’d rather miss the trade than try to force a 1:2-like farther target.
If the 75,866 support is broken again by a 4-hour close, I won’t enter long first. A rally intraday doesn’t count as standing firm.
$BTC $ETH
272
·
--
The latest 4-hour closing is higher than the previous candle, but I still won’t treat this bounce as a reversal. What matters more now is whether the sell pressure above has truly backed off.
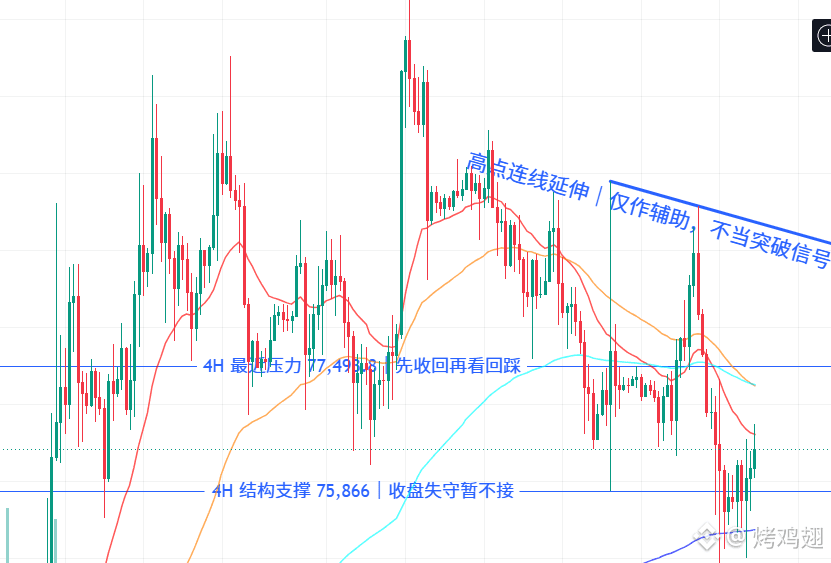
The volume on this candle still hasn’t exceeded the average of the previous 20 candles. The rebound volume hasn’t caught up either. I’ll first watch 77,494: once the 4-hour closes back above it, then we can look at whether the subsequent 4 hours pull back to this level and the close stays above it—only then will I consider going long.
Ethereum also hasn’t shown a clearer edge yet. First, I want to see whether the recent resistance at 2,430 can be reclaimed. If the support at 75,866 is broken by a 4-hour closing, then I won’t be buying. A rally during intraday doesn’t count as a confirmed hold.
$BTC $ETH
The latest 4-hour closing is higher than the previous candle, but I still won’t treat this bounce as a reversal. What matters more now is whether the sell pressure above has truly backed off.
The volume on this candle still hasn’t exceeded the average of the previous 20 candles. The rebound volume hasn’t caught up either. I’ll first watch 77,494: once the 4-hour closes back above it, then we can look at whether the subsequent 4 hours pull back to this level and the close stays above it—only then will I consider going long.
Ethereum also hasn’t shown a clearer edge yet. First, I want to see whether the recent resistance at 2,430 can be reclaimed. If the support at 75,866 is broken by a 4-hour closing, then I won’t be buying. A rally during intraday doesn’t count as a confirmed hold.
$BTC $ETH
The volume on this candle still hasn’t exceeded the average of the previous 20 candles. The rebound volume hasn’t caught up either. I’ll first watch 77,494: once the 4-hour closes back above it, then we can look at whether the subsequent 4 hours pull back to this level and the close stays above it—only then will I consider going long.
Ethereum also hasn’t shown a clearer edge yet. First, I want to see whether the recent resistance at 2,430 can be reclaimed. If the support at 75,866 is broken by a 4-hour closing, then I won’t be buying. A rally during intraday doesn’t count as a confirmed hold.
$BTC $ETH
1
212
·
--
BTC holds near 76,000, is this stabilization—or just a brief breather before the FOMC?
Yesterday, the “CLARITY Act” was stalled in a procedural vote in the Senate. Regulatory implementation has added uncertainty, but it is not a permanent rejection. Tonight’s key is the FOMC decision at 2:00 a.m. Beijing time on September 17, followed by a press conference at 2:30 a.m. Besides interest rates, focus on the dot plot and the policy wording.
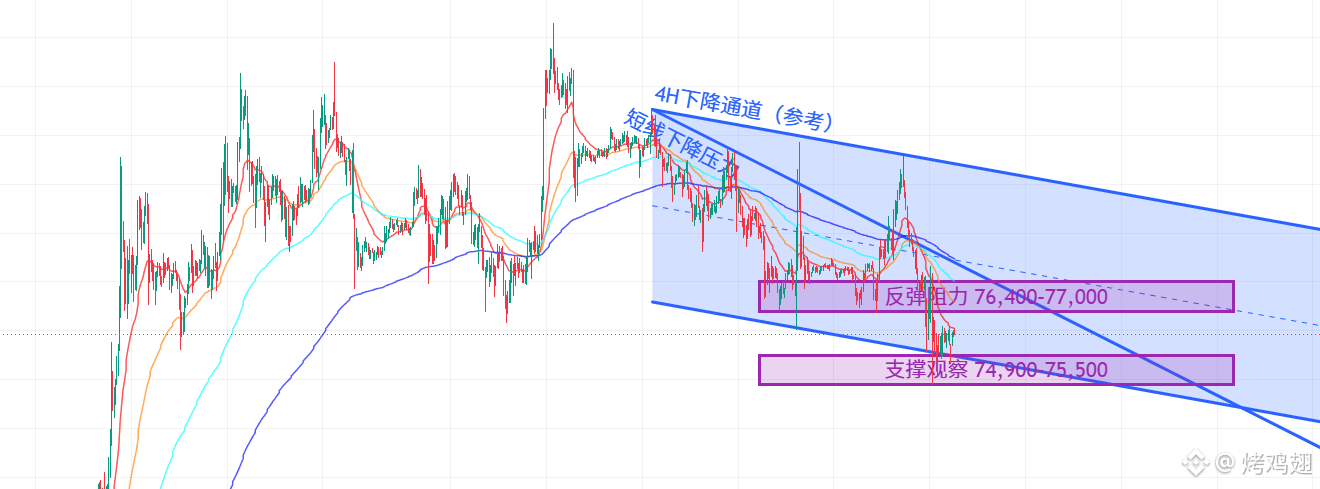
From a technical perspective, BTC is around 75.96k. Over the past 4 hours, it remains within a descending channel and is below the EMA20/50; the rebound has not yet reversed the bearish momentum. Support to watch is at 74,900–75,500, while resistance is in the 76,400–77,000 range.
My view: a credible scenario is one where volume surges and the market reclaims resistance, and where a pullback holds. If support breaks and it cannot be reclaimed after the break, the downside risk remains elevated. Don’t treat the first spike after the policy decision as confirmation of a reversal. $BTC $ETH
BTC holds near 76,000, is this stabilization—or just a brief breather before the FOMC?
Yesterday, the “CLARITY Act” was stalled in a procedural vote in the Senate. Regulatory implementation has added uncertainty, but it is not a permanent rejection. Tonight’s key is the FOMC decision at 2:00 a.m. Beijing time on September 17, followed by a press conference at 2:30 a.m. Besides interest rates, focus on the dot plot and the policy wording.
From a technical perspective, BTC is around 75.96k. Over the past 4 hours, it remains within a descending channel and is below the EMA20/50; the rebound has not yet reversed the bearish momentum. Support to watch is at 74,900–75,500, while resistance is in the 76,400–77,000 range.
My view: a credible scenario is one where volume surges and the market reclaims resistance, and where a pullback holds. If support breaks and it cannot be reclaimed after the break, the downside risk remains elevated. Don’t treat the first spike after the policy decision as confirmation of a reversal. $BTC $ETH
Yesterday, the “CLARITY Act” was stalled in a procedural vote in the Senate. Regulatory implementation has added uncertainty, but it is not a permanent rejection. Tonight’s key is the FOMC decision at 2:00 a.m. Beijing time on September 17, followed by a press conference at 2:30 a.m. Besides interest rates, focus on the dot plot and the policy wording.
From a technical perspective, BTC is around 75.96k. Over the past 4 hours, it remains within a descending channel and is below the EMA20/50; the rebound has not yet reversed the bearish momentum. Support to watch is at 74,900–75,500, while resistance is in the 76,400–77,000 range.
My view: a credible scenario is one where volume surges and the market reclaims resistance, and where a pullback holds. If support breaks and it cannot be reclaimed after the break, the downside risk remains elevated. Don’t treat the first spike after the policy decision as confirmation of a reversal. $BTC $ETH
1
1
352
·
--
Even though the big cake went down and got smashed at 75,000, what I care about today is this: after the drop, will anyone keep selling further?
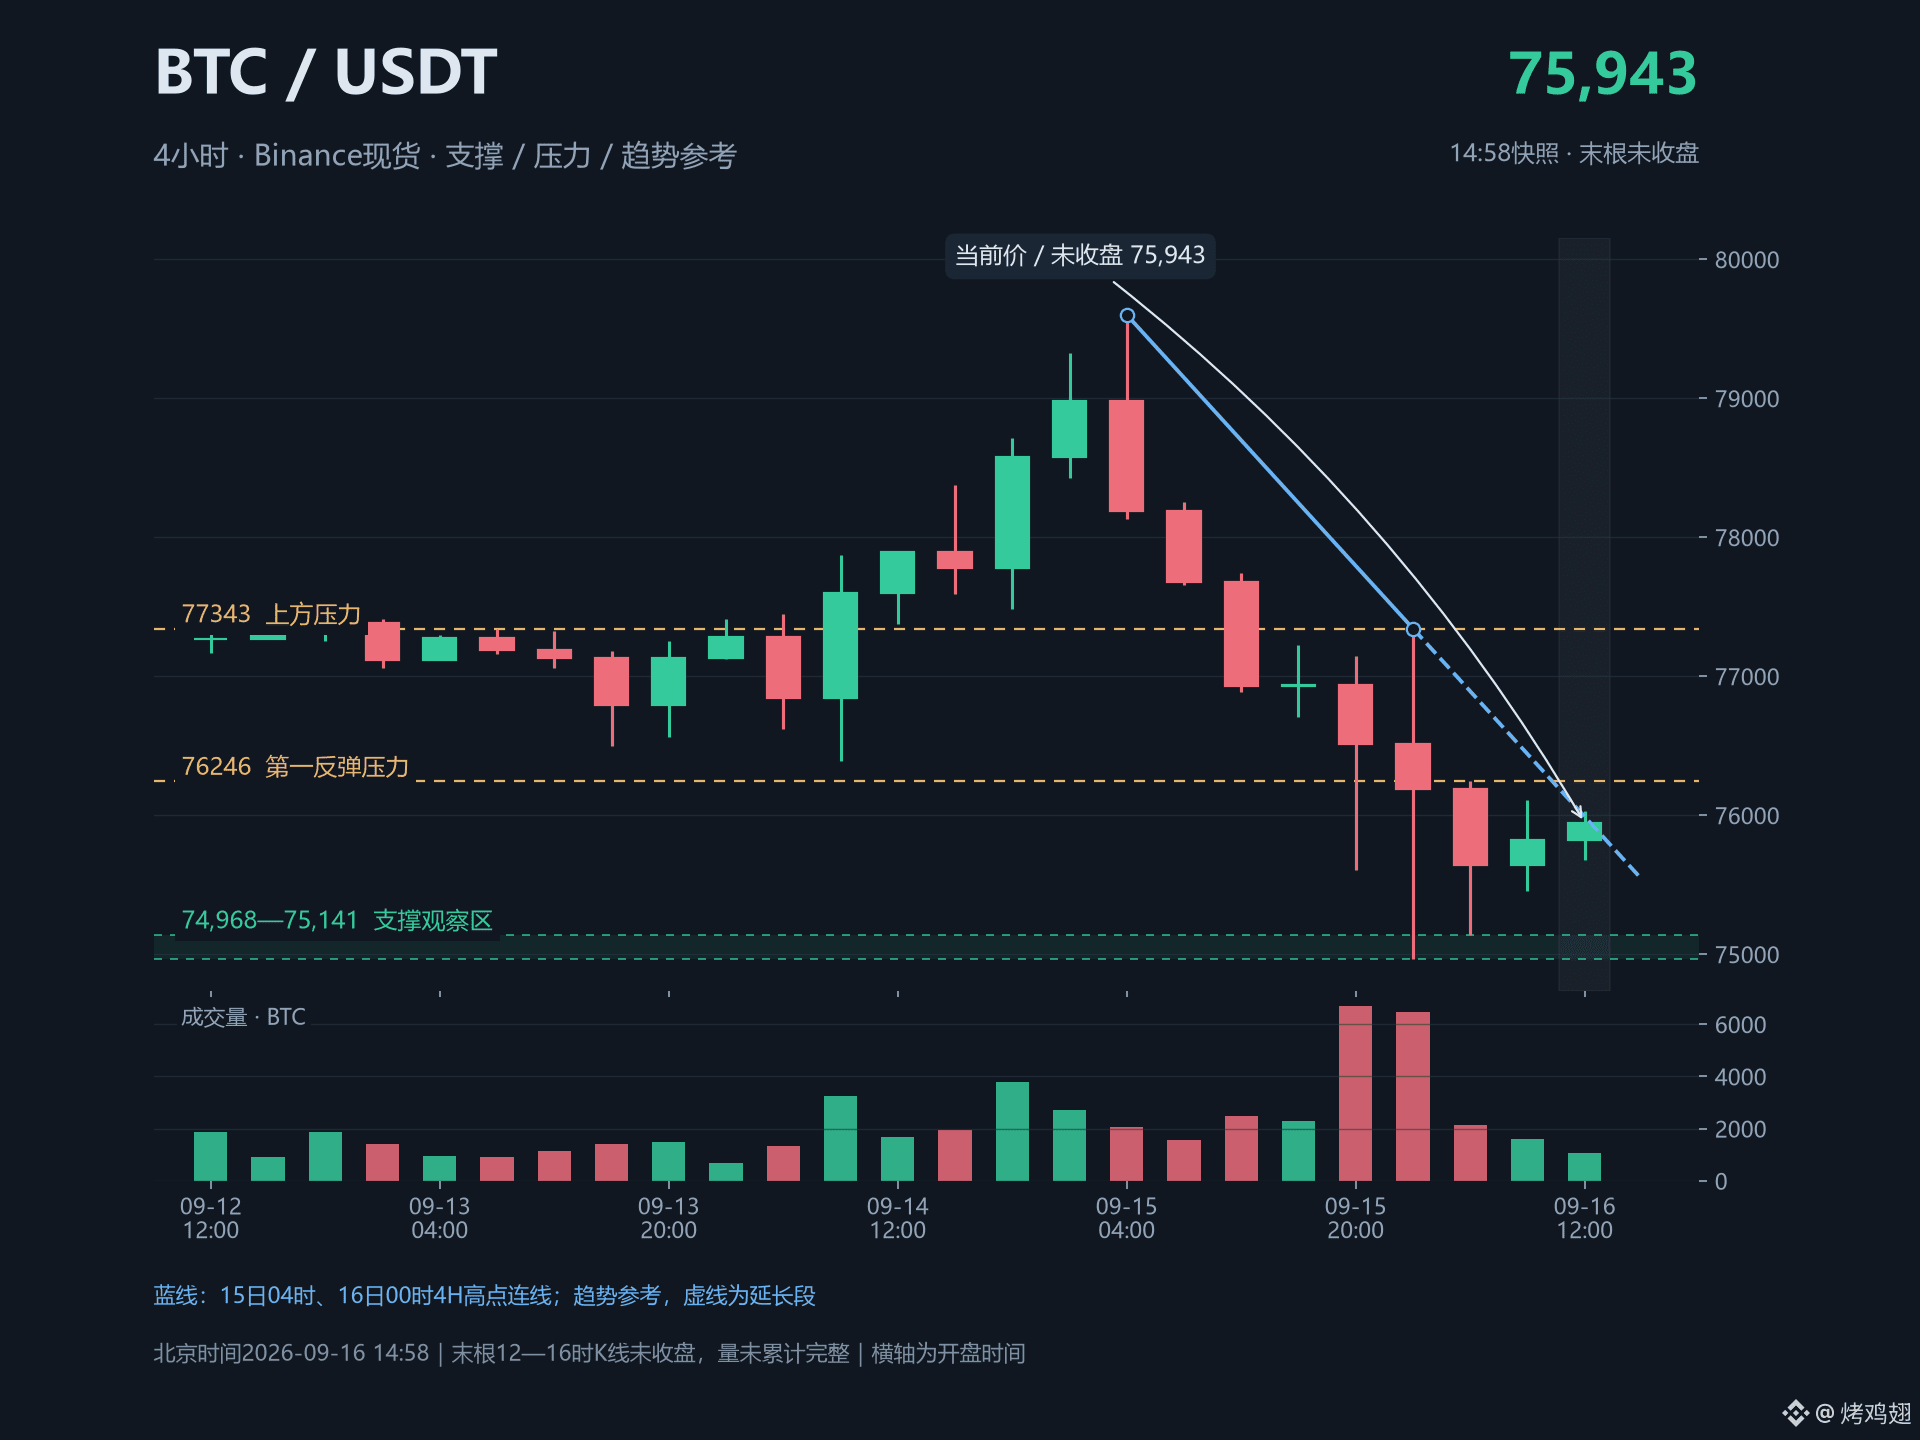
At around the early-morning low of 74,968, the lows of the next two full 4-hour candlesticks were lifted to 75,141 and 75,458, and it hasn’t broken the bottom again for now. That’s why I started paying attention to a rebound, though the highs are also still trending lower, so it’s not strong enough to call a reversal yet.
For the big cake, first look at 76,246. If the 4-hour closes up and then a pullback holds, then I’ll consider taking this rebound. After that, I’ll watch 77,343. If 74,968 breaks again, then I’ll set that idea aside.
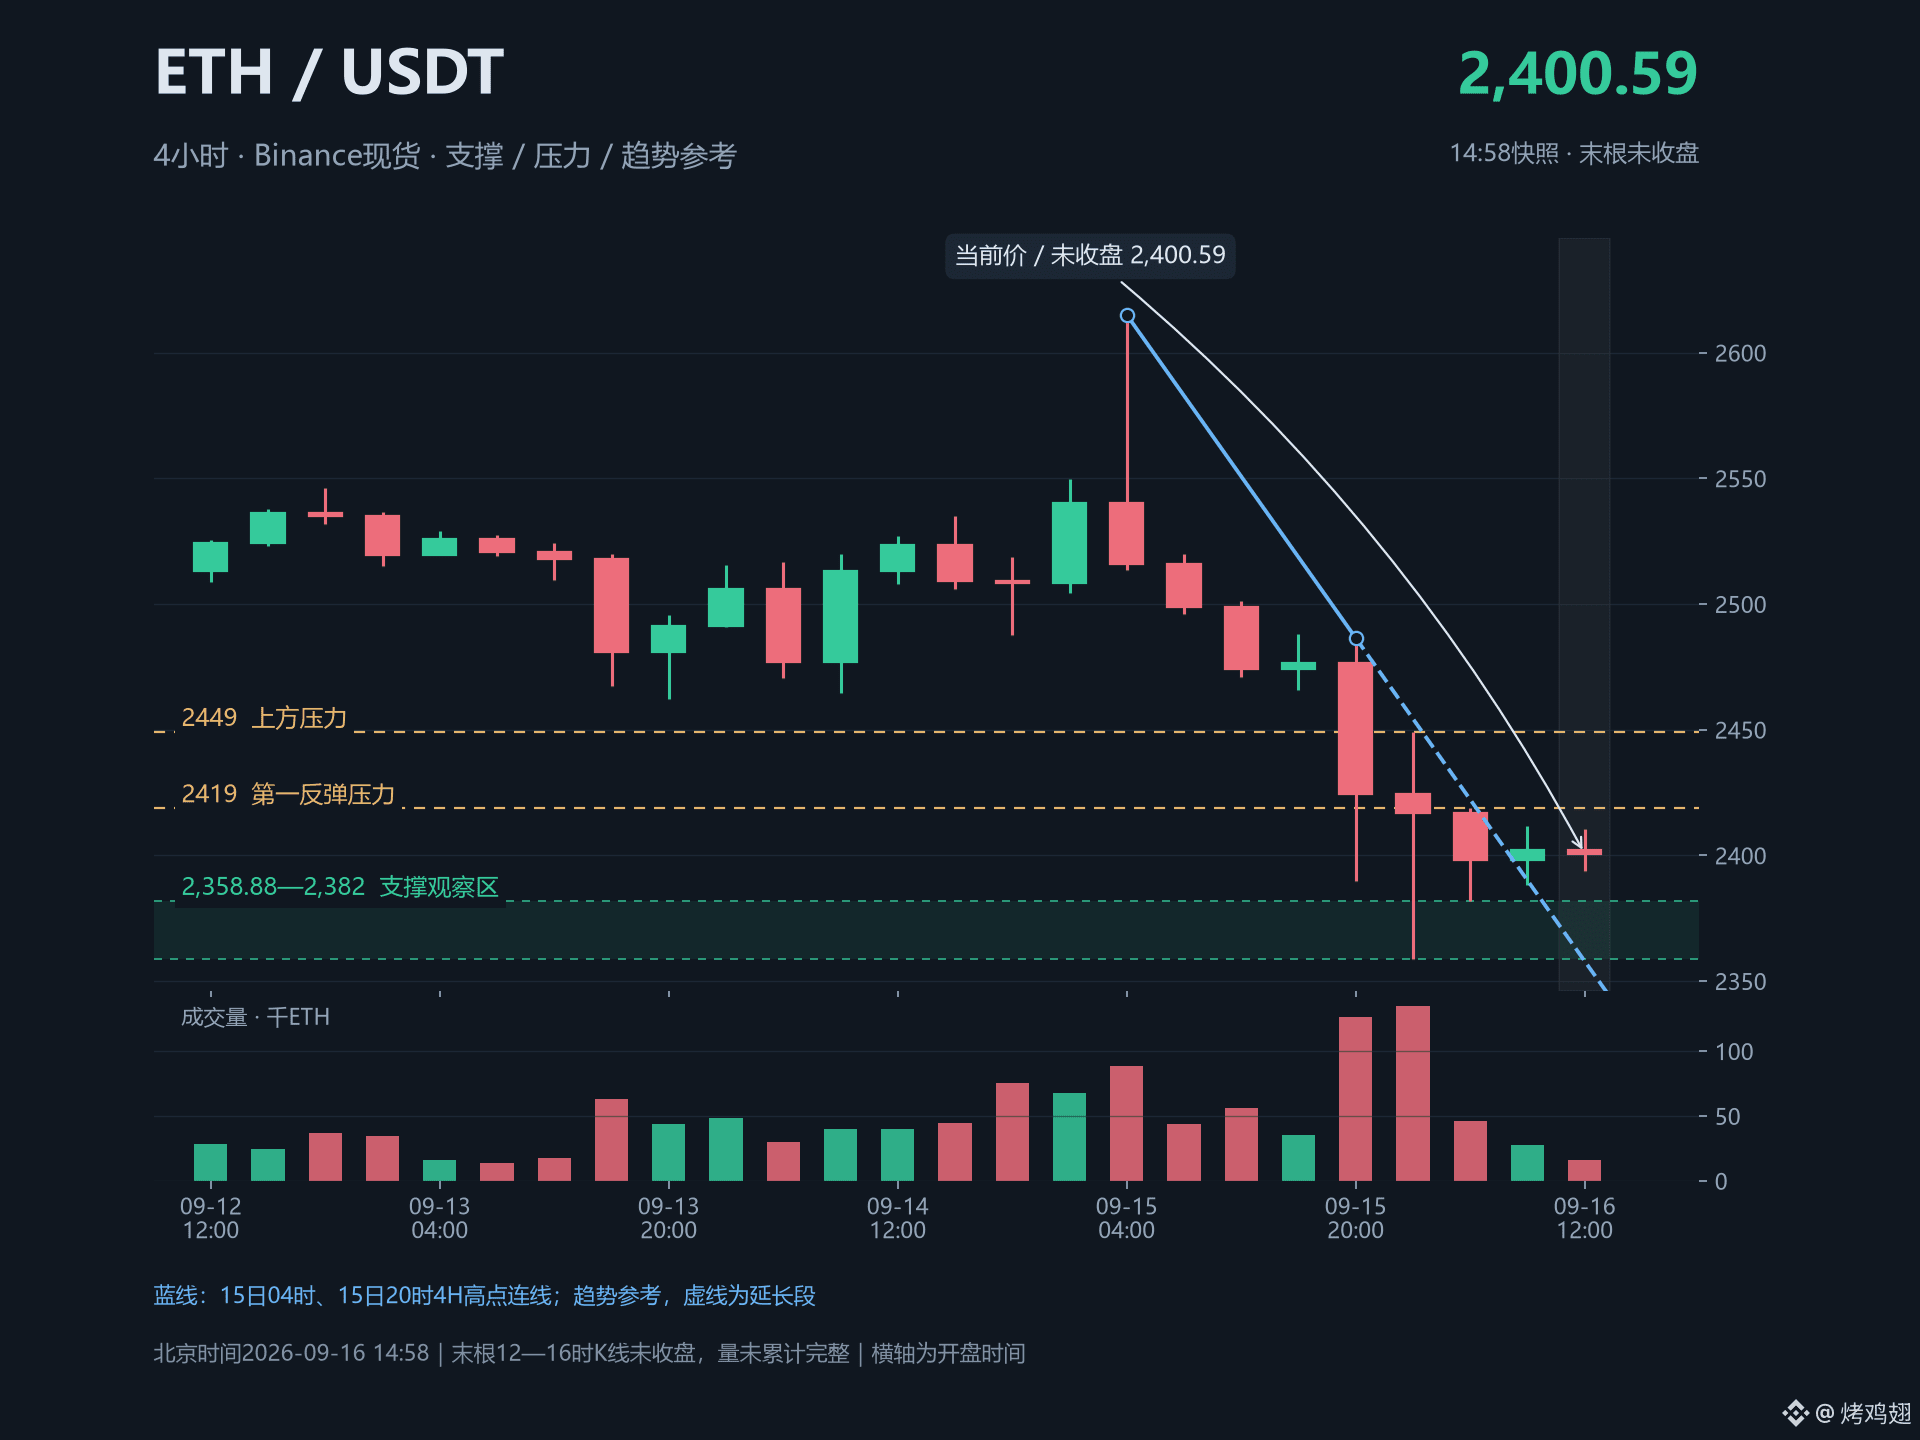
Ethereum is similar. After that long lower-wick candle at 2,359, it didn’t make new lows afterward, but 2,419 is still holding pressure. If 2,419 is reclaimed and the pullback holds without breaking, then first look at 2,449. The upside is limited, so it’s not worth chasing a buy.
All the support levels from yesterday have already been broken. Today, we need to look again for signs of stopping the decline—so don’t keep calling for longs using yesterday’s old levels. $BTC $ETH
Even though the big cake went down and got smashed at 75,000, what I care about today is this: after the drop, will anyone keep selling further?
At around the early-morning low of 74,968, the lows of the next two full 4-hour candlesticks were lifted to 75,141 and 75,458, and it hasn’t broken the bottom again for now. That’s why I started paying attention to a rebound, though the highs are also still trending lower, so it’s not strong enough to call a reversal yet.
For the big cake, first look at 76,246. If the 4-hour closes up and then a pullback holds, then I’ll consider taking this rebound. After that, I’ll watch 77,343. If 74,968 breaks again, then I’ll set that idea aside.
Ethereum is similar. After that long lower-wick candle at 2,359, it didn’t make new lows afterward, but 2,419 is still holding pressure. If 2,419 is reclaimed and the pullback holds without breaking, then first look at 2,449. The upside is limited, so it’s not worth chasing a buy.
All the support levels from yesterday have already been broken. Today, we need to look again for signs of stopping the decline—so don’t keep calling for longs using yesterday’s old levels. $BTC $ETH
At around the early-morning low of 74,968, the lows of the next two full 4-hour candlesticks were lifted to 75,141 and 75,458, and it hasn’t broken the bottom again for now. That’s why I started paying attention to a rebound, though the highs are also still trending lower, so it’s not strong enough to call a reversal yet.
For the big cake, first look at 76,246. If the 4-hour closes up and then a pullback holds, then I’ll consider taking this rebound. After that, I’ll watch 77,343. If 74,968 breaks again, then I’ll set that idea aside.
Ethereum is similar. After that long lower-wick candle at 2,359, it didn’t make new lows afterward, but 2,419 is still holding pressure. If 2,419 is reclaimed and the pullback holds without breaking, then first look at 2,449. The upside is limited, so it’s not worth chasing a buy.
All the support levels from yesterday have already been broken. Today, we need to look again for signs of stopping the decline—so don’t keep calling for longs using yesterday’s old levels. $BTC $ETH
97
·
--
$ Fruit flies - the real one is next door. Hurry up, run—there’s a crush coming!
$ Fruit flies - the real one is next door. Hurry up, run—there’s a crush coming!
23
·
--
$Immortal fruit fly, damn it—don’t rush off; the cow’s here. You’ll be free for the rest of your life right here.
$Immortal fruit fly, damn it—don’t rush off; the cow’s here. You’ll be free for the rest of your life right here.
1
444
·
--
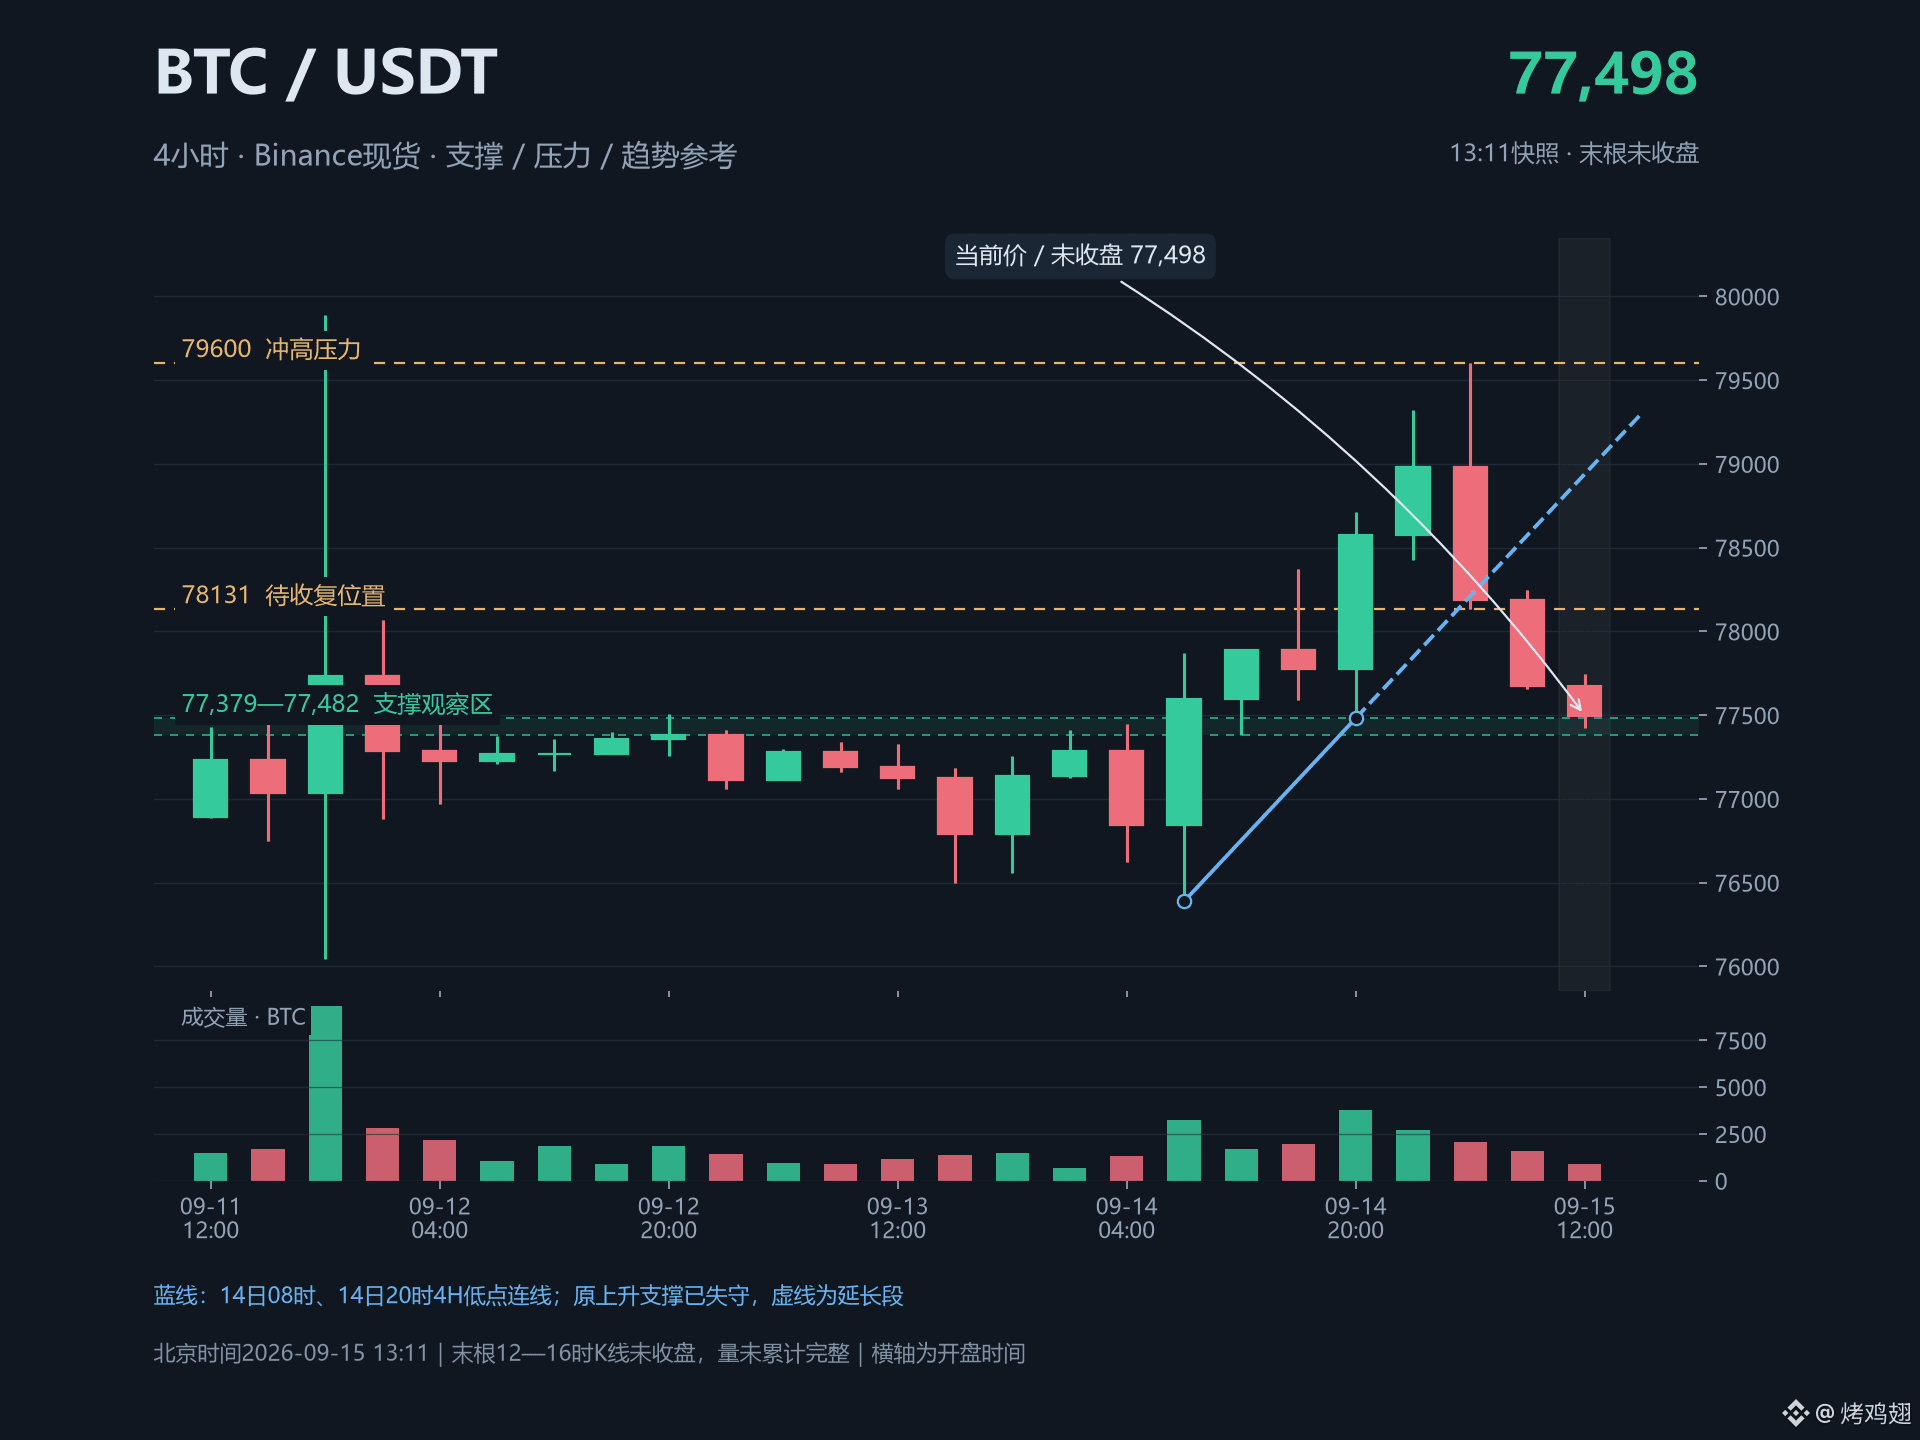
Big Pie (BTC) hits 79,600 and Ethereum (ETH) hits 2,615—after a few hours, the gains were entirely given back. In times like this, the fact that it drops more isn’t really a reason to keep buying.
Yesterday, BTC pushed higher after breaking 78,068, but today it has dropped two consecutive 4-hour candles and returned to around 77,500. The original rising support line has also been lost. I’ll first see whether 77,380—77,480 can hold, but if I want to open a long again, I need to wait for a 4-hour close back above 78,131 and a pullback that doesn’t break—can’t rely on just a single long lower wick.
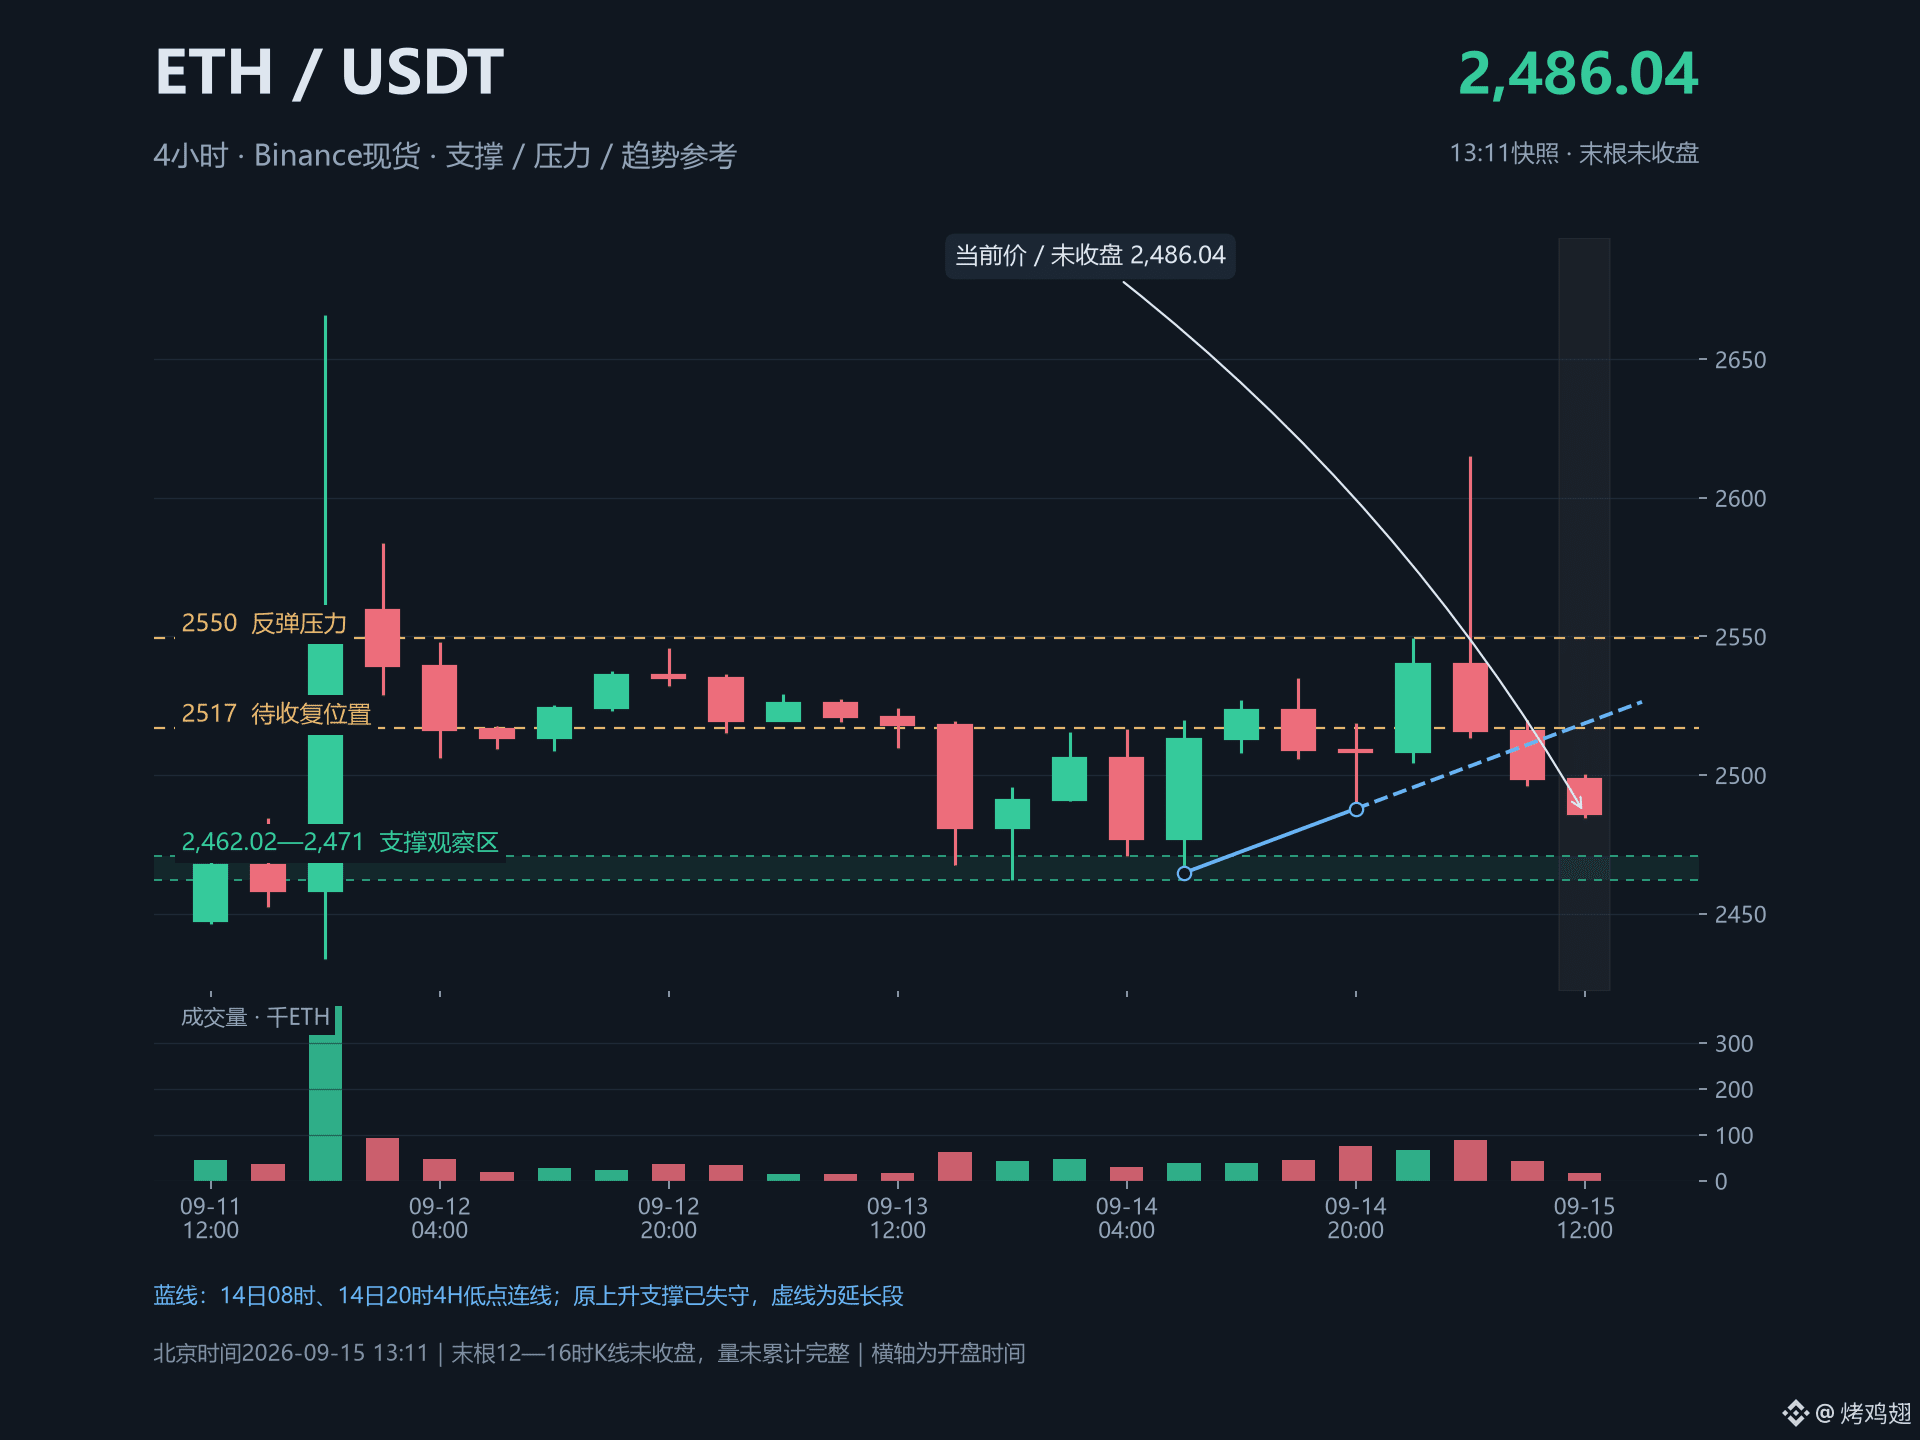
That ETH candle around the 2,615 breakout ultimately closed near 2,516. Anyone who chased in there is likely feeling pretty awful. Now it’s fallen back below the 2,517 level from yesterday that I was watching. For now I won’t catch it; I’ll first see whether 2,462—2,471 can stop the drop. After it reclaims 2,517, the next level I’m watching above is 2,550.
Today, I’d rather make less profit in the first leg and wait until price takes back the key levels. If the lows are still moving lower, don’t rush to declare the bottom. $BTC $ETH
Big Pie (BTC) hits 79,600 and Ethereum (ETH) hits 2,615—after a few hours, the gains were entirely given back. In times like this, the fact that it drops more isn’t really a reason to keep buying.
Yesterday, BTC pushed higher after breaking 78,068, but today it has dropped two consecutive 4-hour candles and returned to around 77,500. The original rising support line has also been lost. I’ll first see whether 77,380—77,480 can hold, but if I want to open a long again, I need to wait for a 4-hour close back above 78,131 and a pullback that doesn’t break—can’t rely on just a single long lower wick.
That ETH candle around the 2,615 breakout ultimately closed near 2,516. Anyone who chased in there is likely feeling pretty awful. Now it’s fallen back below the 2,517 level from yesterday that I was watching. For now I won’t catch it; I’ll first see whether 2,462—2,471 can stop the drop. After it reclaims 2,517, the next level I’m watching above is 2,550.
Today, I’d rather make less profit in the first leg and wait until price takes back the key levels. If the lows are still moving lower, don’t rush to declare the bottom. $BTC $ETH
Yesterday, BTC pushed higher after breaking 78,068, but today it has dropped two consecutive 4-hour candles and returned to around 77,500. The original rising support line has also been lost. I’ll first see whether 77,380—77,480 can hold, but if I want to open a long again, I need to wait for a 4-hour close back above 78,131 and a pullback that doesn’t break—can’t rely on just a single long lower wick.
That ETH candle around the 2,615 breakout ultimately closed near 2,516. Anyone who chased in there is likely feeling pretty awful. Now it’s fallen back below the 2,517 level from yesterday that I was watching. For now I won’t catch it; I’ll first see whether 2,462—2,471 can stop the drop. After it reclaims 2,517, the next level I’m watching above is 2,550.
Today, I’d rather make less profit in the first leg and wait until price takes back the key levels. If the lows are still moving lower, don’t rush to declare the bottom. $BTC $ETH
390
·
--
After I lost about twenty thousand dollars on the contract, I came to a conclusion: from now on, I’ll just buy spot and behave myself.
But now the spot is still losing money too.
Recently, when I looked back, I wondered—was my summary back then a little too convenient?
It was my first time touching crypto, and it was earlier than I remembered. Later I checked my account and found out I’d registered back in 2021. I invested 100 yuan, lost 30 yuan, and quickly ran.
After finishing my undergrad and preparing for the graduate entrance exam, I went back into it.
That time PEPE and FLOKI were really hot. Seven hundred yuan—about 100 USDT—once turned into six thousand.
Later, when $BTC pulled back from around seventy thousand dollars, that was the first time I got liquidated.
At the time, I was genuinely scared. But even so, after that I still topped up another two thousand, and it was gone.
During that undergrad period, I lost around six thousand yuan in total.
That money was earned through scholarships. Damn. When I think about it, I still feel heartache.
Back then I thought there was absolutely no way I could touch this stuff again.
Afterward, during first year of grad school, when I had nothing to do, I went back.
Later there was also a BTC short position—opened at eighty-nine thousand—held all the way to one hundred thousand, and in the end I couldn’t take it anymore and cut it.
From my fourth year to grad school, I lost about twenty thousand dollars on contracts overall.
So I summarized it for myself again: contracts don’t suit me—buy spot instead.
Then I started putting more money into altcoins.
Looking back now, this shift is kind of strange. I lost money because of trading, and then the next thing I did was put even more money into another place.
$VIRTUAL —I bought it, sold it, then after it dropped I kept catching the dip, and then it kept falling. Now the spot is still in the red.
I realized that before I bought, what I was thinking was “spot—hold it long term.” After I bought, what I thought was “why isn’t it going up yet.”
Before buying, I was rushing to get in. After buying, I was rushing for it to rise. And when it dropped, I started to纠结 about whether to keep holding or admit the loss and leave.
The contracts later stopped.
But honestly, sometimes the thought still pops up: “What if I try again with a small position?” So I don’t want to write this as some “I’ve completely woken up” kind of experience sharing.
I still haven’t gotten back to even, and I haven’t fixed this problem.
It’s just that, after writing this much, I have to admit something:
I thought that switching to spot would make me more patient. Turns out the things I bought changed, but the urgency to make money didn’t.
After I lost about twenty thousand dollars on the contract, I came to a conclusion: from now on, I’ll just buy spot and behave myself.
But now the spot is still losing money too.
Recently, when I looked back, I wondered—was my summary back then a little too convenient?
It was my first time touching crypto, and it was earlier than I remembered. Later I checked my account and found out I’d registered back in 2021. I invested 100 yuan, lost 30 yuan, and quickly ran.
After finishing my undergrad and preparing for the graduate entrance exam, I went back into it.
That time PEPE and FLOKI were really hot. Seven hundred yuan—about 100 USDT—once turned into six thousand.
Later, when $BTC pulled back from around seventy thousand dollars, that was the first time I got liquidated.
At the time, I was genuinely scared. But even so, after that I still topped up another two thousand, and it was gone.
During that undergrad period, I lost around six thousand yuan in total.
That money was earned through scholarships. Damn. When I think about it, I still feel heartache.
Back then I thought there was absolutely no way I could touch this stuff again.
Afterward, during first year of grad school, when I had nothing to do, I went back.
Later there was also a BTC short position—opened at eighty-nine thousand—held all the way to one hundred thousand, and in the end I couldn’t take it anymore and cut it.
From my fourth year to grad school, I lost about twenty thousand dollars on contracts overall.
So I summarized it for myself again: contracts don’t suit me—buy spot instead.
Then I started putting more money into altcoins.
Looking back now, this shift is kind of strange. I lost money because of trading, and then the next thing I did was put even more money into another place.
$VIRTUAL —I bought it, sold it, then after it dropped I kept catching the dip, and then it kept falling. Now the spot is still in the red.
I realized that before I bought, what I was thinking was “spot—hold it long term.” After I bought, what I thought was “why isn’t it going up yet.”
Before buying, I was rushing to get in. After buying, I was rushing for it to rise. And when it dropped, I started to纠结 about whether to keep holding or admit the loss and leave.
The contracts later stopped.
But honestly, sometimes the thought still pops up: “What if I try again with a small position?” So I don’t want to write this as some “I’ve completely woken up” kind of experience sharing.
I still haven’t gotten back to even, and I haven’t fixed this problem.
It’s just that, after writing this much, I have to admit something:
I thought that switching to spot would make me more patient. Turns out the things I bought changed, but the urgency to make money didn’t.
But now the spot is still losing money too.
Recently, when I looked back, I wondered—was my summary back then a little too convenient?
It was my first time touching crypto, and it was earlier than I remembered. Later I checked my account and found out I’d registered back in 2021. I invested 100 yuan, lost 30 yuan, and quickly ran.
After finishing my undergrad and preparing for the graduate entrance exam, I went back into it.
That time PEPE and FLOKI were really hot. Seven hundred yuan—about 100 USDT—once turned into six thousand.
Later, when $BTC pulled back from around seventy thousand dollars, that was the first time I got liquidated.
At the time, I was genuinely scared. But even so, after that I still topped up another two thousand, and it was gone.
During that undergrad period, I lost around six thousand yuan in total.
That money was earned through scholarships. Damn. When I think about it, I still feel heartache.
Back then I thought there was absolutely no way I could touch this stuff again.
Afterward, during first year of grad school, when I had nothing to do, I went back.
Later there was also a BTC short position—opened at eighty-nine thousand—held all the way to one hundred thousand, and in the end I couldn’t take it anymore and cut it.
From my fourth year to grad school, I lost about twenty thousand dollars on contracts overall.
So I summarized it for myself again: contracts don’t suit me—buy spot instead.
Then I started putting more money into altcoins.
Looking back now, this shift is kind of strange. I lost money because of trading, and then the next thing I did was put even more money into another place.
$VIRTUAL —I bought it, sold it, then after it dropped I kept catching the dip, and then it kept falling. Now the spot is still in the red.
I realized that before I bought, what I was thinking was “spot—hold it long term.” After I bought, what I thought was “why isn’t it going up yet.”
Before buying, I was rushing to get in. After buying, I was rushing for it to rise. And when it dropped, I started to纠结 about whether to keep holding or admit the loss and leave.
The contracts later stopped.
But honestly, sometimes the thought still pops up: “What if I try again with a small position?” So I don’t want to write this as some “I’ve completely woken up” kind of experience sharing.
I still haven’t gotten back to even, and I haven’t fixed this problem.
It’s just that, after writing this much, I have to admit something:
I thought that switching to spot would make me more patient. Turns out the things I bought changed, but the urgency to make money didn’t.
355
·
--
The big move got dumped down to 76389 in the morning, then pulled back above 77500. This bounce is kind of interesting—I want to wait until it confirms the breakout.
Now it’s the morning of the 14th; the 4-hour candle hasn’t closed yet. If by 12:00 it can close above 77506 and the blue line in the chart, and if the pullback holds, I’ll consider adding more positions. First resistance to look at is 78068. Don’t lose the morning low at 76389—if it gets broken, I’ll pause this add-more plan for now.
As for ETH, it rebounded from around 2465 back to 2510, and it’s just a little short of the resistance at 2517. Once the 4-hour timeframe holds above 2517, then if the pullback doesn’t break, look for 2546. Below, 2462—2471 is the support observation zone.
Today, I’ll focus on these two breakouts. If price swings over quickly during the session, what matters is whether it can stay there by the close. $BTC $ETH
The big move got dumped down to 76389 in the morning, then pulled back above 77500. This bounce is kind of interesting—I want to wait until it confirms the breakout.
Now it’s the morning of the 14th; the 4-hour candle hasn’t closed yet. If by 12:00 it can close above 77506 and the blue line in the chart, and if the pullback holds, I’ll consider adding more positions. First resistance to look at is 78068. Don’t lose the morning low at 76389—if it gets broken, I’ll pause this add-more plan for now.
As for ETH, it rebounded from around 2465 back to 2510, and it’s just a little short of the resistance at 2517. Once the 4-hour timeframe holds above 2517, then if the pullback doesn’t break, look for 2546. Below, 2462—2471 is the support observation zone.
Today, I’ll focus on these two breakouts. If price swings over quickly during the session, what matters is whether it can stay there by the close. $BTC $ETH
Now it’s the morning of the 14th; the 4-hour candle hasn’t closed yet. If by 12:00 it can close above 77506 and the blue line in the chart, and if the pullback holds, I’ll consider adding more positions. First resistance to look at is 78068. Don’t lose the morning low at 76389—if it gets broken, I’ll pause this add-more plan for now.
As for ETH, it rebounded from around 2465 back to 2510, and it’s just a little short of the resistance at 2517. Once the 4-hour timeframe holds above 2517, then if the pullback doesn’t break, look for 2546. Below, 2462—2471 is the support observation zone.
Today, I’ll focus on these two breakouts. If price swings over quickly during the session, what matters is whether it can stay there by the close. $BTC $ETH
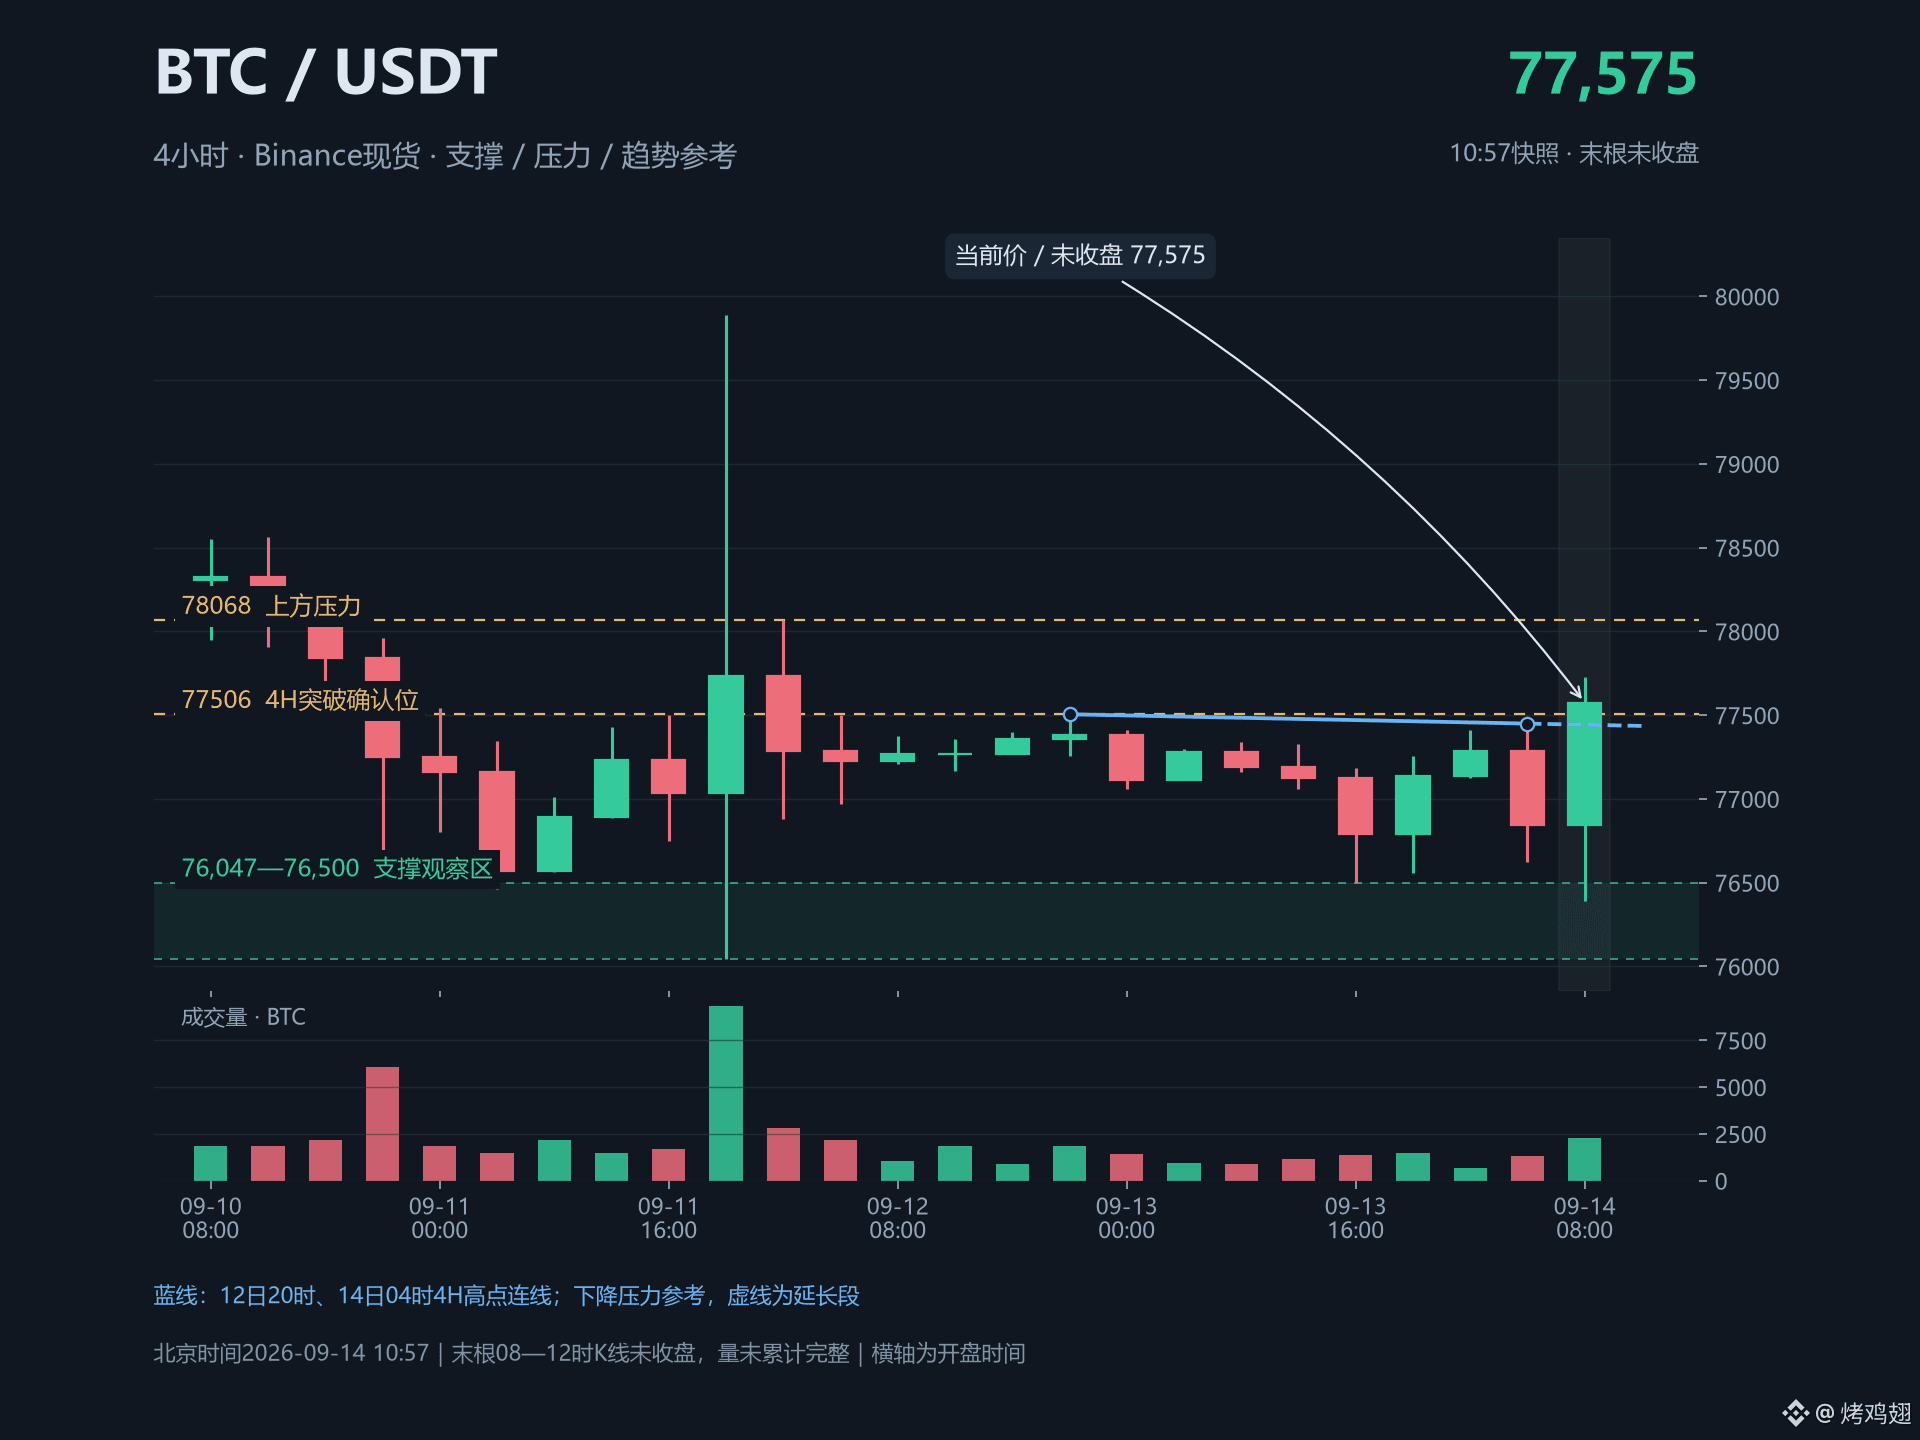
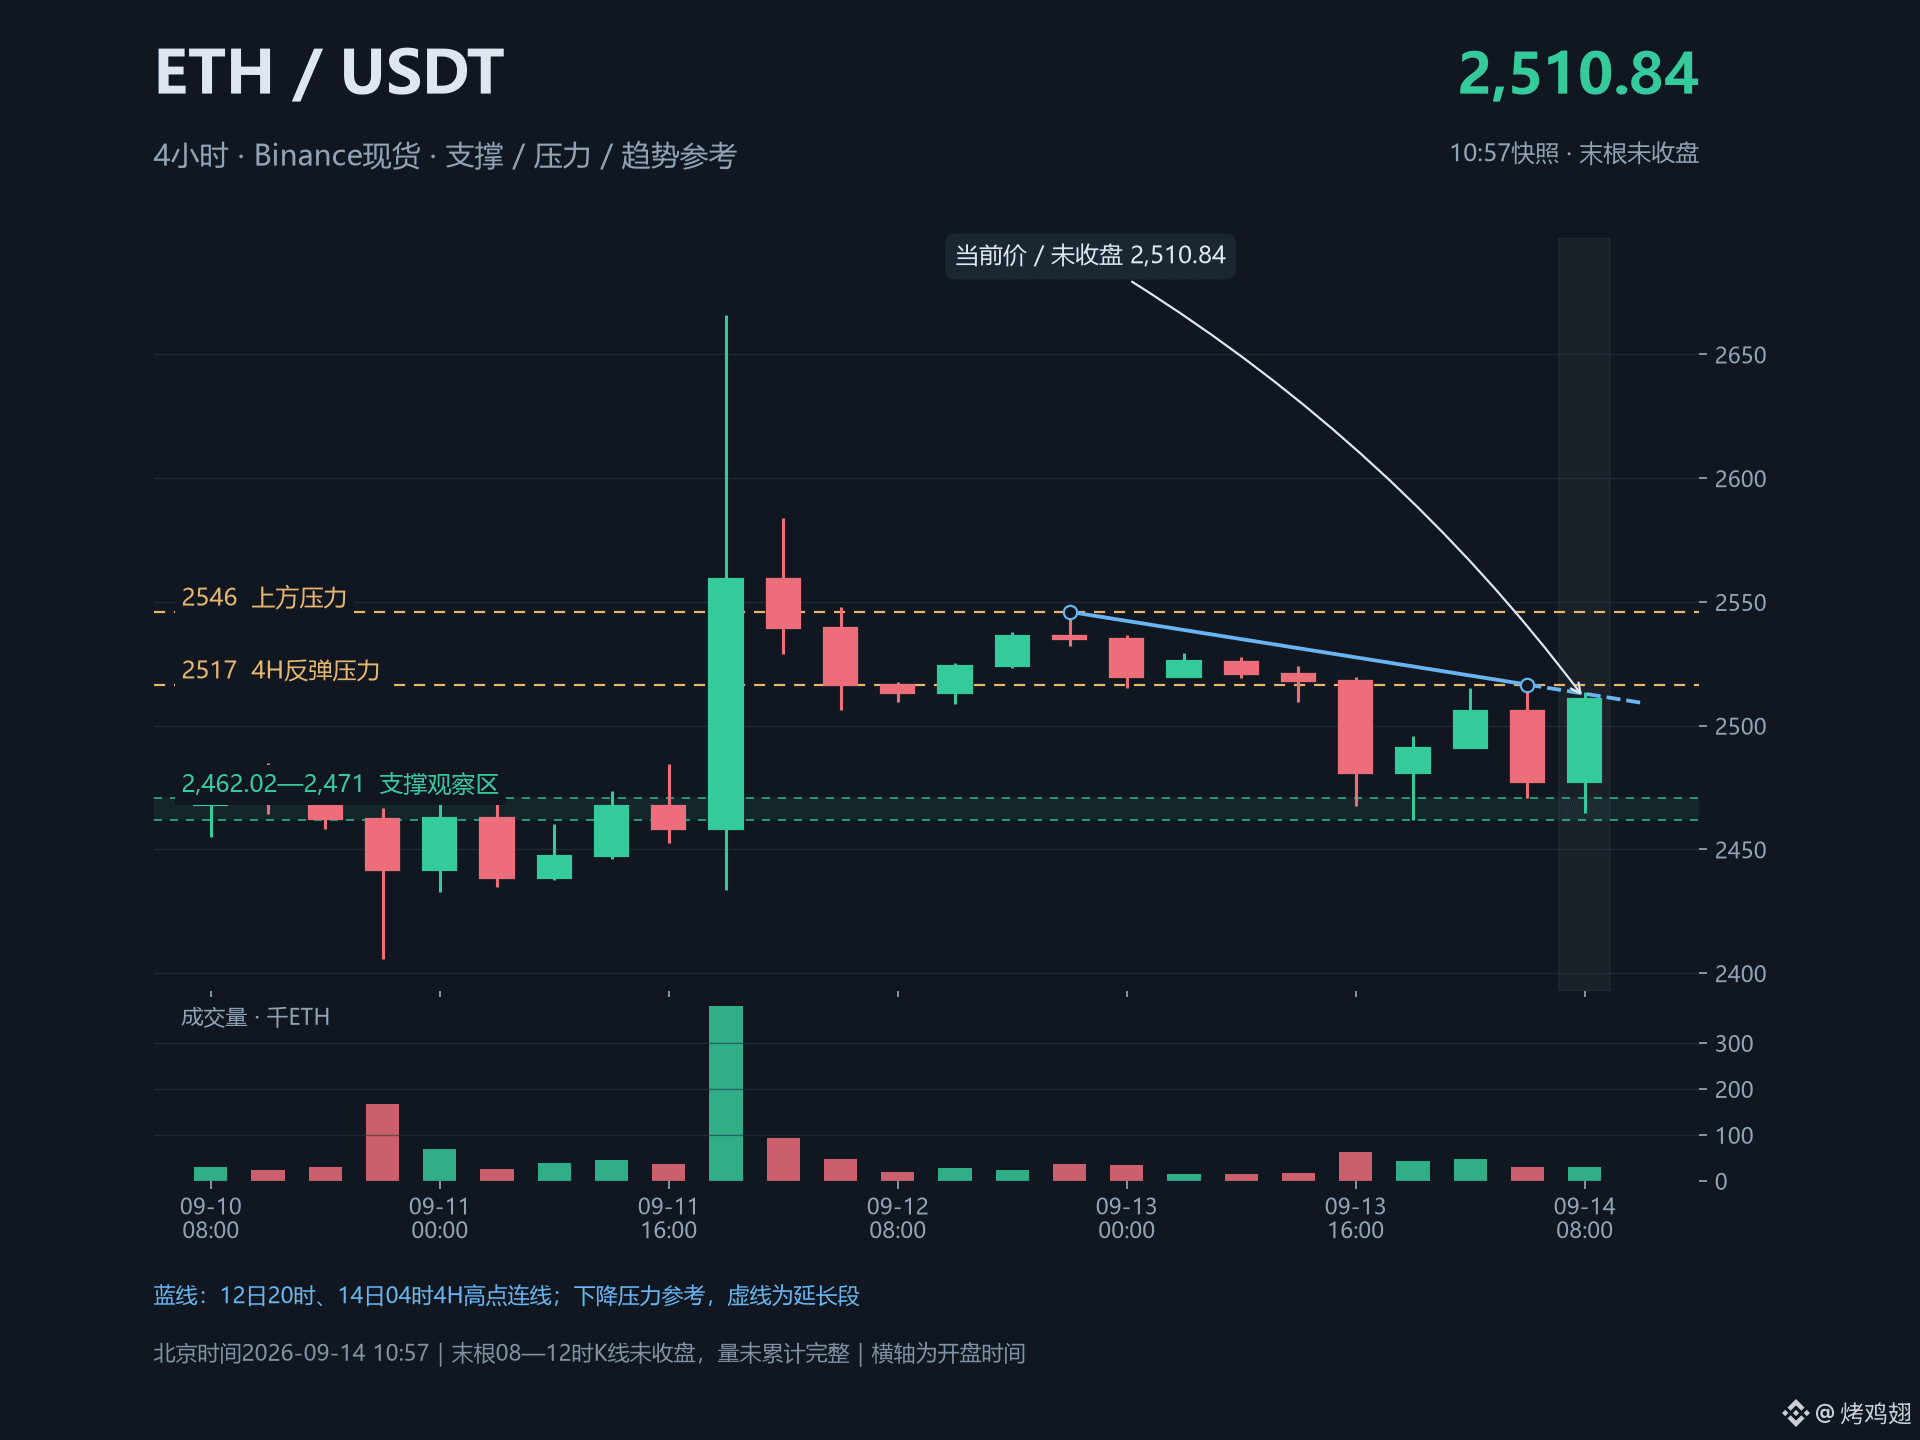
155
·
--
Last night, the big pancake (BTC) broke through 77620. The conditions I was waiting for—where I’d add longs on support—didn’t materialize yesterday, so today I’m switching to the 4-hour chart to reassess.
For BTC, I’ll first keep an eye on 76464–76676 below. But the low point is still moving downward; reaching this area doesn’t automatically mean the bottom is in. I’d rather wait for a 4-hour close back above 77544–77620, then see whether a pullback can hold—this way I’ll have more confidence in the rebound.
For Ethereum (ETH), I think it’s more worth watching: after dipping to 2406 last night and pulling back, the next two 4-hour candles’ lows were not broken. If 2433–2435 can hold, and price stands above the descending trendline and 2475 with volume, then if the pullback doesn’t fail, I’ll consider going long—first targeting 2485.
In this rebound, I’m more focused on ETH. If 2433 is lost, then just wait; don’t assume strength in holding means it can’t fall.$BTC $ETH
Last night, the big pancake (BTC) broke through 77620. The conditions I was waiting for—where I’d add longs on support—didn’t materialize yesterday, so today I’m switching to the 4-hour chart to reassess.
For BTC, I’ll first keep an eye on 76464–76676 below. But the low point is still moving downward; reaching this area doesn’t automatically mean the bottom is in. I’d rather wait for a 4-hour close back above 77544–77620, then see whether a pullback can hold—this way I’ll have more confidence in the rebound.
For Ethereum (ETH), I think it’s more worth watching: after dipping to 2406 last night and pulling back, the next two 4-hour candles’ lows were not broken. If 2433–2435 can hold, and price stands above the descending trendline and 2475 with volume, then if the pullback doesn’t fail, I’ll consider going long—first targeting 2485.
In this rebound, I’m more focused on ETH. If 2433 is lost, then just wait; don’t assume strength in holding means it can’t fall.$BTC $ETH
For BTC, I’ll first keep an eye on 76464–76676 below. But the low point is still moving downward; reaching this area doesn’t automatically mean the bottom is in. I’d rather wait for a 4-hour close back above 77544–77620, then see whether a pullback can hold—this way I’ll have more confidence in the rebound.
For Ethereum (ETH), I think it’s more worth watching: after dipping to 2406 last night and pulling back, the next two 4-hour candles’ lows were not broken. If 2433–2435 can hold, and price stands above the descending trendline and 2475 with volume, then if the pullback doesn’t fail, I’ll consider going long—first targeting 2485.
In this rebound, I’m more focused on ETH. If 2433 is lost, then just wait; don’t assume strength in holding means it can’t fall.$BTC $ETH
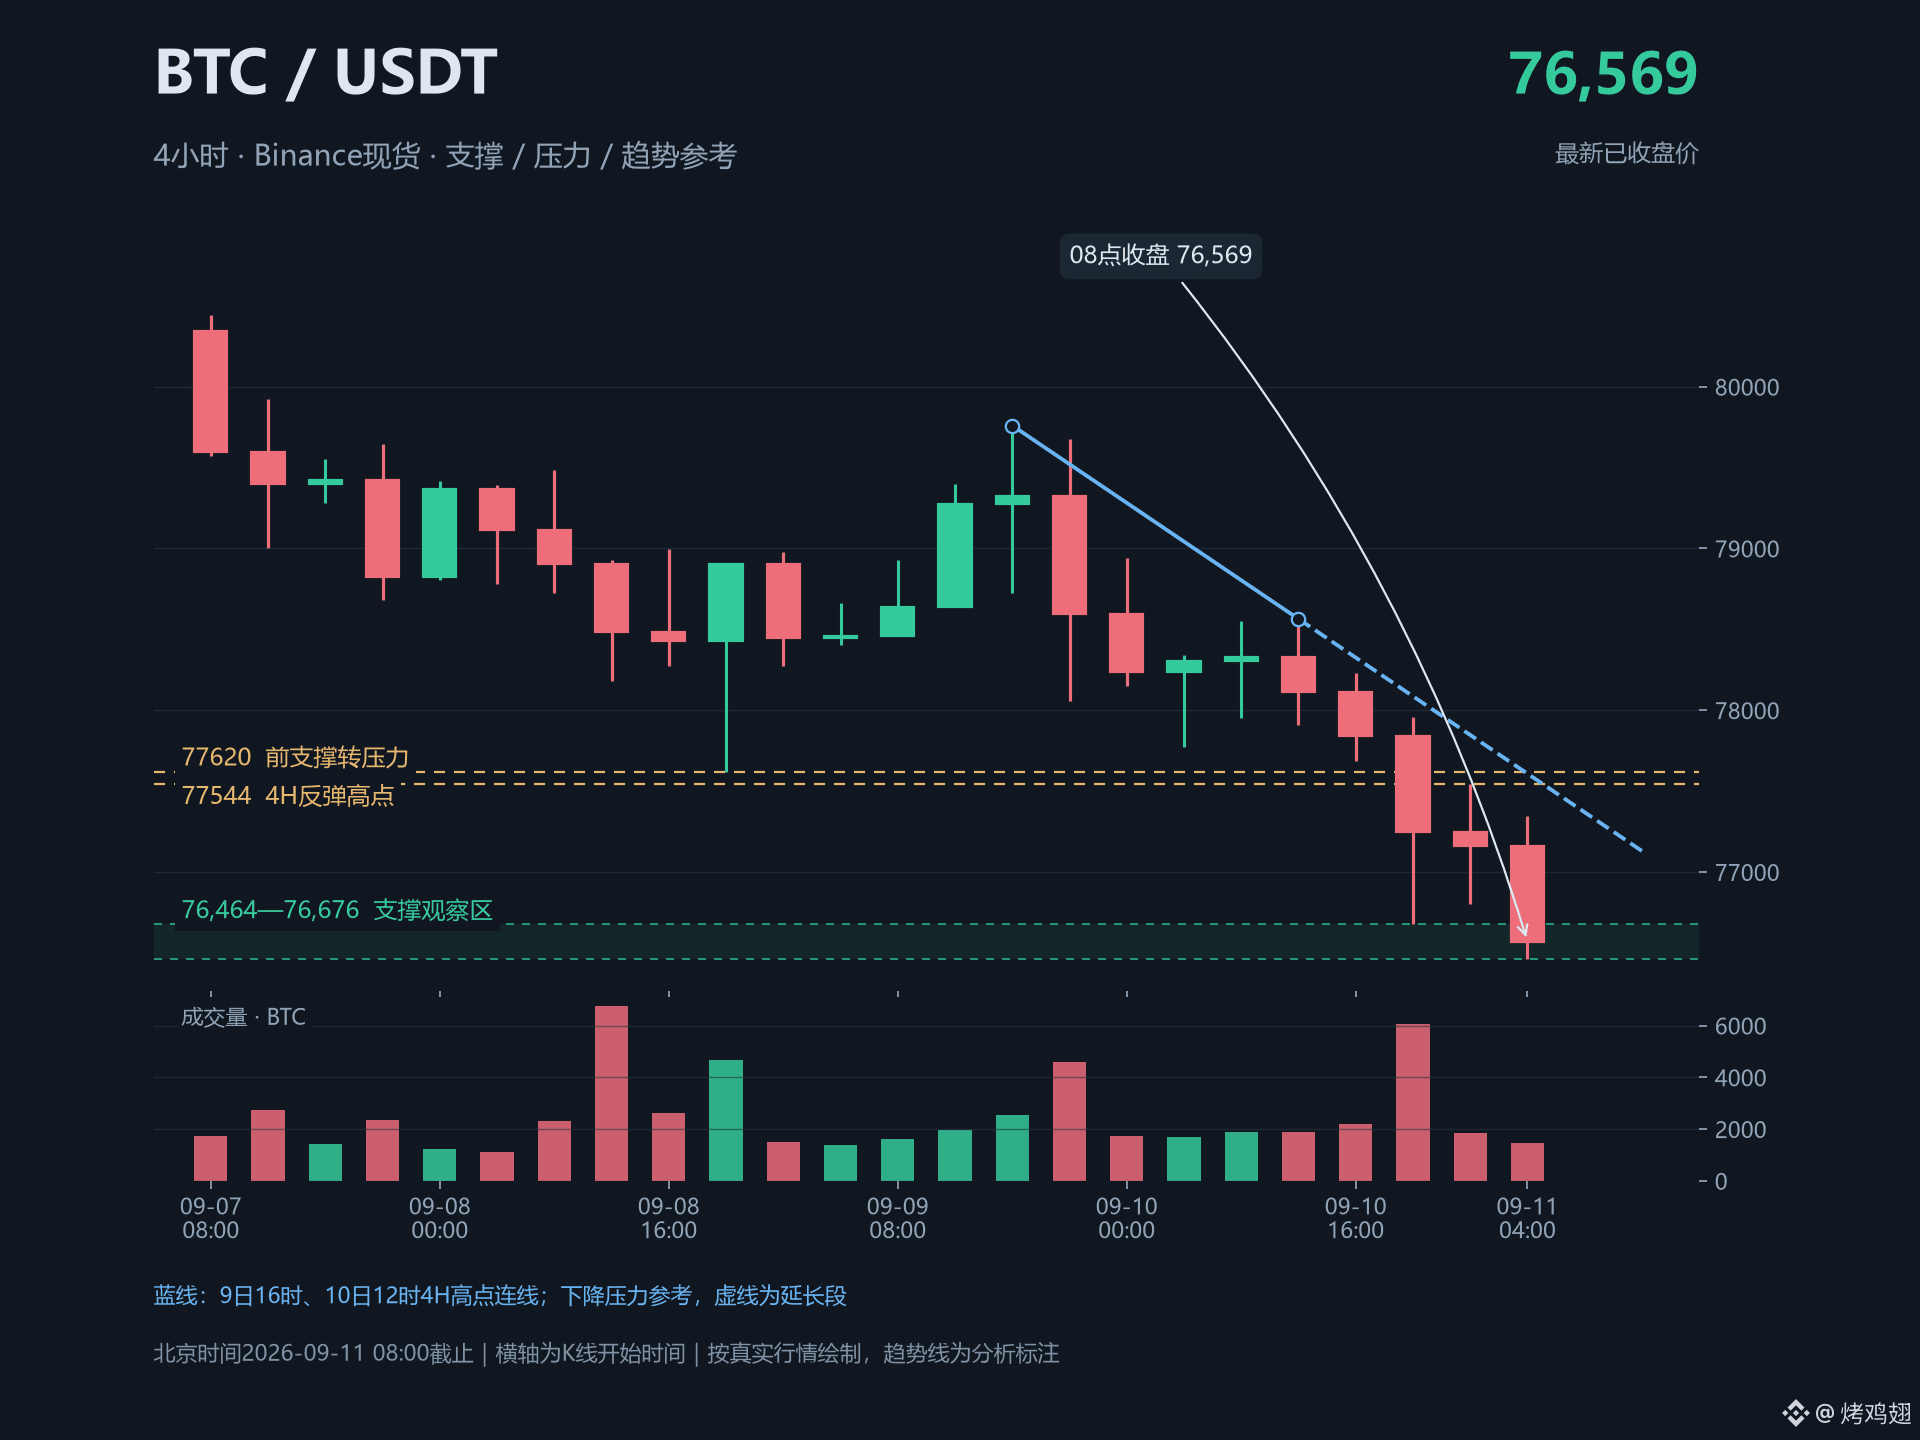
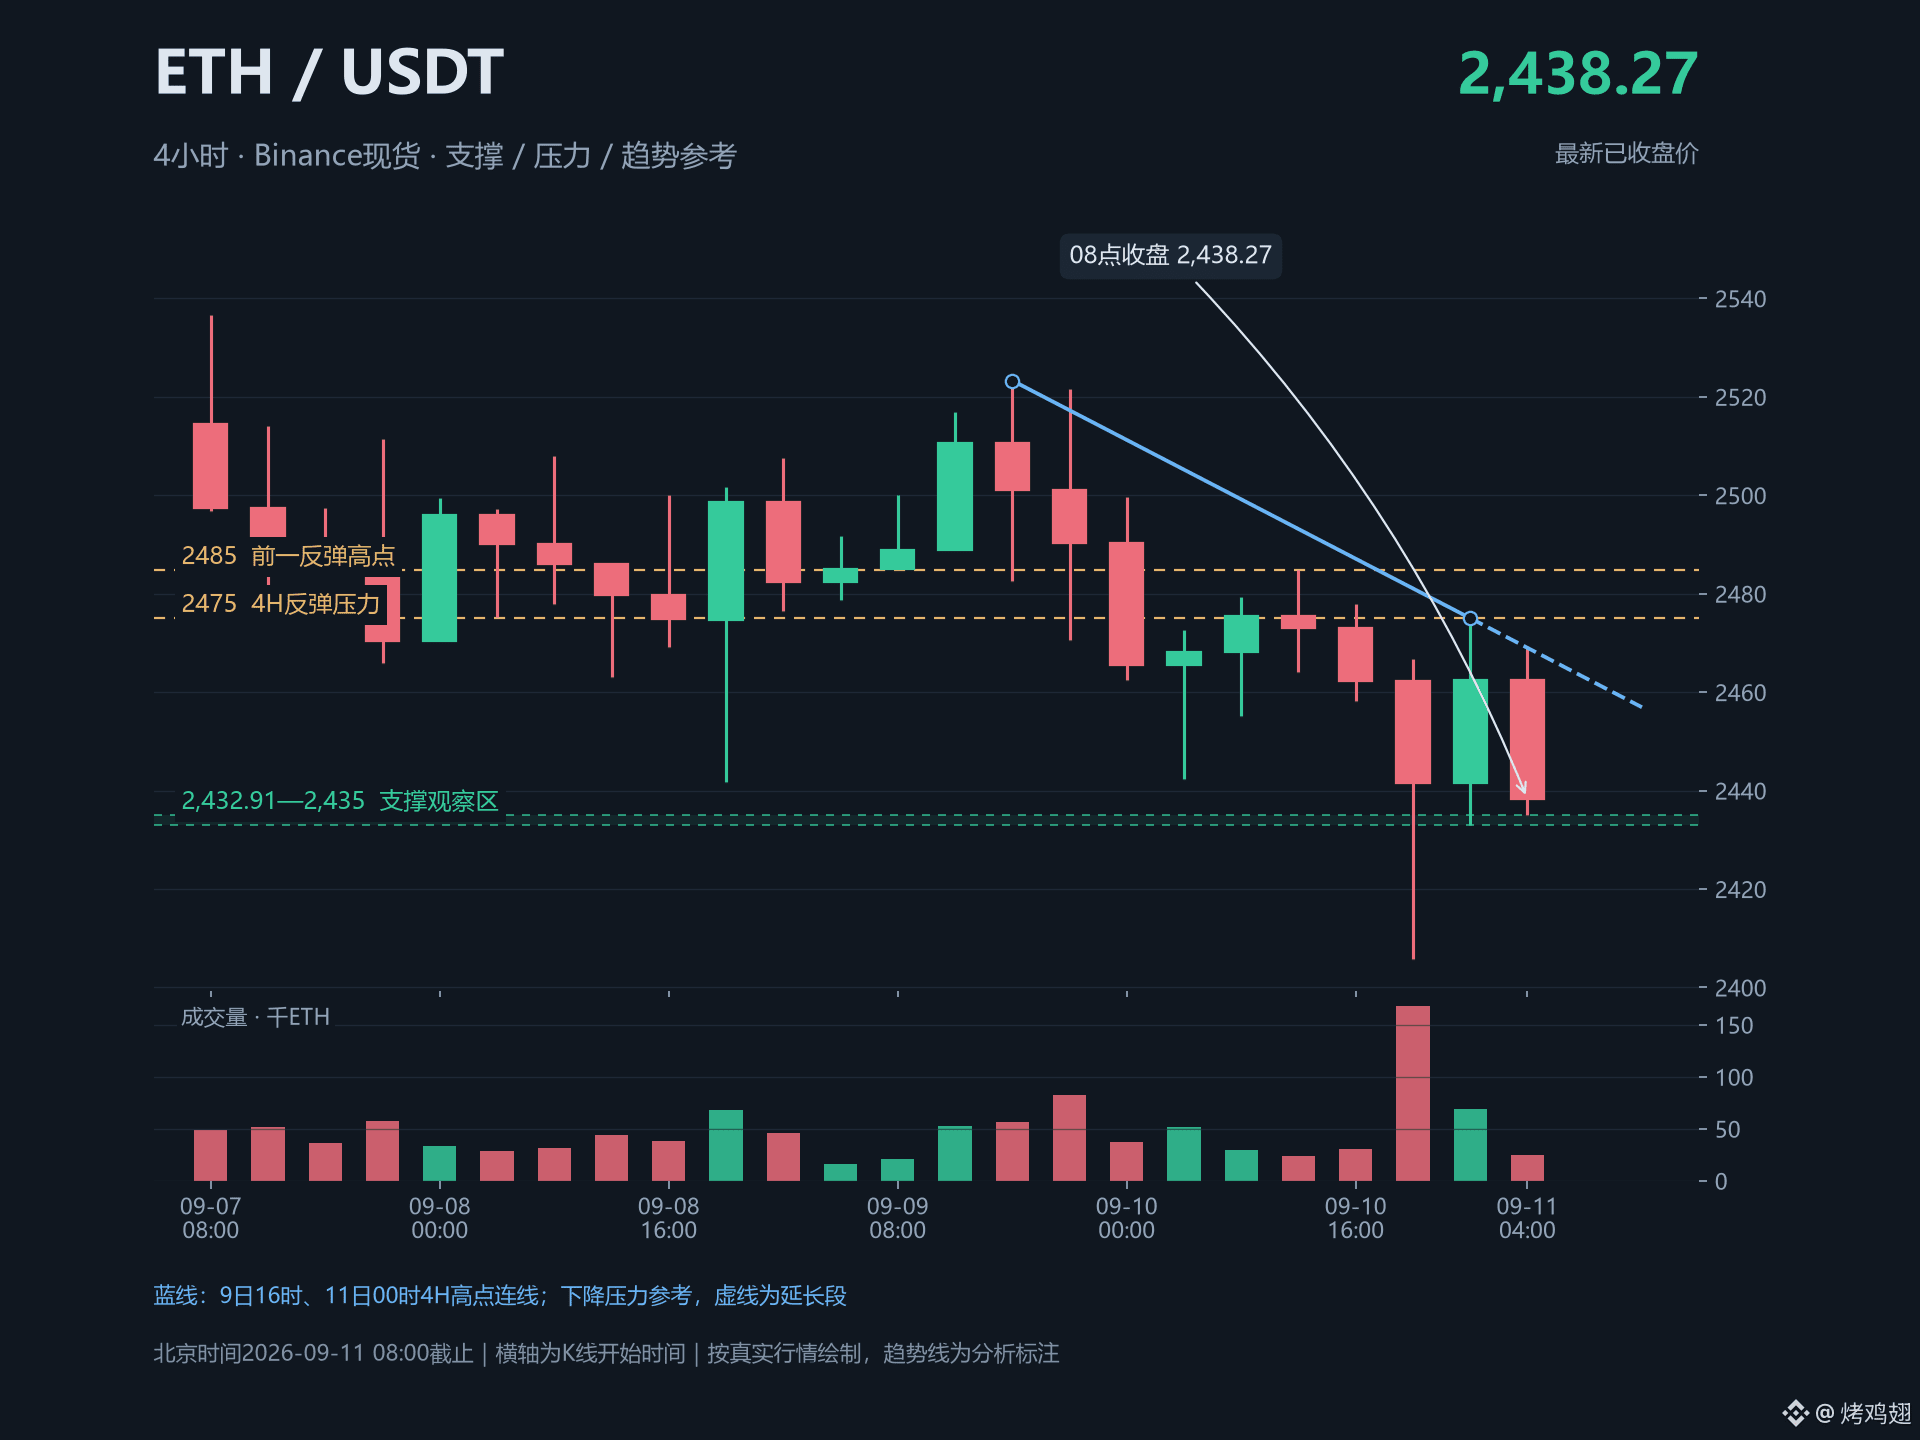
175
·
--
That rebound last night didn’t continue. Today if you want to add more, don’t rush yet—wait for the price to move a bit lower.
Bitcoin has already returned to around 78,000. I’ll first watch support in the 77,620–77,770 range. The hourly chart is still below the falling trendline. At least it needs to reclaim 78,230 first—then after a pullback holds as support, we can consider entries. On the upside, I’m watching 78,564. If you chase in right now, it’s easy to get stuck trading through another round of sideways grind.
Ethereum can withstand the downside a bit better, but it also hasn’t broken out. On the downside, pay attention to the 2,454–2,442 area for signs of bottoming. On the upside, first get above 2,478, then look at 2,485. It’ll be more interesting only if volume can follow through.
Tonight, I’m more inclined to trade the first leg of the rebound after a bottom is confirmed. If Bitcoin at 77,620 or Ethereum at 2,442 can’t hold, then postpone the plan to go long—don’t rush to help the market find the bottom. $BTC $ETH
That rebound last night didn’t continue. Today if you want to add more, don’t rush yet—wait for the price to move a bit lower.
Bitcoin has already returned to around 78,000. I’ll first watch support in the 77,620–77,770 range. The hourly chart is still below the falling trendline. At least it needs to reclaim 78,230 first—then after a pullback holds as support, we can consider entries. On the upside, I’m watching 78,564. If you chase in right now, it’s easy to get stuck trading through another round of sideways grind.
Ethereum can withstand the downside a bit better, but it also hasn’t broken out. On the downside, pay attention to the 2,454–2,442 area for signs of bottoming. On the upside, first get above 2,478, then look at 2,485. It’ll be more interesting only if volume can follow through.
Tonight, I’m more inclined to trade the first leg of the rebound after a bottom is confirmed. If Bitcoin at 77,620 or Ethereum at 2,442 can’t hold, then postpone the plan to go long—don’t rush to help the market find the bottom. $BTC $ETH
Bitcoin has already returned to around 78,000. I’ll first watch support in the 77,620–77,770 range. The hourly chart is still below the falling trendline. At least it needs to reclaim 78,230 first—then after a pullback holds as support, we can consider entries. On the upside, I’m watching 78,564. If you chase in right now, it’s easy to get stuck trading through another round of sideways grind.
Ethereum can withstand the downside a bit better, but it also hasn’t broken out. On the downside, pay attention to the 2,454–2,442 area for signs of bottoming. On the upside, first get above 2,478, then look at 2,485. It’ll be more interesting only if volume can follow through.
Tonight, I’m more inclined to trade the first leg of the rebound after a bottom is confirmed. If Bitcoin at 77,620 or Ethereum at 2,442 can’t hold, then postpone the plan to go long—don’t rush to help the market find the bottom. $BTC $ETH
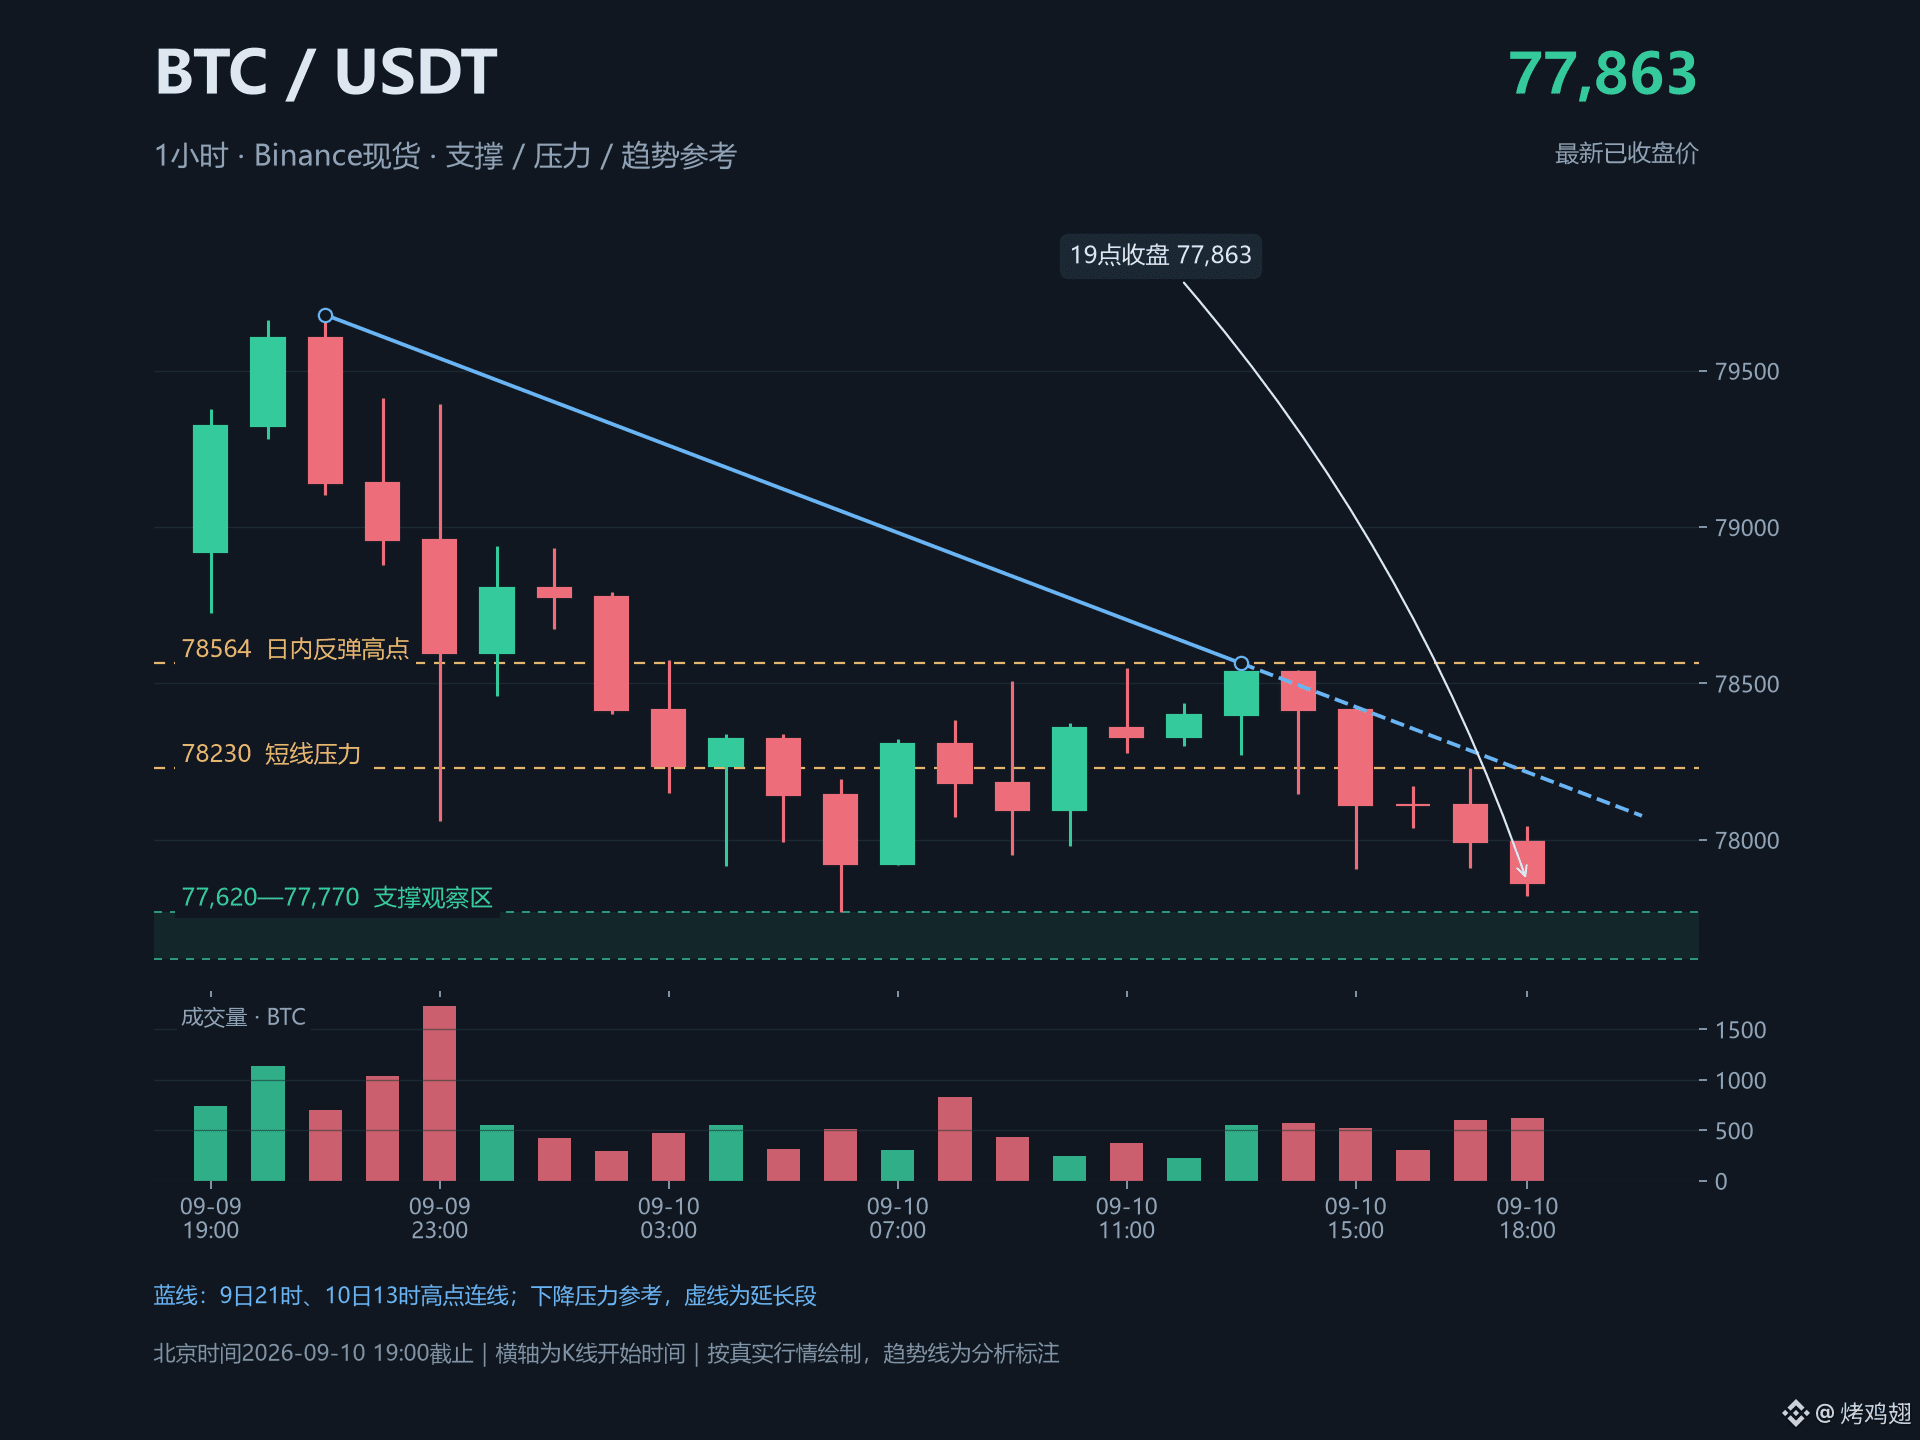
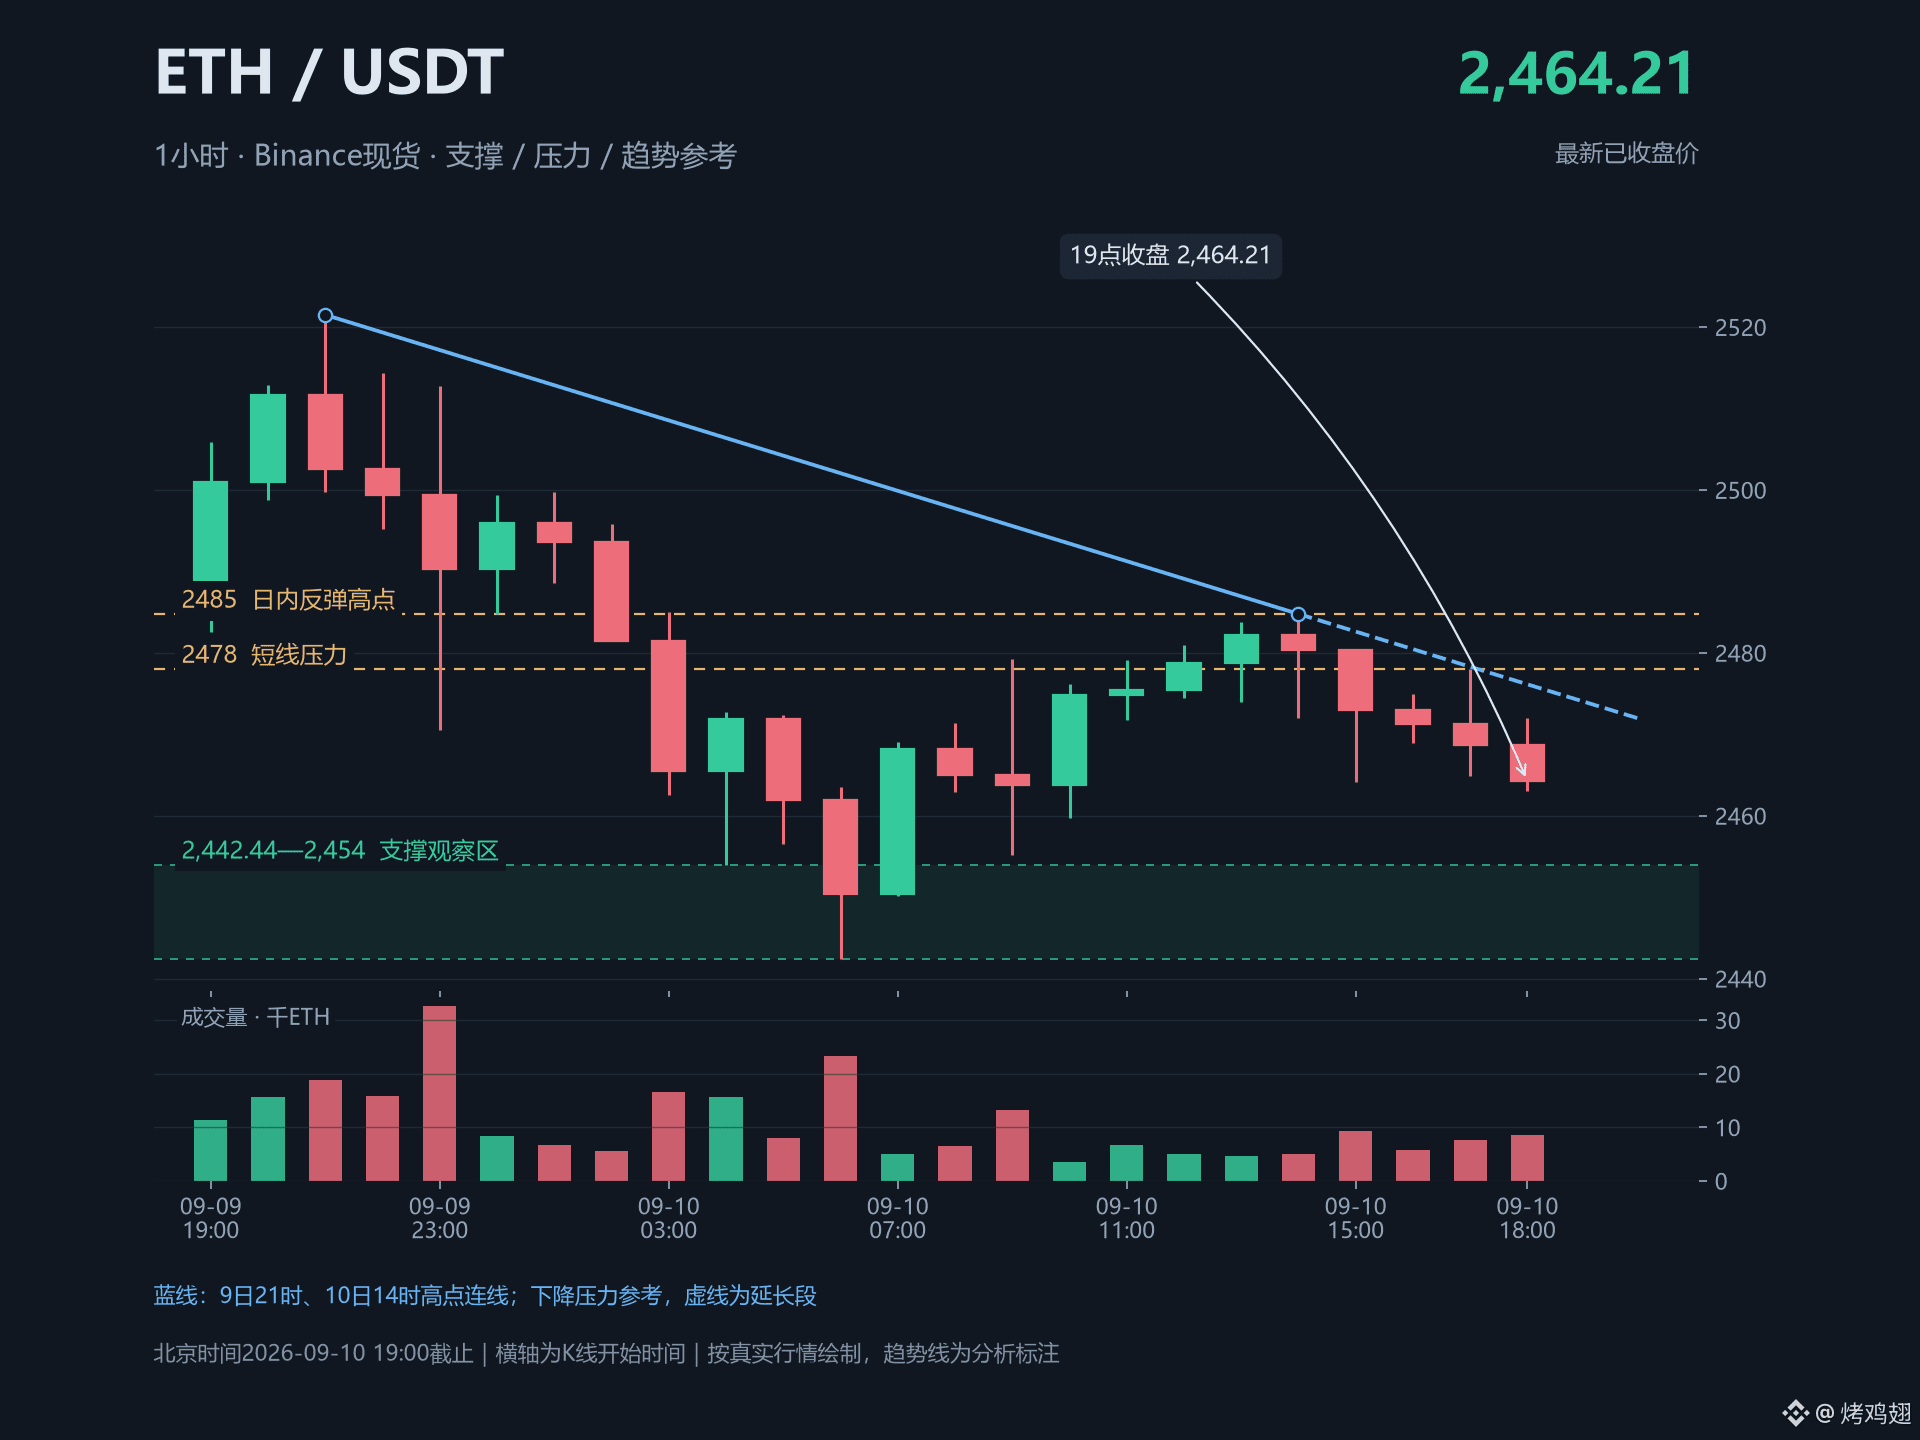
2
313
·
--
VIRTUAL falls below 0.6975—can you bottom-fish in the last hour?
Seeing $VIRTUAL rebound from 0.6432 to 0.6599 makes it easy to think the worst is over. But for now, I only treat this as a pullback after a breakdown, not as confirmation of a reversal. Chasing this move too quickly comes at the cost of using a single 1H candle to fight against already-closed daily and 4H charts.
On Binance spot, the complete 4H from Sep 10, 04:00–08:00 (Beijing time) closed with VIRTUAL at 0.6599 USDT, down about 3.23%, and the volume was 1.87 times the average volume of the prior 20 candles; meanwhile, BTC was slightly up during the same period. The newly closed exchange daily is down about 7.59%, which shows the weakness isn’t just dragging down with the broader market.
The counter-evidence is also strong: the latest 4H’s active buy volume accounts for about 54%, and the final 1H bounce is roughly 1.79%. This suggests there is active buying at lower levels, but “more active buying” doesn’t necessarily mean the price has already turned strong. At minimum, the 4H close has not yet reclaimed the old structure.
My observation plan hasn’t been executed yet: I’m not going to chase a short here, and I’m not going to rush in. If later a complete 4H closes back above 0.6975, and its volume is no less than the average volume of its prior 20 4H candles, then I’ll treat this breakdown as invalid and reassess. If it doesn’t happen, I’ll continue to defend.
Source: Binance spot API (VIRTUALUSDT, BTCUSDT), data as of 08:04 Beijing time on Sep 10. OI, contract CVD, and funding rate could not be obtained.
VIRTUAL falls below 0.6975—can you bottom-fish in the last hour?
Seeing $VIRTUAL rebound from 0.6432 to 0.6599 makes it easy to think the worst is over. But for now, I only treat this as a pullback after a breakdown, not as confirmation of a reversal. Chasing this move too quickly comes at the cost of using a single 1H candle to fight against already-closed daily and 4H charts.
On Binance spot, the complete 4H from Sep 10, 04:00–08:00 (Beijing time) closed with VIRTUAL at 0.6599 USDT, down about 3.23%, and the volume was 1.87 times the average volume of the prior 20 candles; meanwhile, BTC was slightly up during the same period. The newly closed exchange daily is down about 7.59%, which shows the weakness isn’t just dragging down with the broader market.
The counter-evidence is also strong: the latest 4H’s active buy volume accounts for about 54%, and the final 1H bounce is roughly 1.79%. This suggests there is active buying at lower levels, but “more active buying” doesn’t necessarily mean the price has already turned strong. At minimum, the 4H close has not yet reclaimed the old structure.
My observation plan hasn’t been executed yet: I’m not going to chase a short here, and I’m not going to rush in. If later a complete 4H closes back above 0.6975, and its volume is no less than the average volume of its prior 20 4H candles, then I’ll treat this breakdown as invalid and reassess. If it doesn’t happen, I’ll continue to defend.
Source: Binance spot API (VIRTUALUSDT, BTCUSDT), data as of 08:04 Beijing time on Sep 10. OI, contract CVD, and funding rate could not be obtained.
Seeing $VIRTUAL rebound from 0.6432 to 0.6599 makes it easy to think the worst is over. But for now, I only treat this as a pullback after a breakdown, not as confirmation of a reversal. Chasing this move too quickly comes at the cost of using a single 1H candle to fight against already-closed daily and 4H charts.
On Binance spot, the complete 4H from Sep 10, 04:00–08:00 (Beijing time) closed with VIRTUAL at 0.6599 USDT, down about 3.23%, and the volume was 1.87 times the average volume of the prior 20 candles; meanwhile, BTC was slightly up during the same period. The newly closed exchange daily is down about 7.59%, which shows the weakness isn’t just dragging down with the broader market.
The counter-evidence is also strong: the latest 4H’s active buy volume accounts for about 54%, and the final 1H bounce is roughly 1.79%. This suggests there is active buying at lower levels, but “more active buying” doesn’t necessarily mean the price has already turned strong. At minimum, the 4H close has not yet reclaimed the old structure.
My observation plan hasn’t been executed yet: I’m not going to chase a short here, and I’m not going to rush in. If later a complete 4H closes back above 0.6975, and its volume is no less than the average volume of its prior 20 4H candles, then I’ll treat this breakdown as invalid and reassess. If it doesn’t happen, I’ll continue to defend.
Source: Binance spot API (VIRTUALUSDT, BTCUSDT), data as of 08:04 Beijing time on Sep 10. OI, contract CVD, and funding rate could not be obtained.
189
·
--
First round of verification after oil prices broke 100: did BTC really get dragged down by US stocks?
The most important decision in the previous post was to wait until the 20:00 close—this part was right. But if we explain the intraday pullback directly as oil-price transmission, that portion still hasn’t been confirmed by data. Admitting this difference matters more than forcing the story to feel complete.
Binance spot 4H trading from 16:00 to 20:00 Beijing time on September 9 has closed. $BTC rose from $79,277 to close at $79,325, with volume about 119% of the average volume of the prior 20 candles, yet it did not break below the pre-recorded confirmation line of 78,638. Aggressive buy volume accounted for 46.4%, suggesting that aggressive sell volume was higher, but the price did not complete a downside breakdown.
After US stocks actually opened at 21:30, as of 21:40 the Nasdaq was down about 0.32% versus the previous close, and BTC was down about 0.27% from $79,620 at 21:30. The US Dollar Index was about 0.14% lower than the previous close as of 21:30. The 10-year US Treasury yield was about 4.806% as of 21:25, nearly unchanged from the prior close. Several assets did not provide a consistent “liquidity tightening → BTC fall” chain, and the related volatility cannot be treated as causality.
Counterevidence cannot be ignored: BTC had already given back intraday gains while the Nasdaq remained below water. The observation plan has not been executed yet: if BTC completes a 4H close below 78,725 and the volume is no less than that of the previous 20-candle average, then I will raise my assessment that macro pressure has transmitted. If it completes a 4H close above 79,760, then this near-term transmission hypothesis is invalid. For now, we continue to wait—without rushing to prove myself right.
Source: Binance Spot API (BTCUSDT) and Yahoo Finance (Nasdaq, US Dollar Index, 10-year US Treasury yield), all as of Beijing time on September 9. OI, contract CVD, and funding rates were not obtained.
First round of verification after oil prices broke 100: did BTC really get dragged down by US stocks?
The most important decision in the previous post was to wait until the 20:00 close—this part was right. But if we explain the intraday pullback directly as oil-price transmission, that portion still hasn’t been confirmed by data. Admitting this difference matters more than forcing the story to feel complete.
Binance spot 4H trading from 16:00 to 20:00 Beijing time on September 9 has closed. $BTC rose from $79,277 to close at $79,325, with volume about 119% of the average volume of the prior 20 candles, yet it did not break below the pre-recorded confirmation line of 78,638. Aggressive buy volume accounted for 46.4%, suggesting that aggressive sell volume was higher, but the price did not complete a downside breakdown.
After US stocks actually opened at 21:30, as of 21:40 the Nasdaq was down about 0.32% versus the previous close, and BTC was down about 0.27% from $79,620 at 21:30. The US Dollar Index was about 0.14% lower than the previous close as of 21:30. The 10-year US Treasury yield was about 4.806% as of 21:25, nearly unchanged from the prior close. Several assets did not provide a consistent “liquidity tightening → BTC fall” chain, and the related volatility cannot be treated as causality.
Counterevidence cannot be ignored: BTC had already given back intraday gains while the Nasdaq remained below water. The observation plan has not been executed yet: if BTC completes a 4H close below 78,725 and the volume is no less than that of the previous 20-candle average, then I will raise my assessment that macro pressure has transmitted. If it completes a 4H close above 79,760, then this near-term transmission hypothesis is invalid. For now, we continue to wait—without rushing to prove myself right.
Source: Binance Spot API (BTCUSDT) and Yahoo Finance (Nasdaq, US Dollar Index, 10-year US Treasury yield), all as of Beijing time on September 9. OI, contract CVD, and funding rates were not obtained.
The most important decision in the previous post was to wait until the 20:00 close—this part was right. But if we explain the intraday pullback directly as oil-price transmission, that portion still hasn’t been confirmed by data. Admitting this difference matters more than forcing the story to feel complete.
Binance spot 4H trading from 16:00 to 20:00 Beijing time on September 9 has closed. $BTC rose from $79,277 to close at $79,325, with volume about 119% of the average volume of the prior 20 candles, yet it did not break below the pre-recorded confirmation line of 78,638. Aggressive buy volume accounted for 46.4%, suggesting that aggressive sell volume was higher, but the price did not complete a downside breakdown.
After US stocks actually opened at 21:30, as of 21:40 the Nasdaq was down about 0.32% versus the previous close, and BTC was down about 0.27% from $79,620 at 21:30. The US Dollar Index was about 0.14% lower than the previous close as of 21:30. The 10-year US Treasury yield was about 4.806% as of 21:25, nearly unchanged from the prior close. Several assets did not provide a consistent “liquidity tightening → BTC fall” chain, and the related volatility cannot be treated as causality.
Counterevidence cannot be ignored: BTC had already given back intraday gains while the Nasdaq remained below water. The observation plan has not been executed yet: if BTC completes a 4H close below 78,725 and the volume is no less than that of the previous 20-candle average, then I will raise my assessment that macro pressure has transmitted. If it completes a 4H close above 79,760, then this near-term transmission hypothesis is invalid. For now, we continue to wait—without rushing to prove myself right.
Source: Binance Spot API (BTCUSDT) and Yahoo Finance (Nasdaq, US Dollar Index, 10-year US Treasury yield), all as of Beijing time on September 9. OI, contract CVD, and funding rates were not obtained.
118
Log in to explore more content
Join global crypto users on Binance Square
⚡️ Get latest and useful information about crypto.
💬 Trusted by the world’s largest crypto exchange.
👍 Discover real insights from verified creators.
Email / Phone number
Trending Topics
BTCBreaks80K
12,279 views
416 Discussing
🚨 BITCOIN $80K IS BACK IN FOCUS! 🔥
BTC is pushing toward the $80,000 psychological resistance after reclaiming the $78K zone. A clean breakout and hold above $80K could bring $82K–$85K into focus next. 📈
But traders need to watch the rejection zone carefully — losing $77K–$78K could trigger another pullback.
🎯 Key levels:
• 🔥 Breakout: $80K
• 🚀 Next zone: $82K–$85K
• ⚠️ Support: $77K–$78K
$80K isn’t just a number — it’s the level bulls need to conquer.
Are we about to see the next BTC breakout? 👇
#bitcoin #BTC #BinanceSquare #btcbreaks80k
$BTC
ASHFAQ NAEEM
·3 Likes
·3.7k views
比特币突破8万
19,400 views
71 Discussing
BuffettBecomesBerkshireChairmanEmeritus
163 views
51 Discussing