
硅谷居士搬运号
886 Posts

硅谷居士搬运号
Report
Block User
清华本科,美国计算机博士,硅谷软件工程师兼经理。兴趣包括开发软件、投资理财、健身和写作。
订阅会员可以给我发私信交流投资理财问题。
小红书号、脸书号、文学城号:硅谷居士。
X平台上唯一的“硅谷居士”号。谨防骗子账户!
我没有Telegram、WhatsApp 账号。不要进骗子拉的群。
0 Following
1.3K+ Followers
845 Liked
Posts
·
--
See translation
近期我留意到X平台的整体环境有了显著的改善。那些过去经常在评论区伪装成我的诈骗分子,如今已经停止了留言互动,而且令人困扰的色情推广内容也随之大幅减少。面对这种积极的变化,我不禁感到好奇,这到底是因为那些恶意用户主动停止了作恶,还是X的工程师团队在背后采取了实质性的干预措施呢。
近期我留意到X平台的整体环境有了显著的改善。那些过去经常在评论区伪装成我的诈骗分子,如今已经停止了留言互动,而且令人困扰的色情推广内容也随之大幅减少。面对这种积极的变化,我不禁感到好奇,这到底是因为那些恶意用户主动停止了作恶,还是X的工程师团队在背后采取了实质性的干预措施呢。
1
·
--
William Sharpe once said a famous quote: for an investor on the path to success, 85% of the credit goes to proper asset allocation—the ability to select investment targets accounts for 10%, and the remaining 5% requires God’s favor.
When discussing asset allocation, I’ve often shared with everyone a piece of data from the past: as the world’s largest stock market by size, the U.S. stock market’s market capitalization accounts for roughly 40% of the global total. However, a recent report released by Goldman Sachs on the distribution structure of global investable financial assets has prompted me to re-examine this belief.
Goldman Sachs’ report covers global financial assets totaling as much as $260 trillion, spanning multiple areas including equities, bonds, gold, private equity, real estate, and crypto assets. It is particularly worth noting that the statistics strictly exclude owner-occupied residential housing and include only financial assets with liquidity.
In terms of the share of each major asset category, the structure of the global investment market shows clear characteristics. Equities make up 49%—nearly half. Next are bonds at 37%, and more than half of that bond portion consists of government bonds. Although gold surged to unprecedented popularity in 2025, its overall weight is still only 6%. The remaining portion is made up of 5% private markets and 2% real estate. As for those highly talked-about cryptocurrencies, they still play a marginal role in overall scale, accounting for just 1%. It is not hard to see that the traditional securities market composed of equities and bonds remains the absolute mainstay—together, they account for a combined 86%.
If we view the same set of data from a regional distribution perspective, Goldman Sachs also provides a detailed breakdown. In the global bond market, U.S. bonds lead with a 43% share; Europe and Asia account for 29% and 21%, respectively. Meanwhile, in the stock market, the report shows that the market capitalization share of U.S. equities is a staggering 64%. This figure far exceeds Europe’s 11%, Japan’s 5%, and the combined remainder of Asia at 12%.
This 64% figure differs greatly from the 40% I have always kept in mind. So what is the true share of U.S. equities in the global market today?
To find out, I went back to data from ten years ago. At the end of 2015, the total market capitalization of global equities was about $67 trillion, of which the U.S. stock market’s overall size was $25 trillion. Doing the calculation, the U.S. share at that time was exactly 37%—indeed very close to the 40% impression I had.
However, as time moved forward to October 2025, the total size of the U.S. stock market had expanded to $67 trillion. That means that over the past decade, even without counting dividend returns, looking only at the expansion of equity market capitalization, the U.S. stock market achieved an astonishing growth of 168%, equivalent to an average annual growth rate of 10.3%. Over the same period, the total size of the global stock market also rose to about $130 trillion, with an overall increase of roughly 94% over the decade.
With this simple calculation, it becomes clear that the current actual share of U.S. equities in the global stock market has increased to 52%, up 15% compared to ten years ago. This truly reminds me that it is time to comprehensively update my investment mindset.
Why has the global share of U.S. equities risen so rapidly in a short time? The answer is actually very straightforward: the quality of U.S. equities is simply excellent, and the pace of expansion has been extremely fast. If we exclude the U.S. stock market, over this decade, the combined total market capitalization of equities in other countries and regions around the world only grew slowly from $42 trillion to $63 trillion. Their overall growth rate was 50%, translating to an average annual growth rate of only 4.2%.
A 4.2% average annual growth speed is vastly different from U.S. equities’ 10.3% pace. If in the future U.S. equities can continue to maintain this strong lead over regions outside the U.S., then in another ten years, their share in the global stock market may well cross the 60% threshold smoothly.
Therefore, for any investor with a global perspective—no matter where you are in the world—you should deeply recognize a fundamental logic: the U.S. dollar system remains the core anchor for global capital in allocating assets. When building your personal wealth portfolio, allocating a sufficient proportion of dollar-denominated assets is an essential step. And among all dollar assets, the long-term annualized return that the U.S. stock market can provide not only significantly exceeds that of U.S. Treasuries, but also outperforms the stock markets of any other country or region worldwide.
As an ordinary investor who keeps moving forward in the market, I have long adhered to a simple investment maxim: cherish life, and go all-in on U.S. stocks!
I would be very grateful if you could support me by subscribing to my membership service, so I can continue creating more content for you. After becoming a member, you can also receive frequent updates of in-depth member-only articles on that platform. Once you are a member, you can also message me privately at any time to discuss any questions you may have about investing and personal finance. The subscription link is: https://x.com/SVScholar/creator-subscriptions/subscribe
If you’d like to further and comprehensively understand my practical experience and deep thinking in the field of investing and personal finance, feel free to search for me on Amazon or Google Play Books. You can look up my Chinese-language financial book, 《财富捷径》, or my English book, 《The Shortcut to Wealth: Your Simple Roadmap to Financial Independence》. Additionally, on my pinned social media post, there is also a direct route to purchase the books.
#FinancialFreedom #WealthFreedom #Finance #Investing #U.S.Stocks #UnitedStates #Stocks #Funds #Investment #Nasdaq #VGT #AI #SMH
William Sharpe once said a famous quote: for an investor on the path to success, 85% of the credit goes to proper asset allocation—the ability to select investment targets accounts for 10%, and the remaining 5% requires God’s favor.
When discussing asset allocation, I’ve often shared with everyone a piece of data from the past: as the world’s largest stock market by size, the U.S. stock market’s market capitalization accounts for roughly 40% of the global total. However, a recent report released by Goldman Sachs on the distribution structure of global investable financial assets has prompted me to re-examine this belief.
Goldman Sachs’ report covers global financial assets totaling as much as $260 trillion, spanning multiple areas including equities, bonds, gold, private equity, real estate, and crypto assets. It is particularly worth noting that the statistics strictly exclude owner-occupied residential housing and include only financial assets with liquidity.
In terms of the share of each major asset category, the structure of the global investment market shows clear characteristics. Equities make up 49%—nearly half. Next are bonds at 37%, and more than half of that bond portion consists of government bonds. Although gold surged to unprecedented popularity in 2025, its overall weight is still only 6%. The remaining portion is made up of 5% private markets and 2% real estate. As for those highly talked-about cryptocurrencies, they still play a marginal role in overall scale, accounting for just 1%. It is not hard to see that the traditional securities market composed of equities and bonds remains the absolute mainstay—together, they account for a combined 86%.
If we view the same set of data from a regional distribution perspective, Goldman Sachs also provides a detailed breakdown. In the global bond market, U.S. bonds lead with a 43% share; Europe and Asia account for 29% and 21%, respectively. Meanwhile, in the stock market, the report shows that the market capitalization share of U.S. equities is a staggering 64%. This figure far exceeds Europe’s 11%, Japan’s 5%, and the combined remainder of Asia at 12%.
This 64% figure differs greatly from the 40% I have always kept in mind. So what is the true share of U.S. equities in the global market today?
To find out, I went back to data from ten years ago. At the end of 2015, the total market capitalization of global equities was about $67 trillion, of which the U.S. stock market’s overall size was $25 trillion. Doing the calculation, the U.S. share at that time was exactly 37%—indeed very close to the 40% impression I had.
However, as time moved forward to October 2025, the total size of the U.S. stock market had expanded to $67 trillion. That means that over the past decade, even without counting dividend returns, looking only at the expansion of equity market capitalization, the U.S. stock market achieved an astonishing growth of 168%, equivalent to an average annual growth rate of 10.3%. Over the same period, the total size of the global stock market also rose to about $130 trillion, with an overall increase of roughly 94% over the decade.
With this simple calculation, it becomes clear that the current actual share of U.S. equities in the global stock market has increased to 52%, up 15% compared to ten years ago. This truly reminds me that it is time to comprehensively update my investment mindset.
Why has the global share of U.S. equities risen so rapidly in a short time? The answer is actually very straightforward: the quality of U.S. equities is simply excellent, and the pace of expansion has been extremely fast. If we exclude the U.S. stock market, over this decade, the combined total market capitalization of equities in other countries and regions around the world only grew slowly from $42 trillion to $63 trillion. Their overall growth rate was 50%, translating to an average annual growth rate of only 4.2%.
A 4.2% average annual growth speed is vastly different from U.S. equities’ 10.3% pace. If in the future U.S. equities can continue to maintain this strong lead over regions outside the U.S., then in another ten years, their share in the global stock market may well cross the 60% threshold smoothly.
Therefore, for any investor with a global perspective—no matter where you are in the world—you should deeply recognize a fundamental logic: the U.S. dollar system remains the core anchor for global capital in allocating assets. When building your personal wealth portfolio, allocating a sufficient proportion of dollar-denominated assets is an essential step. And among all dollar assets, the long-term annualized return that the U.S. stock market can provide not only significantly exceeds that of U.S. Treasuries, but also outperforms the stock markets of any other country or region worldwide.
As an ordinary investor who keeps moving forward in the market, I have long adhered to a simple investment maxim: cherish life, and go all-in on U.S. stocks!
I would be very grateful if you could support me by subscribing to my membership service, so I can continue creating more content for you. After becoming a member, you can also receive frequent updates of in-depth member-only articles on that platform. Once you are a member, you can also message me privately at any time to discuss any questions you may have about investing and personal finance. The subscription link is: https://x.com/SVScholar/creator-subscriptions/subscribe
If you’d like to further and comprehensively understand my practical experience and deep thinking in the field of investing and personal finance, feel free to search for me on Amazon or Google Play Books. You can look up my Chinese-language financial book, 《财富捷径》, or my English book, 《The Shortcut to Wealth: Your Simple Roadmap to Financial Independence》. Additionally, on my pinned social media post, there is also a direct route to purchase the books.
#FinancialFreedom #WealthFreedom #Finance #Investing #U.S.Stocks #UnitedStates #Stocks #Funds #Investment #Nasdaq #VGT #AI #SMH
When discussing asset allocation, I’ve often shared with everyone a piece of data from the past: as the world’s largest stock market by size, the U.S. stock market’s market capitalization accounts for roughly 40% of the global total. However, a recent report released by Goldman Sachs on the distribution structure of global investable financial assets has prompted me to re-examine this belief.
Goldman Sachs’ report covers global financial assets totaling as much as $260 trillion, spanning multiple areas including equities, bonds, gold, private equity, real estate, and crypto assets. It is particularly worth noting that the statistics strictly exclude owner-occupied residential housing and include only financial assets with liquidity.
In terms of the share of each major asset category, the structure of the global investment market shows clear characteristics. Equities make up 49%—nearly half. Next are bonds at 37%, and more than half of that bond portion consists of government bonds. Although gold surged to unprecedented popularity in 2025, its overall weight is still only 6%. The remaining portion is made up of 5% private markets and 2% real estate. As for those highly talked-about cryptocurrencies, they still play a marginal role in overall scale, accounting for just 1%. It is not hard to see that the traditional securities market composed of equities and bonds remains the absolute mainstay—together, they account for a combined 86%.
If we view the same set of data from a regional distribution perspective, Goldman Sachs also provides a detailed breakdown. In the global bond market, U.S. bonds lead with a 43% share; Europe and Asia account for 29% and 21%, respectively. Meanwhile, in the stock market, the report shows that the market capitalization share of U.S. equities is a staggering 64%. This figure far exceeds Europe’s 11%, Japan’s 5%, and the combined remainder of Asia at 12%.
This 64% figure differs greatly from the 40% I have always kept in mind. So what is the true share of U.S. equities in the global market today?
To find out, I went back to data from ten years ago. At the end of 2015, the total market capitalization of global equities was about $67 trillion, of which the U.S. stock market’s overall size was $25 trillion. Doing the calculation, the U.S. share at that time was exactly 37%—indeed very close to the 40% impression I had.
However, as time moved forward to October 2025, the total size of the U.S. stock market had expanded to $67 trillion. That means that over the past decade, even without counting dividend returns, looking only at the expansion of equity market capitalization, the U.S. stock market achieved an astonishing growth of 168%, equivalent to an average annual growth rate of 10.3%. Over the same period, the total size of the global stock market also rose to about $130 trillion, with an overall increase of roughly 94% over the decade.
With this simple calculation, it becomes clear that the current actual share of U.S. equities in the global stock market has increased to 52%, up 15% compared to ten years ago. This truly reminds me that it is time to comprehensively update my investment mindset.
Why has the global share of U.S. equities risen so rapidly in a short time? The answer is actually very straightforward: the quality of U.S. equities is simply excellent, and the pace of expansion has been extremely fast. If we exclude the U.S. stock market, over this decade, the combined total market capitalization of equities in other countries and regions around the world only grew slowly from $42 trillion to $63 trillion. Their overall growth rate was 50%, translating to an average annual growth rate of only 4.2%.
A 4.2% average annual growth speed is vastly different from U.S. equities’ 10.3% pace. If in the future U.S. equities can continue to maintain this strong lead over regions outside the U.S., then in another ten years, their share in the global stock market may well cross the 60% threshold smoothly.
Therefore, for any investor with a global perspective—no matter where you are in the world—you should deeply recognize a fundamental logic: the U.S. dollar system remains the core anchor for global capital in allocating assets. When building your personal wealth portfolio, allocating a sufficient proportion of dollar-denominated assets is an essential step. And among all dollar assets, the long-term annualized return that the U.S. stock market can provide not only significantly exceeds that of U.S. Treasuries, but also outperforms the stock markets of any other country or region worldwide.
As an ordinary investor who keeps moving forward in the market, I have long adhered to a simple investment maxim: cherish life, and go all-in on U.S. stocks!
I would be very grateful if you could support me by subscribing to my membership service, so I can continue creating more content for you. After becoming a member, you can also receive frequent updates of in-depth member-only articles on that platform. Once you are a member, you can also message me privately at any time to discuss any questions you may have about investing and personal finance. The subscription link is: https://x.com/SVScholar/creator-subscriptions/subscribe
If you’d like to further and comprehensively understand my practical experience and deep thinking in the field of investing and personal finance, feel free to search for me on Amazon or Google Play Books. You can look up my Chinese-language financial book, 《财富捷径》, or my English book, 《The Shortcut to Wealth: Your Simple Roadmap to Financial Independence》. Additionally, on my pinned social media post, there is also a direct route to purchase the books.
#FinancialFreedom #WealthFreedom #Finance #Investing #U.S.Stocks #UnitedStates #Stocks #Funds #Investment #Nasdaq #VGT #AI #SMH
10
·
--
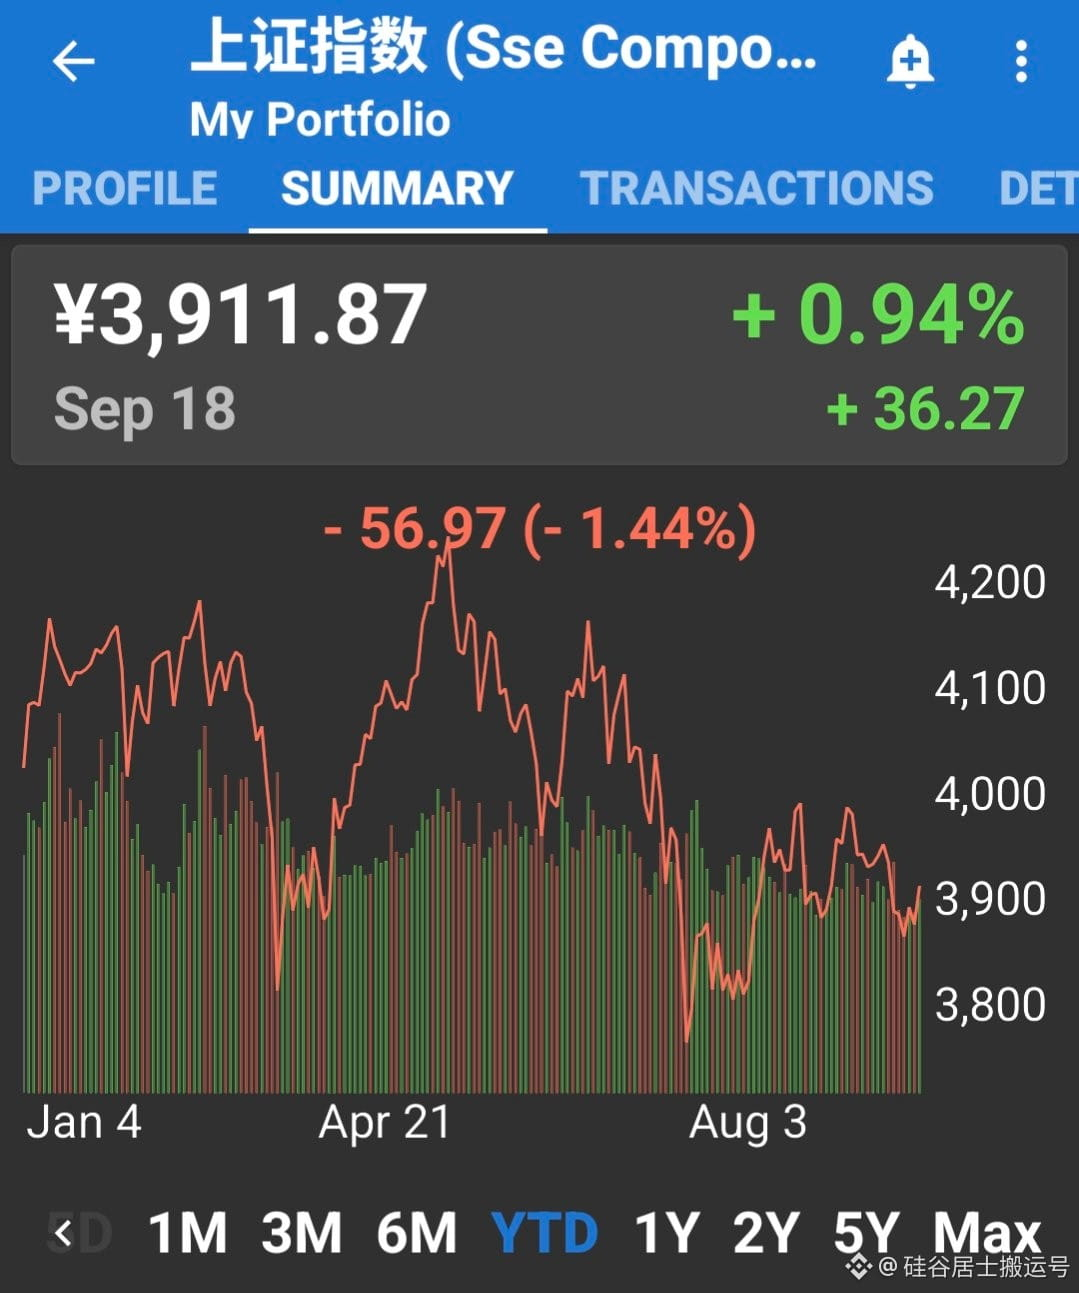
In 2026, while global stock markets were generally immersed in a fervent atmosphere of sustained gains, the SSE Composite Index once again charted a distinctly independent course. According to data records, from the start of this year through September 18, the index not only failed to follow the broader market upward, but instead declined cumulatively by 1.4%.
In 2026, while global stock markets were generally immersed in a fervent atmosphere of sustained gains, the SSE Composite Index once again charted a distinctly independent course. According to data records, from the start of this year through September 18, the index not only failed to follow the broader market upward, but instead declined cumulatively by 1.4%.
17
·
--
According to information Musk revealed today, the engagement and activity level on the X platform has already reached the highest record in history. As for me personally, I’ve only truly started to read and post carefully on this platform for a little more than a year, so I haven’t had the chance to witness the heyday of Twitter. I wonder what you experienced long-time users think—does this resonate with your real feelings? Please share your thoughts. Do you think Musk’s remarks are objective facts, or is it just self-promotion?
According to information Musk revealed today, the engagement and activity level on the X platform has already reached the highest record in history. As for me personally, I’ve only truly started to read and post carefully on this platform for a little more than a year, so I haven’t had the chance to witness the heyday of Twitter. I wonder what you experienced long-time users think—does this resonate with your real feelings? Please share your thoughts. Do you think Musk’s remarks are objective facts, or is it just self-promotion?
47
·
--
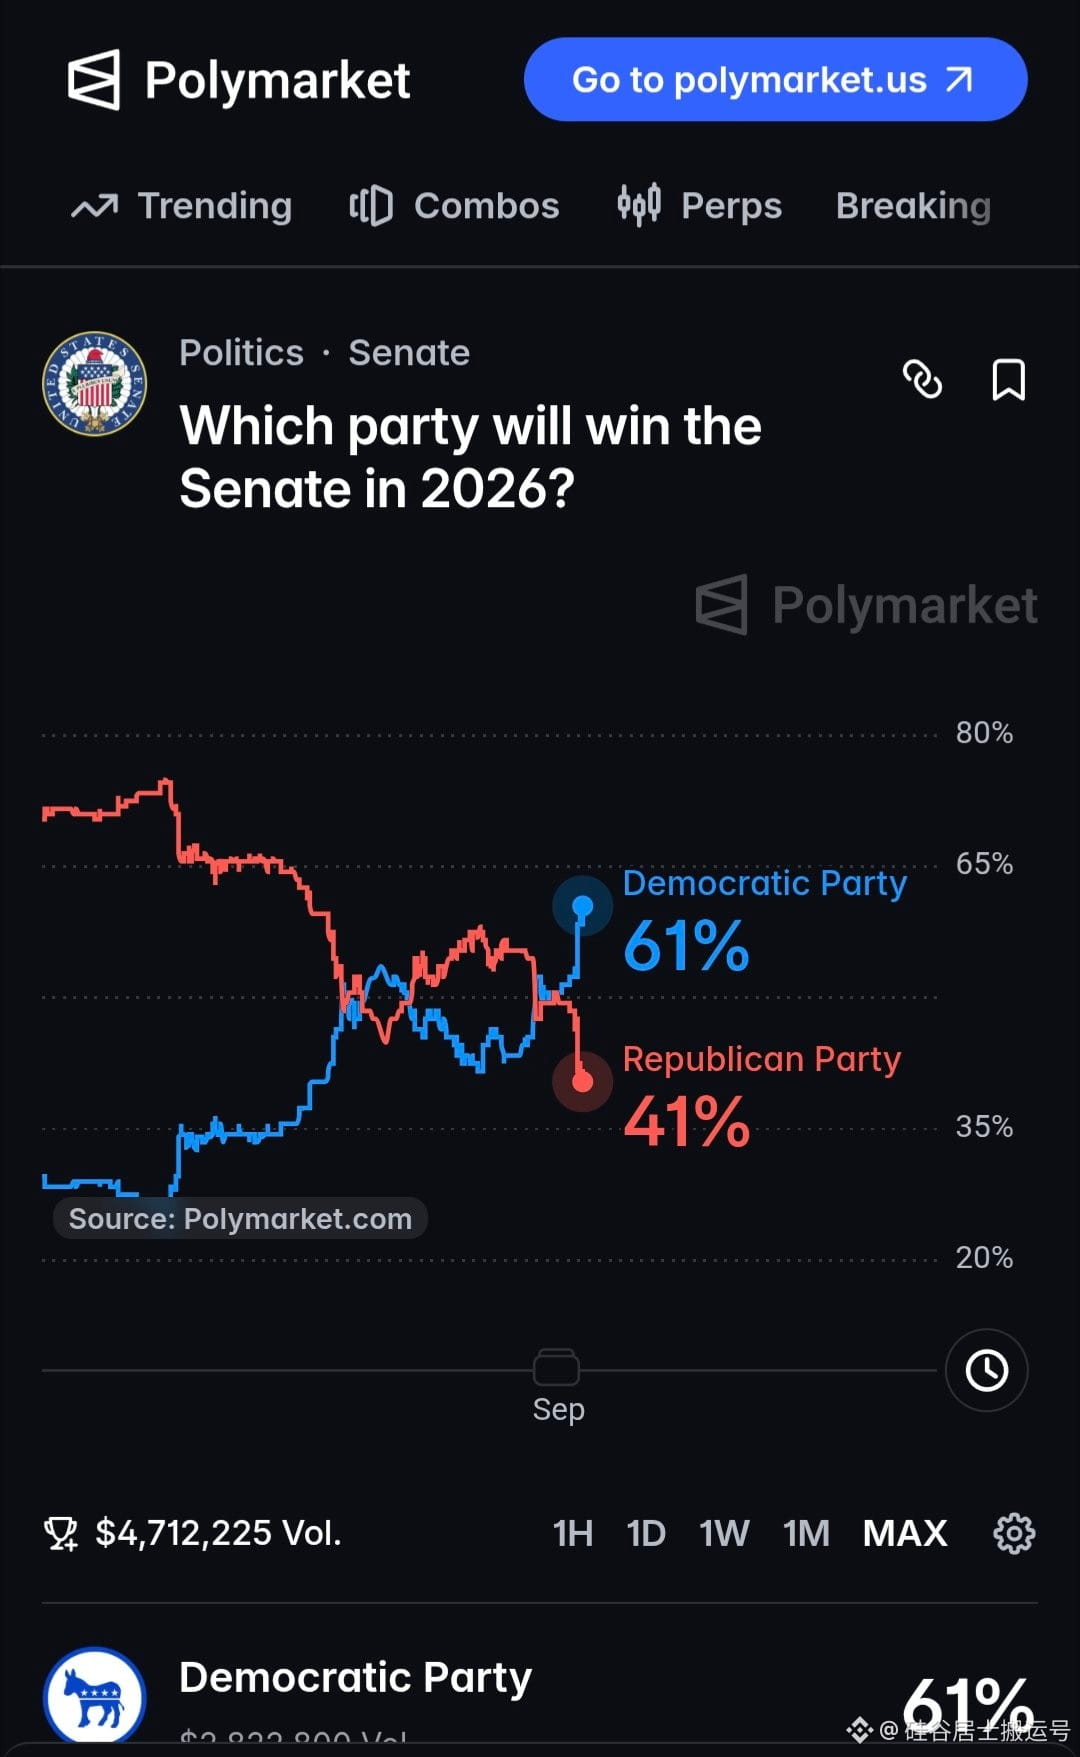
Based on betting activity on the Polymarket platform, forecasters estimate the Democrats have a 61% chance of winning control of the Senate. Their odds of taking the House are even higher, at 90%. If these predictions ultimately come true, the Democrats will achieve full control of both chambers of Congress.
Based on betting activity on the Polymarket platform, forecasters estimate the Democrats have a 61% chance of winning control of the Senate. Their odds of taking the House are even higher, at 90%. If these predictions ultimately come true, the Democrats will achieve full control of both chambers of Congress.
46
·
--
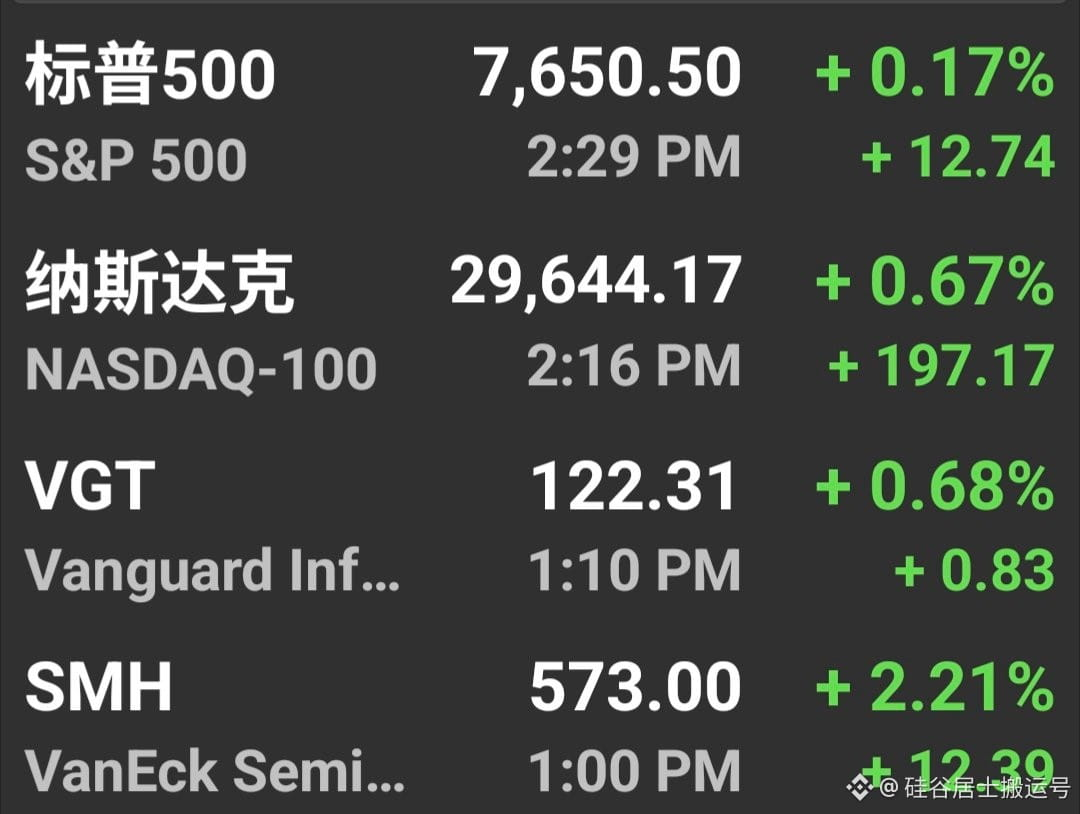
In the market on September 18, the technology and semiconductor sectors still maintained a strong upward momentum, continuing to play a leading role in the market. Meanwhile, the market volatility triggered by the previously much-discussed remarks that “AI should slow down” now appears to have largely dissipated, and the shocks it caused have been fully calmed and repaired.
In the market on September 18, the technology and semiconductor sectors still maintained a strong upward momentum, continuing to play a leading role in the market. Meanwhile, the market volatility triggered by the previously much-discussed remarks that “AI should slow down” now appears to have largely dissipated, and the shocks it caused have been fully calmed and repaired.
88
·
--
For people who are passionate about investing and personal finance, collecting and analyzing data is an essential basic skill. Personally, I highly endorse using data to explain problems. The reason is simple: data represents objective facts, and facts are always unique. In contrast, other forms of expression often mix in personal subjective views. Different people can have different opinions, which easily leads to disagreements.
Because I have lived in the United States for a long time, I usually enjoy researching various indicators related to American household net worth and income. Today, I’ll take a lighthearted look with you at several sets of specific numbers in this area.
First, let’s examine an overview of the population, GDP per capita, and household income. Currently, the total population of the United States is 340 million, consisting of 130 million households. On average, each household has a size of 2.6 people.
Entering 2024, the U.S. GDP per capita reaches $90,000, which is about 600,000 yuan in RMB. For personal disposable income, Americans’ per-capita figure is roughly $70,000, or about 460,000 yuan in RMB. This data accounts for 76% of GDP per capita.
From the perspective of households, the average annual household income in the United States is around $120,000, which translates to approximately 850,000 yuan in RMB. It’s worth noting that American-Chinese households have a higher average income—$150,000, or 1.06 million yuan in RMB.
Next, let’s organize the specific distribution of net worth among U.S. households.
Overall, the average U.S. household net worth is as high as $1.06 million, or about 7.55 million yuan in RMB. However, the median—more reflective of typical conditions, i.e., the 50th percentile—is only $190,000, or about 1.35 million yuan in RMB.
Looking further up, for the top 25% of households, their net worth reaches $650,000, or about 4.6 million yuan in RMB. For the top 10%, net worth is $1.9 million, or about 13.5 million yuan in RMB. The top 5% have net worth of $4 million, or about 28 million yuan in RMB. To enter the top 1% bracket, one needs net worth of $13 million, or about 92 million yuan in RMB. At the very top of the wealth pyramid, the top 0.5% of households have $20 million, or about 143 million yuan in RMB. The top 0.2% have net worth of $30 million, or about 214 million yuan in RMB. As for the top 0.1% of households, their net worth is even higher—$60 million, or about 428 million yuan in RMB.
Taken together, this means that nationwide, about half of all U.S. households—around 65 million—still have total net worth of less than $200,000. Meanwhile, roughly 1.3 million households have net worth above the $13 million threshold, and about 130,000 households have net worth exceeding $60 million.
If you want to look up data across more dimensions, you can directly use the relevant calculators online. If you need to precisely understand the percentage distribution of household net worth for a specific age group, there are also dedicated calculators available for you to consult.
At this point, I sincerely hope you’ll subscribe to my membership service, as this will support my daily writing. I will periodically update members with exclusive high-quality articles. Also, as a member, you can reach out to me anytime through private messages to discuss any questions you may have about investing and personal finance. The subscription link is: https://x.com/SVScholar/creator-subscriptions/subscribe
In addition, if you’re interested in more of my experience and unique insights in the field of investing and personal finance, feel free to check out Amazon or Google Play Books. You can search for my Chinese-language personal finance book, 《Wealth Shortcut》, or look for the English version, 《The Shortcut to Wealth: Your Simple Roadmap to Financial Independence》. In my pinned social media post, you can also find direct purchase links for these two books.
#FinancialIndependence #WealthFreedom #FinanceAndInvesting #PersonalFinance #USStocks #UnitedStates #Stocks #Funds #Investing #Nasdaq #VGT #AI #SMH
For people who are passionate about investing and personal finance, collecting and analyzing data is an essential basic skill. Personally, I highly endorse using data to explain problems. The reason is simple: data represents objective facts, and facts are always unique. In contrast, other forms of expression often mix in personal subjective views. Different people can have different opinions, which easily leads to disagreements.
Because I have lived in the United States for a long time, I usually enjoy researching various indicators related to American household net worth and income. Today, I’ll take a lighthearted look with you at several sets of specific numbers in this area.
First, let’s examine an overview of the population, GDP per capita, and household income. Currently, the total population of the United States is 340 million, consisting of 130 million households. On average, each household has a size of 2.6 people.
Entering 2024, the U.S. GDP per capita reaches $90,000, which is about 600,000 yuan in RMB. For personal disposable income, Americans’ per-capita figure is roughly $70,000, or about 460,000 yuan in RMB. This data accounts for 76% of GDP per capita.
From the perspective of households, the average annual household income in the United States is around $120,000, which translates to approximately 850,000 yuan in RMB. It’s worth noting that American-Chinese households have a higher average income—$150,000, or 1.06 million yuan in RMB.
Next, let’s organize the specific distribution of net worth among U.S. households.
Overall, the average U.S. household net worth is as high as $1.06 million, or about 7.55 million yuan in RMB. However, the median—more reflective of typical conditions, i.e., the 50th percentile—is only $190,000, or about 1.35 million yuan in RMB.
Looking further up, for the top 25% of households, their net worth reaches $650,000, or about 4.6 million yuan in RMB. For the top 10%, net worth is $1.9 million, or about 13.5 million yuan in RMB. The top 5% have net worth of $4 million, or about 28 million yuan in RMB. To enter the top 1% bracket, one needs net worth of $13 million, or about 92 million yuan in RMB. At the very top of the wealth pyramid, the top 0.5% of households have $20 million, or about 143 million yuan in RMB. The top 0.2% have net worth of $30 million, or about 214 million yuan in RMB. As for the top 0.1% of households, their net worth is even higher—$60 million, or about 428 million yuan in RMB.
Taken together, this means that nationwide, about half of all U.S. households—around 65 million—still have total net worth of less than $200,000. Meanwhile, roughly 1.3 million households have net worth above the $13 million threshold, and about 130,000 households have net worth exceeding $60 million.
If you want to look up data across more dimensions, you can directly use the relevant calculators online. If you need to precisely understand the percentage distribution of household net worth for a specific age group, there are also dedicated calculators available for you to consult.
At this point, I sincerely hope you’ll subscribe to my membership service, as this will support my daily writing. I will periodically update members with exclusive high-quality articles. Also, as a member, you can reach out to me anytime through private messages to discuss any questions you may have about investing and personal finance. The subscription link is: https://x.com/SVScholar/creator-subscriptions/subscribe
In addition, if you’re interested in more of my experience and unique insights in the field of investing and personal finance, feel free to check out Amazon or Google Play Books. You can search for my Chinese-language personal finance book, 《Wealth Shortcut》, or look for the English version, 《The Shortcut to Wealth: Your Simple Roadmap to Financial Independence》. In my pinned social media post, you can also find direct purchase links for these two books.
#FinancialIndependence #WealthFreedom #FinanceAndInvesting #PersonalFinance #USStocks #UnitedStates #Stocks #Funds #Investing #Nasdaq #VGT #AI #SMH
Because I have lived in the United States for a long time, I usually enjoy researching various indicators related to American household net worth and income. Today, I’ll take a lighthearted look with you at several sets of specific numbers in this area.
First, let’s examine an overview of the population, GDP per capita, and household income. Currently, the total population of the United States is 340 million, consisting of 130 million households. On average, each household has a size of 2.6 people.
Entering 2024, the U.S. GDP per capita reaches $90,000, which is about 600,000 yuan in RMB. For personal disposable income, Americans’ per-capita figure is roughly $70,000, or about 460,000 yuan in RMB. This data accounts for 76% of GDP per capita.
From the perspective of households, the average annual household income in the United States is around $120,000, which translates to approximately 850,000 yuan in RMB. It’s worth noting that American-Chinese households have a higher average income—$150,000, or 1.06 million yuan in RMB.
Next, let’s organize the specific distribution of net worth among U.S. households.
Overall, the average U.S. household net worth is as high as $1.06 million, or about 7.55 million yuan in RMB. However, the median—more reflective of typical conditions, i.e., the 50th percentile—is only $190,000, or about 1.35 million yuan in RMB.
Looking further up, for the top 25% of households, their net worth reaches $650,000, or about 4.6 million yuan in RMB. For the top 10%, net worth is $1.9 million, or about 13.5 million yuan in RMB. The top 5% have net worth of $4 million, or about 28 million yuan in RMB. To enter the top 1% bracket, one needs net worth of $13 million, or about 92 million yuan in RMB. At the very top of the wealth pyramid, the top 0.5% of households have $20 million, or about 143 million yuan in RMB. The top 0.2% have net worth of $30 million, or about 214 million yuan in RMB. As for the top 0.1% of households, their net worth is even higher—$60 million, or about 428 million yuan in RMB.
Taken together, this means that nationwide, about half of all U.S. households—around 65 million—still have total net worth of less than $200,000. Meanwhile, roughly 1.3 million households have net worth above the $13 million threshold, and about 130,000 households have net worth exceeding $60 million.
If you want to look up data across more dimensions, you can directly use the relevant calculators online. If you need to precisely understand the percentage distribution of household net worth for a specific age group, there are also dedicated calculators available for you to consult.
At this point, I sincerely hope you’ll subscribe to my membership service, as this will support my daily writing. I will periodically update members with exclusive high-quality articles. Also, as a member, you can reach out to me anytime through private messages to discuss any questions you may have about investing and personal finance. The subscription link is: https://x.com/SVScholar/creator-subscriptions/subscribe
In addition, if you’re interested in more of my experience and unique insights in the field of investing and personal finance, feel free to check out Amazon or Google Play Books. You can search for my Chinese-language personal finance book, 《Wealth Shortcut》, or look for the English version, 《The Shortcut to Wealth: Your Simple Roadmap to Financial Independence》. In my pinned social media post, you can also find direct purchase links for these two books.
#FinancialIndependence #WealthFreedom #FinanceAndInvesting #PersonalFinance #USStocks #UnitedStates #Stocks #Funds #Investing #Nasdaq #VGT #AI #SMH
VGTETF+0.78%
SMHB+0.81%
53
·
--
The pace of the evolution of autonomous driving vehicles is truly astonishing. At present, Waymo has successfully deployed around 4,000 self-driving cars. Worth noting is that Waymo, together with Google, is jointly under its parent company Alphabet, whose stock tickers are GOOG and GOOGL.
Just today, I had the extraordinary experience of riding in a Waymo autonomous taxi for the first time in my life. Throughout the entire trip, the outstanding driving capabilities demonstrated by AI left me utterly amazed. After personally experiencing the allure of this cutting-edge technology, I was greatly encouraged—reinforcing my steadfast confidence in continuing to invest in semiconductor and technology sector funds in the future.
#smh #ai
The pace of the evolution of autonomous driving vehicles is truly astonishing. At present, Waymo has successfully deployed around 4,000 self-driving cars. Worth noting is that Waymo, together with Google, is jointly under its parent company Alphabet, whose stock tickers are GOOG and GOOGL.
Just today, I had the extraordinary experience of riding in a Waymo autonomous taxi for the first time in my life. Throughout the entire trip, the outstanding driving capabilities demonstrated by AI left me utterly amazed. After personally experiencing the allure of this cutting-edge technology, I was greatly encouraged—reinforcing my steadfast confidence in continuing to invest in semiconductor and technology sector funds in the future.
#smh #ai
Just today, I had the extraordinary experience of riding in a Waymo autonomous taxi for the first time in my life. Throughout the entire trip, the outstanding driving capabilities demonstrated by AI left me utterly amazed. After personally experiencing the allure of this cutting-edge technology, I was greatly encouraged—reinforcing my steadfast confidence in continuing to invest in semiconductor and technology sector funds in the future.
#smh #ai

143
·
--
The progress in the field of autonomous driving can be said to be advancing day by day. Just today, I experienced for the first time in my life a ride in a Waymo self-driving taxi. Throughout the entire trip, the exceptional driving skills demonstrated by the artificial intelligence system left me deeply震撼.
From an industry deployment perspective, Waymo has currently successfully rolled out roughly 4,000 self-driving cars onto public roads. By the way, for your reference, the company’s parent is in the Alphabet Group, just like Google. Its stock trading tickers in the capital markets are GOOG and GOOGL, respectively.
This extraordinary transportation experience not only allowed me to witness the appeal of cutting-edge technology, but also greatly strengthened my determination to continue investing in funds related to semiconductors and the technology sector.
#smh #ai
The progress in the field of autonomous driving can be said to be advancing day by day. Just today, I experienced for the first time in my life a ride in a Waymo self-driving taxi. Throughout the entire trip, the exceptional driving skills demonstrated by the artificial intelligence system left me deeply震撼.
From an industry deployment perspective, Waymo has currently successfully rolled out roughly 4,000 self-driving cars onto public roads. By the way, for your reference, the company’s parent is in the Alphabet Group, just like Google. Its stock trading tickers in the capital markets are GOOG and GOOGL, respectively.
This extraordinary transportation experience not only allowed me to witness the appeal of cutting-edge technology, but also greatly strengthened my determination to continue investing in funds related to semiconductors and the technology sector.
#smh #ai
From an industry deployment perspective, Waymo has currently successfully rolled out roughly 4,000 self-driving cars onto public roads. By the way, for your reference, the company’s parent is in the Alphabet Group, just like Google. Its stock trading tickers in the capital markets are GOOG and GOOGL, respectively.
This extraordinary transportation experience not only allowed me to witness the appeal of cutting-edge technology, but also greatly strengthened my determination to continue investing in funds related to semiconductors and the technology sector.
#smh #ai
103
·
--
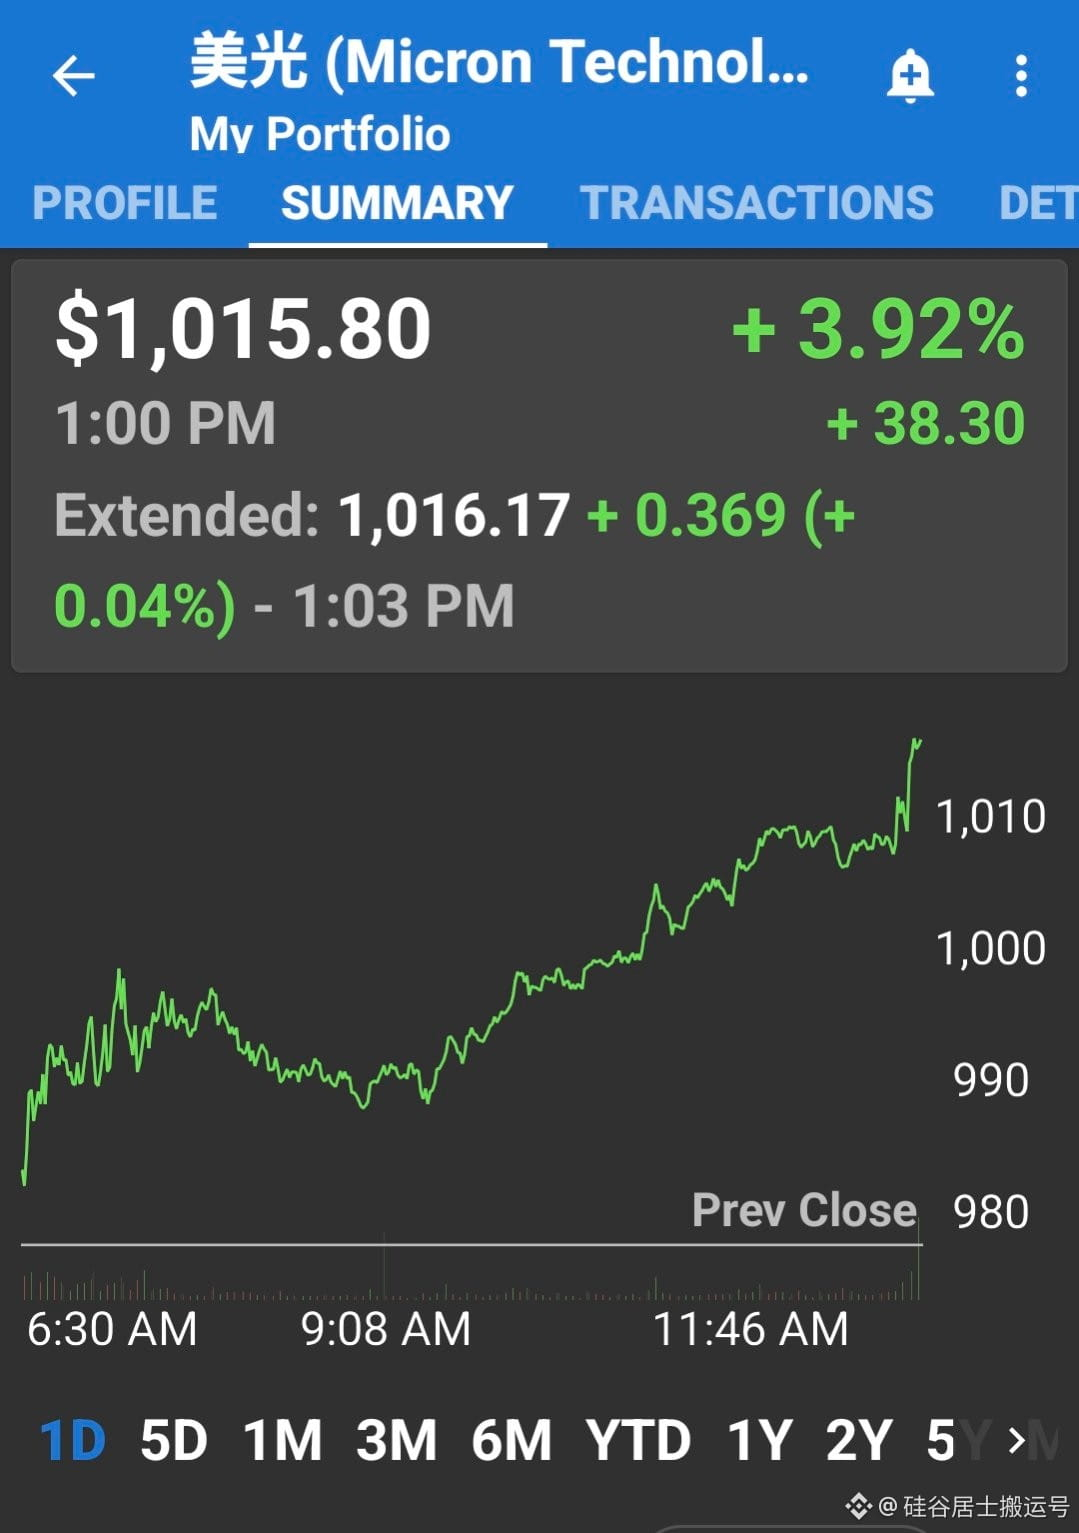
On September 18, in capital market trading, Micron Technology, a leading company in the storage industry, reached a remarkable milestone as its stock price successfully crossed the important $1,000 mark once again.
On September 18, in capital market trading, Micron Technology, a leading company in the storage industry, reached a remarkable milestone as its stock price successfully crossed the important $1,000 mark once again.
34
·
--
Are interpersonal relationships really equal to money?
Just today, a classmate of my nephew expressed a bit of regret in one of my relatives and friends’ personal finance groups. He felt it was truly a pity, saying that he joined this exchange circle too late to have fully taken advantage of the big rally in the U.S. stock market over the past few years.
Seeing his disappointment, I jokingly teased him with a lighthearted comment: does this mean that social connections themselves are a kind of wealth?
Are interpersonal relationships really equal to money?
Just today, a classmate of my nephew expressed a bit of regret in one of my relatives and friends’ personal finance groups. He felt it was truly a pity, saying that he joined this exchange circle too late to have fully taken advantage of the big rally in the U.S. stock market over the past few years.
Seeing his disappointment, I jokingly teased him with a lighthearted comment: does this mean that social connections themselves are a kind of wealth?
Just today, a classmate of my nephew expressed a bit of regret in one of my relatives and friends’ personal finance groups. He felt it was truly a pity, saying that he joined this exchange circle too late to have fully taken advantage of the big rally in the U.S. stock market over the past few years.
Seeing his disappointment, I jokingly teased him with a lighthearted comment: does this mean that social connections themselves are a kind of wealth?
39
·
--
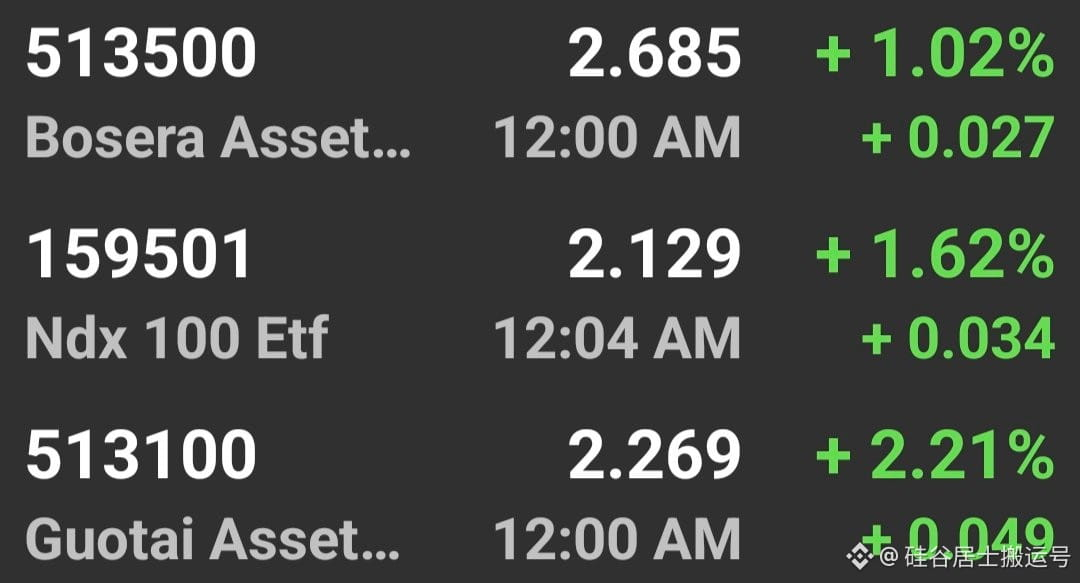
The recent upward trend of QDII US stock funds has been nothing short of remarkable. Even in the face of relatively high premiums, investors’ enthusiasm for allocating to US stocks has not diminished, and capital continues to flow in at a large scale.
In fact, the index funds I recommended to everyone earlier have now reached premium levels that are almost at the highest points in history. Specifically, looking at the latest figures: Bosera S&P 513500 has a latest premium rate of 10.3%, Jimian Nasdaq 159501 has a premium rate of 14.3%, and Cathay Nasdaq 513100 has a premium rate of 14.7%.
Looking back to since last year, some friends have kept themselves on standby due to concerns about premiums being too high, and have been reluctant to enter the market for a long time. But now that we look again, their hesitation has truly caused them to miss out on extremely generous wealth benefits.
Based on this, my long-standing advice to everyone has not changed: you can completely ignore the impact of the premium factor—let go of your worries and buy decisively with your eyes closed.
The recent upward trend of QDII US stock funds has been nothing short of remarkable. Even in the face of relatively high premiums, investors’ enthusiasm for allocating to US stocks has not diminished, and capital continues to flow in at a large scale.
In fact, the index funds I recommended to everyone earlier have now reached premium levels that are almost at the highest points in history. Specifically, looking at the latest figures: Bosera S&P 513500 has a latest premium rate of 10.3%, Jimian Nasdaq 159501 has a premium rate of 14.3%, and Cathay Nasdaq 513100 has a premium rate of 14.7%.
Looking back to since last year, some friends have kept themselves on standby due to concerns about premiums being too high, and have been reluctant to enter the market for a long time. But now that we look again, their hesitation has truly caused them to miss out on extremely generous wealth benefits.
Based on this, my long-standing advice to everyone has not changed: you can completely ignore the impact of the premium factor—let go of your worries and buy decisively with your eyes closed.
In fact, the index funds I recommended to everyone earlier have now reached premium levels that are almost at the highest points in history. Specifically, looking at the latest figures: Bosera S&P 513500 has a latest premium rate of 10.3%, Jimian Nasdaq 159501 has a premium rate of 14.3%, and Cathay Nasdaq 513100 has a premium rate of 14.7%.
Looking back to since last year, some friends have kept themselves on standby due to concerns about premiums being too high, and have been reluctant to enter the market for a long time. But now that we look again, their hesitation has truly caused them to miss out on extremely generous wealth benefits.
Based on this, my long-standing advice to everyone has not changed: you can completely ignore the impact of the premium factor—let go of your worries and buy decisively with your eyes closed.
10
·
--
The recent overall performance of QDII funds in the US market has been exceptionally strong, with particularly impressive gains. Even in the face of relatively high premium costs, investors are still highly enthusiastic and continue to pour large amounts of capital into US stocks.
If you look at the index-based funds I selected and introduced for you earlier, you’ll find that their current premium indicators have risen to near historical peaks. From the specific product data: Bosera S&P 513500 has a current premium level of 10.3%; Harvest Nasdaq 159501 has a premium rate of 14.3%; and Cathay Pacific Nasdaq 513100 has an even higher premium rate of as much as 14.7%.
Looking back at the market cycle since last year, many friends have been hesitating and waiting on the sidelines because they were overly worried about this high-premium phenomenon, and therefore kept putting off taking action to buy. However, the reality is that this excessive caution has caused them to miss out on extremely generous investment returns.
Given the current market conditions, my core viewpoint I want to share with you has not changed. That is: I recommend you simply ignore the current premium factor, relax, and decisively and consistently carry out buying operations.
The recent overall performance of QDII funds in the US market has been exceptionally strong, with particularly impressive gains. Even in the face of relatively high premium costs, investors are still highly enthusiastic and continue to pour large amounts of capital into US stocks.
If you look at the index-based funds I selected and introduced for you earlier, you’ll find that their current premium indicators have risen to near historical peaks. From the specific product data: Bosera S&P 513500 has a current premium level of 10.3%; Harvest Nasdaq 159501 has a premium rate of 14.3%; and Cathay Pacific Nasdaq 513100 has an even higher premium rate of as much as 14.7%.
Looking back at the market cycle since last year, many friends have been hesitating and waiting on the sidelines because they were overly worried about this high-premium phenomenon, and therefore kept putting off taking action to buy. However, the reality is that this excessive caution has caused them to miss out on extremely generous investment returns.
Given the current market conditions, my core viewpoint I want to share with you has not changed. That is: I recommend you simply ignore the current premium factor, relax, and decisively and consistently carry out buying operations.
If you look at the index-based funds I selected and introduced for you earlier, you’ll find that their current premium indicators have risen to near historical peaks. From the specific product data: Bosera S&P 513500 has a current premium level of 10.3%; Harvest Nasdaq 159501 has a premium rate of 14.3%; and Cathay Pacific Nasdaq 513100 has an even higher premium rate of as much as 14.7%.
Looking back at the market cycle since last year, many friends have been hesitating and waiting on the sidelines because they were overly worried about this high-premium phenomenon, and therefore kept putting off taking action to buy. However, the reality is that this excessive caution has caused them to miss out on extremely generous investment returns.
Given the current market conditions, my core viewpoint I want to share with you has not changed. That is: I recommend you simply ignore the current premium factor, relax, and decisively and consistently carry out buying operations.
12
·
--
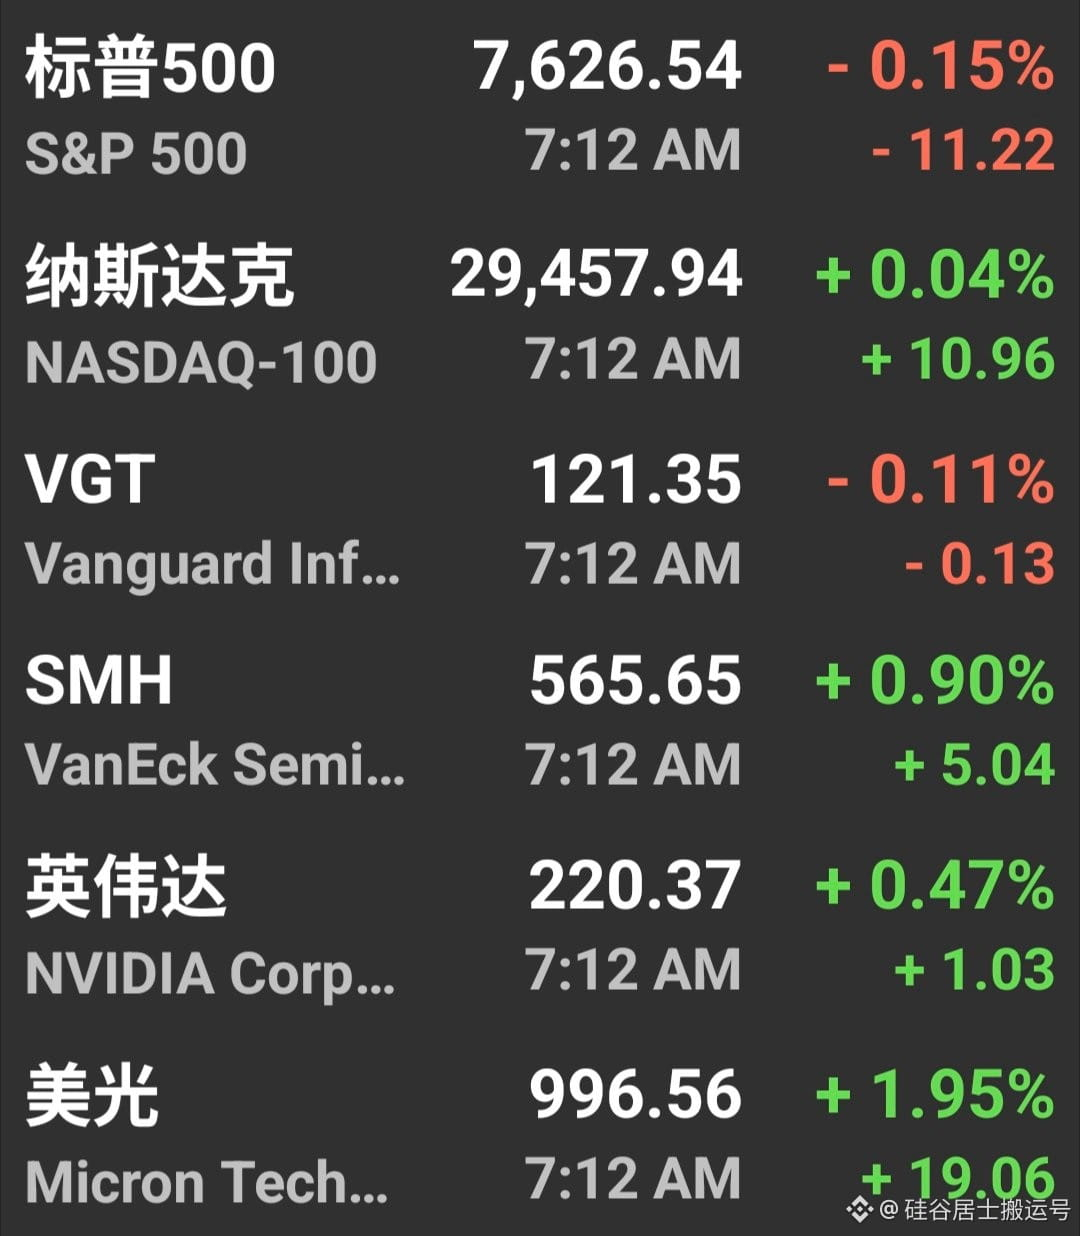
Reflecting on the morning trading session of September 18, the semiconductor sector stood out in the market, showcasing striking performance and leading the pack. At the same time, the storage segment also moved very strongly, successfully rebounding sharply for the second consecutive trading day.
#smh #半导体
Reflecting on the morning trading session of September 18, the semiconductor sector stood out in the market, showcasing striking performance and leading the pack. At the same time, the storage segment also moved very strongly, successfully rebounding sharply for the second consecutive trading day.
#smh #半导体
#smh #半导体
192
·
--
Investment Circle Titan Officially Hands Over the Reins
Recently, Buffett announced a major decision to the public: he has officially stepped down as Chairman of Berkshire Hathaway. Born in 1930, this investment legend is now 96 years old.
According to the company’s arrangements, his son Howard will take over the business in full, serving as the new Chairman, and the appointment takes effect immediately.
With his retirement, an era that belonged to him has come to an end. As for how long it will be before another “stock god” with such immense influence emerges again, that remains an unknown.
Investment Circle Titan Officially Hands Over the Reins
Recently, Buffett announced a major decision to the public: he has officially stepped down as Chairman of Berkshire Hathaway. Born in 1930, this investment legend is now 96 years old.
According to the company’s arrangements, his son Howard will take over the business in full, serving as the new Chairman, and the appointment takes effect immediately.
With his retirement, an era that belonged to him has come to an end. As for how long it will be before another “stock god” with such immense influence emerges again, that remains an unknown.
Recently, Buffett announced a major decision to the public: he has officially stepped down as Chairman of Berkshire Hathaway. Born in 1930, this investment legend is now 96 years old.
According to the company’s arrangements, his son Howard will take over the business in full, serving as the new Chairman, and the appointment takes effect immediately.
With his retirement, an era that belonged to him has come to an end. As for how long it will be before another “stock god” with such immense influence emerges again, that remains an unknown.
2
3.4k
·
--
The Investment Legend of One Era Waves Goodbye
Recently, Berkshire Hathaway has undergone a major personnel change. Buffett has officially announced to the public that he will no longer serve as the company’s chairman. This decision takes effect immediately upon announcement, and the role is now assumed by his son, Howard.
Born in 1930, this titan of the investment world is now 96 years old. As he steps away from the stage, people can’t help but reflect on how long the future will have to wait before we can witness the birth of another “Sage of Stocks” with an equally powerful appeal and influence.
The Investment Legend of One Era Waves Goodbye
Recently, Berkshire Hathaway has undergone a major personnel change. Buffett has officially announced to the public that he will no longer serve as the company’s chairman. This decision takes effect immediately upon announcement, and the role is now assumed by his son, Howard.
Born in 1930, this titan of the investment world is now 96 years old. As he steps away from the stage, people can’t help but reflect on how long the future will have to wait before we can witness the birth of another “Sage of Stocks” with an equally powerful appeal and influence.
Recently, Berkshire Hathaway has undergone a major personnel change. Buffett has officially announced to the public that he will no longer serve as the company’s chairman. This decision takes effect immediately upon announcement, and the role is now assumed by his son, Howard.
Born in 1930, this titan of the investment world is now 96 years old. As he steps away from the stage, people can’t help but reflect on how long the future will have to wait before we can witness the birth of another “Sage of Stocks” with an equally powerful appeal and influence.
291
·
--
A Splendid Turnaround by a Legendary Figure in the Investment World
Recently, Berkshire Hathaway has undergone a major personnel change. Warren Buffett, who is beloved by many, has officially announced his decision to step down as the company’s Chairman. According to the latest arrangement, his son, Howard, will take over this responsibility and serve as the new Chairman of the next term, with the appointment to take effect immediately.
Looking back on the long years of this investment master, born in 1830, Buffett is now 96 years old this year.
With his retirement, an era has come to a close. People can’t help but wonder and wait, silently wondering how long the investment world must wait before another “stock god” with such extraordinary influence emerges again.
A Splendid Turnaround by a Legendary Figure in the Investment World
Recently, Berkshire Hathaway has undergone a major personnel change. Warren Buffett, who is beloved by many, has officially announced his decision to step down as the company’s Chairman. According to the latest arrangement, his son, Howard, will take over this responsibility and serve as the new Chairman of the next term, with the appointment to take effect immediately.
Looking back on the long years of this investment master, born in 1830, Buffett is now 96 years old this year.
With his retirement, an era has come to a close. People can’t help but wonder and wait, silently wondering how long the investment world must wait before another “stock god” with such extraordinary influence emerges again.
Recently, Berkshire Hathaway has undergone a major personnel change. Warren Buffett, who is beloved by many, has officially announced his decision to step down as the company’s Chairman. According to the latest arrangement, his son, Howard, will take over this responsibility and serve as the new Chairman of the next term, with the appointment to take effect immediately.
Looking back on the long years of this investment master, born in 1830, Buffett is now 96 years old this year.
With his retirement, an era has come to a close. People can’t help but wonder and wait, silently wondering how long the investment world must wait before another “stock god” with such extraordinary influence emerges again.
657
·
--
Friends, do you know which U.S. states have the highest concentration of Chinese residents?
Based on the latest data released by the U.S. Census Bureau on ethnic surveys and community studies, if we include multiracial and mixed-heritage groups in a full-scope count, the total population of Chinese people across the United States has already exceeded 5.5 million.
Of note, nearly half of Chinese residents nationwide choose to live in California and New York. Among them, California ranks first by a wide margin. It is the most densely populated area for Chinese communities, with a population size even more than twice that of New York.
To give you a more intuitive understanding, here is a rundown of the top ten states with the largest Chinese populations across the U.S. (rankings marked with #), along with the local disposable income per capita:
Rank #1 is California, with a total of 1.97 million Chinese residents and a per-capita income of 77,000.
Rank #2 is New York State, with a total of 770,000 Chinese residents and a per-capita income of 74,000.
Rank #3 is Texas, with a total of 300,000 Chinese residents and a per-capita income of 65,000.
Rank #4 is Washington State, with a total of 230,000 Chinese residents and a per-capita income of 80,000.
Rank #5 is Hawaii, with a total of 220,000 Chinese residents and a per-capita income of 67,000.
Rank #6 is Massachusetts, with a total of 210,000 Chinese residents and a per-capita income of 82,000.
Rank #7 is New Jersey, with a total of 190,000 Chinese residents and a per-capita income of 76,000.
Rank #8 is Illinois, with a total of 160,000 Chinese residents and a per-capita income of 68,000.
Rank #9 is Pennsylvania, with a total of 130,000 Chinese residents and a per-capita income of 65,000.
Rank #10 is Florida, with a total of 120,000 Chinese residents and a per-capita income of 67,000.
Overall, among these ten states with the largest Chinese populations, the top three in terms of disposable income per capita are Massachusetts, Washington State, and California.
Friends, do you know which U.S. states have the highest concentration of Chinese residents?
Based on the latest data released by the U.S. Census Bureau on ethnic surveys and community studies, if we include multiracial and mixed-heritage groups in a full-scope count, the total population of Chinese people across the United States has already exceeded 5.5 million.
Of note, nearly half of Chinese residents nationwide choose to live in California and New York. Among them, California ranks first by a wide margin. It is the most densely populated area for Chinese communities, with a population size even more than twice that of New York.
To give you a more intuitive understanding, here is a rundown of the top ten states with the largest Chinese populations across the U.S. (rankings marked with #), along with the local disposable income per capita:
Rank #1 is California, with a total of 1.97 million Chinese residents and a per-capita income of 77,000.
Rank #2 is New York State, with a total of 770,000 Chinese residents and a per-capita income of 74,000.
Rank #3 is Texas, with a total of 300,000 Chinese residents and a per-capita income of 65,000.
Rank #4 is Washington State, with a total of 230,000 Chinese residents and a per-capita income of 80,000.
Rank #5 is Hawaii, with a total of 220,000 Chinese residents and a per-capita income of 67,000.
Rank #6 is Massachusetts, with a total of 210,000 Chinese residents and a per-capita income of 82,000.
Rank #7 is New Jersey, with a total of 190,000 Chinese residents and a per-capita income of 76,000.
Rank #8 is Illinois, with a total of 160,000 Chinese residents and a per-capita income of 68,000.
Rank #9 is Pennsylvania, with a total of 130,000 Chinese residents and a per-capita income of 65,000.
Rank #10 is Florida, with a total of 120,000 Chinese residents and a per-capita income of 67,000.
Overall, among these ten states with the largest Chinese populations, the top three in terms of disposable income per capita are Massachusetts, Washington State, and California.
Based on the latest data released by the U.S. Census Bureau on ethnic surveys and community studies, if we include multiracial and mixed-heritage groups in a full-scope count, the total population of Chinese people across the United States has already exceeded 5.5 million.
Of note, nearly half of Chinese residents nationwide choose to live in California and New York. Among them, California ranks first by a wide margin. It is the most densely populated area for Chinese communities, with a population size even more than twice that of New York.
To give you a more intuitive understanding, here is a rundown of the top ten states with the largest Chinese populations across the U.S. (rankings marked with #), along with the local disposable income per capita:
Rank #1 is California, with a total of 1.97 million Chinese residents and a per-capita income of 77,000.
Rank #2 is New York State, with a total of 770,000 Chinese residents and a per-capita income of 74,000.
Rank #3 is Texas, with a total of 300,000 Chinese residents and a per-capita income of 65,000.
Rank #4 is Washington State, with a total of 230,000 Chinese residents and a per-capita income of 80,000.
Rank #5 is Hawaii, with a total of 220,000 Chinese residents and a per-capita income of 67,000.
Rank #6 is Massachusetts, with a total of 210,000 Chinese residents and a per-capita income of 82,000.
Rank #7 is New Jersey, with a total of 190,000 Chinese residents and a per-capita income of 76,000.
Rank #8 is Illinois, with a total of 160,000 Chinese residents and a per-capita income of 68,000.
Rank #9 is Pennsylvania, with a total of 130,000 Chinese residents and a per-capita income of 65,000.
Rank #10 is Florida, with a total of 120,000 Chinese residents and a per-capita income of 67,000.
Overall, among these ten states with the largest Chinese populations, the top three in terms of disposable income per capita are Massachusetts, Washington State, and California.
1
108
·
--
Are you curious where the Chinese diaspora across the United States is mainly concentrated?
The U.S. Census Bureau has recently released the latest ethnic census and community survey data. The results show that if people with mixed-race and multi-ethnic backgrounds are included in the full-scope calculation, the total Chinese population in the U.S. has already exceeded 5.5 million.
In terms of regional distribution, nearly half of Chinese people choose to settle in California and New York. California ranks first nationwide in terms of the number of Chinese residents, and its total Chinese population is more than twice that of New York.
Below, we have compiled the top ten U.S. states by Chinese population, along with the corresponding per-capita disposable income levels in each (unit: USD):
# State Name Population Income Level
1 California 1.97 million 77,000
2 New York 0.77 million 74,000
3 Texas 0.30 million 65,000
4 Washington 0.23 million 80,000
5 Hawaii 0.22 million 67,000
6 Massachusetts 0.21 million 82,000
7 New Jersey 0.19 million 76,000
8 Illinois 0.16 million 68,000
9 Pennsylvania 0.13 million 65,000
10 Florida 0.12 million 67,000
Notably, among the ten states with the highest number of Chinese residents, the top three in per-capita disposable income are Massachusetts, Washington, and California.
Are you curious where the Chinese diaspora across the United States is mainly concentrated?
The U.S. Census Bureau has recently released the latest ethnic census and community survey data. The results show that if people with mixed-race and multi-ethnic backgrounds are included in the full-scope calculation, the total Chinese population in the U.S. has already exceeded 5.5 million.
In terms of regional distribution, nearly half of Chinese people choose to settle in California and New York. California ranks first nationwide in terms of the number of Chinese residents, and its total Chinese population is more than twice that of New York.
Below, we have compiled the top ten U.S. states by Chinese population, along with the corresponding per-capita disposable income levels in each (unit: USD):
# State Name Population Income Level
1 California 1.97 million 77,000
2 New York 0.77 million 74,000
3 Texas 0.30 million 65,000
4 Washington 0.23 million 80,000
5 Hawaii 0.22 million 67,000
6 Massachusetts 0.21 million 82,000
7 New Jersey 0.19 million 76,000
8 Illinois 0.16 million 68,000
9 Pennsylvania 0.13 million 65,000
10 Florida 0.12 million 67,000
Notably, among the ten states with the highest number of Chinese residents, the top three in per-capita disposable income are Massachusetts, Washington, and California.
The U.S. Census Bureau has recently released the latest ethnic census and community survey data. The results show that if people with mixed-race and multi-ethnic backgrounds are included in the full-scope calculation, the total Chinese population in the U.S. has already exceeded 5.5 million.
In terms of regional distribution, nearly half of Chinese people choose to settle in California and New York. California ranks first nationwide in terms of the number of Chinese residents, and its total Chinese population is more than twice that of New York.
Below, we have compiled the top ten U.S. states by Chinese population, along with the corresponding per-capita disposable income levels in each (unit: USD):
# State Name Population Income Level
1 California 1.97 million 77,000
2 New York 0.77 million 74,000
3 Texas 0.30 million 65,000
4 Washington 0.23 million 80,000
5 Hawaii 0.22 million 67,000
6 Massachusetts 0.21 million 82,000
7 New Jersey 0.19 million 76,000
8 Illinois 0.16 million 68,000
9 Pennsylvania 0.13 million 65,000
10 Florida 0.12 million 67,000
Notably, among the ten states with the highest number of Chinese residents, the top three in per-capita disposable income are Massachusetts, Washington, and California.
279
·
--
An interesting bit of industry history is that Intel, now famous for processors, originally established its footing in the market by producing memory chips. With a strategic shift, Intel later chose to focus on the CPU segment,退出 the DRAM memory market, and sold its flash memory business to South Korea’s SK hynix.
Times have changed, and the very market Intel once abandoned is now facing major upheavals. Recently, Intel CEO Pat Gelsinger candidly acknowledged that current prices for memory chips have surged by 5 to 7 times. He also warned that this supply shortage situation could become even more severe by 2027.
The frantic rise in prices is putting enormous cost pressure on consumer electronics endpoints. At present, in some low-end phones and laptops, storage chips alone account for as much as about 75% of the total cost—an unprecedented figure in the history of the industry.
Concerns about this shortage trend are not limited to Intel. Other companies, such as Micron and SK hynix, have also made closely aligned predictions, openly stating that by 2027 we may witness one of the most severe memory-chip supply shortages in human history.
#SMH #semiconductor #ai
An interesting bit of industry history is that Intel, now famous for processors, originally established its footing in the market by producing memory chips. With a strategic shift, Intel later chose to focus on the CPU segment,退出 the DRAM memory market, and sold its flash memory business to South Korea’s SK hynix.
Times have changed, and the very market Intel once abandoned is now facing major upheavals. Recently, Intel CEO Pat Gelsinger candidly acknowledged that current prices for memory chips have surged by 5 to 7 times. He also warned that this supply shortage situation could become even more severe by 2027.
The frantic rise in prices is putting enormous cost pressure on consumer electronics endpoints. At present, in some low-end phones and laptops, storage chips alone account for as much as about 75% of the total cost—an unprecedented figure in the history of the industry.
Concerns about this shortage trend are not limited to Intel. Other companies, such as Micron and SK hynix, have also made closely aligned predictions, openly stating that by 2027 we may witness one of the most severe memory-chip supply shortages in human history.
#SMH #semiconductor #ai
Times have changed, and the very market Intel once abandoned is now facing major upheavals. Recently, Intel CEO Pat Gelsinger candidly acknowledged that current prices for memory chips have surged by 5 to 7 times. He also warned that this supply shortage situation could become even more severe by 2027.
The frantic rise in prices is putting enormous cost pressure on consumer electronics endpoints. At present, in some low-end phones and laptops, storage chips alone account for as much as about 75% of the total cost—an unprecedented figure in the history of the industry.
Concerns about this shortage trend are not limited to Intel. Other companies, such as Micron and SK hynix, have also made closely aligned predictions, openly stating that by 2027 we may witness one of the most severe memory-chip supply shortages in human history.
#SMH #semiconductor #ai
1
4
681
Log in to explore more content
Join global crypto users on Binance Square
⚡️ Get latest and useful information about crypto.
💬 Trusted by the world’s largest crypto exchange.
👍 Discover real insights from verified creators.
Email / Phone number
Trending Topics
BOJRaisesRatesTo31YearHigh
32,959 views
771 Discussing
Bitcoin Reclaims the Spotlight as Macro Pressure Fails to Break Crypto Demand
Fatima_Tariq
·10 Likes
·5.5k views
BuffettStepsDownAsBerkshireChairman
11,317 views
320 Discussing
XRPExchangeReservesHitSevenYearLow
15,495 views
334 Discussing