
asiftahsin
2.4k Posts

asiftahsin
Report
Block User
Share Crypto Related Market Analysis, Share Crypto Related knowledge for my follower(brother and Sister) contact: @theatplayz
41 Following
460 Followers
1.4K+ Liked
Posts
All
Quotes
Live
·
--
Article
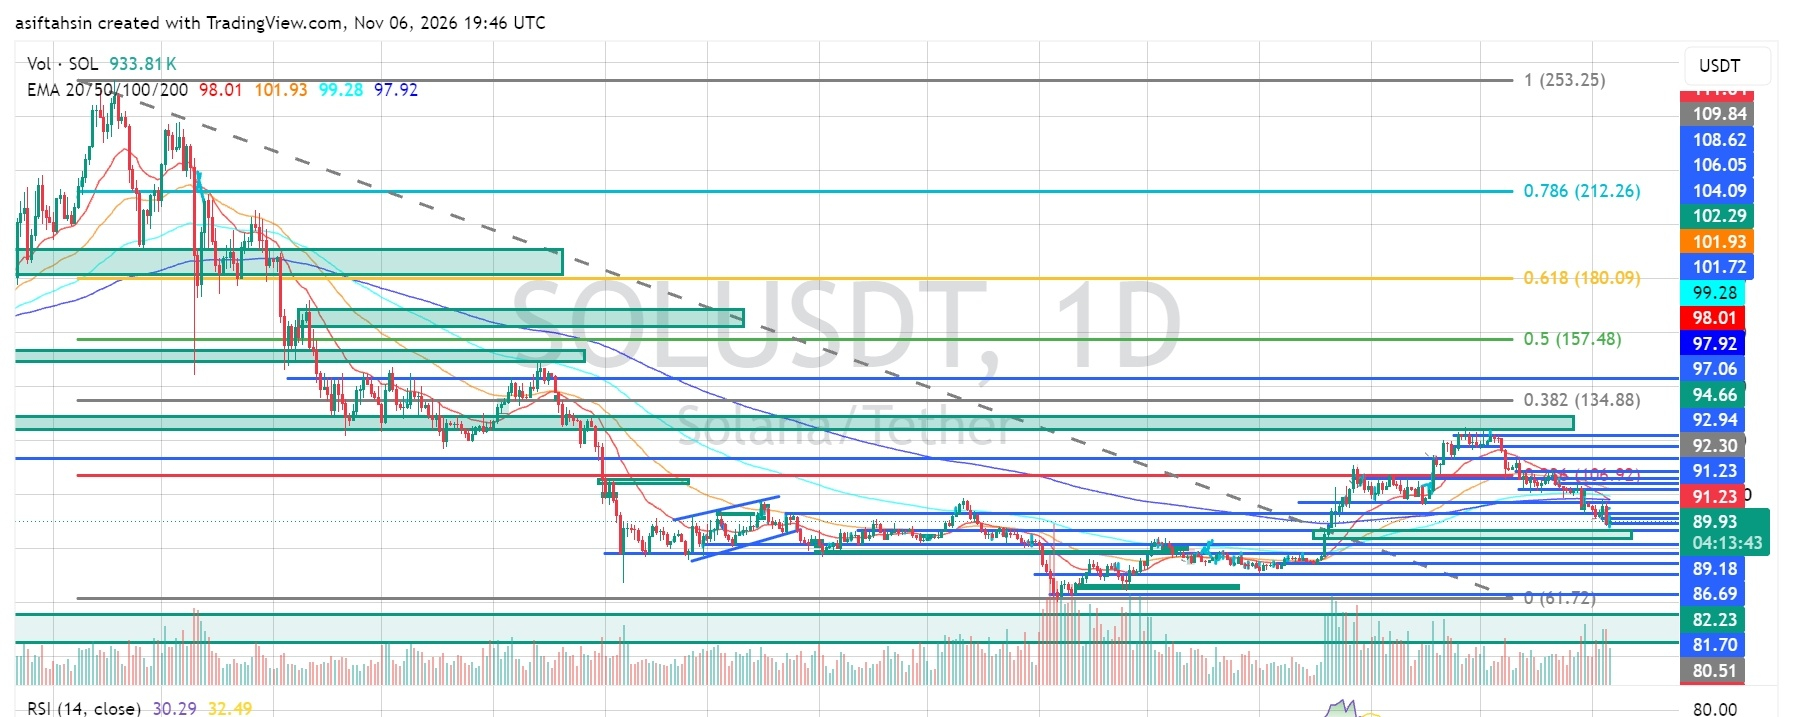
SOL Technical Outlook: Solana Tests Key Support Near $90 as Selling Pressure IntensifiesSolana is showing renewed weakness on the daily chart after being rejected from the $92–$94 resistance region. Price has moved below the short-term moving averages, while RSI is approaching oversold territory.
The key question now is whether buyers can defend the $89–$86 support zone or whether SOL will extend its correction.
1. EMA Structure
Current EMA levels:
- EMA 20: $98.01
- EMA 50: $101.93
- EMA 100: $99.28
- EMA 200: $97.92
SOL is trading below all four major EMAs. This indicates that sellers currently have control of the daily structure.
The $97.92–$99.28 region is the first major EMA resistance zone. A recovery above this area would be an early sign of improving momentum.
2. Fibonacci Levels
Key Fibonacci retracement levels:
- 0: $61.72
- 0.236: $106.92
- 0.382: $134.88
- 0.5: $157.48
- 0.618: $180.09
- 0.786: $212.26
- 1.0: $253.25
SOL is trading well below the 0.236 Fibonacci level at $106.92, highlighting the weakness of the broader recovery.
3. Current Market Structure
After rallying from the June–July lows, SOL advanced strongly during August and September. However, the recent rejection near $92–$94 has weakened the structure.
The chart shows lower highs and renewed selling pressure. Price is now testing an important support region around $89–$90.
A sustained move below this zone could expose lower liquidity levels.
4. RSI Momentum
- RSI: 30.29
- RSI Moving Average: 32.49
RSI is close to the oversold threshold of 30, indicating strong selling pressure.
A short-term relief bounce is possible if buyers defend support. However, oversold conditions alone do not confirm a reversal. RSI needs to recover above 40 to show improving momentum.
5. Key Support Levels
The important downside levels to monitor are:
- $89.18 – Immediate support
- $86.69 – Next support zone
- $82.23 – Major support
- $81.70 – Additional downside level
- $80.51 – Lower support region
A daily close below $89.18 could increase the probability of a move toward $86.69. Losing that level may expose the $82.23–$81.70 region.
6. Key Resistance Levels
For a recovery, SOL needs to reclaim:
- $91.23 – Immediate resistance
- $92.30 – Short-term resistance
- $92.94 – Local supply zone
- $94.66 – Important resistance
- $97.06 – Key recovery level
- $97.92–$99.28 – Major EMA resistance
- $101.93–$102.29 – Higher resistance zone
A sustained daily recovery above $94.66 would improve the short-term outlook. Reclaiming the EMA cluster around $98–$102 would provide stronger evidence of a bullish recovery.
7. Bullish Scenario
If SOL holds the $89.18 support area and buyers regain control, a relief bounce toward $91.23–$92.94 could develop.
A breakout above $94.66 may open the way toward $97.06 and the $98–$102 EMA resistance cluster.
However, buyers need to reclaim these levels with convincing momentum before a stronger trend reversal can be considered.
8. Bearish Scenario
If SOL fails to hold $89.18 and continues trading below immediate support, the next downside areas are $86.69 and $82.23.
A breakdown below $81.70 would expose the lower $80.51 region and could increase selling pressure.
Final Outlook
Solana remains under pressure on the daily timeframe. Trading below all four major EMAs, combined with RSI near 30, suggests that sellers currently maintain the advantage.
The $89.18–$86.69 region is important for buyers to defend. A recovery above $94.66 would be the first meaningful improvement, while reclaiming $98–$102 would strengthen the bullish case.
For now, SOL is at a critical support area. Watch the daily candle close and momentum before assuming a reversal.
Short-term outlook: Bearish below $94.66.
$SOL
{future}(SOLUSDT)
#JobsReportRaisesHikeOdds
SOL Technical Outlook: Solana Tests Key Support Near $90 as Selling Pressure Intensifies
Solana is showing renewed weakness on the daily chart after being rejected from the $92–$94 resistance region. Price has moved below the short-term moving averages, while RSI is approaching oversold territory.
The key question now is whether buyers can defend the $89–$86 support zone or whether SOL will extend its correction.
1. EMA Structure
Current EMA levels:
- EMA 20: $98.01
- EMA 50: $101.93
- EMA 100: $99.28
- EMA 200: $97.92
SOL is trading below all four major EMAs. This indicates that sellers currently have control of the daily structure.
The $97.92–$99.28 region is the first major EMA resistance zone. A recovery above this area would be an early sign of improving momentum.
2. Fibonacci Levels
Key Fibonacci retracement levels:
- 0: $61.72
- 0.236: $106.92
- 0.382: $134.88
- 0.5: $157.48
- 0.618: $180.09
- 0.786: $212.26
- 1.0: $253.25
SOL is trading well below the 0.236 Fibonacci level at $106.92, highlighting the weakness of the broader recovery.
3. Current Market Structure
After rallying from the June–July lows, SOL advanced strongly during August and September. However, the recent rejection near $92–$94 has weakened the structure.
The chart shows lower highs and renewed selling pressure. Price is now testing an important support region around $89–$90.
A sustained move below this zone could expose lower liquidity levels.
4. RSI Momentum
- RSI: 30.29
- RSI Moving Average: 32.49
RSI is close to the oversold threshold of 30, indicating strong selling pressure.
A short-term relief bounce is possible if buyers defend support. However, oversold conditions alone do not confirm a reversal. RSI needs to recover above 40 to show improving momentum.
5. Key Support Levels
The important downside levels to monitor are:
- $89.18 – Immediate support
- $86.69 – Next support zone
- $82.23 – Major support
- $81.70 – Additional downside level
- $80.51 – Lower support region
A daily close below $89.18 could increase the probability of a move toward $86.69. Losing that level may expose the $82.23–$81.70 region.
6. Key Resistance Levels
For a recovery, SOL needs to reclaim:
- $91.23 – Immediate resistance
- $92.30 – Short-term resistance
- $92.94 – Local supply zone
- $94.66 – Important resistance
- $97.06 – Key recovery level
- $97.92–$99.28 – Major EMA resistance
- $101.93–$102.29 – Higher resistance zone
A sustained daily recovery above $94.66 would improve the short-term outlook. Reclaiming the EMA cluster around $98–$102 would provide stronger evidence of a bullish recovery.
7. Bullish Scenario
If SOL holds the $89.18 support area and buyers regain control, a relief bounce toward $91.23–$92.94 could develop.
A breakout above $94.66 may open the way toward $97.06 and the $98–$102 EMA resistance cluster.
However, buyers need to reclaim these levels with convincing momentum before a stronger trend reversal can be considered.
8. Bearish Scenario
If SOL fails to hold $89.18 and continues trading below immediate support, the next downside areas are $86.69 and $82.23.
A breakdown below $81.70 would expose the lower $80.51 region and could increase selling pressure.
Final Outlook
Solana remains under pressure on the daily timeframe. Trading below all four major EMAs, combined with RSI near 30, suggests that sellers currently maintain the advantage.
The $89.18–$86.69 region is important for buyers to defend. A recovery above $94.66 would be the first meaningful improvement, while reclaiming $98–$102 would strengthen the bullish case.
For now, SOL is at a critical support area. Watch the daily candle close and momentum before assuming a reversal.
Short-term outlook: Bearish below $94.66.
$SOL
#JobsReportRaisesHikeOdds
The key question now is whether buyers can defend the $89–$86 support zone or whether SOL will extend its correction.
1. EMA Structure
Current EMA levels:
- EMA 20: $98.01
- EMA 50: $101.93
- EMA 100: $99.28
- EMA 200: $97.92
SOL is trading below all four major EMAs. This indicates that sellers currently have control of the daily structure.
The $97.92–$99.28 region is the first major EMA resistance zone. A recovery above this area would be an early sign of improving momentum.
2. Fibonacci Levels
Key Fibonacci retracement levels:
- 0: $61.72
- 0.236: $106.92
- 0.382: $134.88
- 0.5: $157.48
- 0.618: $180.09
- 0.786: $212.26
- 1.0: $253.25
SOL is trading well below the 0.236 Fibonacci level at $106.92, highlighting the weakness of the broader recovery.
3. Current Market Structure
After rallying from the June–July lows, SOL advanced strongly during August and September. However, the recent rejection near $92–$94 has weakened the structure.
The chart shows lower highs and renewed selling pressure. Price is now testing an important support region around $89–$90.
A sustained move below this zone could expose lower liquidity levels.
4. RSI Momentum
- RSI: 30.29
- RSI Moving Average: 32.49
RSI is close to the oversold threshold of 30, indicating strong selling pressure.
A short-term relief bounce is possible if buyers defend support. However, oversold conditions alone do not confirm a reversal. RSI needs to recover above 40 to show improving momentum.
5. Key Support Levels
The important downside levels to monitor are:
- $89.18 – Immediate support
- $86.69 – Next support zone
- $82.23 – Major support
- $81.70 – Additional downside level
- $80.51 – Lower support region
A daily close below $89.18 could increase the probability of a move toward $86.69. Losing that level may expose the $82.23–$81.70 region.
6. Key Resistance Levels
For a recovery, SOL needs to reclaim:
- $91.23 – Immediate resistance
- $92.30 – Short-term resistance
- $92.94 – Local supply zone
- $94.66 – Important resistance
- $97.06 – Key recovery level
- $97.92–$99.28 – Major EMA resistance
- $101.93–$102.29 – Higher resistance zone
A sustained daily recovery above $94.66 would improve the short-term outlook. Reclaiming the EMA cluster around $98–$102 would provide stronger evidence of a bullish recovery.
7. Bullish Scenario
If SOL holds the $89.18 support area and buyers regain control, a relief bounce toward $91.23–$92.94 could develop.
A breakout above $94.66 may open the way toward $97.06 and the $98–$102 EMA resistance cluster.
However, buyers need to reclaim these levels with convincing momentum before a stronger trend reversal can be considered.
8. Bearish Scenario
If SOL fails to hold $89.18 and continues trading below immediate support, the next downside areas are $86.69 and $82.23.
A breakdown below $81.70 would expose the lower $80.51 region and could increase selling pressure.
Final Outlook
Solana remains under pressure on the daily timeframe. Trading below all four major EMAs, combined with RSI near 30, suggests that sellers currently maintain the advantage.
The $89.18–$86.69 region is important for buyers to defend. A recovery above $94.66 would be the first meaningful improvement, while reclaiming $98–$102 would strengthen the bullish case.
For now, SOL is at a critical support area. Watch the daily candle close and momentum before assuming a reversal.
Short-term outlook: Bearish below $94.66.
$SOL
#JobsReportRaisesHikeOdds
204
·
--
Article
BTC Technical Outlook: Bitcoin Breaks Lower Toward $75.6K as Bearish Momentum StrengthensBTC Technical Outlook: Bitcoin Breaks Lower Toward $75.6K as Bearish Momentum Strengthens
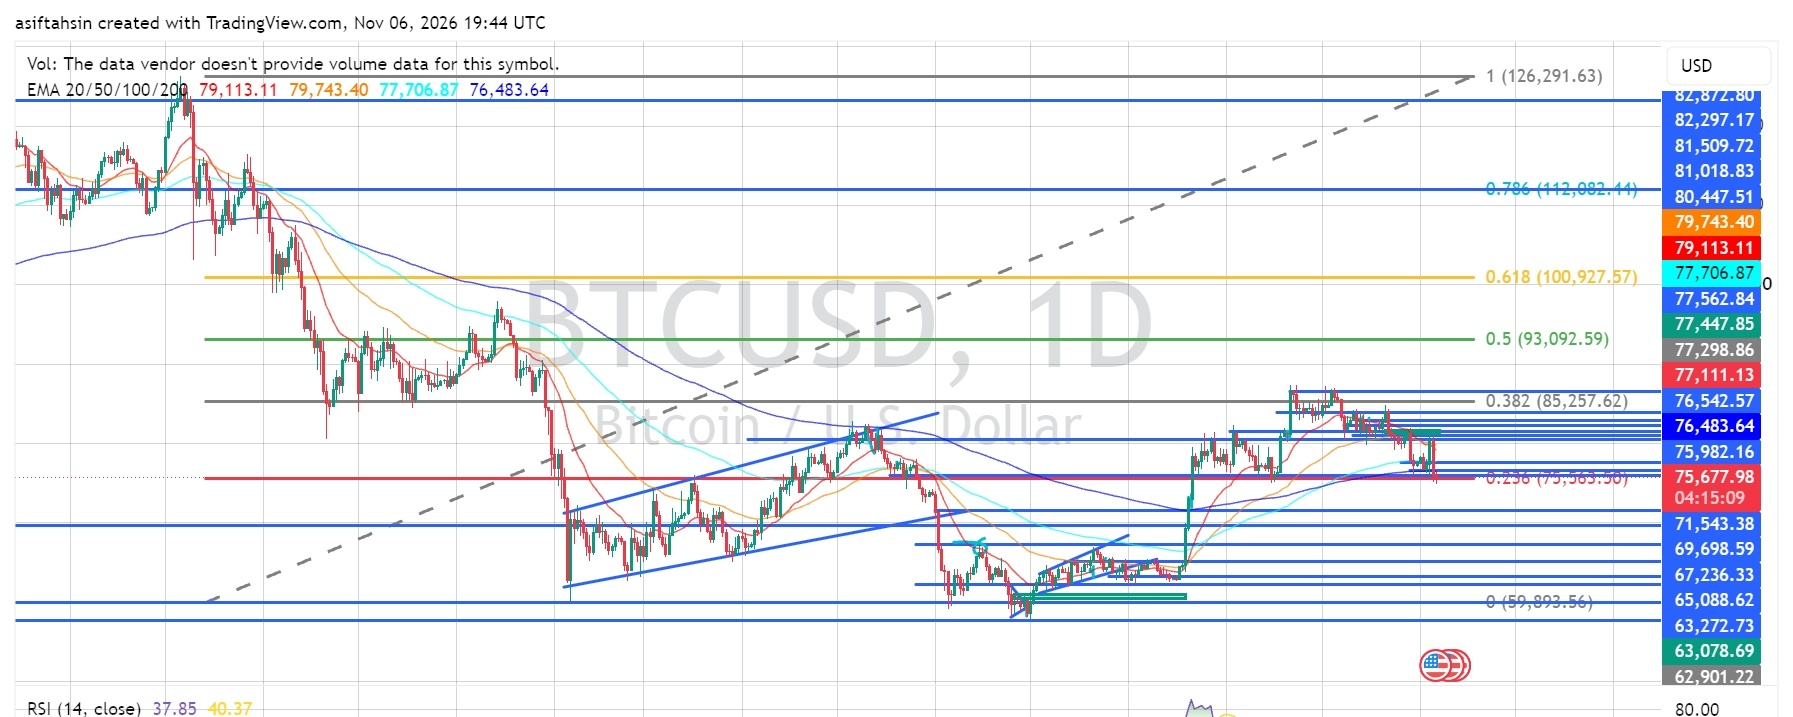
Bitcoin is facing renewed selling pressure after failing to maintain its position above the $76K–$77K support region. BTC is currently trading around $75,678, with the daily chart showing a bearish structure as price moves below all four major EMAs.
The key question now is whether buyers can defend the $75,563 Fibonacci support or whether another breakdown will expose lower demand zones.
1. EMA Structure
Current EMA levels:
- EMA 20: $79,113.51
- EMA 50: $79,743.56
- EMA 100: $77,706.95
- EMA 200: $76,483.68
BTC is trading below all four EMAs, indicating significant weakness in the daily structure.
The $76,483–$79,743 region represents a major resistance area. Buyers need to reclaim these moving averages to improve the recovery outlook.
2. Fibonacci Levels
Key Fibonacci levels from the chart:
- 0.236: $75,563.50
- 0.382: $85,257.62
- 0.5: $93,092.59
- 0.618: $100,927.57
- 0.786: $112,082.44
BTC is currently testing the 0.236 Fibonacci retracement level around $75,563. A sustained hold could provide an opportunity for a relief bounce, while a confirmed breakdown may accelerate selling pressure.
3. Bullish Scenario
For buyers to regain control, BTC needs to defend the current support and reclaim nearby resistance levels.
- First resistance: $76,483
- Next resistance: $77,111–$77,707
- Major resistance: $79,113–$79,743
- Momentum confirmation: A sustained move above $79,743
A successful recovery above the EMA cluster could improve market sentiment and open the way toward higher resistance levels.
However, a temporary bounce without a daily reclaim of these levels may simply be a relief rally.
4. Bearish Scenario
The daily structure currently favors sellers because BTC remains below all major moving averages.
Important downside levels:
- Immediate support: $75,563
- Next support: $71,543
- Lower support: $69,698
- Additional demand: $67,236
- Major support zone: $65,088–$63,078
A confirmed daily close below $75,563 could expose BTC to the $71,543 area. If that level fails, further downside toward $69,698 and $67,236 becomes possible.
5. Market Structure & Liquidity
Bitcoin's recent recovery toward the $80K region has weakened, with price now showing lower levels and a bearish break of structure on the daily chart.
The chart highlights liquidity around recent swing highs and lows. The current price action suggests sellers are attempting to maintain control, while the $75.5K area is an important level for buyers to defend.
A liquidity sweep followed by a strong reclaim could create a short-term recovery opportunity. A breakdown without recovery would strengthen the bearish case.
6. RSI Momentum
- RSI: 37.85
- RSI Moving Average: 40.37
The RSI is below 40 and remains under its moving average, indicating weak momentum.
BTC is approaching oversold territory, but there is no confirmed bullish reversal signal yet. A recovery above 50 would provide stronger evidence that buying momentum is returning.
7. Key Levels to Watch
Resistance
- $76,483
- $77,111–$77,707
- $79,113–$79,743
- $81,018–$82,297
Support
- $75,563
- $71,543
- $69,698
- $67,236
- $65,088–$63,078
Final Outlook
Bitcoin's daily structure has turned increasingly bearish, with price trading below EMA 20, EMA 50, EMA 100, and EMA 200. RSI also confirms weakening momentum.
The $75,563 support level is critical in the near term. Holding this area could trigger a relief bounce, while a confirmed breakdown may expose $71,543 and potentially $69,698.
For bulls to regain confidence, BTC needs to reclaim $76,483 first, followed by the $77,700–$79,700 resistance region.
Short-term bias: Bearish below $79,743, with $75,563 as the immediate support to watch.
$BTC
{future}(BTCUSDT)
BTC Technical Outlook: Bitcoin Breaks Lower Toward $75.6K as Bearish Momentum Strengthens
BTC Technical Outlook: Bitcoin Breaks Lower Toward $75.6K as Bearish Momentum Strengthens
Bitcoin is facing renewed selling pressure after failing to maintain its position above the $76K–$77K support region. BTC is currently trading around $75,678, with the daily chart showing a bearish structure as price moves below all four major EMAs.
The key question now is whether buyers can defend the $75,563 Fibonacci support or whether another breakdown will expose lower demand zones.
1. EMA Structure
Current EMA levels:
- EMA 20: $79,113.51
- EMA 50: $79,743.56
- EMA 100: $77,706.95
- EMA 200: $76,483.68
BTC is trading below all four EMAs, indicating significant weakness in the daily structure.
The $76,483–$79,743 region represents a major resistance area. Buyers need to reclaim these moving averages to improve the recovery outlook.
2. Fibonacci Levels
Key Fibonacci levels from the chart:
- 0.236: $75,563.50
- 0.382: $85,257.62
- 0.5: $93,092.59
- 0.618: $100,927.57
- 0.786: $112,082.44
BTC is currently testing the 0.236 Fibonacci retracement level around $75,563. A sustained hold could provide an opportunity for a relief bounce, while a confirmed breakdown may accelerate selling pressure.
3. Bullish Scenario
For buyers to regain control, BTC needs to defend the current support and reclaim nearby resistance levels.
- First resistance: $76,483
- Next resistance: $77,111–$77,707
- Major resistance: $79,113–$79,743
- Momentum confirmation: A sustained move above $79,743
A successful recovery above the EMA cluster could improve market sentiment and open the way toward higher resistance levels.
However, a temporary bounce without a daily reclaim of these levels may simply be a relief rally.
4. Bearish Scenario
The daily structure currently favors sellers because BTC remains below all major moving averages.
Important downside levels:
- Immediate support: $75,563
- Next support: $71,543
- Lower support: $69,698
- Additional demand: $67,236
- Major support zone: $65,088–$63,078
A confirmed daily close below $75,563 could expose BTC to the $71,543 area. If that level fails, further downside toward $69,698 and $67,236 becomes possible.
5. Market Structure & Liquidity
Bitcoin's recent recovery toward the $80K region has weakened, with price now showing lower levels and a bearish break of structure on the daily chart.
The chart highlights liquidity around recent swing highs and lows. The current price action suggests sellers are attempting to maintain control, while the $75.5K area is an important level for buyers to defend.
A liquidity sweep followed by a strong reclaim could create a short-term recovery opportunity. A breakdown without recovery would strengthen the bearish case.
6. RSI Momentum
- RSI: 37.85
- RSI Moving Average: 40.37
The RSI is below 40 and remains under its moving average, indicating weak momentum.
BTC is approaching oversold territory, but there is no confirmed bullish reversal signal yet. A recovery above 50 would provide stronger evidence that buying momentum is returning.
7. Key Levels to Watch
Resistance
- $76,483
- $77,111–$77,707
- $79,113–$79,743
- $81,018–$82,297
Support
- $75,563
- $71,543
- $69,698
- $67,236
- $65,088–$63,078
Final Outlook
Bitcoin's daily structure has turned increasingly bearish, with price trading below EMA 20, EMA 50, EMA 100, and EMA 200. RSI also confirms weakening momentum.
The $75,563 support level is critical in the near term. Holding this area could trigger a relief bounce, while a confirmed breakdown may expose $71,543 and potentially $69,698.
For bulls to regain confidence, BTC needs to reclaim $76,483 first, followed by the $77,700–$79,700 resistance region.
Short-term bias: Bearish below $79,743, with $75,563 as the immediate support to watch.
$BTC
Bitcoin is facing renewed selling pressure after failing to maintain its position above the $76K–$77K support region. BTC is currently trading around $75,678, with the daily chart showing a bearish structure as price moves below all four major EMAs.
The key question now is whether buyers can defend the $75,563 Fibonacci support or whether another breakdown will expose lower demand zones.
1. EMA Structure
Current EMA levels:
- EMA 20: $79,113.51
- EMA 50: $79,743.56
- EMA 100: $77,706.95
- EMA 200: $76,483.68
BTC is trading below all four EMAs, indicating significant weakness in the daily structure.
The $76,483–$79,743 region represents a major resistance area. Buyers need to reclaim these moving averages to improve the recovery outlook.
2. Fibonacci Levels
Key Fibonacci levels from the chart:
- 0.236: $75,563.50
- 0.382: $85,257.62
- 0.5: $93,092.59
- 0.618: $100,927.57
- 0.786: $112,082.44
BTC is currently testing the 0.236 Fibonacci retracement level around $75,563. A sustained hold could provide an opportunity for a relief bounce, while a confirmed breakdown may accelerate selling pressure.
3. Bullish Scenario
For buyers to regain control, BTC needs to defend the current support and reclaim nearby resistance levels.
- First resistance: $76,483
- Next resistance: $77,111–$77,707
- Major resistance: $79,113–$79,743
- Momentum confirmation: A sustained move above $79,743
A successful recovery above the EMA cluster could improve market sentiment and open the way toward higher resistance levels.
However, a temporary bounce without a daily reclaim of these levels may simply be a relief rally.
4. Bearish Scenario
The daily structure currently favors sellers because BTC remains below all major moving averages.
Important downside levels:
- Immediate support: $75,563
- Next support: $71,543
- Lower support: $69,698
- Additional demand: $67,236
- Major support zone: $65,088–$63,078
A confirmed daily close below $75,563 could expose BTC to the $71,543 area. If that level fails, further downside toward $69,698 and $67,236 becomes possible.
5. Market Structure & Liquidity
Bitcoin's recent recovery toward the $80K region has weakened, with price now showing lower levels and a bearish break of structure on the daily chart.
The chart highlights liquidity around recent swing highs and lows. The current price action suggests sellers are attempting to maintain control, while the $75.5K area is an important level for buyers to defend.
A liquidity sweep followed by a strong reclaim could create a short-term recovery opportunity. A breakdown without recovery would strengthen the bearish case.
6. RSI Momentum
- RSI: 37.85
- RSI Moving Average: 40.37
The RSI is below 40 and remains under its moving average, indicating weak momentum.
BTC is approaching oversold territory, but there is no confirmed bullish reversal signal yet. A recovery above 50 would provide stronger evidence that buying momentum is returning.
7. Key Levels to Watch
Resistance
- $76,483
- $77,111–$77,707
- $79,113–$79,743
- $81,018–$82,297
Support
- $75,563
- $71,543
- $69,698
- $67,236
- $65,088–$63,078
Final Outlook
Bitcoin's daily structure has turned increasingly bearish, with price trading below EMA 20, EMA 50, EMA 100, and EMA 200. RSI also confirms weakening momentum.
The $75,563 support level is critical in the near term. Holding this area could trigger a relief bounce, while a confirmed breakdown may expose $71,543 and potentially $69,698.
For bulls to regain confidence, BTC needs to reclaim $76,483 first, followed by the $77,700–$79,700 resistance region.
Short-term bias: Bearish below $79,743, with $75,563 as the immediate support to watch.
$BTC
125
·
--
Article
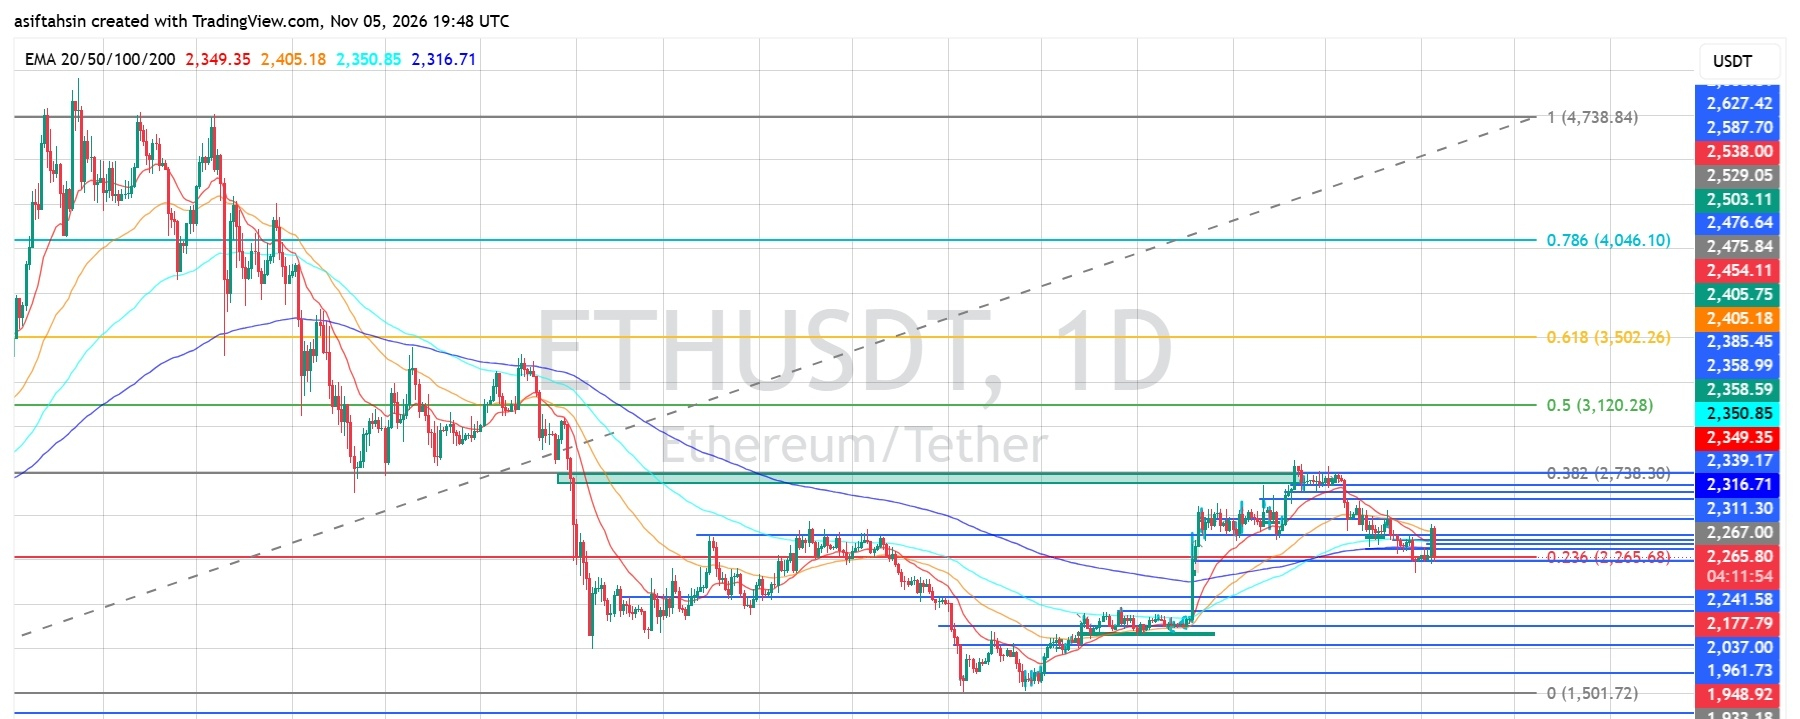
ETH Technical Outlook: Ethereum Tests Critical Support as Bearish Pressure RemainsEthereum is trading around $2,265–$2,267, testing the 0.236 Fibonacci level near $2,265.68 after pulling back from its recent recovery high around $2,358–$2,385.
The latest daily chart shows ETH trading below all four major EMAs. Although RSI has started to recover, the broader structure remains under pressure. Holding the $2,241–$2,265 support area is important for preventing another move lower.
EMA Structure
ETH is currently trading below all four major moving averages:
- 20 EMA: $2,349.35
- 50 EMA: $2,405.18
- 100 EMA: $2,350.85
- 200 EMA: $2,316.71
The 20 EMA is below the 50 EMA, while price remains below the entire EMA structure. This keeps the broader trend bearish and makes the $2,316–$2,405 region an important resistance area.
A sustained recovery above the 200 EMA near $2,316 would be an initial improvement, but reclaiming the $2,350–$2,405 zone would provide stronger bullish confirmation.
Fibonacci Levels
Based on the chart:
- 0.236: $2,265.68
- 0.382: $2,738.30
- 0.5: $3,120.28
- 0.618: $3,502.26
- 0.786: $4,046.10
ETH is currently testing the 0.236 Fibonacci level. A sustained move below this area could increase downside pressure, while holding it may help establish a short-term recovery.
Bullish Recovery Scenario
If ETH maintains support around $2,241–$2,265 and buyers regain momentum, the first challenge will be the $2,316–$2,350 resistance zone.
A successful breakout could open the way toward:
- $2,385
- $2,405
- $2,454–$2,476
- $2,503–$2,538
A stronger recovery would require ETH to reclaim the major EMA resistance cluster and build acceptance above it.
Bearish Continuation Scenario
If ETH fails to hold the $2,241 support area and breaks below it with strong selling pressure, the next downside zones are:
- $2,177
- $2,037
- $1,961–$1,948
- $1,904–$1,888
A daily close below $2,177 would weaken the recovery structure further and increase the possibility of a deeper correction toward the $2,037 demand area.
RSI Momentum
The daily RSI is around 41.09, with its signal line near 36.50.
RSI remains below the neutral 50 level, indicating that bullish momentum is still limited. However, the RSI moving above its signal line suggests some improvement in short-term momentum.
A sustained move above 50 would provide stronger evidence of a bullish momentum shift.
Market Structure & Liquidity
ETH recovered strongly from its June–July lows and advanced toward the $2,385 region. However, the recent rejection has brought price back toward the $2,265 support zone.
The market is now attempting to stabilize around the 0.236 Fibonacci level. The immediate direction will likely depend on whether buyers can defend $2,241–$2,265 or sellers force a breakdown.
Key Levels
Resistance:
- $2,316–$2,350
- $2,385–$2,405
- $2,454–$2,476
- $2,503–$2,538
Support:
- $2,265–$2,241
- $2,177
- $2,037
- $1,961–$1,948
- $1,904–$1,888
Final Outlook
ETH remains under bearish pressure while trading below its major EMAs. The $2,241–$2,265 region is the immediate support zone to watch.
Holding this area could support a recovery toward $2,316–$2,350 and potentially $2,405. However, a confirmed breakdown below $2,241 could expose $2,177 and $2,037.
Current Bias: Bearish-to-Neutral
A sustained reclaim of $2,405 would improve the bullish outlook, while losing $2,241 would increase downside risk.
$ETH
{future}(ETHUSDT)
ETH Technical Outlook: Ethereum Tests Critical Support as Bearish Pressure Remains
Ethereum is trading around $2,265–$2,267, testing the 0.236 Fibonacci level near $2,265.68 after pulling back from its recent recovery high around $2,358–$2,385.
The latest daily chart shows ETH trading below all four major EMAs. Although RSI has started to recover, the broader structure remains under pressure. Holding the $2,241–$2,265 support area is important for preventing another move lower.
EMA Structure
ETH is currently trading below all four major moving averages:
- 20 EMA: $2,349.35
- 50 EMA: $2,405.18
- 100 EMA: $2,350.85
- 200 EMA: $2,316.71
The 20 EMA is below the 50 EMA, while price remains below the entire EMA structure. This keeps the broader trend bearish and makes the $2,316–$2,405 region an important resistance area.
A sustained recovery above the 200 EMA near $2,316 would be an initial improvement, but reclaiming the $2,350–$2,405 zone would provide stronger bullish confirmation.
Fibonacci Levels
Based on the chart:
- 0.236: $2,265.68
- 0.382: $2,738.30
- 0.5: $3,120.28
- 0.618: $3,502.26
- 0.786: $4,046.10
ETH is currently testing the 0.236 Fibonacci level. A sustained move below this area could increase downside pressure, while holding it may help establish a short-term recovery.
Bullish Recovery Scenario
If ETH maintains support around $2,241–$2,265 and buyers regain momentum, the first challenge will be the $2,316–$2,350 resistance zone.
A successful breakout could open the way toward:
- $2,385
- $2,405
- $2,454–$2,476
- $2,503–$2,538
A stronger recovery would require ETH to reclaim the major EMA resistance cluster and build acceptance above it.
Bearish Continuation Scenario
If ETH fails to hold the $2,241 support area and breaks below it with strong selling pressure, the next downside zones are:
- $2,177
- $2,037
- $1,961–$1,948
- $1,904–$1,888
A daily close below $2,177 would weaken the recovery structure further and increase the possibility of a deeper correction toward the $2,037 demand area.
RSI Momentum
The daily RSI is around 41.09, with its signal line near 36.50.
RSI remains below the neutral 50 level, indicating that bullish momentum is still limited. However, the RSI moving above its signal line suggests some improvement in short-term momentum.
A sustained move above 50 would provide stronger evidence of a bullish momentum shift.
Market Structure & Liquidity
ETH recovered strongly from its June–July lows and advanced toward the $2,385 region. However, the recent rejection has brought price back toward the $2,265 support zone.
The market is now attempting to stabilize around the 0.236 Fibonacci level. The immediate direction will likely depend on whether buyers can defend $2,241–$2,265 or sellers force a breakdown.
Key Levels
Resistance:
- $2,316–$2,350
- $2,385–$2,405
- $2,454–$2,476
- $2,503–$2,538
Support:
- $2,265–$2,241
- $2,177
- $2,037
- $1,961–$1,948
- $1,904–$1,888
Final Outlook
ETH remains under bearish pressure while trading below its major EMAs. The $2,241–$2,265 region is the immediate support zone to watch.
Holding this area could support a recovery toward $2,316–$2,350 and potentially $2,405. However, a confirmed breakdown below $2,241 could expose $2,177 and $2,037.
Current Bias: Bearish-to-Neutral
A sustained reclaim of $2,405 would improve the bullish outlook, while losing $2,241 would increase downside risk.
$ETH
The latest daily chart shows ETH trading below all four major EMAs. Although RSI has started to recover, the broader structure remains under pressure. Holding the $2,241–$2,265 support area is important for preventing another move lower.
EMA Structure
ETH is currently trading below all four major moving averages:
- 20 EMA: $2,349.35
- 50 EMA: $2,405.18
- 100 EMA: $2,350.85
- 200 EMA: $2,316.71
The 20 EMA is below the 50 EMA, while price remains below the entire EMA structure. This keeps the broader trend bearish and makes the $2,316–$2,405 region an important resistance area.
A sustained recovery above the 200 EMA near $2,316 would be an initial improvement, but reclaiming the $2,350–$2,405 zone would provide stronger bullish confirmation.
Fibonacci Levels
Based on the chart:
- 0.236: $2,265.68
- 0.382: $2,738.30
- 0.5: $3,120.28
- 0.618: $3,502.26
- 0.786: $4,046.10
ETH is currently testing the 0.236 Fibonacci level. A sustained move below this area could increase downside pressure, while holding it may help establish a short-term recovery.
Bullish Recovery Scenario
If ETH maintains support around $2,241–$2,265 and buyers regain momentum, the first challenge will be the $2,316–$2,350 resistance zone.
A successful breakout could open the way toward:
- $2,385
- $2,405
- $2,454–$2,476
- $2,503–$2,538
A stronger recovery would require ETH to reclaim the major EMA resistance cluster and build acceptance above it.
Bearish Continuation Scenario
If ETH fails to hold the $2,241 support area and breaks below it with strong selling pressure, the next downside zones are:
- $2,177
- $2,037
- $1,961–$1,948
- $1,904–$1,888
A daily close below $2,177 would weaken the recovery structure further and increase the possibility of a deeper correction toward the $2,037 demand area.
RSI Momentum
The daily RSI is around 41.09, with its signal line near 36.50.
RSI remains below the neutral 50 level, indicating that bullish momentum is still limited. However, the RSI moving above its signal line suggests some improvement in short-term momentum.
A sustained move above 50 would provide stronger evidence of a bullish momentum shift.
Market Structure & Liquidity
ETH recovered strongly from its June–July lows and advanced toward the $2,385 region. However, the recent rejection has brought price back toward the $2,265 support zone.
The market is now attempting to stabilize around the 0.236 Fibonacci level. The immediate direction will likely depend on whether buyers can defend $2,241–$2,265 or sellers force a breakdown.
Key Levels
Resistance:
- $2,316–$2,350
- $2,385–$2,405
- $2,454–$2,476
- $2,503–$2,538
Support:
- $2,265–$2,241
- $2,177
- $2,037
- $1,961–$1,948
- $1,904–$1,888
Final Outlook
ETH remains under bearish pressure while trading below its major EMAs. The $2,241–$2,265 region is the immediate support zone to watch.
Holding this area could support a recovery toward $2,316–$2,350 and potentially $2,405. However, a confirmed breakdown below $2,241 could expose $2,177 and $2,037.
Current Bias: Bearish-to-Neutral
A sustained reclaim of $2,405 would improve the bullish outlook, while losing $2,241 would increase downside risk.
$ETH
1
145
·
--
Article
XRP Technical Outlook: XRP Weakens Below Key EMAs as Bearish Pressure BuildsXRP Technical Outlook: XRP Weakens Below Key EMAs as Bearish Pressure Builds
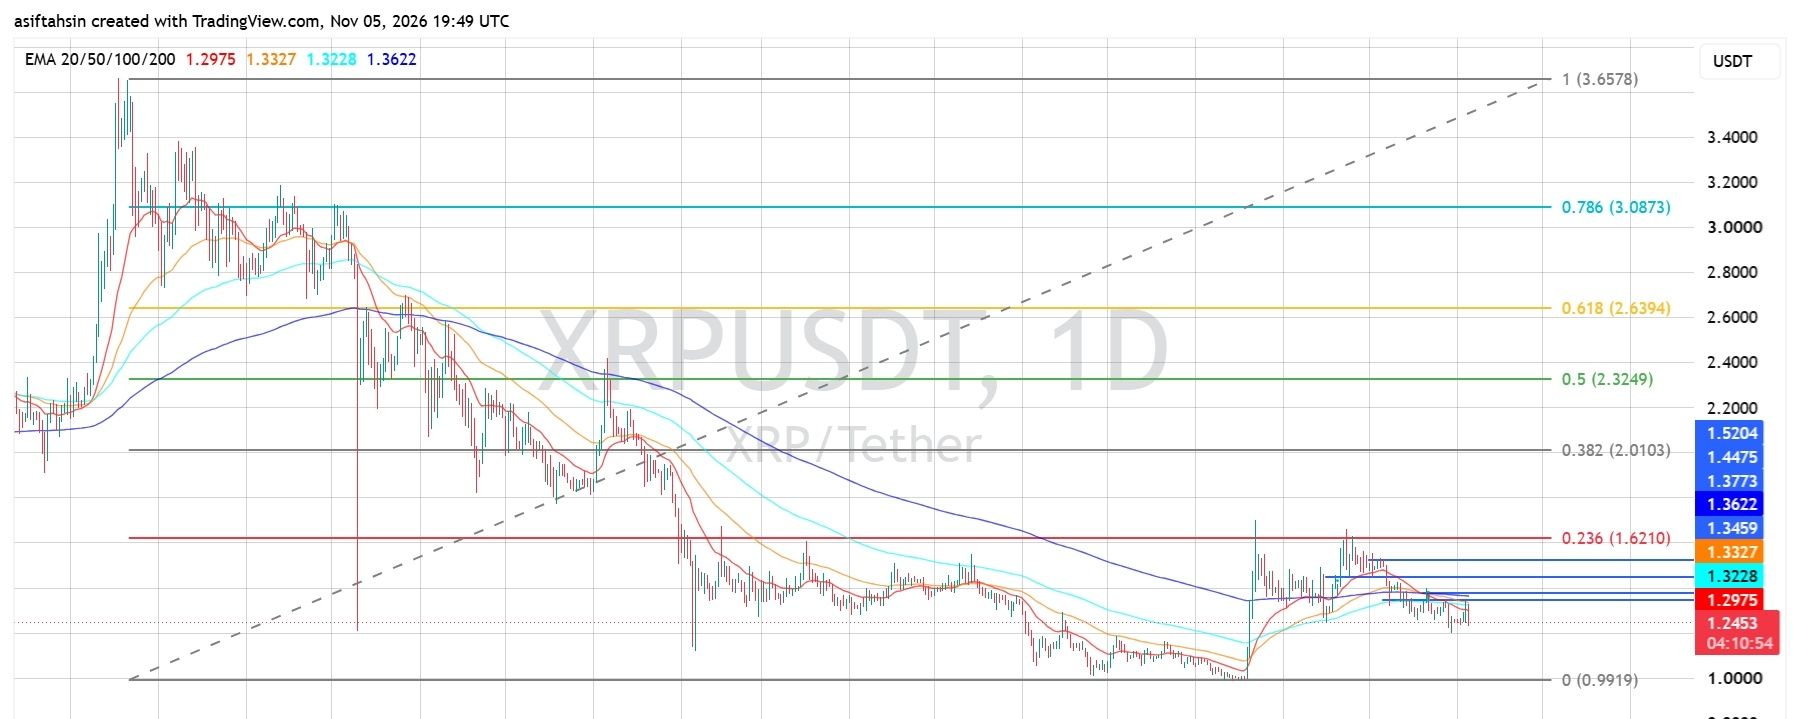
XRP is trading around $1.245, facing continued selling pressure after being rejected from the $1.35–$1.36 resistance area. The price has moved below all four major EMAs, while RSI remains below 40, indicating that bearish momentum is still dominant.
The immediate focus is whether buyers can defend the $1.22–$1.24 support area. A breakdown could expose XRP to further downside, while a recovery above the EMA cluster would be the first sign of improving momentum.
EMA Structure
XRP is trading below all four major moving averages:
- 20 EMA: $1.2975
- 50 EMA: $1.3327
- 100 EMA: $1.3228
- 200 EMA: $1.3622
The 20 EMA is below the 50, 100, and 200 EMAs, reflecting weakening short-term momentum. The entire EMA cluster between $1.2975 and $1.3622 now acts as overhead resistance.
XRP needs to reclaim $1.30 first, followed by $1.32–$1.36, to establish a stronger recovery structure.
Fibonacci Levels
Based on the chart's Fibonacci retracement:
- 0.236: $1.6210
- 0.382: $2.0103
- 0.5: $2.3249
- 0.618: $2.6394
- 0.786: $3.0873
These are broader recovery targets rather than immediate price objectives. XRP would first need to reclaim the nearby EMA resistance zone before these Fibonacci levels become relevant.
Bullish Recovery Scenario
If XRP holds the $1.22–$1.24 support area and buying pressure returns, the first recovery target is $1.2975, followed by the $1.3228–$1.3327 EMA zone.
A sustained move above $1.36 could improve the broader structure and open the way toward $1.3773, $1.4475, and $1.5204.
A stronger bullish reversal would require a clear breakout and sustained trading above these resistance levels.
Bearish Continuation Scenario
If XRP fails to defend the $1.22–$1.24 area, selling pressure could increase and push the price toward lower demand zones.
A sustained breakdown would weaken the recent recovery structure and bring the broader $1.00–$0.99 support area into focus.
Until XRP reclaims the EMA cluster, downside risks remain elevated.
RSI Momentum
RSI is currently around 39.51, while its signal average is near 40.19.
Momentum remains below the neutral 50 level, showing that sellers still have the advantage. Although RSI is approaching oversold territory, this alone does not confirm a bullish reversal.
A move back above 50 would provide a stronger indication that buying momentum is returning.
Market Structure & Liquidity
XRP previously recovered sharply from the $1.00 area and moved toward the $1.35–$1.36 region. However, that recovery faced rejection, followed by lower highs and renewed selling pressure.
The price is now consolidating near $1.245, below all four major EMAs. This keeps the short-term structure weak.
Buyers need to defend the current support area and reclaim $1.30 to prevent further deterioration.
Key Levels
Resistance:
- $1.2975
- $1.3228–$1.3327
- $1.3459–$1.3622
- $1.3773
- $1.4475
- $1.5204
Support:
- $1.22–$1.24
- $1.20 psychological area
- $1.00–$0.9919
Final Outlook
XRP remains bearish-to-neutral while trading below the $1.30–$1.36 EMA resistance zone.
A successful recovery above $1.30 could provide short-term relief, while a breakout above $1.36 would strengthen the bullish recovery outlook.
However, losing the $1.22–$1.24 support area could expose XRP to another downside move toward lower demand.
Current Bias: Bearish below $1.30 | Recovery confirmation above $1.36 | Downside risk below $1.22.
$XRP
{future}(XRPUSDT)
XRP Technical Outlook: XRP Weakens Below Key EMAs as Bearish Pressure Builds
XRP Technical Outlook: XRP Weakens Below Key EMAs as Bearish Pressure Builds
XRP is trading around $1.245, facing continued selling pressure after being rejected from the $1.35–$1.36 resistance area. The price has moved below all four major EMAs, while RSI remains below 40, indicating that bearish momentum is still dominant.
The immediate focus is whether buyers can defend the $1.22–$1.24 support area. A breakdown could expose XRP to further downside, while a recovery above the EMA cluster would be the first sign of improving momentum.
EMA Structure
XRP is trading below all four major moving averages:
- 20 EMA: $1.2975
- 50 EMA: $1.3327
- 100 EMA: $1.3228
- 200 EMA: $1.3622
The 20 EMA is below the 50, 100, and 200 EMAs, reflecting weakening short-term momentum. The entire EMA cluster between $1.2975 and $1.3622 now acts as overhead resistance.
XRP needs to reclaim $1.30 first, followed by $1.32–$1.36, to establish a stronger recovery structure.
Fibonacci Levels
Based on the chart's Fibonacci retracement:
- 0.236: $1.6210
- 0.382: $2.0103
- 0.5: $2.3249
- 0.618: $2.6394
- 0.786: $3.0873
These are broader recovery targets rather than immediate price objectives. XRP would first need to reclaim the nearby EMA resistance zone before these Fibonacci levels become relevant.
Bullish Recovery Scenario
If XRP holds the $1.22–$1.24 support area and buying pressure returns, the first recovery target is $1.2975, followed by the $1.3228–$1.3327 EMA zone.
A sustained move above $1.36 could improve the broader structure and open the way toward $1.3773, $1.4475, and $1.5204.
A stronger bullish reversal would require a clear breakout and sustained trading above these resistance levels.
Bearish Continuation Scenario
If XRP fails to defend the $1.22–$1.24 area, selling pressure could increase and push the price toward lower demand zones.
A sustained breakdown would weaken the recent recovery structure and bring the broader $1.00–$0.99 support area into focus.
Until XRP reclaims the EMA cluster, downside risks remain elevated.
RSI Momentum
RSI is currently around 39.51, while its signal average is near 40.19.
Momentum remains below the neutral 50 level, showing that sellers still have the advantage. Although RSI is approaching oversold territory, this alone does not confirm a bullish reversal.
A move back above 50 would provide a stronger indication that buying momentum is returning.
Market Structure & Liquidity
XRP previously recovered sharply from the $1.00 area and moved toward the $1.35–$1.36 region. However, that recovery faced rejection, followed by lower highs and renewed selling pressure.
The price is now consolidating near $1.245, below all four major EMAs. This keeps the short-term structure weak.
Buyers need to defend the current support area and reclaim $1.30 to prevent further deterioration.
Key Levels
Resistance:
- $1.2975
- $1.3228–$1.3327
- $1.3459–$1.3622
- $1.3773
- $1.4475
- $1.5204
Support:
- $1.22–$1.24
- $1.20 psychological area
- $1.00–$0.9919
Final Outlook
XRP remains bearish-to-neutral while trading below the $1.30–$1.36 EMA resistance zone.
A successful recovery above $1.30 could provide short-term relief, while a breakout above $1.36 would strengthen the bullish recovery outlook.
However, losing the $1.22–$1.24 support area could expose XRP to another downside move toward lower demand.
Current Bias: Bearish below $1.30 | Recovery confirmation above $1.36 | Downside risk below $1.22.
$XRP
XRP is trading around $1.245, facing continued selling pressure after being rejected from the $1.35–$1.36 resistance area. The price has moved below all four major EMAs, while RSI remains below 40, indicating that bearish momentum is still dominant.
The immediate focus is whether buyers can defend the $1.22–$1.24 support area. A breakdown could expose XRP to further downside, while a recovery above the EMA cluster would be the first sign of improving momentum.
EMA Structure
XRP is trading below all four major moving averages:
- 20 EMA: $1.2975
- 50 EMA: $1.3327
- 100 EMA: $1.3228
- 200 EMA: $1.3622
The 20 EMA is below the 50, 100, and 200 EMAs, reflecting weakening short-term momentum. The entire EMA cluster between $1.2975 and $1.3622 now acts as overhead resistance.
XRP needs to reclaim $1.30 first, followed by $1.32–$1.36, to establish a stronger recovery structure.
Fibonacci Levels
Based on the chart's Fibonacci retracement:
- 0.236: $1.6210
- 0.382: $2.0103
- 0.5: $2.3249
- 0.618: $2.6394
- 0.786: $3.0873
These are broader recovery targets rather than immediate price objectives. XRP would first need to reclaim the nearby EMA resistance zone before these Fibonacci levels become relevant.
Bullish Recovery Scenario
If XRP holds the $1.22–$1.24 support area and buying pressure returns, the first recovery target is $1.2975, followed by the $1.3228–$1.3327 EMA zone.
A sustained move above $1.36 could improve the broader structure and open the way toward $1.3773, $1.4475, and $1.5204.
A stronger bullish reversal would require a clear breakout and sustained trading above these resistance levels.
Bearish Continuation Scenario
If XRP fails to defend the $1.22–$1.24 area, selling pressure could increase and push the price toward lower demand zones.
A sustained breakdown would weaken the recent recovery structure and bring the broader $1.00–$0.99 support area into focus.
Until XRP reclaims the EMA cluster, downside risks remain elevated.
RSI Momentum
RSI is currently around 39.51, while its signal average is near 40.19.
Momentum remains below the neutral 50 level, showing that sellers still have the advantage. Although RSI is approaching oversold territory, this alone does not confirm a bullish reversal.
A move back above 50 would provide a stronger indication that buying momentum is returning.
Market Structure & Liquidity
XRP previously recovered sharply from the $1.00 area and moved toward the $1.35–$1.36 region. However, that recovery faced rejection, followed by lower highs and renewed selling pressure.
The price is now consolidating near $1.245, below all four major EMAs. This keeps the short-term structure weak.
Buyers need to defend the current support area and reclaim $1.30 to prevent further deterioration.
Key Levels
Resistance:
- $1.2975
- $1.3228–$1.3327
- $1.3459–$1.3622
- $1.3773
- $1.4475
- $1.5204
Support:
- $1.22–$1.24
- $1.20 psychological area
- $1.00–$0.9919
Final Outlook
XRP remains bearish-to-neutral while trading below the $1.30–$1.36 EMA resistance zone.
A successful recovery above $1.30 could provide short-term relief, while a breakout above $1.36 would strengthen the bullish recovery outlook.
However, losing the $1.22–$1.24 support area could expose XRP to another downside move toward lower demand.
Current Bias: Bearish below $1.30 | Recovery confirmation above $1.36 | Downside risk below $1.22.
$XRP
1.2k
·
--
Article
XRP Technical Outlook: XRP Consolidates Near $1.30 as Bulls Attempt to Defend SupportXRP Technical Outlook: XRP Consolidates Near $1.30 as Bulls Attempt to Defend Support
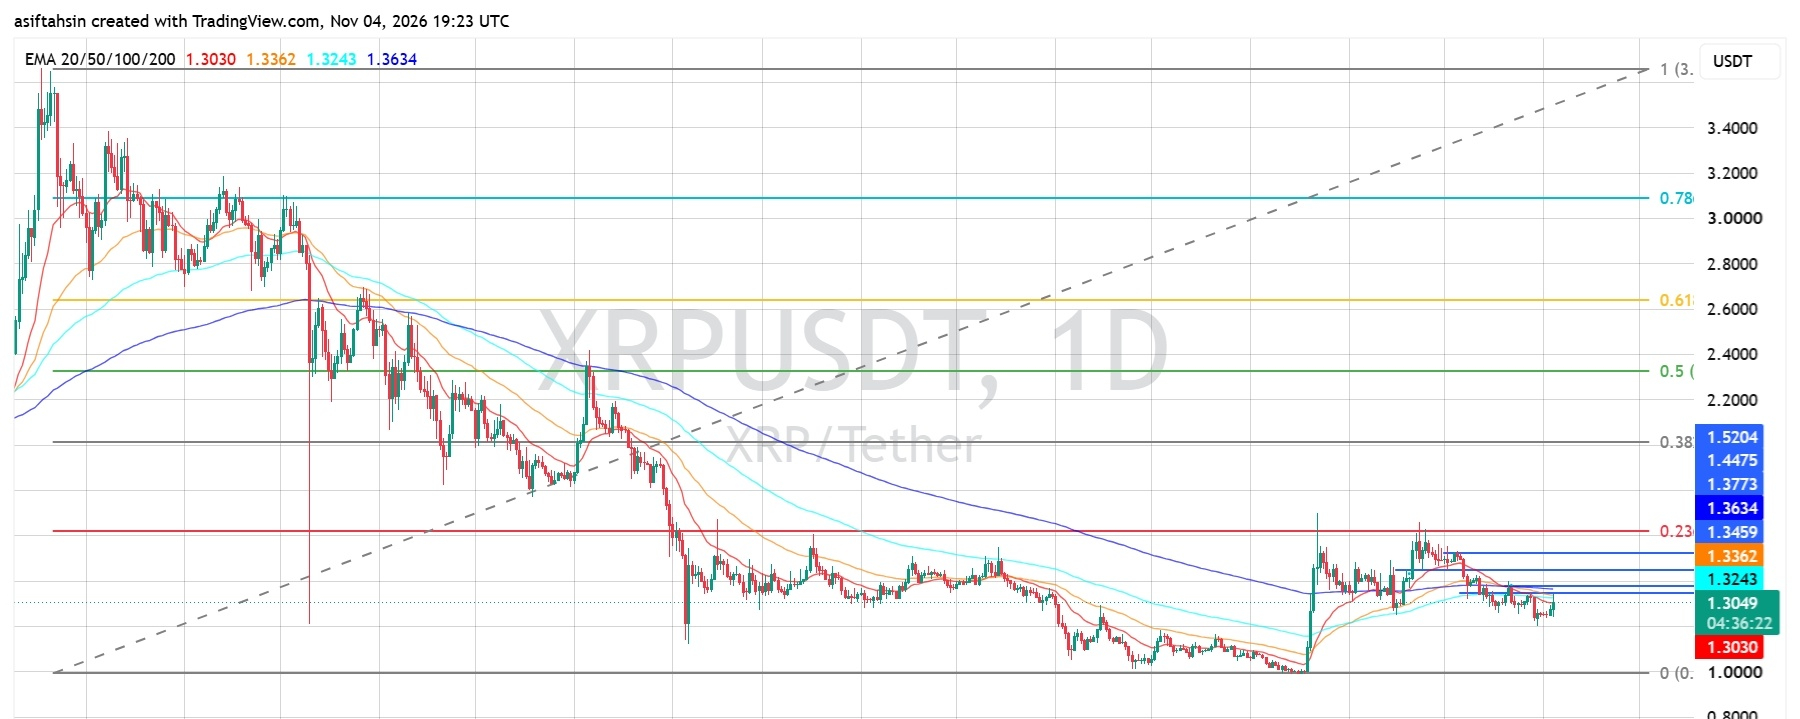
XRP is currently trading around $1.3049–$1.3051, consolidating after its recovery from the $1.00 region. The recent rally pushed price toward the $1.37 area, but XRP faced rejection and has since moved into a corrective phase.
The broader recovery has lost some momentum, with price trading below the 50, 100, and 200 EMAs. However, XRP is holding near the 20 EMA and attempting to stabilize around $1.30.
The immediate focus is whether buyers can defend the $1.30 area and reclaim the $1.3243–$1.3362 resistance zone. A sustained move above this zone would improve the recovery outlook, while a breakdown below support could expose XRP to further downside.
EMA Structure
* 20 EMA: $1.3030
* 50 EMA: $1.3362
* 100 EMA: $1.3243
* 200 EMA: $1.3634
XRP is trading slightly above the 20 EMA but remains below the 50, 100, and 200 EMAs. This indicates that short-term price action is attempting to stabilize, while the broader trend still faces significant overhead resistance.
The $1.3243–$1.3362 region is the first important resistance zone. Reclaiming the 50 EMA at $1.3362 would strengthen the short-term recovery, while the 200 EMA near $1.3634 remains a major barrier.
Fibonacci Levels
Based on the visible chart levels:
* 0.236: Around $1.3459
* 0.382: Around $2.00
* 0.5: Around $2.32
* 0.618: Around $2.64
* 0.786: Around $3.08
XRP is trading below the visible 0.236 Fibonacci resistance area. A sustained recovery above $1.3459 would be an early sign of improving momentum. The higher Fibonacci levels represent broader recovery objectives rather than immediate targets.
Bullish Scenario
If XRP holds the $1.30 support area and buyers manage to reclaim the nearby EMA resistance zone, the price could attempt a recovery toward:
* $1.3243
* $1.3362
* $1.3459
* $1.3634
* $1.3773
* $1.4475
* $1.5204
A decisive move above $1.3459 would improve the bullish outlook. Reclaiming $1.3634–$1.3773 could open the way toward the $1.4475 resistance area.
Pullback Scenario
If XRP fails to hold above $1.30 and selling pressure increases, the following support areas deserve attention:
* $1.3030 — 20 EMA
* $1.30 — Immediate psychological support
* $1.27–$1.25 — Potential lower support area
* $1.00 — Major historical support region
A sustained breakdown below $1.30 would weaken the current consolidation structure and increase the possibility of a deeper correction. The $1.00 region remains an important broader support reference on the chart.
RSI Momentum
* RSI: 47.82
* RSI Signal Average: 40.26
RSI is below the neutral 50 level, showing that bullish momentum remains limited. However, the RSI is above its signal average, suggesting a modest improvement in short-term momentum.
A move above 50–55 would provide stronger confirmation of a recovery attempt. If RSI turns lower and falls below 40, downside pressure could increase.
Market Structure & Liquidity
XRP has experienced a prolonged decline from its previous highs before finding support around the $1.00 region. The subsequent recovery pushed price toward the $1.37 area, but buyers have struggled to maintain that upward momentum.
The latest price action shows lower highs and consolidation around $1.30–$1.34. The market is currently testing whether the $1.30 region can hold as support.
The broader structure remains under pressure while XRP trades below the 50, 100, and 200 EMAs. A confirmed reclaim of the $1.3459–$1.3773 zone would be needed to establish a stronger bullish recovery.
Key Levels
Resistance
* $1.3243
* $1.3362
* $1.3459
* $1.3634
* $1.3773
* $1.4475
* $1.5204
Support
* $1.3030
* $1.30
* $1.27–$1.25
* $1.00
Final Outlook
XRP remains neutral-to-bearish while trading below the $1.3362–$1.3634 resistance zone. The price is attempting to stabilize around $1.30, but the broader recovery still needs confirmation.
A sustained breakout above $1.3459 could open the path toward $1.3773, followed by $1.4475. On the downside, losing $1.30 would increase the risk of a deeper correction.
Bias: Neutral-to-bearish below $1.3459 | Breakout above $1.3773 could strengthen recovery toward $1.4475–$1.5204.
Analysis based on the provided XRP/USDT 1D chart dated November 4, 2026. These levels represent technical scenarios, not guaranteed outcomes.
$XRP
{future}(XRPUSDT)
XRP Technical Outlook: XRP Consolidates Near $1.30 as Bulls Attempt to Defend Support
XRP Technical Outlook: XRP Consolidates Near $1.30 as Bulls Attempt to Defend Support
XRP is currently trading around $1.3049–$1.3051, consolidating after its recovery from the $1.00 region. The recent rally pushed price toward the $1.37 area, but XRP faced rejection and has since moved into a corrective phase.
The broader recovery has lost some momentum, with price trading below the 50, 100, and 200 EMAs. However, XRP is holding near the 20 EMA and attempting to stabilize around $1.30.
The immediate focus is whether buyers can defend the $1.30 area and reclaim the $1.3243–$1.3362 resistance zone. A sustained move above this zone would improve the recovery outlook, while a breakdown below support could expose XRP to further downside.
EMA Structure
* 20 EMA: $1.3030
* 50 EMA: $1.3362
* 100 EMA: $1.3243
* 200 EMA: $1.3634
XRP is trading slightly above the 20 EMA but remains below the 50, 100, and 200 EMAs. This indicates that short-term price action is attempting to stabilize, while the broader trend still faces significant overhead resistance.
The $1.3243–$1.3362 region is the first important resistance zone. Reclaiming the 50 EMA at $1.3362 would strengthen the short-term recovery, while the 200 EMA near $1.3634 remains a major barrier.
Fibonacci Levels
Based on the visible chart levels:
* 0.236: Around $1.3459
* 0.382: Around $2.00
* 0.5: Around $2.32
* 0.618: Around $2.64
* 0.786: Around $3.08
XRP is trading below the visible 0.236 Fibonacci resistance area. A sustained recovery above $1.3459 would be an early sign of improving momentum. The higher Fibonacci levels represent broader recovery objectives rather than immediate targets.
Bullish Scenario
If XRP holds the $1.30 support area and buyers manage to reclaim the nearby EMA resistance zone, the price could attempt a recovery toward:
* $1.3243
* $1.3362
* $1.3459
* $1.3634
* $1.3773
* $1.4475
* $1.5204
A decisive move above $1.3459 would improve the bullish outlook. Reclaiming $1.3634–$1.3773 could open the way toward the $1.4475 resistance area.
Pullback Scenario
If XRP fails to hold above $1.30 and selling pressure increases, the following support areas deserve attention:
* $1.3030 — 20 EMA
* $1.30 — Immediate psychological support
* $1.27–$1.25 — Potential lower support area
* $1.00 — Major historical support region
A sustained breakdown below $1.30 would weaken the current consolidation structure and increase the possibility of a deeper correction. The $1.00 region remains an important broader support reference on the chart.
RSI Momentum
* RSI: 47.82
* RSI Signal Average: 40.26
RSI is below the neutral 50 level, showing that bullish momentum remains limited. However, the RSI is above its signal average, suggesting a modest improvement in short-term momentum.
A move above 50–55 would provide stronger confirmation of a recovery attempt. If RSI turns lower and falls below 40, downside pressure could increase.
Market Structure & Liquidity
XRP has experienced a prolonged decline from its previous highs before finding support around the $1.00 region. The subsequent recovery pushed price toward the $1.37 area, but buyers have struggled to maintain that upward momentum.
The latest price action shows lower highs and consolidation around $1.30–$1.34. The market is currently testing whether the $1.30 region can hold as support.
The broader structure remains under pressure while XRP trades below the 50, 100, and 200 EMAs. A confirmed reclaim of the $1.3459–$1.3773 zone would be needed to establish a stronger bullish recovery.
Key Levels
Resistance
* $1.3243
* $1.3362
* $1.3459
* $1.3634
* $1.3773
* $1.4475
* $1.5204
Support
* $1.3030
* $1.30
* $1.27–$1.25
* $1.00
Final Outlook
XRP remains neutral-to-bearish while trading below the $1.3362–$1.3634 resistance zone. The price is attempting to stabilize around $1.30, but the broader recovery still needs confirmation.
A sustained breakout above $1.3459 could open the path toward $1.3773, followed by $1.4475. On the downside, losing $1.30 would increase the risk of a deeper correction.
Bias: Neutral-to-bearish below $1.3459 | Breakout above $1.3773 could strengthen recovery toward $1.4475–$1.5204.
Analysis based on the provided XRP/USDT 1D chart dated November 4, 2026. These levels represent technical scenarios, not guaranteed outcomes.
$XRP
XRP is currently trading around $1.3049–$1.3051, consolidating after its recovery from the $1.00 region. The recent rally pushed price toward the $1.37 area, but XRP faced rejection and has since moved into a corrective phase.
The broader recovery has lost some momentum, with price trading below the 50, 100, and 200 EMAs. However, XRP is holding near the 20 EMA and attempting to stabilize around $1.30.
The immediate focus is whether buyers can defend the $1.30 area and reclaim the $1.3243–$1.3362 resistance zone. A sustained move above this zone would improve the recovery outlook, while a breakdown below support could expose XRP to further downside.
EMA Structure
* 20 EMA: $1.3030
* 50 EMA: $1.3362
* 100 EMA: $1.3243
* 200 EMA: $1.3634
XRP is trading slightly above the 20 EMA but remains below the 50, 100, and 200 EMAs. This indicates that short-term price action is attempting to stabilize, while the broader trend still faces significant overhead resistance.
The $1.3243–$1.3362 region is the first important resistance zone. Reclaiming the 50 EMA at $1.3362 would strengthen the short-term recovery, while the 200 EMA near $1.3634 remains a major barrier.
Fibonacci Levels
Based on the visible chart levels:
* 0.236: Around $1.3459
* 0.382: Around $2.00
* 0.5: Around $2.32
* 0.618: Around $2.64
* 0.786: Around $3.08
XRP is trading below the visible 0.236 Fibonacci resistance area. A sustained recovery above $1.3459 would be an early sign of improving momentum. The higher Fibonacci levels represent broader recovery objectives rather than immediate targets.
Bullish Scenario
If XRP holds the $1.30 support area and buyers manage to reclaim the nearby EMA resistance zone, the price could attempt a recovery toward:
* $1.3243
* $1.3362
* $1.3459
* $1.3634
* $1.3773
* $1.4475
* $1.5204
A decisive move above $1.3459 would improve the bullish outlook. Reclaiming $1.3634–$1.3773 could open the way toward the $1.4475 resistance area.
Pullback Scenario
If XRP fails to hold above $1.30 and selling pressure increases, the following support areas deserve attention:
* $1.3030 — 20 EMA
* $1.30 — Immediate psychological support
* $1.27–$1.25 — Potential lower support area
* $1.00 — Major historical support region
A sustained breakdown below $1.30 would weaken the current consolidation structure and increase the possibility of a deeper correction. The $1.00 region remains an important broader support reference on the chart.
RSI Momentum
* RSI: 47.82
* RSI Signal Average: 40.26
RSI is below the neutral 50 level, showing that bullish momentum remains limited. However, the RSI is above its signal average, suggesting a modest improvement in short-term momentum.
A move above 50–55 would provide stronger confirmation of a recovery attempt. If RSI turns lower and falls below 40, downside pressure could increase.
Market Structure & Liquidity
XRP has experienced a prolonged decline from its previous highs before finding support around the $1.00 region. The subsequent recovery pushed price toward the $1.37 area, but buyers have struggled to maintain that upward momentum.
The latest price action shows lower highs and consolidation around $1.30–$1.34. The market is currently testing whether the $1.30 region can hold as support.
The broader structure remains under pressure while XRP trades below the 50, 100, and 200 EMAs. A confirmed reclaim of the $1.3459–$1.3773 zone would be needed to establish a stronger bullish recovery.
Key Levels
Resistance
* $1.3243
* $1.3362
* $1.3459
* $1.3634
* $1.3773
* $1.4475
* $1.5204
Support
* $1.3030
* $1.30
* $1.27–$1.25
* $1.00
Final Outlook
XRP remains neutral-to-bearish while trading below the $1.3362–$1.3634 resistance zone. The price is attempting to stabilize around $1.30, but the broader recovery still needs confirmation.
A sustained breakout above $1.3459 could open the path toward $1.3773, followed by $1.4475. On the downside, losing $1.30 would increase the risk of a deeper correction.
Bias: Neutral-to-bearish below $1.3459 | Breakout above $1.3773 could strengthen recovery toward $1.4475–$1.5204.
Analysis based on the provided XRP/USDT 1D chart dated November 4, 2026. These levels represent technical scenarios, not guaranteed outcomes.
$XRP
1
840
·
--
Article
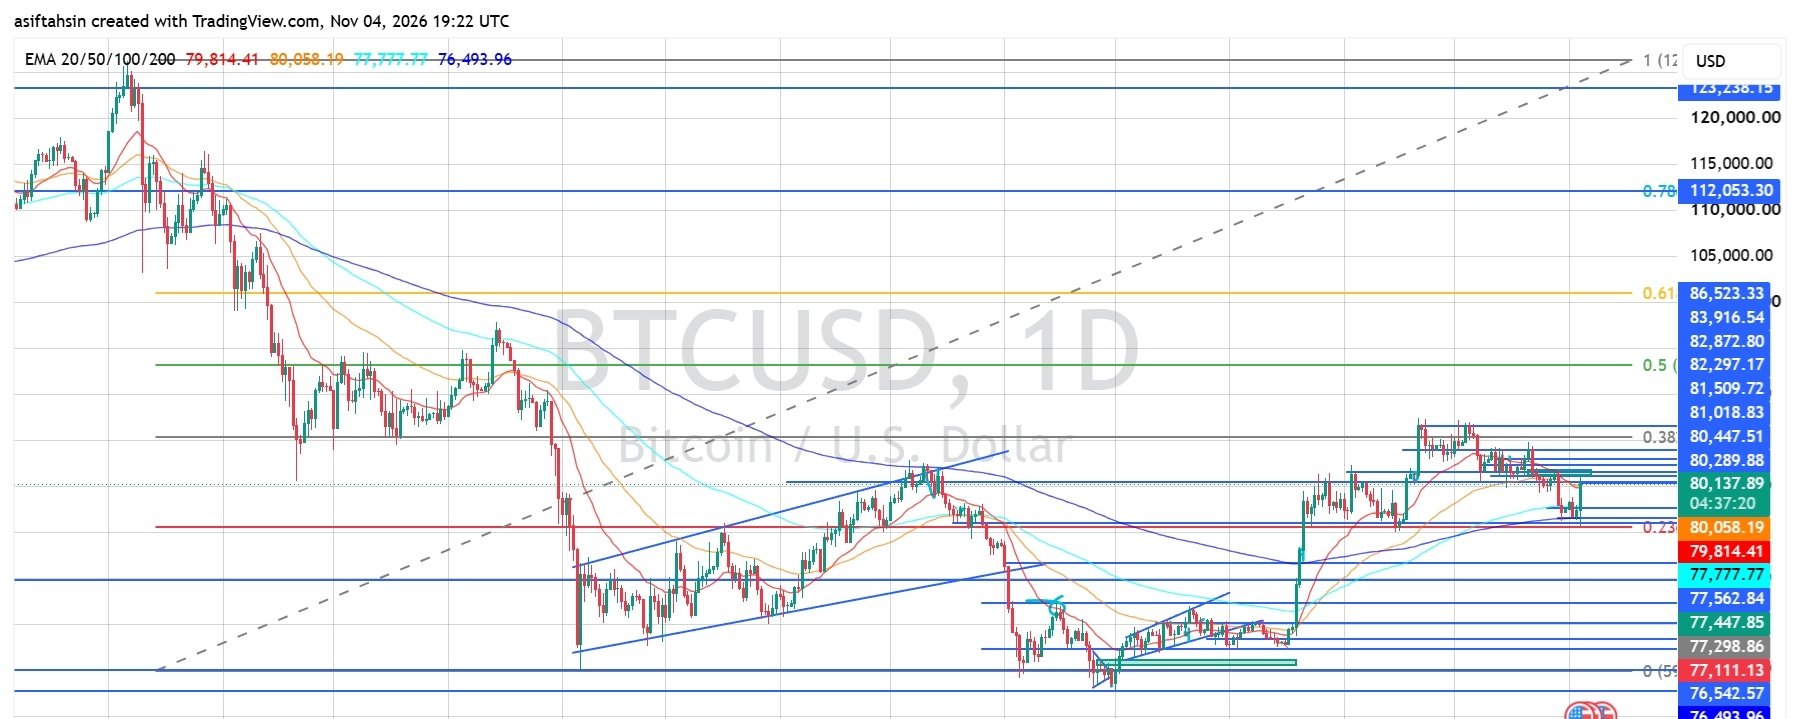
BTC Technical Outlook: Bitcoin Attempts Recovery Near $80K as Bulls Defend Key SupportBitcoin is currently trading around $80,137, attempting to recover after a recent pullback from the $81,000–$81,500 region. Price has moved back toward the short-term moving averages, but BTC is still facing resistance around $80,300–$80,450.
The market is showing signs of stabilization after the recent decline. However, buyers need to reclaim the $81,000–$81,500 zone to strengthen the recovery. Holding above the $79,800 area is important to prevent further downside pressure.
EMA Structure
* 20 EMA: $79,814.41
* 50 EMA: $80,058.19
* 100 EMA: $77,777.77
* 200 EMA: $76,493.96
BTC is trading slightly above all four EMAs, suggesting that the broader recovery structure remains intact. However, the 20 and 50 EMAs are close to the current price, making the $79,800–$80,100 region an important short-term support area.
A sustained move above the $80,450 resistance zone would improve the immediate bullish outlook.
Fibonacci Levels
Based on the chart:
* 0.236: Around $79,800
* 0.382: $80,447.51
* 0.5: $82,872.80
* 0.618: Around $100,000
* 0.786: $112,053.30
* 1.0: $123,238.15
BTC is currently trading around the lower Fibonacci retracement area. Reclaiming $80,447 would be an important step toward a recovery, while the next major Fibonacci resistance is near $82,872.
Bullish Scenario
If BTC maintains support above $79,800 and breaks through the nearby resistance zone, buyers could attempt a move toward:
$80,289–$80,447
$81,018
$81,509
$82,297
$82,872
$83,916
$86,523
A sustained breakout above $81,509 would strengthen the short-term recovery structure. A move above $82,872 could open the path toward the $83,916–$86,523 resistance region.
Pullback Scenario
If BTC fails to hold above $79,800 and selling pressure increases, the following support levels become important:
* $79,814 — 20 EMA
* $80,058 — 50 EMA
* $77,777 — 100 EMA
* $77,562
* $77,447
* $77,298–$77,111
* $76,542–$76,493 — 200 EMA area
* $75,982
* $71,543
A sustained move below $79,800 would weaken the immediate recovery and could expose the $77,777–$77,100 support region. Losing that area would increase the risk of a deeper correction toward the $76,500 zone.
RSI Momentum
* RSI: 49.74
* RSI Signal Average: 41.38
RSI has recovered toward the neutral 50 level and is currently above its signal average. This indicates improving momentum, although bullish strength is not yet firmly established.
A sustained move above 50–55 would support further recovery, while a drop below 45 could indicate renewed selling pressure.
Market Structure & Liquidity
BTC has recovered from the $76,000–$77,000 region and previously rallied toward the $81,000 area. However, the latest price action shows a pullback and consolidation around $80,000.
The current price is trading near the 20 and 50 EMAs, with resistance building around $80,300–$80,450. Buyers need to reclaim the recent resistance levels to confirm that bullish momentum is returning.
The broader recovery remains constructive while BTC holds above the $77,100–$77,700 support region. However, a decisive breakout above $81,509 is needed to strengthen the bullish continuation scenario.
Key Levels
Resistance
* $80,289–$80,447
* $81,018
* $81,509
* $82,297
* $82,872
* $83,916
* $86,523
Support
* $79,814
* $80,058
* $77,777
* $77,562–$77,447
* $77,298–$77,111
* $76,542–$76,493
* $75,982
* $71,543
Final Outlook
BTC is showing early signs of stabilization around $80K, with RSI recovering toward neutral and price trading slightly above its major EMAs.
A sustained move above $80,447 could open the way toward $81,509, followed by $82,872 and $83,916. On the downside, losing $79,814 would increase the risk of a correction toward $77,777–$77,100.
Bias: Neutral to cautiously bullish while holding above $79,800 | Breakout above $81,509 could open the path toward $82,872–$83,916.
These levels are based on the November 4, 2026 chart and represent potential scenarios, not guaranteed price movements.
$BTC
{future}(BTCUSDT)
BTC Technical Outlook: Bitcoin Attempts Recovery Near $80K as Bulls Defend Key Support
Bitcoin is currently trading around $80,137, attempting to recover after a recent pullback from the $81,000–$81,500 region. Price has moved back toward the short-term moving averages, but BTC is still facing resistance around $80,300–$80,450.
The market is showing signs of stabilization after the recent decline. However, buyers need to reclaim the $81,000–$81,500 zone to strengthen the recovery. Holding above the $79,800 area is important to prevent further downside pressure.
EMA Structure
* 20 EMA: $79,814.41
* 50 EMA: $80,058.19
* 100 EMA: $77,777.77
* 200 EMA: $76,493.96
BTC is trading slightly above all four EMAs, suggesting that the broader recovery structure remains intact. However, the 20 and 50 EMAs are close to the current price, making the $79,800–$80,100 region an important short-term support area.
A sustained move above the $80,450 resistance zone would improve the immediate bullish outlook.
Fibonacci Levels
Based on the chart:
* 0.236: Around $79,800
* 0.382: $80,447.51
* 0.5: $82,872.80
* 0.618: Around $100,000
* 0.786: $112,053.30
* 1.0: $123,238.15
BTC is currently trading around the lower Fibonacci retracement area. Reclaiming $80,447 would be an important step toward a recovery, while the next major Fibonacci resistance is near $82,872.
Bullish Scenario
If BTC maintains support above $79,800 and breaks through the nearby resistance zone, buyers could attempt a move toward:
$80,289–$80,447
$81,018
$81,509
$82,297
$82,872
$83,916
$86,523
A sustained breakout above $81,509 would strengthen the short-term recovery structure. A move above $82,872 could open the path toward the $83,916–$86,523 resistance region.
Pullback Scenario
If BTC fails to hold above $79,800 and selling pressure increases, the following support levels become important:
* $79,814 — 20 EMA
* $80,058 — 50 EMA
* $77,777 — 100 EMA
* $77,562
* $77,447
* $77,298–$77,111
* $76,542–$76,493 — 200 EMA area
* $75,982
* $71,543
A sustained move below $79,800 would weaken the immediate recovery and could expose the $77,777–$77,100 support region. Losing that area would increase the risk of a deeper correction toward the $76,500 zone.
RSI Momentum
* RSI: 49.74
* RSI Signal Average: 41.38
RSI has recovered toward the neutral 50 level and is currently above its signal average. This indicates improving momentum, although bullish strength is not yet firmly established.
A sustained move above 50–55 would support further recovery, while a drop below 45 could indicate renewed selling pressure.
Market Structure & Liquidity
BTC has recovered from the $76,000–$77,000 region and previously rallied toward the $81,000 area. However, the latest price action shows a pullback and consolidation around $80,000.
The current price is trading near the 20 and 50 EMAs, with resistance building around $80,300–$80,450. Buyers need to reclaim the recent resistance levels to confirm that bullish momentum is returning.
The broader recovery remains constructive while BTC holds above the $77,100–$77,700 support region. However, a decisive breakout above $81,509 is needed to strengthen the bullish continuation scenario.
Key Levels
Resistance
* $80,289–$80,447
* $81,018
* $81,509
* $82,297
* $82,872
* $83,916
* $86,523
Support
* $79,814
* $80,058
* $77,777
* $77,562–$77,447
* $77,298–$77,111
* $76,542–$76,493
* $75,982
* $71,543
Final Outlook
BTC is showing early signs of stabilization around $80K, with RSI recovering toward neutral and price trading slightly above its major EMAs.
A sustained move above $80,447 could open the way toward $81,509, followed by $82,872 and $83,916. On the downside, losing $79,814 would increase the risk of a correction toward $77,777–$77,100.
Bias: Neutral to cautiously bullish while holding above $79,800 | Breakout above $81,509 could open the path toward $82,872–$83,916.
These levels are based on the November 4, 2026 chart and represent potential scenarios, not guaranteed price movements.
$BTC
The market is showing signs of stabilization after the recent decline. However, buyers need to reclaim the $81,000–$81,500 zone to strengthen the recovery. Holding above the $79,800 area is important to prevent further downside pressure.
EMA Structure
* 20 EMA: $79,814.41
* 50 EMA: $80,058.19
* 100 EMA: $77,777.77
* 200 EMA: $76,493.96
BTC is trading slightly above all four EMAs, suggesting that the broader recovery structure remains intact. However, the 20 and 50 EMAs are close to the current price, making the $79,800–$80,100 region an important short-term support area.
A sustained move above the $80,450 resistance zone would improve the immediate bullish outlook.
Fibonacci Levels
Based on the chart:
* 0.236: Around $79,800
* 0.382: $80,447.51
* 0.5: $82,872.80
* 0.618: Around $100,000
* 0.786: $112,053.30
* 1.0: $123,238.15
BTC is currently trading around the lower Fibonacci retracement area. Reclaiming $80,447 would be an important step toward a recovery, while the next major Fibonacci resistance is near $82,872.
Bullish Scenario
If BTC maintains support above $79,800 and breaks through the nearby resistance zone, buyers could attempt a move toward:
$80,289–$80,447
$81,018
$81,509
$82,297
$82,872
$83,916
$86,523
A sustained breakout above $81,509 would strengthen the short-term recovery structure. A move above $82,872 could open the path toward the $83,916–$86,523 resistance region.
Pullback Scenario
If BTC fails to hold above $79,800 and selling pressure increases, the following support levels become important:
* $79,814 — 20 EMA
* $80,058 — 50 EMA
* $77,777 — 100 EMA
* $77,562
* $77,447
* $77,298–$77,111
* $76,542–$76,493 — 200 EMA area
* $75,982
* $71,543
A sustained move below $79,800 would weaken the immediate recovery and could expose the $77,777–$77,100 support region. Losing that area would increase the risk of a deeper correction toward the $76,500 zone.
RSI Momentum
* RSI: 49.74
* RSI Signal Average: 41.38
RSI has recovered toward the neutral 50 level and is currently above its signal average. This indicates improving momentum, although bullish strength is not yet firmly established.
A sustained move above 50–55 would support further recovery, while a drop below 45 could indicate renewed selling pressure.
Market Structure & Liquidity
BTC has recovered from the $76,000–$77,000 region and previously rallied toward the $81,000 area. However, the latest price action shows a pullback and consolidation around $80,000.
The current price is trading near the 20 and 50 EMAs, with resistance building around $80,300–$80,450. Buyers need to reclaim the recent resistance levels to confirm that bullish momentum is returning.
The broader recovery remains constructive while BTC holds above the $77,100–$77,700 support region. However, a decisive breakout above $81,509 is needed to strengthen the bullish continuation scenario.
Key Levels
Resistance
* $80,289–$80,447
* $81,018
* $81,509
* $82,297
* $82,872
* $83,916
* $86,523
Support
* $79,814
* $80,058
* $77,777
* $77,562–$77,447
* $77,298–$77,111
* $76,542–$76,493
* $75,982
* $71,543
Final Outlook
BTC is showing early signs of stabilization around $80K, with RSI recovering toward neutral and price trading slightly above its major EMAs.
A sustained move above $80,447 could open the way toward $81,509, followed by $82,872 and $83,916. On the downside, losing $79,814 would increase the risk of a correction toward $77,777–$77,100.
Bias: Neutral to cautiously bullish while holding above $79,800 | Breakout above $81,509 could open the path toward $82,872–$83,916.
These levels are based on the November 4, 2026 chart and represent potential scenarios, not guaranteed price movements.
$BTC
485
·
--
Article
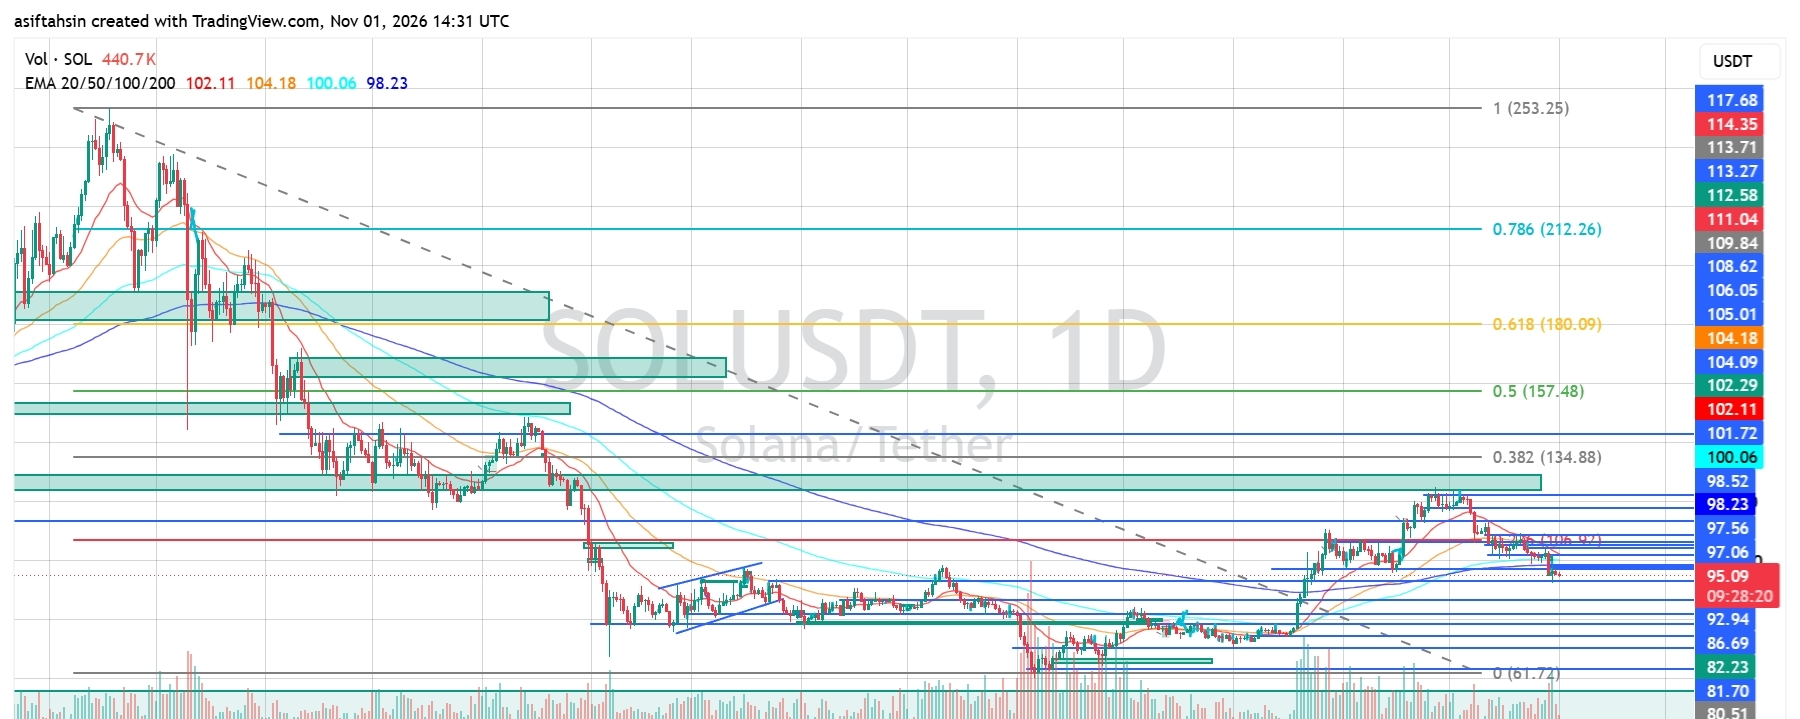
SOL Technical Outlook: Solana Drops Below Major EMAs as Selling Pressure Pushes Price Toward $92 SupSolana is currently trading around $95.07, facing renewed selling pressure after failing to sustain its recovery toward the $98.50–$100 resistance zone. SOL has pulled back from its recent highs and is now trading below all four major EMAs, indicating that short-term momentum has shifted in favor of sellers.
The immediate support area is around $92.94, while RSI has dropped to 29.64, showing that SOL is approaching oversold territory. Buyers need to reclaim the $97.06–$100.06 resistance region to improve the outlook, while losing $92.94 could expose lower support zones.
EMA Structure
* 20 EMA: $102.11
* 50 EMA: $104.18
* 100 EMA: $100.06
* 200 EMA: $98.23
SOL is trading below all four EMAs, indicating a bearish short-term structure.
The 200 EMA near $98.23 is the first important moving-average resistance. Above that, the $100.06–$102.11 region represents another major barrier, followed by the 50 EMA near $104.18.
A sustained recovery above the $100–$104 EMA cluster would be needed to restore stronger bullish momentum.
Fibonacci Levels
Based on your chart:
* 0: $61.72
* 0.236: $106.02
* 0.382: $134.88
* 0.5: $157.48
* 0.618: $180.09
* 0.786: $212.26
* 1.0: $253.25
SOL is trading below the 0.236 Fibonacci region near $106.02, showing that the broader recovery still faces significant resistance.
The first objective for buyers is to reclaim the nearby EMA cluster. A sustained move above $106.02 would provide a stronger recovery signal and potentially open the path toward higher Fibonacci levels.
Bullish Scenario
If SOL holds the $92.94 support area and buyers regain momentum, a recovery could develop toward:
- $97.06–$98.23
- $100.06–$102.11
- $104.18–$106.02
- $108.62–$109.84
- $112.58–$114.35
- $117.68–$121.96
A sustained move above $98.23 would be the first sign of short-term recovery. Reclaiming the $100.06–$104.18 EMA region would strengthen the bullish outlook, while a breakout above $106.02 could open the path toward $112.58–$117.68.
Pullback Scenario
If SOL fails to reclaim the $97.06–$100.06 resistance region and selling pressure continues, watch these support areas:
* $92.94
* $86.69
* $82.23
* $81.70
* $80.51–$79.06
* $61.72 — broader Fibonacci base
A decisive breakdown below $92.94 could expose the $86.69 area first. If selling pressure accelerates and this support fails, the $82.23–$80.51 region could become the next important downside area.
The $61.72 level represents the broader Fibonacci base, not an immediate downside target.
RSI Momentum
* RSI: 29.64
* RSI Signal Average: 36.74
RSI has dropped below 30, indicating that SOL is approaching oversold territory. It is also trading below its signal average, confirming that bearish momentum remains dominant.
A recovery above 30–35 could be an early indication that selling pressure is easing. A sustained move above 40–50 would provide stronger evidence of improving momentum.
However, oversold conditions alone do not guarantee an immediate reversal.
Market Structure & Liquidity
SOL previously recovered from the June low near $61.72 and gradually moved higher, eventually reaching the $98.52–$100 region in October.
However, the latest rejection has pushed price below the major EMA cluster and weakened the recovery structure. The market is now testing whether the $92.94 area can attract buyers and prevent another leg down.
The $97.06–$100.06 region is an important resistance zone that buyers need to reclaim. Until SOL recovers above this area, sellers retain the short-term advantage.
A confirmed breakdown below $92.94 would increase the risk of a deeper correction toward $86.69 and potentially $82.23.
Key Levels
Resistance
* $97.06–$98.23
* $100.06–$102.11
* $104.18–$106.02
* $108.62–$109.84
* $112.58–$114.35
* $117.68–$121.96
Support
* $92.94
* $86.69
* $82.23–$81.70
* $80.51–$79.06
* $61.72
Final Outlook
SOL remains bearish in the short term while trading below the $98.23–$100.06 resistance region. Price is approaching an important support area near $92.94, while RSI indicates that selling pressure is elevated.
A sustained recovery above $100.06 could open the path toward $102.11–$104.18, followed by $106.02. On the downside, losing $92.94 would increase the risk of a deeper correction toward $86.69 and $82.23.
Bias: Bearish below $100.06 | Recovery above $104.18 → $106.02 → $112.58
Analysis based on the SOL/USDT 1D chart dated November 1, 2026. These are technical scenarios, not guaranteed outcomes or financial advice.
SOL Technical Outlook: Solana Drops Below Major EMAs as Selling Pressure Pushes Price Toward $92 Sup
Solana is currently trading around $95.07, facing renewed selling pressure after failing to sustain its recovery toward the $98.50–$100 resistance zone. SOL has pulled back from its recent highs and is now trading below all four major EMAs, indicating that short-term momentum has shifted in favor of sellers.
The immediate support area is around $92.94, while RSI has dropped to 29.64, showing that SOL is approaching oversold territory. Buyers need to reclaim the $97.06–$100.06 resistance region to improve the outlook, while losing $92.94 could expose lower support zones.
EMA Structure
* 20 EMA: $102.11
* 50 EMA: $104.18
* 100 EMA: $100.06
* 200 EMA: $98.23
SOL is trading below all four EMAs, indicating a bearish short-term structure.
The 200 EMA near $98.23 is the first important moving-average resistance. Above that, the $100.06–$102.11 region represents another major barrier, followed by the 50 EMA near $104.18.
A sustained recovery above the $100–$104 EMA cluster would be needed to restore stronger bullish momentum.
Fibonacci Levels
Based on your chart:
* 0: $61.72
* 0.236: $106.02
* 0.382: $134.88
* 0.5: $157.48
* 0.618: $180.09
* 0.786: $212.26
* 1.0: $253.25
SOL is trading below the 0.236 Fibonacci region near $106.02, showing that the broader recovery still faces significant resistance.
The first objective for buyers is to reclaim the nearby EMA cluster. A sustained move above $106.02 would provide a stronger recovery signal and potentially open the path toward higher Fibonacci levels.
Bullish Scenario
If SOL holds the $92.94 support area and buyers regain momentum, a recovery could develop toward:
- $97.06–$98.23
- $100.06–$102.11
- $104.18–$106.02
- $108.62–$109.84
- $112.58–$114.35
- $117.68–$121.96
A sustained move above $98.23 would be the first sign of short-term recovery. Reclaiming the $100.06–$104.18 EMA region would strengthen the bullish outlook, while a breakout above $106.02 could open the path toward $112.58–$117.68.
Pullback Scenario
If SOL fails to reclaim the $97.06–$100.06 resistance region and selling pressure continues, watch these support areas:
* $92.94
* $86.69
* $82.23
* $81.70
* $80.51–$79.06
* $61.72 — broader Fibonacci base
A decisive breakdown below $92.94 could expose the $86.69 area first. If selling pressure accelerates and this support fails, the $82.23–$80.51 region could become the next important downside area.
The $61.72 level represents the broader Fibonacci base, not an immediate downside target.
RSI Momentum
* RSI: 29.64
* RSI Signal Average: 36.74
RSI has dropped below 30, indicating that SOL is approaching oversold territory. It is also trading below its signal average, confirming that bearish momentum remains dominant.
A recovery above 30–35 could be an early indication that selling pressure is easing. A sustained move above 40–50 would provide stronger evidence of improving momentum.
However, oversold conditions alone do not guarantee an immediate reversal.
Market Structure & Liquidity
SOL previously recovered from the June low near $61.72 and gradually moved higher, eventually reaching the $98.52–$100 region in October.
However, the latest rejection has pushed price below the major EMA cluster and weakened the recovery structure. The market is now testing whether the $92.94 area can attract buyers and prevent another leg down.
The $97.06–$100.06 region is an important resistance zone that buyers need to reclaim. Until SOL recovers above this area, sellers retain the short-term advantage.
A confirmed breakdown below $92.94 would increase the risk of a deeper correction toward $86.69 and potentially $82.23.
Key Levels
Resistance
* $97.06–$98.23
* $100.06–$102.11
* $104.18–$106.02
* $108.62–$109.84
* $112.58–$114.35
* $117.68–$121.96
Support
* $92.94
* $86.69
* $82.23–$81.70
* $80.51–$79.06
* $61.72
Final Outlook
SOL remains bearish in the short term while trading below the $98.23–$100.06 resistance region. Price is approaching an important support area near $92.94, while RSI indicates that selling pressure is elevated.
A sustained recovery above $100.06 could open the path toward $102.11–$104.18, followed by $106.02. On the downside, losing $92.94 would increase the risk of a deeper correction toward $86.69 and $82.23.
Bias: Bearish below $100.06 | Recovery above $104.18 → $106.02 → $112.58
Analysis based on the SOL/USDT 1D chart dated November 1, 2026. These are technical scenarios, not guaranteed outcomes or financial advice.
The immediate support area is around $92.94, while RSI has dropped to 29.64, showing that SOL is approaching oversold territory. Buyers need to reclaim the $97.06–$100.06 resistance region to improve the outlook, while losing $92.94 could expose lower support zones.
EMA Structure
* 20 EMA: $102.11
* 50 EMA: $104.18
* 100 EMA: $100.06
* 200 EMA: $98.23
SOL is trading below all four EMAs, indicating a bearish short-term structure.
The 200 EMA near $98.23 is the first important moving-average resistance. Above that, the $100.06–$102.11 region represents another major barrier, followed by the 50 EMA near $104.18.
A sustained recovery above the $100–$104 EMA cluster would be needed to restore stronger bullish momentum.
Fibonacci Levels
Based on your chart:
* 0: $61.72
* 0.236: $106.02
* 0.382: $134.88
* 0.5: $157.48
* 0.618: $180.09
* 0.786: $212.26
* 1.0: $253.25
SOL is trading below the 0.236 Fibonacci region near $106.02, showing that the broader recovery still faces significant resistance.
The first objective for buyers is to reclaim the nearby EMA cluster. A sustained move above $106.02 would provide a stronger recovery signal and potentially open the path toward higher Fibonacci levels.
Bullish Scenario
If SOL holds the $92.94 support area and buyers regain momentum, a recovery could develop toward:
- $97.06–$98.23
- $100.06–$102.11
- $104.18–$106.02
- $108.62–$109.84
- $112.58–$114.35
- $117.68–$121.96
A sustained move above $98.23 would be the first sign of short-term recovery. Reclaiming the $100.06–$104.18 EMA region would strengthen the bullish outlook, while a breakout above $106.02 could open the path toward $112.58–$117.68.
Pullback Scenario
If SOL fails to reclaim the $97.06–$100.06 resistance region and selling pressure continues, watch these support areas:
* $92.94
* $86.69
* $82.23
* $81.70
* $80.51–$79.06
* $61.72 — broader Fibonacci base
A decisive breakdown below $92.94 could expose the $86.69 area first. If selling pressure accelerates and this support fails, the $82.23–$80.51 region could become the next important downside area.
The $61.72 level represents the broader Fibonacci base, not an immediate downside target.
RSI Momentum
* RSI: 29.64
* RSI Signal Average: 36.74
RSI has dropped below 30, indicating that SOL is approaching oversold territory. It is also trading below its signal average, confirming that bearish momentum remains dominant.
A recovery above 30–35 could be an early indication that selling pressure is easing. A sustained move above 40–50 would provide stronger evidence of improving momentum.
However, oversold conditions alone do not guarantee an immediate reversal.
Market Structure & Liquidity
SOL previously recovered from the June low near $61.72 and gradually moved higher, eventually reaching the $98.52–$100 region in October.
However, the latest rejection has pushed price below the major EMA cluster and weakened the recovery structure. The market is now testing whether the $92.94 area can attract buyers and prevent another leg down.
The $97.06–$100.06 region is an important resistance zone that buyers need to reclaim. Until SOL recovers above this area, sellers retain the short-term advantage.
A confirmed breakdown below $92.94 would increase the risk of a deeper correction toward $86.69 and potentially $82.23.
Key Levels
Resistance
* $97.06–$98.23
* $100.06–$102.11
* $104.18–$106.02
* $108.62–$109.84
* $112.58–$114.35
* $117.68–$121.96
Support
* $92.94
* $86.69
* $82.23–$81.70
* $80.51–$79.06
* $61.72
Final Outlook
SOL remains bearish in the short term while trading below the $98.23–$100.06 resistance region. Price is approaching an important support area near $92.94, while RSI indicates that selling pressure is elevated.
A sustained recovery above $100.06 could open the path toward $102.11–$104.18, followed by $106.02. On the downside, losing $92.94 would increase the risk of a deeper correction toward $86.69 and $82.23.
Bias: Bearish below $100.06 | Recovery above $104.18 → $106.02 → $112.58
Analysis based on the SOL/USDT 1D chart dated November 1, 2026. These are technical scenarios, not guaranteed outcomes or financial advice.
1
1
1.8k
·
--
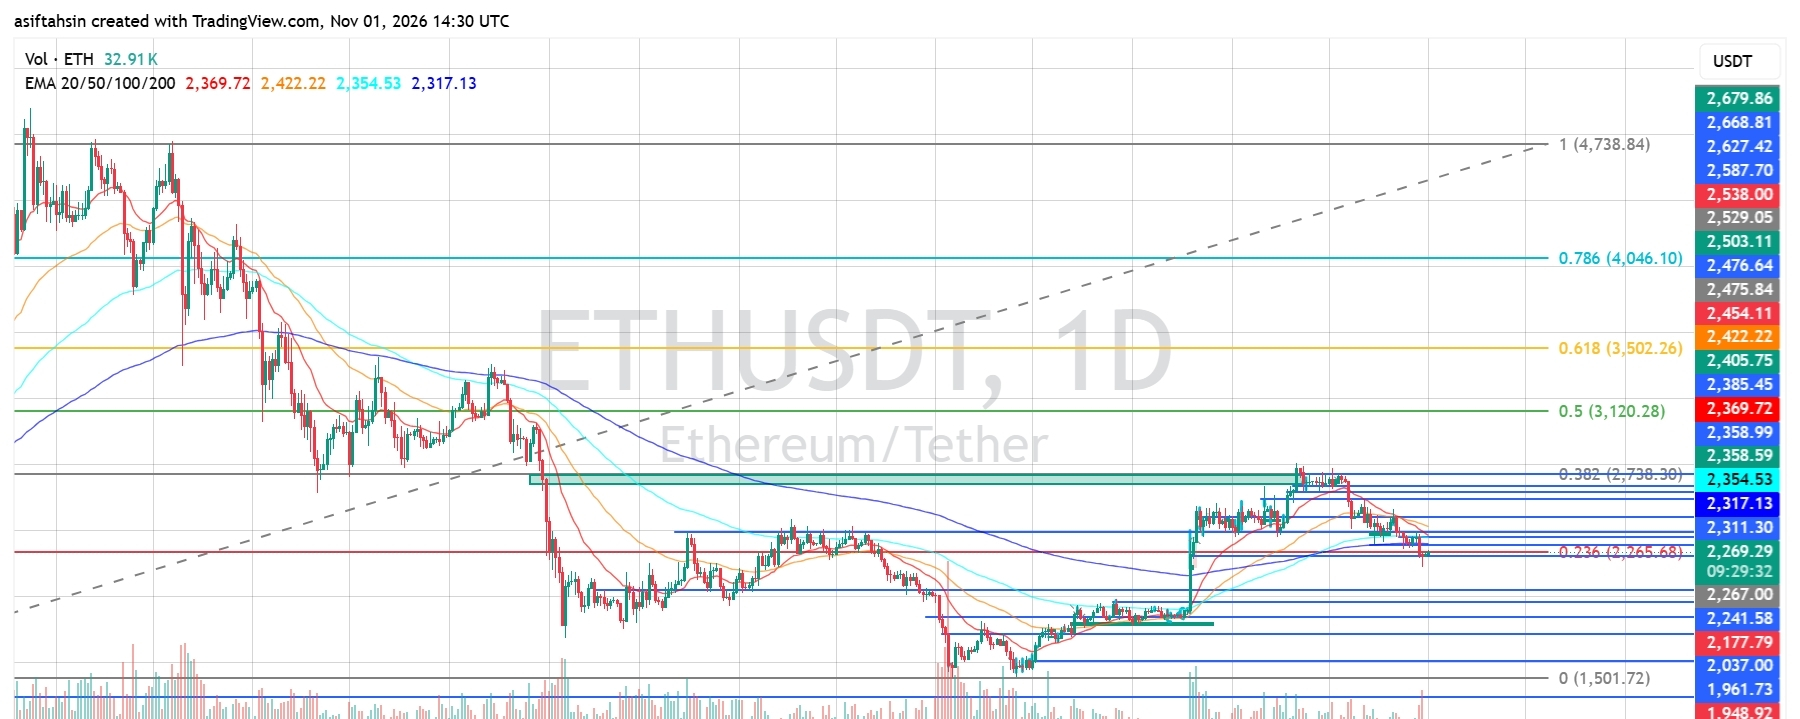
Article
ETH Technical Outlook: Ethereum Breaks Below Key EMAs as Bears Pressure $2,265 SupportEthereum is currently trading around $2,269, facing renewed selling pressure after failing to sustain its recovery toward the $2,475–$2,500 resistance zone. ETH has pulled back from its recent highs and is now testing the important $2,265–$2,267 support area, close to the 0.236 Fibonacci level.
The short-term structure has weakened significantly, with ETH trading below all four major EMAs. RSI has also dropped to 33.92, indicating strong bearish momentum. Buyers need to reclaim the $2,311–$2,370 resistance region to improve the outlook, while losing $2,265 could expose lower support zones.
EMA Structure
* 20 EMA: $2,369.69
* 50 EMA: $2,422.21
* 100 EMA: $2,354.53
* 200 EMA: $2,317.13
ETH is trading below all four EMAs, indicating that sellers currently have control of the short-term structure.
The 200 EMA near $2,317 is the first important moving-average resistance. Above that, the $2,354–$2,370 zone represents another major barrier, followed by the 50 EMA near $2,422.
A sustained recovery above these moving averages would be needed to restore bullish momentum.
Fibonacci Levels
Based on your chart:
* 0: $1,501.72
* 0.236: $2,265.68
* 0.382: $2,738.30
* 0.5: $3,120.28
* 0.618: $3,502.26
* 0.786: $4,046.10
* 1.0: $4,738.84
ETH is currently trading just above the 0.236 Fibonacci level near $2,265.68. This is an important support area to watch.
If buyers defend this level, a relief bounce could develop. However, a confirmed breakdown below it would weaken the broader recovery and increase the risk of further downside.
Bullish Scenario
If ETH holds the $2,265–$2,267 support zone and buyers regain momentum, a recovery could develop toward:
- $2,311–$2,317
- $2,354–$2,370
- $2,385
- $2,422–$2,454
- $2,476–$2,503
- $2,538
A sustained move above $2,317 would be the first sign of recovery. Reclaiming the $2,354–$2,370 EMA zone would strengthen the bullish outlook, while a breakout above $2,422 could open the path toward $2,475–$2,503.
Pullback Scenario
If ETH fails to defend $2,265 and selling pressure continues, watch these support areas:
* $2,265–$2,267 — 0.236 Fibonacci support
* $2,241
* $2,177
* $2,037
* $1,961–$1,948
* $1,904
A decisive breakdown below $2,265 could expose the $2,241 area first, followed by $2,177.
If selling pressure accelerates and these supports fail, the $2,037–$1,961 region could become the next major downside area.
RSI Momentum
* RSI: 33.92
* RSI Signal Average: 36.50
RSI is below the neutral 50 level and remains under its signal average, confirming bearish momentum.
The indicator is approaching oversold territory. A move back above 40 would be an early sign of improving momentum, while a sustained recovery above 50 would provide stronger confirmation of a bullish shift.
However, oversold conditions alone do not guarantee an immediate reversal.
Market Structure & Liquidity
ETH previously recovered from the June low near $1,501 and rallied toward the $2,475–$2,500 region. However, the latest rejection has resulted in a series of lower highs and a loss of several important moving averages.
Price is now testing the $2,265–$2,267 area, which aligns with the 0.236 Fibonacci level. This is a critical point for the current recovery structure.
The market needs to defend this support and reclaim the $2,317–$2,370 region to improve its short-term outlook. A confirmed breakdown below $2,265 would increase the possibility of another leg down toward $2,177 and potentially lower support zones.
Key Levels
Resistance
* $2,311–$2,317
* $2,354–$2,370
* $2,385
* $2,422–$2,454
* $2,476–$2,503
* $2,538
Support
* $2,265–$2,267
* $2,241
* $2,177
* $2,037
* $1,961–$1,948
* $1,904
Final Outlook
ETH remains bearish in the short term while trading below the $2,317–$2,370 resistance region. Price is testing the important $2,265 Fibonacci support, and RSI confirms that selling pressure remains elevated.
A sustained recovery above $2,370 could open the path toward $2,422–$2,454, followed by $2,476–$2,503. On the downside, losing $2,265 would increase the risk of a deeper correction toward $2,241, $2,177, and potentially $2,037.
Bias: Bearish below $2,370 | Recovery above $2,422 → $2,476 → $2,503
$ETH
{future}(ETHUSDT)
ETH Technical Outlook: Ethereum Breaks Below Key EMAs as Bears Pressure $2,265 Support
Ethereum is currently trading around $2,269, facing renewed selling pressure after failing to sustain its recovery toward the $2,475–$2,500 resistance zone. ETH has pulled back from its recent highs and is now testing the important $2,265–$2,267 support area, close to the 0.236 Fibonacci level.
The short-term structure has weakened significantly, with ETH trading below all four major EMAs. RSI has also dropped to 33.92, indicating strong bearish momentum. Buyers need to reclaim the $2,311–$2,370 resistance region to improve the outlook, while losing $2,265 could expose lower support zones.
EMA Structure
* 20 EMA: $2,369.69
* 50 EMA: $2,422.21
* 100 EMA: $2,354.53
* 200 EMA: $2,317.13
ETH is trading below all four EMAs, indicating that sellers currently have control of the short-term structure.
The 200 EMA near $2,317 is the first important moving-average resistance. Above that, the $2,354–$2,370 zone represents another major barrier, followed by the 50 EMA near $2,422.
A sustained recovery above these moving averages would be needed to restore bullish momentum.
Fibonacci Levels
Based on your chart:
* 0: $1,501.72
* 0.236: $2,265.68
* 0.382: $2,738.30
* 0.5: $3,120.28
* 0.618: $3,502.26
* 0.786: $4,046.10
* 1.0: $4,738.84
ETH is currently trading just above the 0.236 Fibonacci level near $2,265.68. This is an important support area to watch.
If buyers defend this level, a relief bounce could develop. However, a confirmed breakdown below it would weaken the broader recovery and increase the risk of further downside.
Bullish Scenario
If ETH holds the $2,265–$2,267 support zone and buyers regain momentum, a recovery could develop toward:
- $2,311–$2,317
- $2,354–$2,370
- $2,385
- $2,422–$2,454
- $2,476–$2,503
- $2,538
A sustained move above $2,317 would be the first sign of recovery. Reclaiming the $2,354–$2,370 EMA zone would strengthen the bullish outlook, while a breakout above $2,422 could open the path toward $2,475–$2,503.
Pullback Scenario
If ETH fails to defend $2,265 and selling pressure continues, watch these support areas:
* $2,265–$2,267 — 0.236 Fibonacci support
* $2,241
* $2,177
* $2,037
* $1,961–$1,948
* $1,904
A decisive breakdown below $2,265 could expose the $2,241 area first, followed by $2,177.
If selling pressure accelerates and these supports fail, the $2,037–$1,961 region could become the next major downside area.
RSI Momentum
* RSI: 33.92
* RSI Signal Average: 36.50
RSI is below the neutral 50 level and remains under its signal average, confirming bearish momentum.
The indicator is approaching oversold territory. A move back above 40 would be an early sign of improving momentum, while a sustained recovery above 50 would provide stronger confirmation of a bullish shift.
However, oversold conditions alone do not guarantee an immediate reversal.
Market Structure & Liquidity
ETH previously recovered from the June low near $1,501 and rallied toward the $2,475–$2,500 region. However, the latest rejection has resulted in a series of lower highs and a loss of several important moving averages.
Price is now testing the $2,265–$2,267 area, which aligns with the 0.236 Fibonacci level. This is a critical point for the current recovery structure.
The market needs to defend this support and reclaim the $2,317–$2,370 region to improve its short-term outlook. A confirmed breakdown below $2,265 would increase the possibility of another leg down toward $2,177 and potentially lower support zones.
Key Levels
Resistance
* $2,311–$2,317
* $2,354–$2,370
* $2,385
* $2,422–$2,454
* $2,476–$2,503
* $2,538
Support
* $2,265–$2,267
* $2,241
* $2,177
* $2,037
* $1,961–$1,948
* $1,904
Final Outlook
ETH remains bearish in the short term while trading below the $2,317–$2,370 resistance region. Price is testing the important $2,265 Fibonacci support, and RSI confirms that selling pressure remains elevated.
A sustained recovery above $2,370 could open the path toward $2,422–$2,454, followed by $2,476–$2,503. On the downside, losing $2,265 would increase the risk of a deeper correction toward $2,241, $2,177, and potentially $2,037.
Bias: Bearish below $2,370 | Recovery above $2,422 → $2,476 → $2,503
$ETH
The short-term structure has weakened significantly, with ETH trading below all four major EMAs. RSI has also dropped to 33.92, indicating strong bearish momentum. Buyers need to reclaim the $2,311–$2,370 resistance region to improve the outlook, while losing $2,265 could expose lower support zones.
EMA Structure
* 20 EMA: $2,369.69
* 50 EMA: $2,422.21
* 100 EMA: $2,354.53
* 200 EMA: $2,317.13
ETH is trading below all four EMAs, indicating that sellers currently have control of the short-term structure.
The 200 EMA near $2,317 is the first important moving-average resistance. Above that, the $2,354–$2,370 zone represents another major barrier, followed by the 50 EMA near $2,422.
A sustained recovery above these moving averages would be needed to restore bullish momentum.
Fibonacci Levels
Based on your chart:
* 0: $1,501.72
* 0.236: $2,265.68
* 0.382: $2,738.30
* 0.5: $3,120.28
* 0.618: $3,502.26
* 0.786: $4,046.10
* 1.0: $4,738.84
ETH is currently trading just above the 0.236 Fibonacci level near $2,265.68. This is an important support area to watch.
If buyers defend this level, a relief bounce could develop. However, a confirmed breakdown below it would weaken the broader recovery and increase the risk of further downside.
Bullish Scenario
If ETH holds the $2,265–$2,267 support zone and buyers regain momentum, a recovery could develop toward:
- $2,311–$2,317
- $2,354–$2,370
- $2,385
- $2,422–$2,454
- $2,476–$2,503
- $2,538
A sustained move above $2,317 would be the first sign of recovery. Reclaiming the $2,354–$2,370 EMA zone would strengthen the bullish outlook, while a breakout above $2,422 could open the path toward $2,475–$2,503.
Pullback Scenario
If ETH fails to defend $2,265 and selling pressure continues, watch these support areas:
* $2,265–$2,267 — 0.236 Fibonacci support
* $2,241
* $2,177
* $2,037
* $1,961–$1,948
* $1,904
A decisive breakdown below $2,265 could expose the $2,241 area first, followed by $2,177.
If selling pressure accelerates and these supports fail, the $2,037–$1,961 region could become the next major downside area.
RSI Momentum
* RSI: 33.92
* RSI Signal Average: 36.50
RSI is below the neutral 50 level and remains under its signal average, confirming bearish momentum.
The indicator is approaching oversold territory. A move back above 40 would be an early sign of improving momentum, while a sustained recovery above 50 would provide stronger confirmation of a bullish shift.
However, oversold conditions alone do not guarantee an immediate reversal.
Market Structure & Liquidity
ETH previously recovered from the June low near $1,501 and rallied toward the $2,475–$2,500 region. However, the latest rejection has resulted in a series of lower highs and a loss of several important moving averages.
Price is now testing the $2,265–$2,267 area, which aligns with the 0.236 Fibonacci level. This is a critical point for the current recovery structure.
The market needs to defend this support and reclaim the $2,317–$2,370 region to improve its short-term outlook. A confirmed breakdown below $2,265 would increase the possibility of another leg down toward $2,177 and potentially lower support zones.
Key Levels
Resistance
* $2,311–$2,317
* $2,354–$2,370
* $2,385
* $2,422–$2,454
* $2,476–$2,503
* $2,538
Support
* $2,265–$2,267
* $2,241
* $2,177
* $2,037
* $1,961–$1,948
* $1,904
Final Outlook
ETH remains bearish in the short term while trading below the $2,317–$2,370 resistance region. Price is testing the important $2,265 Fibonacci support, and RSI confirms that selling pressure remains elevated.
A sustained recovery above $2,370 could open the path toward $2,422–$2,454, followed by $2,476–$2,503. On the downside, losing $2,265 would increase the risk of a deeper correction toward $2,241, $2,177, and potentially $2,037.
Bias: Bearish below $2,370 | Recovery above $2,422 → $2,476 → $2,503
$ETH
1
1
248
·
--
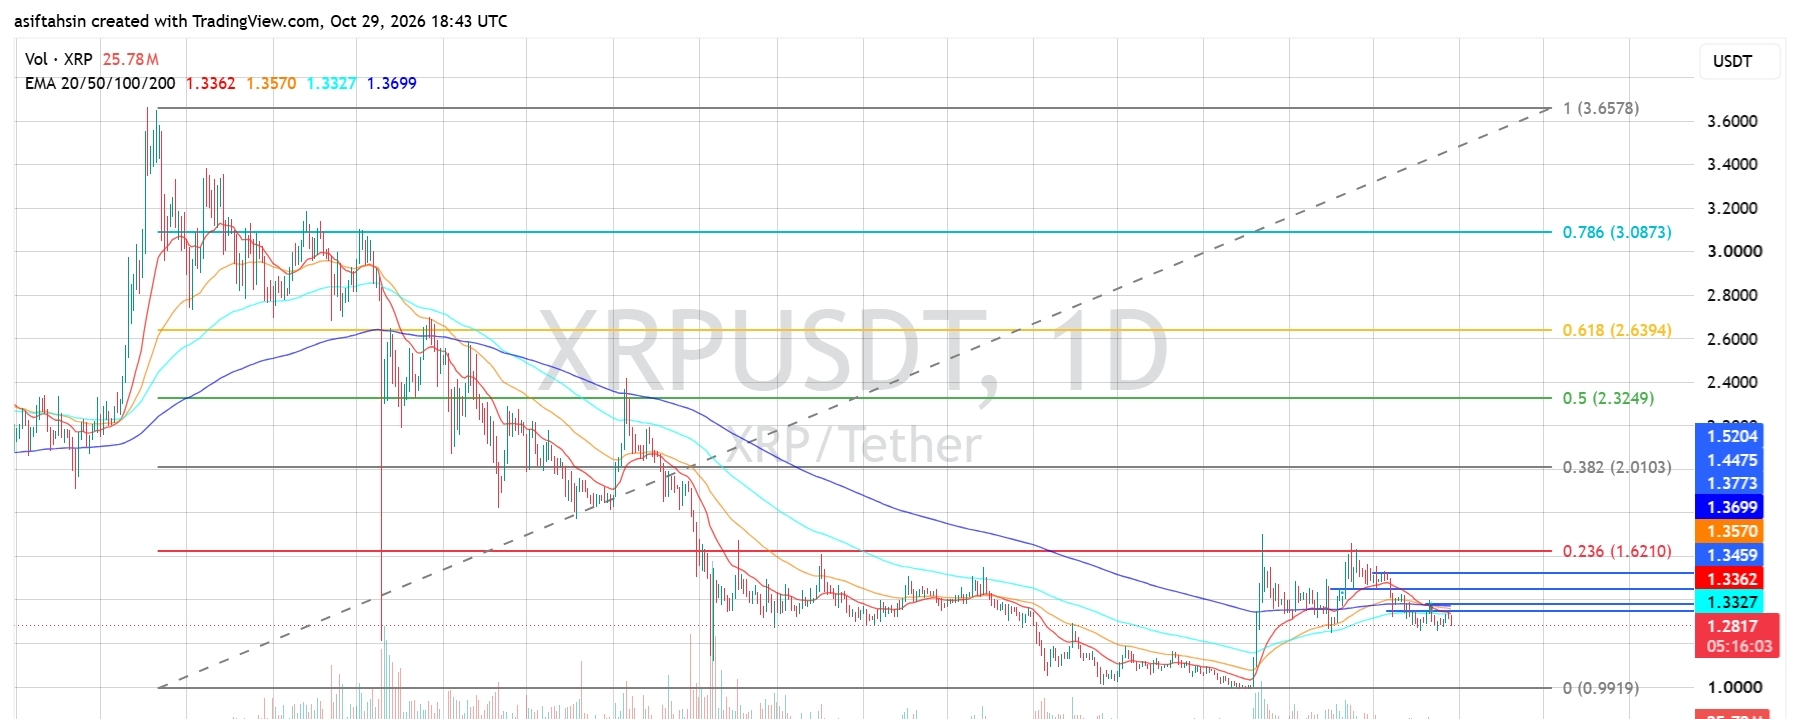
Article
XRP Technical Outlook: XRP Struggles Near $1.28 as Bearish Momentum BuildsXRP is facing renewed selling pressure after failing to sustain its recent recovery toward the $1.35–$1.37 resistance zone. Price is currently trading around $1.2817, with the daily chart showing weakening momentum and price struggling to hold above its key moving averages.
The next move will depend on whether buyers can defend the $1.28 support area or sellers push XRP toward lower support levels.
1. EMA Structure
Current EMA levels:
- EMA 20: $1.3362
- EMA 50: $1.3570
- EMA 100: $1.3327
- EMA 200: $1.3699
XRP is trading below all four EMAs, indicating that sellers currently have control of the daily structure.
The $1.33–$1.37 region is now an important resistance zone. A recovery above this area would improve the short-term outlook, while rejection could keep downward pressure on the price.
2. Fibonacci Levels
Key Fibonacci levels from the chart:
- 0.236: $1.6210
- 0.382: $2.0103
- 0.5: $2.3249
- 0.618: $2.6394
- 0.786: $3.0873
These higher levels represent broader recovery objectives rather than immediate targets. XRP must first reclaim nearby resistance before a larger recovery becomes technically convincing.
3. Bullish Scenario
For buyers to regain momentum, XRP needs to defend the $1.28 area and reclaim the nearby EMA resistance zone.
- First resistance: $1.3327
- Major resistance zone: $1.3362–$1.3570
- Next resistance: $1.3699
- Momentum confirmation: A sustained breakout above $1.37
If XRP breaks above $1.37 and holds, buyers could attempt a stronger recovery. However, a brief move above resistance without follow-through may result in another rejection.
4. Bearish Scenario
The current structure favors caution because XRP remains below its major daily EMAs.
- Immediate support: $1.28
- Next support zone: $1.25–$1.23
- Further downside area: $1.20
- Major historical support: Around $0.99
A confirmed daily breakdown below $1.28 could expose XRP to additional downside. If selling pressure accelerates, the $1.25–$1.23 zone may become the next area to watch.
A loss of these supports would weaken the recovery structure further.
5. Market Structure & Liquidity
XRP's recent recovery from the lows near $1.00 produced a sharp upward move, but the price has since retraced and is consolidating near $1.28.
The chart shows liquidity around the recent local highs and lows. A sweep of either side could trigger a short-term move, but confirmation through a reclaim or breakdown is important before interpreting it as a directional shift.
6. RSI Momentum
- RSI: 38.79
- RSI Moving Average: 40.34
The RSI is below 50, showing that bearish momentum remains dominant. It is approaching the lower part of its neutral range, but it has not yet confirmed a sustained bullish reversal.
A move back above 50 would improve momentum. Continued weakness below 40 would support the possibility of further downside.
7. Key Levels to Watch
Resistance
- $1.3327
- $1.3362
- $1.3570
- $1.3699
Support
- $1.28
- $1.25–$1.23
- $1.20
- $0.99
Final Outlook
XRP remains under pressure on the daily timeframe, trading below EMA 20, EMA 50, EMA 100, and EMA 200. The RSI also indicates weak momentum.
The $1.28 support zone is the immediate level to monitor. Holding it could allow a relief bounce, while a confirmed breakdown may open the door to $1.25–$1.23.
For a stronger bullish recovery, XRP needs to reclaim $1.33–$1.37 and sustain the breakout.
Short-term bias: Bearish below $1.33–$1.37, with $1.28 acting as immediate support.
$XRP
{future}(XRPUSDT)
XRP Technical Outlook: XRP Struggles Near $1.28 as Bearish Momentum Builds
XRP is facing renewed selling pressure after failing to sustain its recent recovery toward the $1.35–$1.37 resistance zone. Price is currently trading around $1.2817, with the daily chart showing weakening momentum and price struggling to hold above its key moving averages.
The next move will depend on whether buyers can defend the $1.28 support area or sellers push XRP toward lower support levels.
1. EMA Structure
Current EMA levels:
- EMA 20: $1.3362
- EMA 50: $1.3570
- EMA 100: $1.3327
- EMA 200: $1.3699
XRP is trading below all four EMAs, indicating that sellers currently have control of the daily structure.
The $1.33–$1.37 region is now an important resistance zone. A recovery above this area would improve the short-term outlook, while rejection could keep downward pressure on the price.
2. Fibonacci Levels
Key Fibonacci levels from the chart:
- 0.236: $1.6210
- 0.382: $2.0103
- 0.5: $2.3249
- 0.618: $2.6394
- 0.786: $3.0873
These higher levels represent broader recovery objectives rather than immediate targets. XRP must first reclaim nearby resistance before a larger recovery becomes technically convincing.
3. Bullish Scenario
For buyers to regain momentum, XRP needs to defend the $1.28 area and reclaim the nearby EMA resistance zone.
- First resistance: $1.3327
- Major resistance zone: $1.3362–$1.3570
- Next resistance: $1.3699
- Momentum confirmation: A sustained breakout above $1.37
If XRP breaks above $1.37 and holds, buyers could attempt a stronger recovery. However, a brief move above resistance without follow-through may result in another rejection.
4. Bearish Scenario
The current structure favors caution because XRP remains below its major daily EMAs.
- Immediate support: $1.28
- Next support zone: $1.25–$1.23
- Further downside area: $1.20
- Major historical support: Around $0.99
A confirmed daily breakdown below $1.28 could expose XRP to additional downside. If selling pressure accelerates, the $1.25–$1.23 zone may become the next area to watch.
A loss of these supports would weaken the recovery structure further.
5. Market Structure & Liquidity
XRP's recent recovery from the lows near $1.00 produced a sharp upward move, but the price has since retraced and is consolidating near $1.28.
The chart shows liquidity around the recent local highs and lows. A sweep of either side could trigger a short-term move, but confirmation through a reclaim or breakdown is important before interpreting it as a directional shift.
6. RSI Momentum
- RSI: 38.79
- RSI Moving Average: 40.34
The RSI is below 50, showing that bearish momentum remains dominant. It is approaching the lower part of its neutral range, but it has not yet confirmed a sustained bullish reversal.
A move back above 50 would improve momentum. Continued weakness below 40 would support the possibility of further downside.
7. Key Levels to Watch
Resistance
- $1.3327
- $1.3362
- $1.3570
- $1.3699
Support
- $1.28
- $1.25–$1.23
- $1.20
- $0.99
Final Outlook
XRP remains under pressure on the daily timeframe, trading below EMA 20, EMA 50, EMA 100, and EMA 200. The RSI also indicates weak momentum.
The $1.28 support zone is the immediate level to monitor. Holding it could allow a relief bounce, while a confirmed breakdown may open the door to $1.25–$1.23.
For a stronger bullish recovery, XRP needs to reclaim $1.33–$1.37 and sustain the breakout.
Short-term bias: Bearish below $1.33–$1.37, with $1.28 acting as immediate support.
$XRP
The next move will depend on whether buyers can defend the $1.28 support area or sellers push XRP toward lower support levels.
1. EMA Structure
Current EMA levels:
- EMA 20: $1.3362
- EMA 50: $1.3570
- EMA 100: $1.3327
- EMA 200: $1.3699
XRP is trading below all four EMAs, indicating that sellers currently have control of the daily structure.
The $1.33–$1.37 region is now an important resistance zone. A recovery above this area would improve the short-term outlook, while rejection could keep downward pressure on the price.
2. Fibonacci Levels
Key Fibonacci levels from the chart:
- 0.236: $1.6210
- 0.382: $2.0103
- 0.5: $2.3249
- 0.618: $2.6394
- 0.786: $3.0873
These higher levels represent broader recovery objectives rather than immediate targets. XRP must first reclaim nearby resistance before a larger recovery becomes technically convincing.
3. Bullish Scenario
For buyers to regain momentum, XRP needs to defend the $1.28 area and reclaim the nearby EMA resistance zone.
- First resistance: $1.3327
- Major resistance zone: $1.3362–$1.3570
- Next resistance: $1.3699
- Momentum confirmation: A sustained breakout above $1.37
If XRP breaks above $1.37 and holds, buyers could attempt a stronger recovery. However, a brief move above resistance without follow-through may result in another rejection.
4. Bearish Scenario
The current structure favors caution because XRP remains below its major daily EMAs.
- Immediate support: $1.28
- Next support zone: $1.25–$1.23
- Further downside area: $1.20
- Major historical support: Around $0.99
A confirmed daily breakdown below $1.28 could expose XRP to additional downside. If selling pressure accelerates, the $1.25–$1.23 zone may become the next area to watch.
A loss of these supports would weaken the recovery structure further.
5. Market Structure & Liquidity
XRP's recent recovery from the lows near $1.00 produced a sharp upward move, but the price has since retraced and is consolidating near $1.28.
The chart shows liquidity around the recent local highs and lows. A sweep of either side could trigger a short-term move, but confirmation through a reclaim or breakdown is important before interpreting it as a directional shift.
6. RSI Momentum
- RSI: 38.79
- RSI Moving Average: 40.34
The RSI is below 50, showing that bearish momentum remains dominant. It is approaching the lower part of its neutral range, but it has not yet confirmed a sustained bullish reversal.
A move back above 50 would improve momentum. Continued weakness below 40 would support the possibility of further downside.
7. Key Levels to Watch
Resistance
- $1.3327
- $1.3362
- $1.3570
- $1.3699
Support
- $1.28
- $1.25–$1.23
- $1.20
- $0.99
Final Outlook
XRP remains under pressure on the daily timeframe, trading below EMA 20, EMA 50, EMA 100, and EMA 200. The RSI also indicates weak momentum.
The $1.28 support zone is the immediate level to monitor. Holding it could allow a relief bounce, while a confirmed breakdown may open the door to $1.25–$1.23.
For a stronger bullish recovery, XRP needs to reclaim $1.33–$1.37 and sustain the breakout.
Short-term bias: Bearish below $1.33–$1.37, with $1.28 acting as immediate support.
$XRP
1
1.3k
·
--
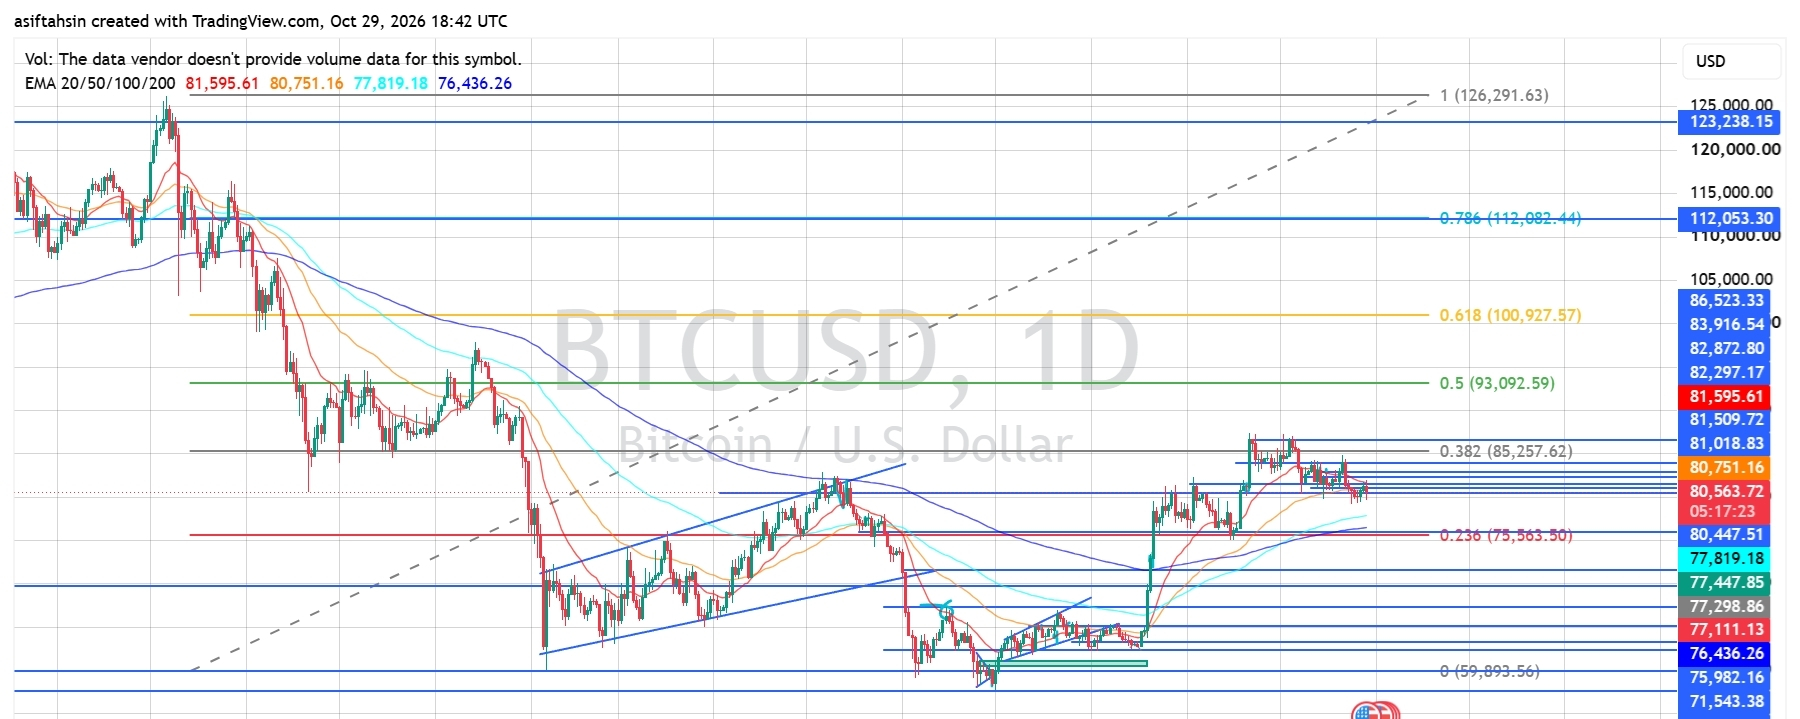
Article
BTC Technical Outlook: Bitcoin Consolidates Near $80,560 as Buyers Defend Key SupportBitcoin (BTC) is trading around $80,564 after facing rejection from the $81,000–$82,000 resistance zone. Following a strong recovery from the June low near $69,893, BTC is now consolidating below recent highs as bullish momentum begins to weaken.
Price is trading below the 20 EMA but remains above the 50 EMA, 100 EMA and 200 EMA. RSI is at 44.61, indicating that momentum remains below neutral. The next move depends on whether buyers can defend the $80,000 region and reclaim resistance or sellers push BTC toward lower support levels.
📈 EMA Structure
🔹 20 EMA: $81,593.62
🔹 50 EMA: $80,750.35
🔹 100 EMA: $77,818.76
🔹 200 EMA: $76,436.05
BTC is trading below the 20 EMA and slightly below the 50 EMA, signaling short-term selling pressure. However, the 100 EMA and 200 EMA remain below the current price and could provide support if the correction deepens.
A sustained recovery above $80,750 would be an early sign of improvement. Reclaiming $81,593 and holding above it would strengthen the short-term bullish structure.
📐 Fibonacci Levels
🔹 0: $69,893.56
🔹 0.236: $75,563.50
🔹 0.382: $85,257.62
🔹 0.5: $93,092.59
🔹 0.618: $100,927.57
🔹 0.786: $112,082.44
🔹 1.0: $126,291.63
BTC is trading below the 0.382 Fibonacci level near $85,257, which remains a major resistance reference. Holding above the $80,000 area could help buyers build another recovery attempt, while a breakdown could expose lower support zones.
🟢 Bullish Scenario
Immediate resistance is around $81,019, followed by $81,510 and $81,593.
Potential upside targets:
🎯 $81,019–$81,593
🎯 $82,297–$83,916
🎯 $85,257
🎯 $86,523
🎯 $93,092
Reclaiming $81,593 would be an early sign of recovery. A stronger move above $82,297–$83,916 could improve bullish momentum and open the way toward $85,257.
If buying pressure increases and BTC breaks above $85,257, the $86,523 region could become the next target, with $93,092 as a broader upside reference.
🔴 Pullback Scenario
Key support levels:
⚠️ $80,447–$80,000
⚠️ $77,819–$77,298
⚠️ $77,111–$76,436
⚠️ $75,982–$75,563
⚠️ $71,543–$69,698
⚠️ $67,236–$65,088
If BTC loses the $80,000 region decisively, price could move toward the 100 EMA near $77,819. A sustained breakdown below $76,436–$75,982 would weaken the recovery structure and expose the $75,563 Fibonacci level.
If selling pressure intensifies further, the $71,543–$69,698 support region could become relevant.
🧠 Market Structure & Liquidity
Recovery → Resistance Rejection → Consolidation → Support Test → Potential Breakout or Breakdown
BTC recovered strongly from its June low near $69,893 and rallied toward the $81,000–$82,000 region. However, repeated resistance near recent highs has slowed the recovery and brought short-term sellers back into focus.
The $80,000–$80,750 region is the immediate decision zone. Holding this area could support another attempt toward $81,593 and $82,297. Losing support could bring the $77,819–$76,436 region into focus.
📊 RSI Momentum
🔹 RSI: 44.61
🔹 RSI MA: 46.74
RSI is below 50 and below its moving average, indicating that short-term momentum remains weak. However, the indicator is not deeply oversold, so further downside remains possible.
A recovery above 50, supported by a price reclaim of $81,593, would suggest improving bullish momentum. Continued weakness alongside a breakdown below $80,000 could increase selling pressure.
🎯 Key Levels
Resistance: $81,019 → $81,510 → $81,593 → $82,297 → $83,916 → $85,257 → $86,523 → $93,092
Support: $80,447 → $80,000 → $77,819 → $77,298 → $77,111 → $76,436 → $75,982 → $75,563 → $71,543 → $69,698
📌 Final Outlook
BTC's short-term momentum has weakened as price trades below the 20 EMA and 50 EMA, with RSI at 44.61 reflecting continued selling pressure.
The immediate battle is around $80,000–$80,750. Holding this region could allow a recovery toward $81,593 and $82,297. A sustained breakout above $83,916 would strengthen the bullish outlook.
On the downside, losing $80,000 could expose $77,819 and $76,436, followed by the $75,563 Fibonacci support.
Bias: Short-term cautious below $81,593–$83,916. Holding $80,000 could support a relief bounce, while a confirmed breakdown below $76,436 would increase downside risk.
$BTC
{future}(BTCUSDT)
BTC Technical Outlook: Bitcoin Consolidates Near $80,560 as Buyers Defend Key Support
Bitcoin (BTC) is trading around $80,564 after facing rejection from the $81,000–$82,000 resistance zone. Following a strong recovery from the June low near $69,893, BTC is now consolidating below recent highs as bullish momentum begins to weaken.
Price is trading below the 20 EMA but remains above the 50 EMA, 100 EMA and 200 EMA. RSI is at 44.61, indicating that momentum remains below neutral. The next move depends on whether buyers can defend the $80,000 region and reclaim resistance or sellers push BTC toward lower support levels.
📈 EMA Structure
🔹 20 EMA: $81,593.62
🔹 50 EMA: $80,750.35
🔹 100 EMA: $77,818.76
🔹 200 EMA: $76,436.05
BTC is trading below the 20 EMA and slightly below the 50 EMA, signaling short-term selling pressure. However, the 100 EMA and 200 EMA remain below the current price and could provide support if the correction deepens.
A sustained recovery above $80,750 would be an early sign of improvement. Reclaiming $81,593 and holding above it would strengthen the short-term bullish structure.
📐 Fibonacci Levels
🔹 0: $69,893.56
🔹 0.236: $75,563.50
🔹 0.382: $85,257.62
🔹 0.5: $93,092.59
🔹 0.618: $100,927.57
🔹 0.786: $112,082.44
🔹 1.0: $126,291.63
BTC is trading below the 0.382 Fibonacci level near $85,257, which remains a major resistance reference. Holding above the $80,000 area could help buyers build another recovery attempt, while a breakdown could expose lower support zones.
🟢 Bullish Scenario
Immediate resistance is around $81,019, followed by $81,510 and $81,593.
Potential upside targets:
🎯 $81,019–$81,593
🎯 $82,297–$83,916
🎯 $85,257
🎯 $86,523
🎯 $93,092
Reclaiming $81,593 would be an early sign of recovery. A stronger move above $82,297–$83,916 could improve bullish momentum and open the way toward $85,257.
If buying pressure increases and BTC breaks above $85,257, the $86,523 region could become the next target, with $93,092 as a broader upside reference.
🔴 Pullback Scenario
Key support levels:
⚠️ $80,447–$80,000
⚠️ $77,819–$77,298
⚠️ $77,111–$76,436
⚠️ $75,982–$75,563
⚠️ $71,543–$69,698
⚠️ $67,236–$65,088
If BTC loses the $80,000 region decisively, price could move toward the 100 EMA near $77,819. A sustained breakdown below $76,436–$75,982 would weaken the recovery structure and expose the $75,563 Fibonacci level.
If selling pressure intensifies further, the $71,543–$69,698 support region could become relevant.
🧠 Market Structure & Liquidity
Recovery → Resistance Rejection → Consolidation → Support Test → Potential Breakout or Breakdown
BTC recovered strongly from its June low near $69,893 and rallied toward the $81,000–$82,000 region. However, repeated resistance near recent highs has slowed the recovery and brought short-term sellers back into focus.
The $80,000–$80,750 region is the immediate decision zone. Holding this area could support another attempt toward $81,593 and $82,297. Losing support could bring the $77,819–$76,436 region into focus.
📊 RSI Momentum
🔹 RSI: 44.61
🔹 RSI MA: 46.74
RSI is below 50 and below its moving average, indicating that short-term momentum remains weak. However, the indicator is not deeply oversold, so further downside remains possible.
A recovery above 50, supported by a price reclaim of $81,593, would suggest improving bullish momentum. Continued weakness alongside a breakdown below $80,000 could increase selling pressure.
🎯 Key Levels
Resistance: $81,019 → $81,510 → $81,593 → $82,297 → $83,916 → $85,257 → $86,523 → $93,092
Support: $80,447 → $80,000 → $77,819 → $77,298 → $77,111 → $76,436 → $75,982 → $75,563 → $71,543 → $69,698
📌 Final Outlook
BTC's short-term momentum has weakened as price trades below the 20 EMA and 50 EMA, with RSI at 44.61 reflecting continued selling pressure.
The immediate battle is around $80,000–$80,750. Holding this region could allow a recovery toward $81,593 and $82,297. A sustained breakout above $83,916 would strengthen the bullish outlook.
On the downside, losing $80,000 could expose $77,819 and $76,436, followed by the $75,563 Fibonacci support.
Bias: Short-term cautious below $81,593–$83,916. Holding $80,000 could support a relief bounce, while a confirmed breakdown below $76,436 would increase downside risk.
$BTC
Price is trading below the 20 EMA but remains above the 50 EMA, 100 EMA and 200 EMA. RSI is at 44.61, indicating that momentum remains below neutral. The next move depends on whether buyers can defend the $80,000 region and reclaim resistance or sellers push BTC toward lower support levels.
📈 EMA Structure
🔹 20 EMA: $81,593.62
🔹 50 EMA: $80,750.35
🔹 100 EMA: $77,818.76
🔹 200 EMA: $76,436.05
BTC is trading below the 20 EMA and slightly below the 50 EMA, signaling short-term selling pressure. However, the 100 EMA and 200 EMA remain below the current price and could provide support if the correction deepens.
A sustained recovery above $80,750 would be an early sign of improvement. Reclaiming $81,593 and holding above it would strengthen the short-term bullish structure.
📐 Fibonacci Levels
🔹 0: $69,893.56
🔹 0.236: $75,563.50
🔹 0.382: $85,257.62
🔹 0.5: $93,092.59
🔹 0.618: $100,927.57
🔹 0.786: $112,082.44
🔹 1.0: $126,291.63
BTC is trading below the 0.382 Fibonacci level near $85,257, which remains a major resistance reference. Holding above the $80,000 area could help buyers build another recovery attempt, while a breakdown could expose lower support zones.
🟢 Bullish Scenario
Immediate resistance is around $81,019, followed by $81,510 and $81,593.
Potential upside targets:
🎯 $81,019–$81,593
🎯 $82,297–$83,916
🎯 $85,257
🎯 $86,523
🎯 $93,092
Reclaiming $81,593 would be an early sign of recovery. A stronger move above $82,297–$83,916 could improve bullish momentum and open the way toward $85,257.
If buying pressure increases and BTC breaks above $85,257, the $86,523 region could become the next target, with $93,092 as a broader upside reference.
🔴 Pullback Scenario
Key support levels:
⚠️ $80,447–$80,000
⚠️ $77,819–$77,298
⚠️ $77,111–$76,436
⚠️ $75,982–$75,563
⚠️ $71,543–$69,698
⚠️ $67,236–$65,088
If BTC loses the $80,000 region decisively, price could move toward the 100 EMA near $77,819. A sustained breakdown below $76,436–$75,982 would weaken the recovery structure and expose the $75,563 Fibonacci level.
If selling pressure intensifies further, the $71,543–$69,698 support region could become relevant.
🧠 Market Structure & Liquidity
Recovery → Resistance Rejection → Consolidation → Support Test → Potential Breakout or Breakdown
BTC recovered strongly from its June low near $69,893 and rallied toward the $81,000–$82,000 region. However, repeated resistance near recent highs has slowed the recovery and brought short-term sellers back into focus.
The $80,000–$80,750 region is the immediate decision zone. Holding this area could support another attempt toward $81,593 and $82,297. Losing support could bring the $77,819–$76,436 region into focus.
📊 RSI Momentum
🔹 RSI: 44.61
🔹 RSI MA: 46.74
RSI is below 50 and below its moving average, indicating that short-term momentum remains weak. However, the indicator is not deeply oversold, so further downside remains possible.
A recovery above 50, supported by a price reclaim of $81,593, would suggest improving bullish momentum. Continued weakness alongside a breakdown below $80,000 could increase selling pressure.
🎯 Key Levels
Resistance: $81,019 → $81,510 → $81,593 → $82,297 → $83,916 → $85,257 → $86,523 → $93,092
Support: $80,447 → $80,000 → $77,819 → $77,298 → $77,111 → $76,436 → $75,982 → $75,563 → $71,543 → $69,698
📌 Final Outlook
BTC's short-term momentum has weakened as price trades below the 20 EMA and 50 EMA, with RSI at 44.61 reflecting continued selling pressure.
The immediate battle is around $80,000–$80,750. Holding this region could allow a recovery toward $81,593 and $82,297. A sustained breakout above $83,916 would strengthen the bullish outlook.
On the downside, losing $80,000 could expose $77,819 and $76,436, followed by the $75,563 Fibonacci support.
Bias: Short-term cautious below $81,593–$83,916. Holding $80,000 could support a relief bounce, while a confirmed breakdown below $76,436 would increase downside risk.
$BTC
120
·
--
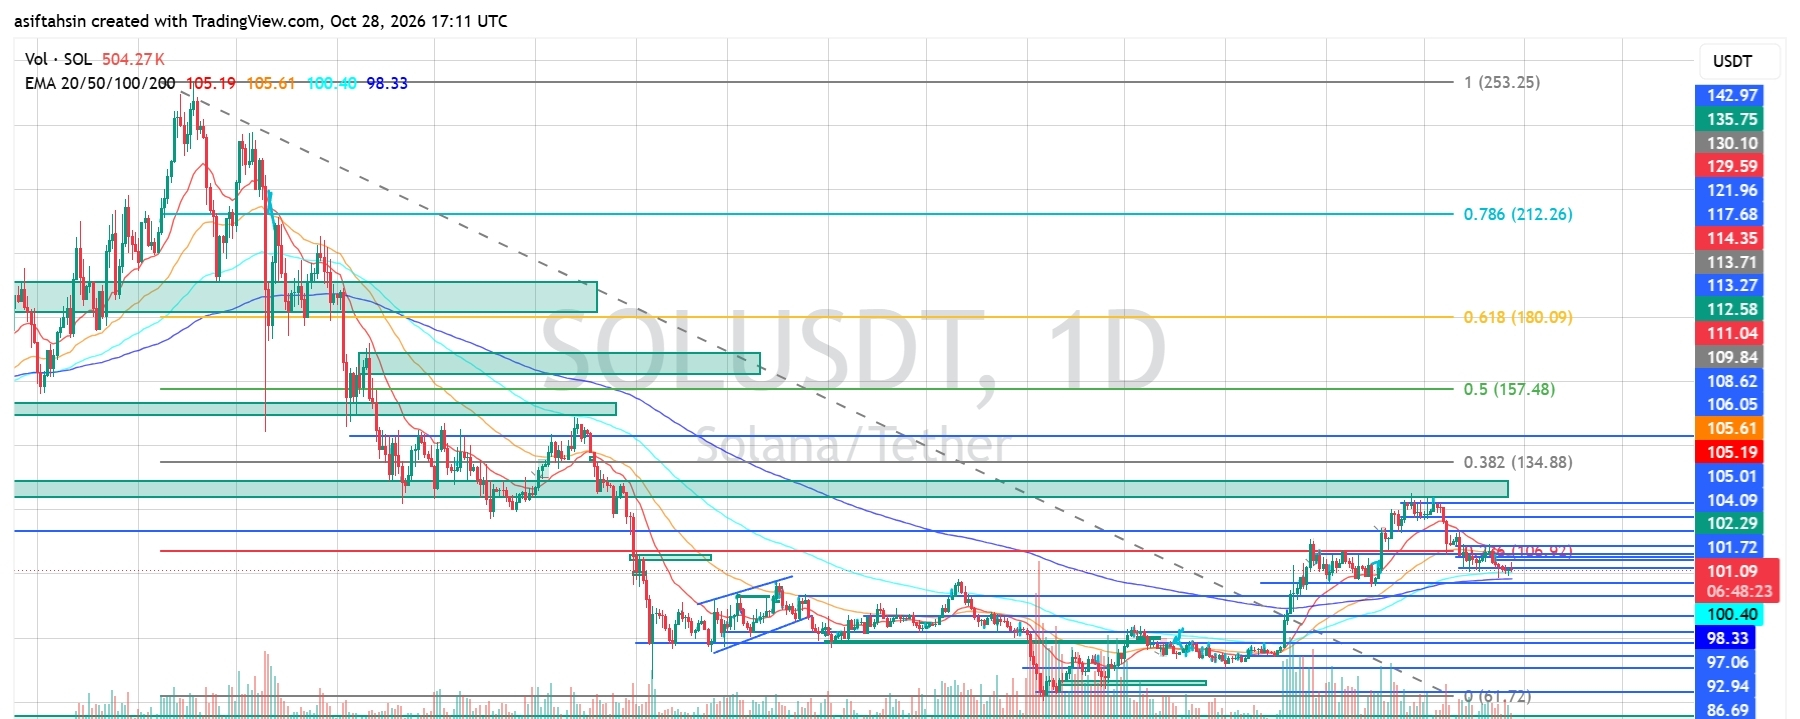
Article
SOL Technical Outlook: Solana Faces Selling Pressure Near $101 as Key Support Is TestedSolana (SOL) is trading around $101.08 after facing rejection from the $104–$105 resistance zone. Following a strong recovery from the June low near $81.72, SOL rallied above $100 before losing momentum and pulling back toward its short-term support levels.
Price is now trading below the 20 EMA and 50 EMA, while RSI has dropped to 35.98, indicating increasing bearish pressure. Buyers need to defend the $100–$101 region and reclaim nearby resistance to prevent a deeper correction.
📈 EMA Structure
🔹 20 EMA: $105.19
🔹 50 EMA: $105.61
🔹 100 EMA: $100.40
🔹 200 EMA: $98.33
SOL is trading below the 20 EMA and 50 EMA, indicating short-term bearish pressure. The 100 EMA near $100.40 is an immediate support reference, while the 200 EMA near $98.33 could become important if selling continues.
A sustained recovery above $102.29 would be an early sign of improvement. Reclaiming $105.19–$105.61 would provide stronger evidence of a bullish recovery.
📐 Fibonacci Levels
🔹 0: $61.72
🔹 0.236: $75.04
🔹 0.382: $134.88
🔹 0.5: $157.48
🔹 0.618: $180.09
🔹 0.786: $212.26
🔹 1.0: $253.25
SOL is trading well below the higher Fibonacci retracement levels, with immediate price action focused on nearby horizontal support and resistance. The $100–$101 area is the key short-term decision zone, while a recovery above $105 could improve the technical structure.
🟢 Bullish Scenario
Immediate resistance is around $101.72, followed by $102.29 and $104.09.
Potential upside targets:
🎯 $102.29–$104.09
🎯 $105.01–$106.05
🎯 $108.62–$109.84
🎯 $111.04–$114.35
🎯 $117.68–$121.96
Reclaiming $102.29 would be an early sign that buyers are returning. A stronger move above $104.09–$105.61 could open the way toward $106.05 and $108.62.
If buying pressure increases and SOL reclaims the 20 EMA and 50 EMA, the $109.84–$114.35 region could become a potential upside target.
🔴 Pullback Scenario
Key support levels:
⚠️ $101.08–$100.40
⚠️ $98.33–$97.06
⚠️ $92.94
⚠️ $86.69–$82.23
⚠️ $81.70
If SOL loses $100.40 decisively, price could retest the 200 EMA near $98.33. A sustained breakdown below $97.06 could expose the $92.94 support level.
If selling pressure accelerates further, the $86.69–$82.23 region could become relevant, with $81.70 as a broader support reference.
🧠 Market Structure & Liquidity
Recovery → Resistance Rejection → Pullback → Support Test → Potential Bounce or Breakdown
SOL recovered strongly from its June low near $81.72 and rallied toward the $104–$105 region. However, the recent rejection has brought sellers back into control in the short term.
The $100.40–$102.29 region is the immediate decision zone. Holding this area could support a bounce toward $104.09 and $105.61. Losing the 100 EMA could bring the $98.33–$97.06 support zone into focus.
📊 RSI Momentum
🔹 RSI: 35.98
🔹 RSI MA: 38.94
RSI is below 50 and below its moving average, confirming weak momentum. The indicator is approaching oversold territory, but this does not guarantee an immediate reversal.
A recovery above 40–45, supported by a price reclaim of $102.29, would suggest improving momentum. Continued weakness alongside a breakdown below $100.40 could increase downside pressure.
🎯 Key Levels
Resistance: $101.72 → $102.29 → $104.09 → $105.01 → $105.61 → $106.05 → $108.62 → $109.84 → $111.04 → $114.35
Support: $101.08 → $100.40 → $98.33 → $97.06 → $92.94 → $86.69 → $82.23 → $81.70
📌 Final Outlook
SOL's short-term structure has weakened below the 20 EMA and 50 EMA, with RSI at 35.98 reflecting persistent selling pressure.
The immediate battle is around $100.40–$102.29. Holding this zone could support a recovery toward $104.09 and $105.61. A sustained breakout above $105.61 would provide stronger evidence of a bullish recovery.
On the downside, losing $100.40 could expose $98.33 and $97.06, with $92.94 as the next important support reference.
Bias: Short-term bearish below $105.19–$105.61. Holding $100.40–$102.29 could allow a relief bounce, while a confirmed breakdown below $98.33 would increase downside risk.
$SOL
{future}(SOLUSDT)
SOL Technical Outlook: Solana Faces Selling Pressure Near $101 as Key Support Is Tested
Solana (SOL) is trading around $101.08 after facing rejection from the $104–$105 resistance zone. Following a strong recovery from the June low near $81.72, SOL rallied above $100 before losing momentum and pulling back toward its short-term support levels.
Price is now trading below the 20 EMA and 50 EMA, while RSI has dropped to 35.98, indicating increasing bearish pressure. Buyers need to defend the $100–$101 region and reclaim nearby resistance to prevent a deeper correction.
📈 EMA Structure
🔹 20 EMA: $105.19
🔹 50 EMA: $105.61
🔹 100 EMA: $100.40
🔹 200 EMA: $98.33
SOL is trading below the 20 EMA and 50 EMA, indicating short-term bearish pressure. The 100 EMA near $100.40 is an immediate support reference, while the 200 EMA near $98.33 could become important if selling continues.
A sustained recovery above $102.29 would be an early sign of improvement. Reclaiming $105.19–$105.61 would provide stronger evidence of a bullish recovery.
📐 Fibonacci Levels
🔹 0: $61.72
🔹 0.236: $75.04
🔹 0.382: $134.88
🔹 0.5: $157.48
🔹 0.618: $180.09
🔹 0.786: $212.26
🔹 1.0: $253.25
SOL is trading well below the higher Fibonacci retracement levels, with immediate price action focused on nearby horizontal support and resistance. The $100–$101 area is the key short-term decision zone, while a recovery above $105 could improve the technical structure.
🟢 Bullish Scenario
Immediate resistance is around $101.72, followed by $102.29 and $104.09.
Potential upside targets:
🎯 $102.29–$104.09
🎯 $105.01–$106.05
🎯 $108.62–$109.84
🎯 $111.04–$114.35
🎯 $117.68–$121.96
Reclaiming $102.29 would be an early sign that buyers are returning. A stronger move above $104.09–$105.61 could open the way toward $106.05 and $108.62.
If buying pressure increases and SOL reclaims the 20 EMA and 50 EMA, the $109.84–$114.35 region could become a potential upside target.
🔴 Pullback Scenario
Key support levels:
⚠️ $101.08–$100.40
⚠️ $98.33–$97.06
⚠️ $92.94
⚠️ $86.69–$82.23
⚠️ $81.70
If SOL loses $100.40 decisively, price could retest the 200 EMA near $98.33. A sustained breakdown below $97.06 could expose the $92.94 support level.
If selling pressure accelerates further, the $86.69–$82.23 region could become relevant, with $81.70 as a broader support reference.
🧠 Market Structure & Liquidity
Recovery → Resistance Rejection → Pullback → Support Test → Potential Bounce or Breakdown
SOL recovered strongly from its June low near $81.72 and rallied toward the $104–$105 region. However, the recent rejection has brought sellers back into control in the short term.
The $100.40–$102.29 region is the immediate decision zone. Holding this area could support a bounce toward $104.09 and $105.61. Losing the 100 EMA could bring the $98.33–$97.06 support zone into focus.
📊 RSI Momentum
🔹 RSI: 35.98
🔹 RSI MA: 38.94
RSI is below 50 and below its moving average, confirming weak momentum. The indicator is approaching oversold territory, but this does not guarantee an immediate reversal.
A recovery above 40–45, supported by a price reclaim of $102.29, would suggest improving momentum. Continued weakness alongside a breakdown below $100.40 could increase downside pressure.
🎯 Key Levels
Resistance: $101.72 → $102.29 → $104.09 → $105.01 → $105.61 → $106.05 → $108.62 → $109.84 → $111.04 → $114.35
Support: $101.08 → $100.40 → $98.33 → $97.06 → $92.94 → $86.69 → $82.23 → $81.70
📌 Final Outlook
SOL's short-term structure has weakened below the 20 EMA and 50 EMA, with RSI at 35.98 reflecting persistent selling pressure.
The immediate battle is around $100.40–$102.29. Holding this zone could support a recovery toward $104.09 and $105.61. A sustained breakout above $105.61 would provide stronger evidence of a bullish recovery.
On the downside, losing $100.40 could expose $98.33 and $97.06, with $92.94 as the next important support reference.
Bias: Short-term bearish below $105.19–$105.61. Holding $100.40–$102.29 could allow a relief bounce, while a confirmed breakdown below $98.33 would increase downside risk.
$SOL
Price is now trading below the 20 EMA and 50 EMA, while RSI has dropped to 35.98, indicating increasing bearish pressure. Buyers need to defend the $100–$101 region and reclaim nearby resistance to prevent a deeper correction.
📈 EMA Structure
🔹 20 EMA: $105.19
🔹 50 EMA: $105.61
🔹 100 EMA: $100.40
🔹 200 EMA: $98.33
SOL is trading below the 20 EMA and 50 EMA, indicating short-term bearish pressure. The 100 EMA near $100.40 is an immediate support reference, while the 200 EMA near $98.33 could become important if selling continues.
A sustained recovery above $102.29 would be an early sign of improvement. Reclaiming $105.19–$105.61 would provide stronger evidence of a bullish recovery.
📐 Fibonacci Levels
🔹 0: $61.72
🔹 0.236: $75.04
🔹 0.382: $134.88
🔹 0.5: $157.48
🔹 0.618: $180.09
🔹 0.786: $212.26
🔹 1.0: $253.25
SOL is trading well below the higher Fibonacci retracement levels, with immediate price action focused on nearby horizontal support and resistance. The $100–$101 area is the key short-term decision zone, while a recovery above $105 could improve the technical structure.
🟢 Bullish Scenario
Immediate resistance is around $101.72, followed by $102.29 and $104.09.
Potential upside targets:
🎯 $102.29–$104.09
🎯 $105.01–$106.05
🎯 $108.62–$109.84
🎯 $111.04–$114.35
🎯 $117.68–$121.96
Reclaiming $102.29 would be an early sign that buyers are returning. A stronger move above $104.09–$105.61 could open the way toward $106.05 and $108.62.
If buying pressure increases and SOL reclaims the 20 EMA and 50 EMA, the $109.84–$114.35 region could become a potential upside target.
🔴 Pullback Scenario
Key support levels:
⚠️ $101.08–$100.40
⚠️ $98.33–$97.06
⚠️ $92.94
⚠️ $86.69–$82.23
⚠️ $81.70
If SOL loses $100.40 decisively, price could retest the 200 EMA near $98.33. A sustained breakdown below $97.06 could expose the $92.94 support level.
If selling pressure accelerates further, the $86.69–$82.23 region could become relevant, with $81.70 as a broader support reference.
🧠 Market Structure & Liquidity
Recovery → Resistance Rejection → Pullback → Support Test → Potential Bounce or Breakdown
SOL recovered strongly from its June low near $81.72 and rallied toward the $104–$105 region. However, the recent rejection has brought sellers back into control in the short term.
The $100.40–$102.29 region is the immediate decision zone. Holding this area could support a bounce toward $104.09 and $105.61. Losing the 100 EMA could bring the $98.33–$97.06 support zone into focus.
📊 RSI Momentum
🔹 RSI: 35.98
🔹 RSI MA: 38.94
RSI is below 50 and below its moving average, confirming weak momentum. The indicator is approaching oversold territory, but this does not guarantee an immediate reversal.
A recovery above 40–45, supported by a price reclaim of $102.29, would suggest improving momentum. Continued weakness alongside a breakdown below $100.40 could increase downside pressure.
🎯 Key Levels
Resistance: $101.72 → $102.29 → $104.09 → $105.01 → $105.61 → $106.05 → $108.62 → $109.84 → $111.04 → $114.35
Support: $101.08 → $100.40 → $98.33 → $97.06 → $92.94 → $86.69 → $82.23 → $81.70
📌 Final Outlook
SOL's short-term structure has weakened below the 20 EMA and 50 EMA, with RSI at 35.98 reflecting persistent selling pressure.
The immediate battle is around $100.40–$102.29. Holding this zone could support a recovery toward $104.09 and $105.61. A sustained breakout above $105.61 would provide stronger evidence of a bullish recovery.
On the downside, losing $100.40 could expose $98.33 and $97.06, with $92.94 as the next important support reference.
Bias: Short-term bearish below $105.19–$105.61. Holding $100.40–$102.29 could allow a relief bounce, while a confirmed breakdown below $98.33 would increase downside risk.
$SOL
1
2
785
Log in to explore more content
Join global crypto users on Binance Square
⚡️ Get latest and useful information about crypto.
💬 Trusted by the world’s largest crypto exchange.
👍 Discover real insights from verified creators.
Email / Phone number
Trending Topics
BitcoinRebounds$75KAsChipsLead
5,485 views
105 Discussing
Market Watch | Bitcoin Rebounds to $75,600 After Dip Below $75,000 as Chip Stocks Lead Rally on Jobs Beat
Binance News
·12 Likes
·4.4k views
JobsReportRaisesHikeOdds
85,151 views
856 Discussing
US Data Center Rules May Constrain AI Expansion
10,637 views
94 Discussing