
Cheryl Speece
5.2k Posts

Cheryl Speece
Report
Block User
执行力决定采样率,数据决定梯度。
896 Following
589 Followers
685 Liked
Posts
All
Quotes
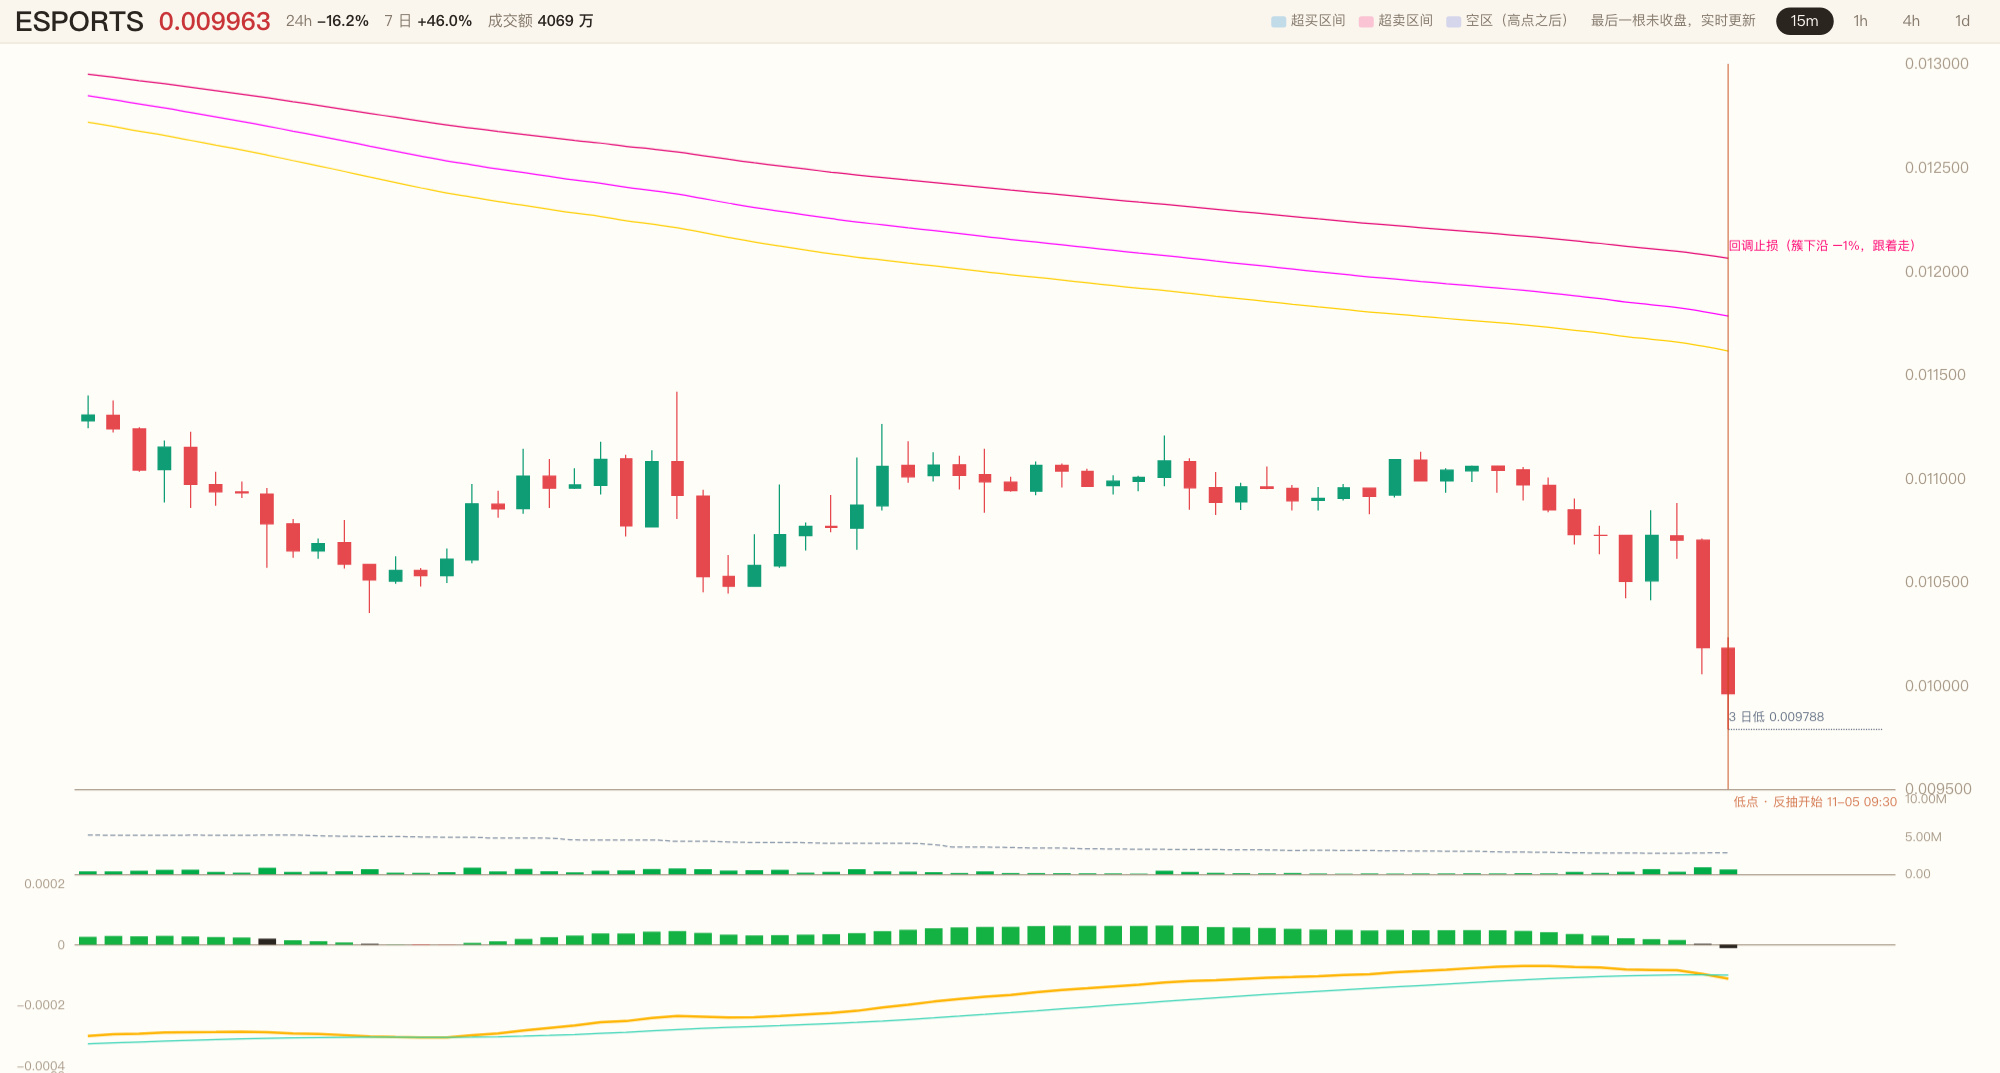
😤 The low at 0.010411 held for 12 hours. Then a 15m candle on 2.5x volume smashed straight through it, closing at 0.010183.
$ESPORTS That wasn’t a grind lower—it was a dump. Price is sliding down along the moving-average cluster, now 15.69% below its upper edge.
🔥 Here’s the bull-bear standoff: on one side, bears have been in control for nearly 96 candles, with bearish alignment in 85% of them and a combined multi-timeframe score of -6—a bearish confluence. On the other, price has already fallen 12.5% below the moving-average cluster, and there’s still no sign of an oversold bounce.
💀 Only three of the four key indicators are lit. This isn’t a spot to chase a short—it’s a spot to wait for a rebound.
👀 Here’s the plan: no short for now. If it rebounds to the lower edge of the moving-average cluster at 0.011638 and can’t get above it, I’ll consider shorting. If it gets above it, the trade is off.
⚡ 0.010183 is where price just got dumped to; 0.011638 is the line I’ve drawn—the question is, will it rebound and test that level, or keep heading down without looking back?
Here are the three charts. Are you betting on a rebound to 0.011638, or a straight drop from here? Pick a side in the comments. 🤔
#ETH #BTC $ETH $BTC
😤 The low at 0.010411 held for 12 hours. Then a 15m candle on 2.5x volume smashed straight through it, closing at 0.010183.
$ESPORTS That wasn’t a grind lower—it was a dump. Price is sliding down along the moving-average cluster, now 15.69% below its upper edge.
🔥 Here’s the bull-bear standoff: on one side, bears have been in control for nearly 96 candles, with bearish alignment in 85% of them and a combined multi-timeframe score of -6—a bearish confluence. On the other, price has already fallen 12.5% below the moving-average cluster, and there’s still no sign of an oversold bounce.
💀 Only three of the four key indicators are lit. This isn’t a spot to chase a short—it’s a spot to wait for a rebound.
👀 Here’s the plan: no short for now. If it rebounds to the lower edge of the moving-average cluster at 0.011638 and can’t get above it, I’ll consider shorting. If it gets above it, the trade is off.
⚡ 0.010183 is where price just got dumped to; 0.011638 is the line I’ve drawn—the question is, will it rebound and test that level, or keep heading down without looking back?
Here are the three charts. Are you betting on a rebound to 0.011638, or a straight drop from here? Pick a side in the comments. 🤔
#ETH #BTC $ETH $BTC
$ESPORTS That wasn’t a grind lower—it was a dump. Price is sliding down along the moving-average cluster, now 15.69% below its upper edge.
🔥 Here’s the bull-bear standoff: on one side, bears have been in control for nearly 96 candles, with bearish alignment in 85% of them and a combined multi-timeframe score of -6—a bearish confluence. On the other, price has already fallen 12.5% below the moving-average cluster, and there’s still no sign of an oversold bounce.
💀 Only three of the four key indicators are lit. This isn’t a spot to chase a short—it’s a spot to wait for a rebound.
👀 Here’s the plan: no short for now. If it rebounds to the lower edge of the moving-average cluster at 0.011638 and can’t get above it, I’ll consider shorting. If it gets above it, the trade is off.
⚡ 0.010183 is where price just got dumped to; 0.011638 is the line I’ve drawn—the question is, will it rebound and test that level, or keep heading down without looking back?
Here are the three charts. Are you betting on a rebound to 0.011638, or a straight drop from here? Pick a side in the comments. 🤔
#ETH #BTC $ETH $BTC
48
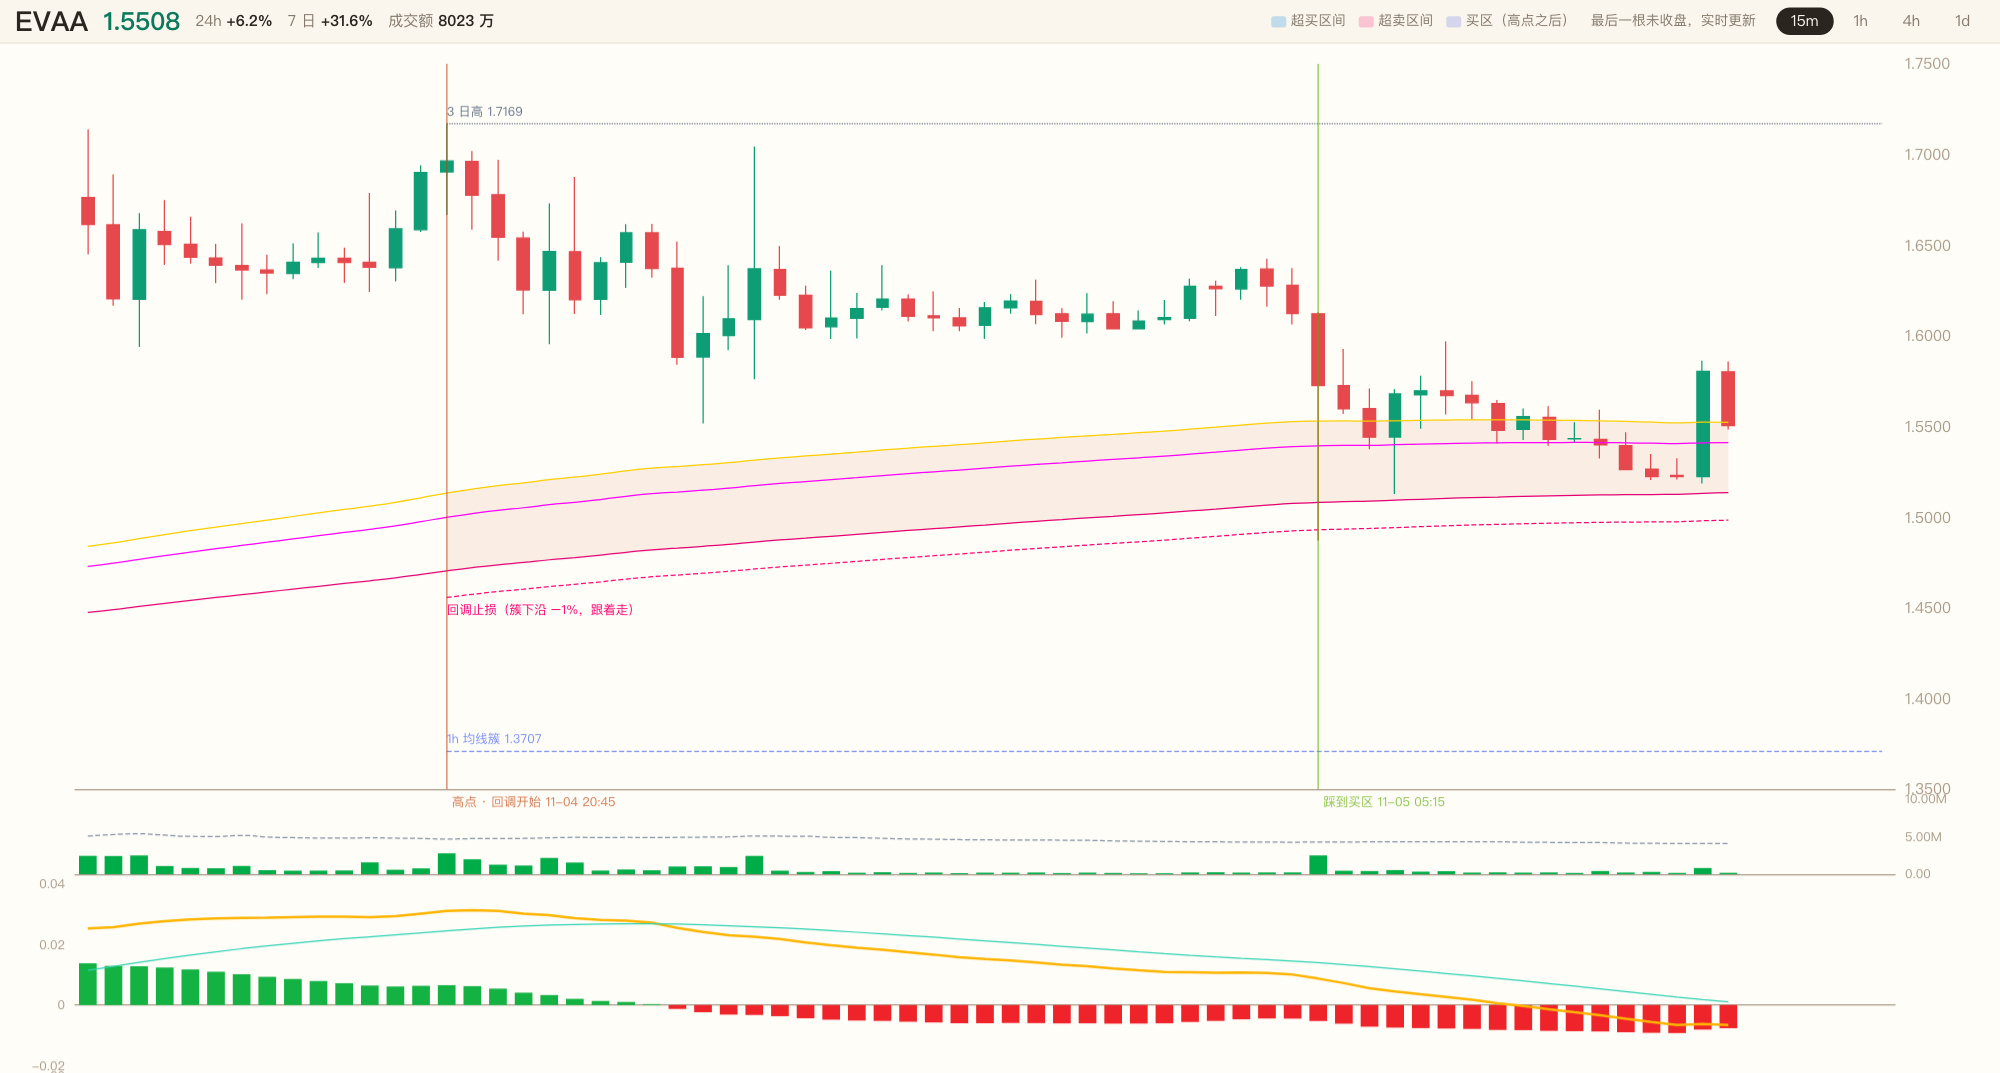
😤 1.5804 closed above the moving average cluster. Over the last 96 candles, 100% have had bullish alignment, and 82% closed above the cluster—this isn’t barely holding above it; price has been pushing higher along the moving averages.
$EVAA This 15-minute candle closed at the 91% level of its range, just +1.81% above the top of the moving average cluster. Close, not stretched.
🔥 But when I lay out all eight indicators, only five are flashing green. CCI is -17.9, the MACD histogram is -0.00812, and DIF and DEA are still locked below the zero line. On one hand, all five timeframes are above the cluster, and both the 1h and 4h have given the nod; on the other, the 1d is still bouncing within a bearish trend.
💀 A mature uptrend, but momentum is dozing. This isn’t a spot where I want to chase.
👀 Here’s the plan: no entry. I’ll act when CCI crosses back above 100 and the MACD histogram turns positive. For now, I’m watching.
⚡ 1.5804 is the price that just closed above; CCI and MACD are the two gates I’m waiting on—is momentum going to wake up and push higher, or will price grind back down toward the cluster first?
Here are the three charts. Are you betting that momentum will strengthen first, or that price will grind back to the top of the cluster? Pick a side in the comments. 🤔
#ETH #BTC $ETH $BTC
😤 1.5804 closed above the moving average cluster. Over the last 96 candles, 100% have had bullish alignment, and 82% closed above the cluster—this isn’t barely holding above it; price has been pushing higher along the moving averages.
$EVAA This 15-minute candle closed at the 91% level of its range, just +1.81% above the top of the moving average cluster. Close, not stretched.
🔥 But when I lay out all eight indicators, only five are flashing green. CCI is -17.9, the MACD histogram is -0.00812, and DIF and DEA are still locked below the zero line. On one hand, all five timeframes are above the cluster, and both the 1h and 4h have given the nod; on the other, the 1d is still bouncing within a bearish trend.
💀 A mature uptrend, but momentum is dozing. This isn’t a spot where I want to chase.
👀 Here’s the plan: no entry. I’ll act when CCI crosses back above 100 and the MACD histogram turns positive. For now, I’m watching.
⚡ 1.5804 is the price that just closed above; CCI and MACD are the two gates I’m waiting on—is momentum going to wake up and push higher, or will price grind back down toward the cluster first?
Here are the three charts. Are you betting that momentum will strengthen first, or that price will grind back to the top of the cluster? Pick a side in the comments. 🤔
#ETH #BTC $ETH $BTC
$EVAA This 15-minute candle closed at the 91% level of its range, just +1.81% above the top of the moving average cluster. Close, not stretched.
🔥 But when I lay out all eight indicators, only five are flashing green. CCI is -17.9, the MACD histogram is -0.00812, and DIF and DEA are still locked below the zero line. On one hand, all five timeframes are above the cluster, and both the 1h and 4h have given the nod; on the other, the 1d is still bouncing within a bearish trend.
💀 A mature uptrend, but momentum is dozing. This isn’t a spot where I want to chase.
👀 Here’s the plan: no entry. I’ll act when CCI crosses back above 100 and the MACD histogram turns positive. For now, I’m watching.
⚡ 1.5804 is the price that just closed above; CCI and MACD are the two gates I’m waiting on—is momentum going to wake up and push higher, or will price grind back down toward the cluster first?
Here are the three charts. Are you betting that momentum will strengthen first, or that price will grind back to the top of the cluster? Pick a side in the comments. 🤔
#ETH #BTC $ETH $BTC
51
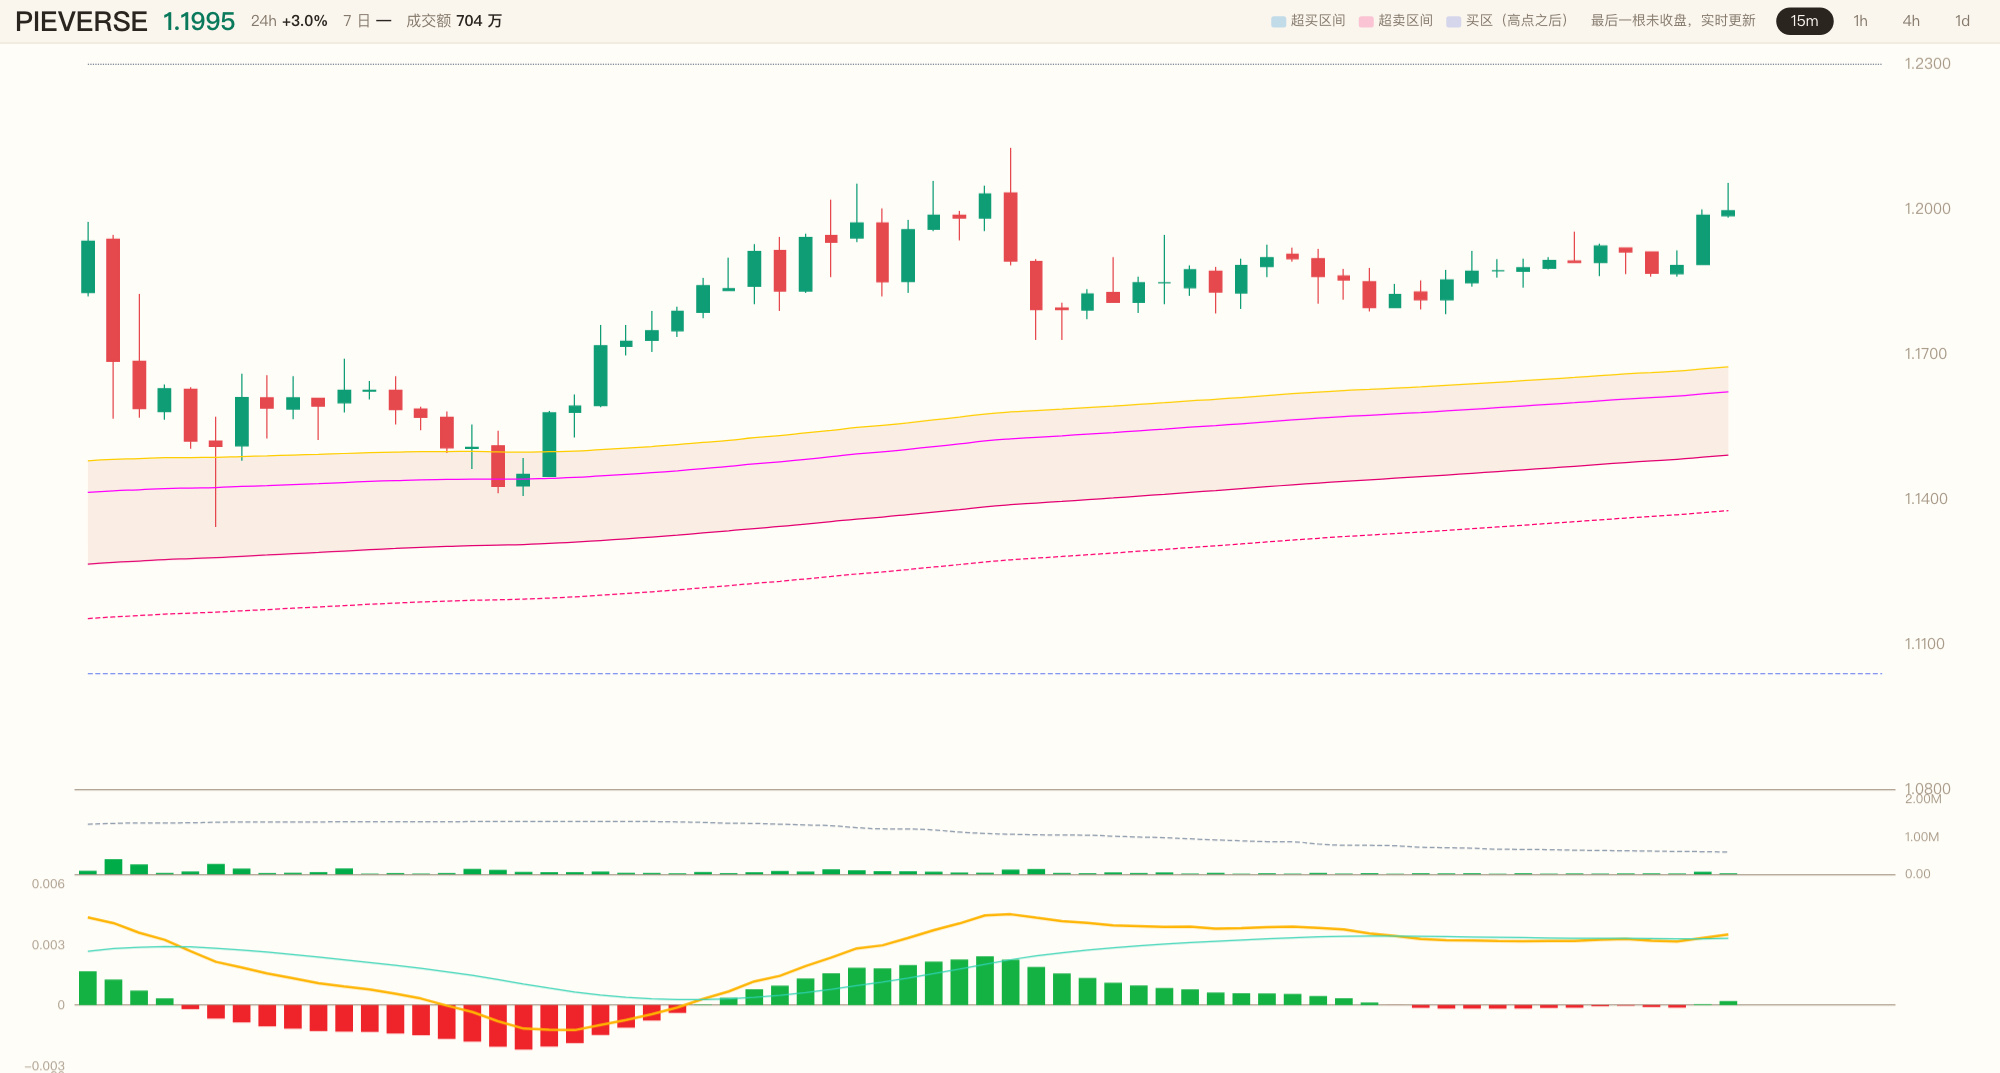
😤 1.1987. Eight signals, all lit up. This time, it’s not one light short—it’s every single one, right in front of me.
$PIEVERSE Fifteen minutes: price climbed steadily along the upper edge of the moving-average cluster, closing at 89% of the candlestick’s range—just +2.72% from the upper edge. Not stretched, not overextended.
🔥 The bulls and bears are laid out clearly: bullish alignment across 100% of the last 96 candles, with 98% closing above the cluster. Both the 1h and 1d are above the cluster; CCI is 117, the MACD histogram has flipped above the zero line, and DIF and DEA are converging in the same direction.
💀 But the 4h signal hasn’t given the nod—it’s still bouncing within a bearish trend. One of the eight is missing, and I’m not going to pretend I don’t see it.
👀 So I’m entering this time, but with a small position. I got in at 1.1987, with my stop-loss at 1.1713, down 2.3%. If it breaks below that, I’ll take the loss. No holding on.
⚡ 1.1987 is my entry price; 1.1713 is my line in the sand—will it keep pushing with this momentum, or will it pull back first and test me?
Here are the three charts. Are you betting it keeps pushing, or drops first to around 1.1713? Pick a side in the comments. 🤔
#ETH #BTC $ETH $BTC
😤 1.1987. Eight signals, all lit up. This time, it’s not one light short—it’s every single one, right in front of me.
$PIEVERSE Fifteen minutes: price climbed steadily along the upper edge of the moving-average cluster, closing at 89% of the candlestick’s range—just +2.72% from the upper edge. Not stretched, not overextended.
🔥 The bulls and bears are laid out clearly: bullish alignment across 100% of the last 96 candles, with 98% closing above the cluster. Both the 1h and 1d are above the cluster; CCI is 117, the MACD histogram has flipped above the zero line, and DIF and DEA are converging in the same direction.
💀 But the 4h signal hasn’t given the nod—it’s still bouncing within a bearish trend. One of the eight is missing, and I’m not going to pretend I don’t see it.
👀 So I’m entering this time, but with a small position. I got in at 1.1987, with my stop-loss at 1.1713, down 2.3%. If it breaks below that, I’ll take the loss. No holding on.
⚡ 1.1987 is my entry price; 1.1713 is my line in the sand—will it keep pushing with this momentum, or will it pull back first and test me?
Here are the three charts. Are you betting it keeps pushing, or drops first to around 1.1713? Pick a side in the comments. 🤔
#ETH #BTC $ETH $BTC
$PIEVERSE Fifteen minutes: price climbed steadily along the upper edge of the moving-average cluster, closing at 89% of the candlestick’s range—just +2.72% from the upper edge. Not stretched, not overextended.
🔥 The bulls and bears are laid out clearly: bullish alignment across 100% of the last 96 candles, with 98% closing above the cluster. Both the 1h and 1d are above the cluster; CCI is 117, the MACD histogram has flipped above the zero line, and DIF and DEA are converging in the same direction.
💀 But the 4h signal hasn’t given the nod—it’s still bouncing within a bearish trend. One of the eight is missing, and I’m not going to pretend I don’t see it.
👀 So I’m entering this time, but with a small position. I got in at 1.1987, with my stop-loss at 1.1713, down 2.3%. If it breaks below that, I’ll take the loss. No holding on.
⚡ 1.1987 is my entry price; 1.1713 is my line in the sand—will it keep pushing with this momentum, or will it pull back first and test me?
Here are the three charts. Are you betting it keeps pushing, or drops first to around 1.1713? Pick a side in the comments. 🤔
#ETH #BTC $ETH $BTC
90
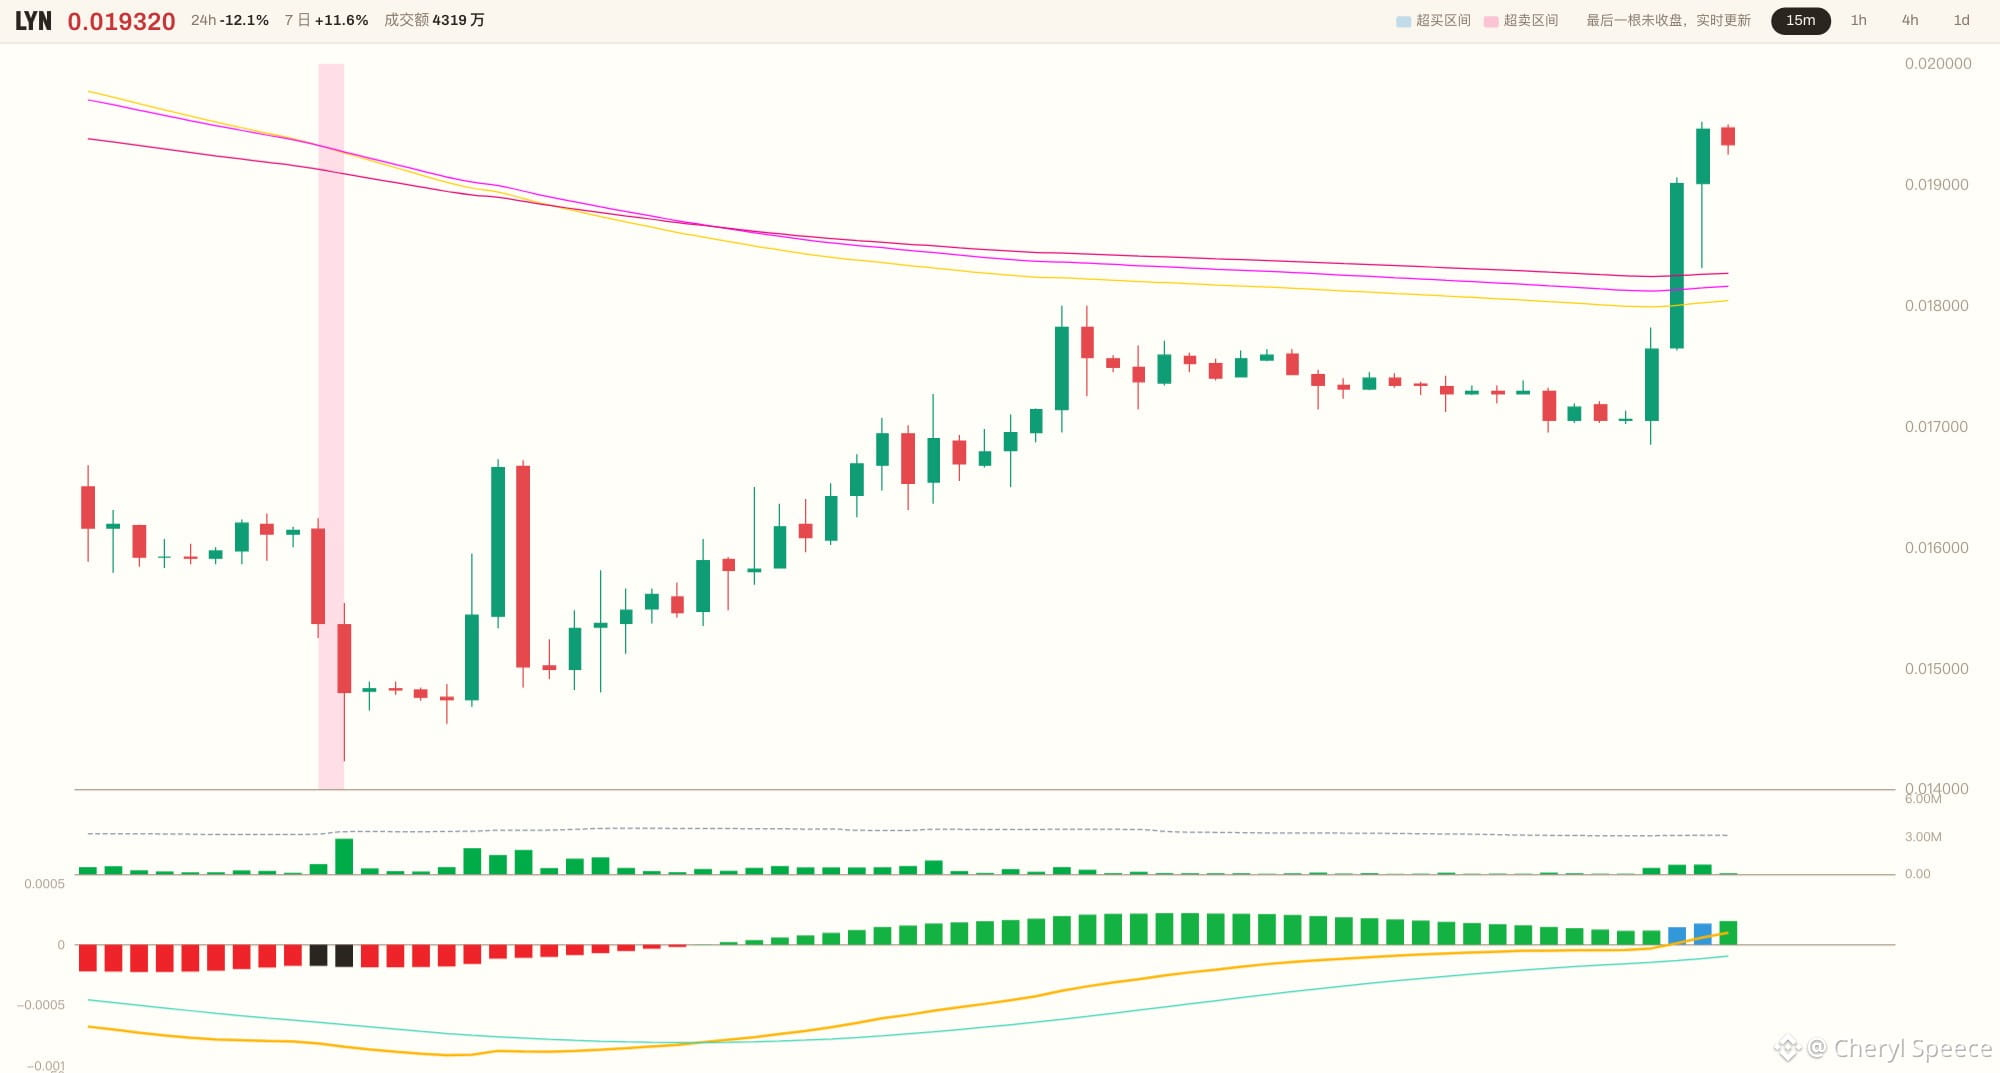
😤 0.019460. Volume is 2.9× higher, and a 15m candle closed above the previous 12-hour high of 0.019060—both the volume and the breakout are real.
$LYN With that move, price is already +6.62% above the moving average cluster, pushing up along its upper edge.
🔥 But when I lay out all seven factors, only two light up. The bearish alignment across 96 bars still accounts for 40%, the 1d is still below the cluster, and the 4h is rebounding within a bearish trend. On one side, a volume-backed breakout in both price and volume; on the other, not a single higher-timeframe signal is giving the green light.
💀 This isn't a trend-following takeoff—it's a volume-backed move up through a bearish pileup. Only 1 of 4 core conditions is met, so I won't chase at this level.
👀 Here's the plan: no short for now. I'll see if it can hold above the upper edge of the moving average cluster at 0.018252; if it can't, I'll consider going short. For now, just watching.
⚡ 0.019460 is the level it's just broken through; 0.018252 is the line I've drawn—will it keep pushing higher on volume, or pull back after the spike and fall to the upper edge?
Here are the three charts. Are you betting it keeps pushing, or pulls back first toward 0.018252? Pick a side in the comments. 🤔
#ETH #BTC $ETH $BTC
😤 0.019460. Volume is 2.9× higher, and a 15m candle closed above the previous 12-hour high of 0.019060—both the volume and the breakout are real.
$LYN With that move, price is already +6.62% above the moving average cluster, pushing up along its upper edge.
🔥 But when I lay out all seven factors, only two light up. The bearish alignment across 96 bars still accounts for 40%, the 1d is still below the cluster, and the 4h is rebounding within a bearish trend. On one side, a volume-backed breakout in both price and volume; on the other, not a single higher-timeframe signal is giving the green light.
💀 This isn't a trend-following takeoff—it's a volume-backed move up through a bearish pileup. Only 1 of 4 core conditions is met, so I won't chase at this level.
👀 Here's the plan: no short for now. I'll see if it can hold above the upper edge of the moving average cluster at 0.018252; if it can't, I'll consider going short. For now, just watching.
⚡ 0.019460 is the level it's just broken through; 0.018252 is the line I've drawn—will it keep pushing higher on volume, or pull back after the spike and fall to the upper edge?
Here are the three charts. Are you betting it keeps pushing, or pulls back first toward 0.018252? Pick a side in the comments. 🤔
#ETH #BTC $ETH $BTC
$LYN With that move, price is already +6.62% above the moving average cluster, pushing up along its upper edge.
🔥 But when I lay out all seven factors, only two light up. The bearish alignment across 96 bars still accounts for 40%, the 1d is still below the cluster, and the 4h is rebounding within a bearish trend. On one side, a volume-backed breakout in both price and volume; on the other, not a single higher-timeframe signal is giving the green light.
💀 This isn't a trend-following takeoff—it's a volume-backed move up through a bearish pileup. Only 1 of 4 core conditions is met, so I won't chase at this level.
👀 Here's the plan: no short for now. I'll see if it can hold above the upper edge of the moving average cluster at 0.018252; if it can't, I'll consider going short. For now, just watching.
⚡ 0.019460 is the level it's just broken through; 0.018252 is the line I've drawn—will it keep pushing higher on volume, or pull back after the spike and fall to the upper edge?
Here are the three charts. Are you betting it keeps pushing, or pulls back first toward 0.018252? Pick a side in the comments. 🤔
#ETH #BTC $ETH $BTC
10
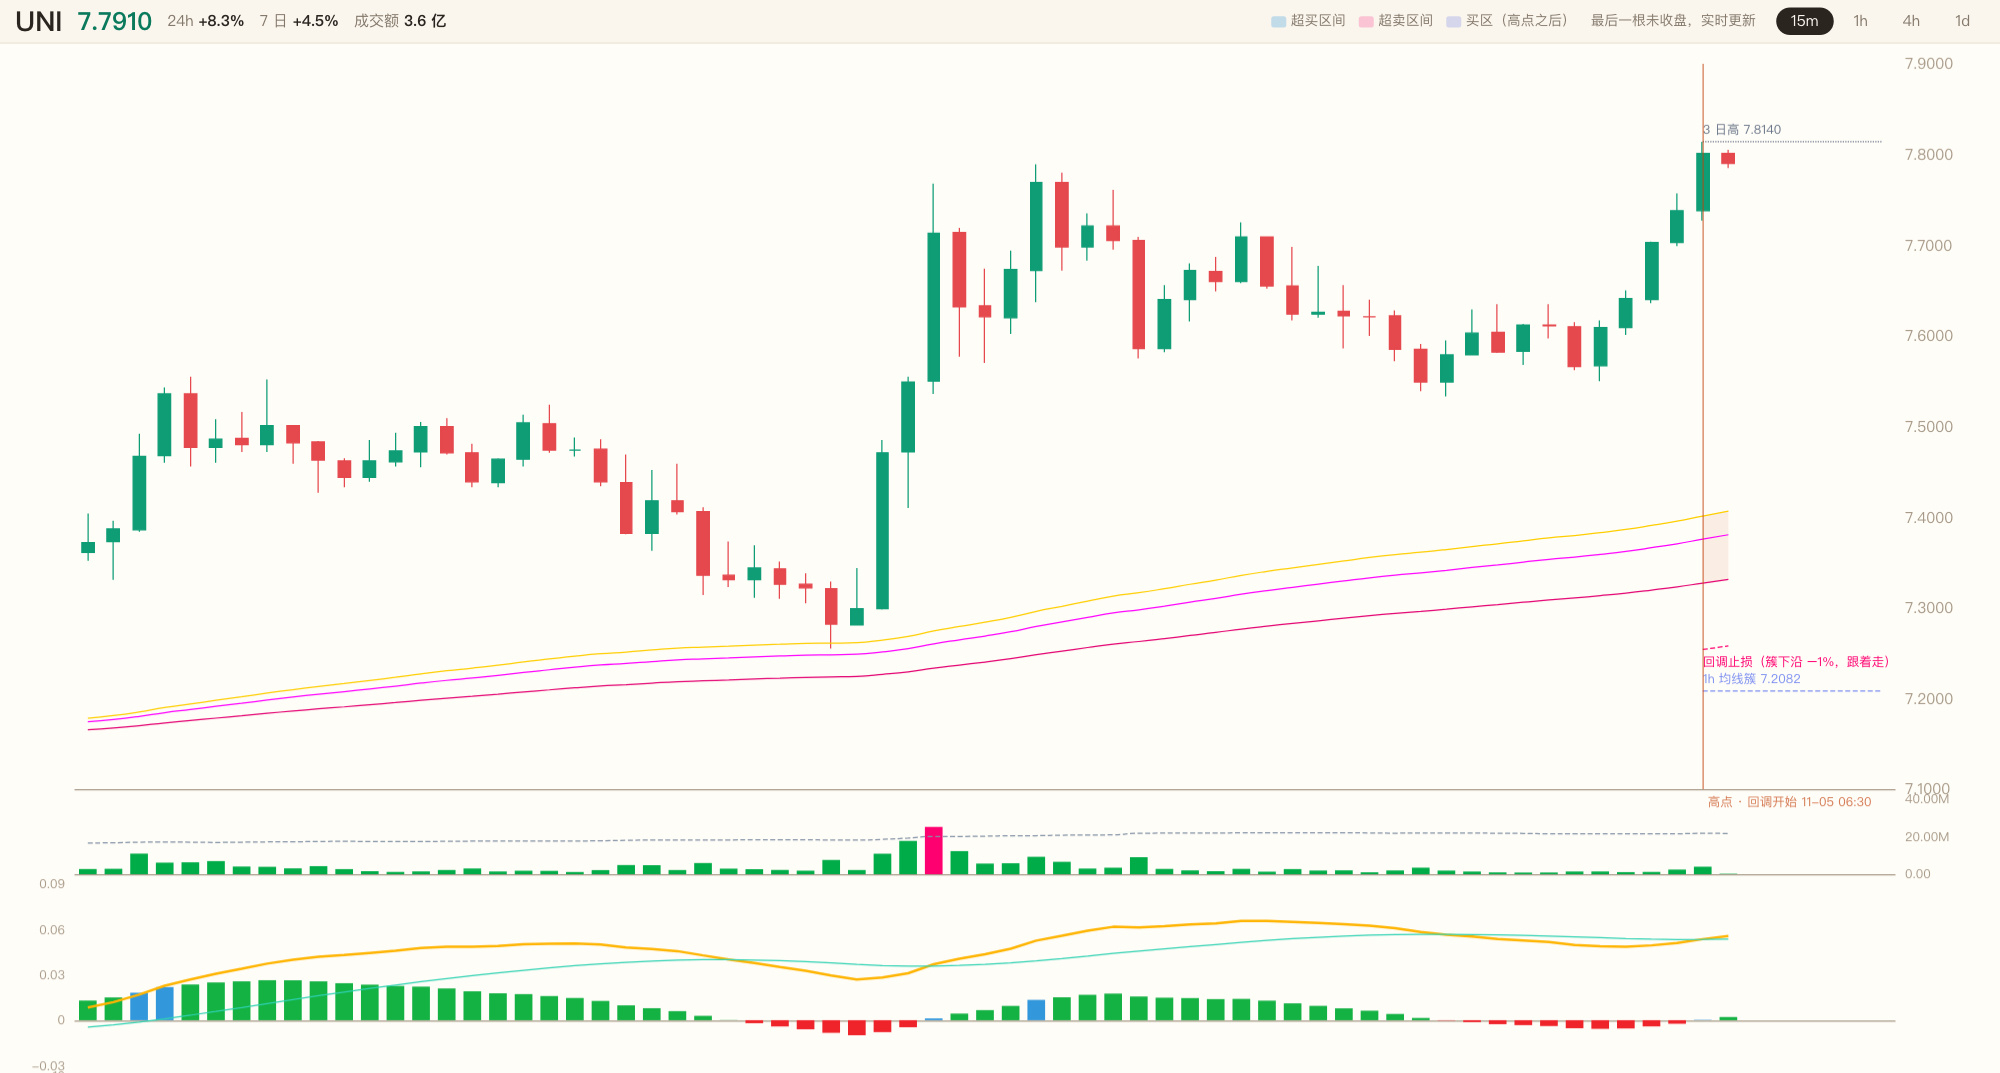
😤 7.8010. 60 candles. Put those two numbers together, and I’ve waited a full sixty candlesticks.
$UNI Fifteen minutes later, that overbought surge finally turned back, retested the low at 7.2550, tapped the moving-average cluster, then climbed back above it—+5.40%. Not far, just right.
🔥 Here’s the bull-bear picture: on one side, the bulls have been in control for nearly 96 candles, with a 100% bullish alignment and 83% of closes above the cluster; 1h and 1d are both above it. On the other, 4h is still bouncing within a bearish trend, and the higher timeframes aren’t fully aligned.
💀 All eight conditions are lit up, but price has already stretched too far above the top of the moving-average cluster. This isn’t a spot to chase with a big position—it’s a spot to scale in.
👀 Here’s my plan: 25% at the current price of 7.8010 to start a position, and 75% waiting at 7.4382 for a pullback. Stop-loss at 7.4953, -3.9%. If it breaks below that, I’m out.
⚡ 7.8010 is the price right now; 7.4953 is the line in the sand I’ve drawn—is it going to finish this pullback and keep climbing, or will this move fall straight through?
Three charts right here. Are you betting it gets back above the moving averages and keeps pushing, or breaks below 7.4953 first? Pick a side in the comments. 🤔
#ETH #BTC $ETH $BTC
😤 7.8010. 60 candles. Put those two numbers together, and I’ve waited a full sixty candlesticks.
$UNI Fifteen minutes later, that overbought surge finally turned back, retested the low at 7.2550, tapped the moving-average cluster, then climbed back above it—+5.40%. Not far, just right.
🔥 Here’s the bull-bear picture: on one side, the bulls have been in control for nearly 96 candles, with a 100% bullish alignment and 83% of closes above the cluster; 1h and 1d are both above it. On the other, 4h is still bouncing within a bearish trend, and the higher timeframes aren’t fully aligned.
💀 All eight conditions are lit up, but price has already stretched too far above the top of the moving-average cluster. This isn’t a spot to chase with a big position—it’s a spot to scale in.
👀 Here’s my plan: 25% at the current price of 7.8010 to start a position, and 75% waiting at 7.4382 for a pullback. Stop-loss at 7.4953, -3.9%. If it breaks below that, I’m out.
⚡ 7.8010 is the price right now; 7.4953 is the line in the sand I’ve drawn—is it going to finish this pullback and keep climbing, or will this move fall straight through?
Three charts right here. Are you betting it gets back above the moving averages and keeps pushing, or breaks below 7.4953 first? Pick a side in the comments. 🤔
#ETH #BTC $ETH $BTC
$UNI Fifteen minutes later, that overbought surge finally turned back, retested the low at 7.2550, tapped the moving-average cluster, then climbed back above it—+5.40%. Not far, just right.
🔥 Here’s the bull-bear picture: on one side, the bulls have been in control for nearly 96 candles, with a 100% bullish alignment and 83% of closes above the cluster; 1h and 1d are both above it. On the other, 4h is still bouncing within a bearish trend, and the higher timeframes aren’t fully aligned.
💀 All eight conditions are lit up, but price has already stretched too far above the top of the moving-average cluster. This isn’t a spot to chase with a big position—it’s a spot to scale in.
👀 Here’s my plan: 25% at the current price of 7.8010 to start a position, and 75% waiting at 7.4382 for a pullback. Stop-loss at 7.4953, -3.9%. If it breaks below that, I’m out.
⚡ 7.8010 is the price right now; 7.4953 is the line in the sand I’ve drawn—is it going to finish this pullback and keep climbing, or will this move fall straight through?
Three charts right here. Are you betting it gets back above the moving averages and keeps pushing, or breaks below 7.4953 first? Pick a side in the comments. 🤔
#ETH #BTC $ETH $BTC
30
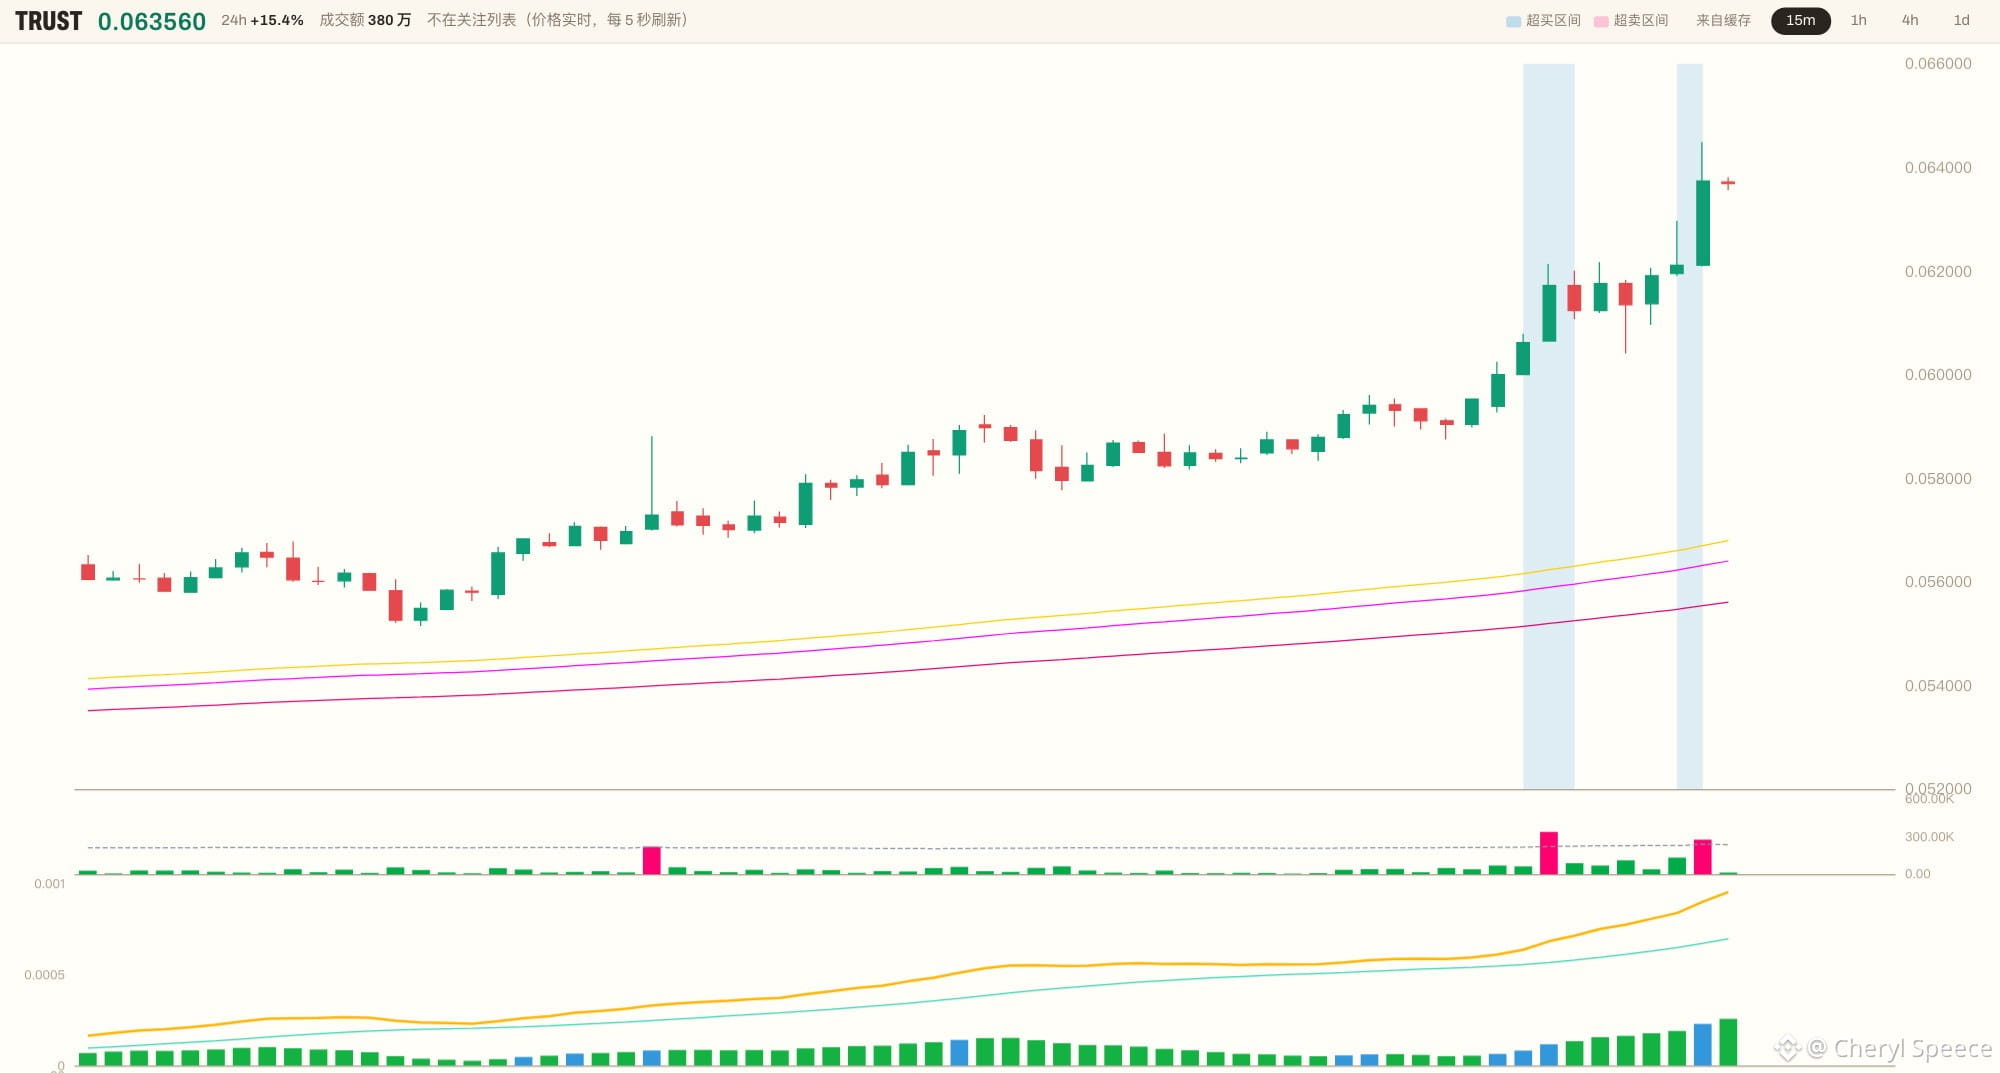
😤 0.063740. 10x volume, and one huge 15m bullish candle swept straight through 0.062970, which had held for 12 hours—it didn't climb slowly; someone kicked the door in.
$TRUST This candle closed at 69% of its range—not the most explosive, but the volume is real.
🔥 Here's the bull-bear setup: on one side, a double breakout in price and volume, RSI at 77.4, CCI at 244—every indicator is screaming overheated. On the other, I laid out all seven factors, and only four lights are on.
💀 The short alignment rate across 96 candles is 0%. The 1h is above the cluster, but the 4h is still bouncing within a downtrend, and the 1d is still firmly below the cluster. This isn't a bullish trend—it's a high-volume breakout inside a pile of bears.
👀 Price is +12.42% above the moving-average cluster. Chasing it now means buying into an overheated move, so I'm not opening a position.
⚡ 0.063740 is the price right now; 0.056700 is the line I've drawn. If it pulls back without dropping below the top of the moving-average cluster and the 1h stabilizes, I'll see if there's a long setup. For now, I'm watching.
Here are the three charts. Do you bet it keeps pushing on the back of that volume, or spikes and then pulls back? Pick a side in the comments. 🤔
#ETH #BTC $ETH $BTC
😤 0.063740. 10x volume, and one huge 15m bullish candle swept straight through 0.062970, which had held for 12 hours—it didn't climb slowly; someone kicked the door in.
$TRUST This candle closed at 69% of its range—not the most explosive, but the volume is real.
🔥 Here's the bull-bear setup: on one side, a double breakout in price and volume, RSI at 77.4, CCI at 244—every indicator is screaming overheated. On the other, I laid out all seven factors, and only four lights are on.
💀 The short alignment rate across 96 candles is 0%. The 1h is above the cluster, but the 4h is still bouncing within a downtrend, and the 1d is still firmly below the cluster. This isn't a bullish trend—it's a high-volume breakout inside a pile of bears.
👀 Price is +12.42% above the moving-average cluster. Chasing it now means buying into an overheated move, so I'm not opening a position.
⚡ 0.063740 is the price right now; 0.056700 is the line I've drawn. If it pulls back without dropping below the top of the moving-average cluster and the 1h stabilizes, I'll see if there's a long setup. For now, I'm watching.
Here are the three charts. Do you bet it keeps pushing on the back of that volume, or spikes and then pulls back? Pick a side in the comments. 🤔
#ETH #BTC $ETH $BTC
$TRUST This candle closed at 69% of its range—not the most explosive, but the volume is real.
🔥 Here's the bull-bear setup: on one side, a double breakout in price and volume, RSI at 77.4, CCI at 244—every indicator is screaming overheated. On the other, I laid out all seven factors, and only four lights are on.
💀 The short alignment rate across 96 candles is 0%. The 1h is above the cluster, but the 4h is still bouncing within a downtrend, and the 1d is still firmly below the cluster. This isn't a bullish trend—it's a high-volume breakout inside a pile of bears.
👀 Price is +12.42% above the moving-average cluster. Chasing it now means buying into an overheated move, so I'm not opening a position.
⚡ 0.063740 is the price right now; 0.056700 is the line I've drawn. If it pulls back without dropping below the top of the moving-average cluster and the 1h stabilizes, I'll see if there's a long setup. For now, I'm watching.
Here are the three charts. Do you bet it keeps pushing on the back of that volume, or spikes and then pulls back? Pick a side in the comments. 🤔
#ETH #BTC $ETH $BTC
7
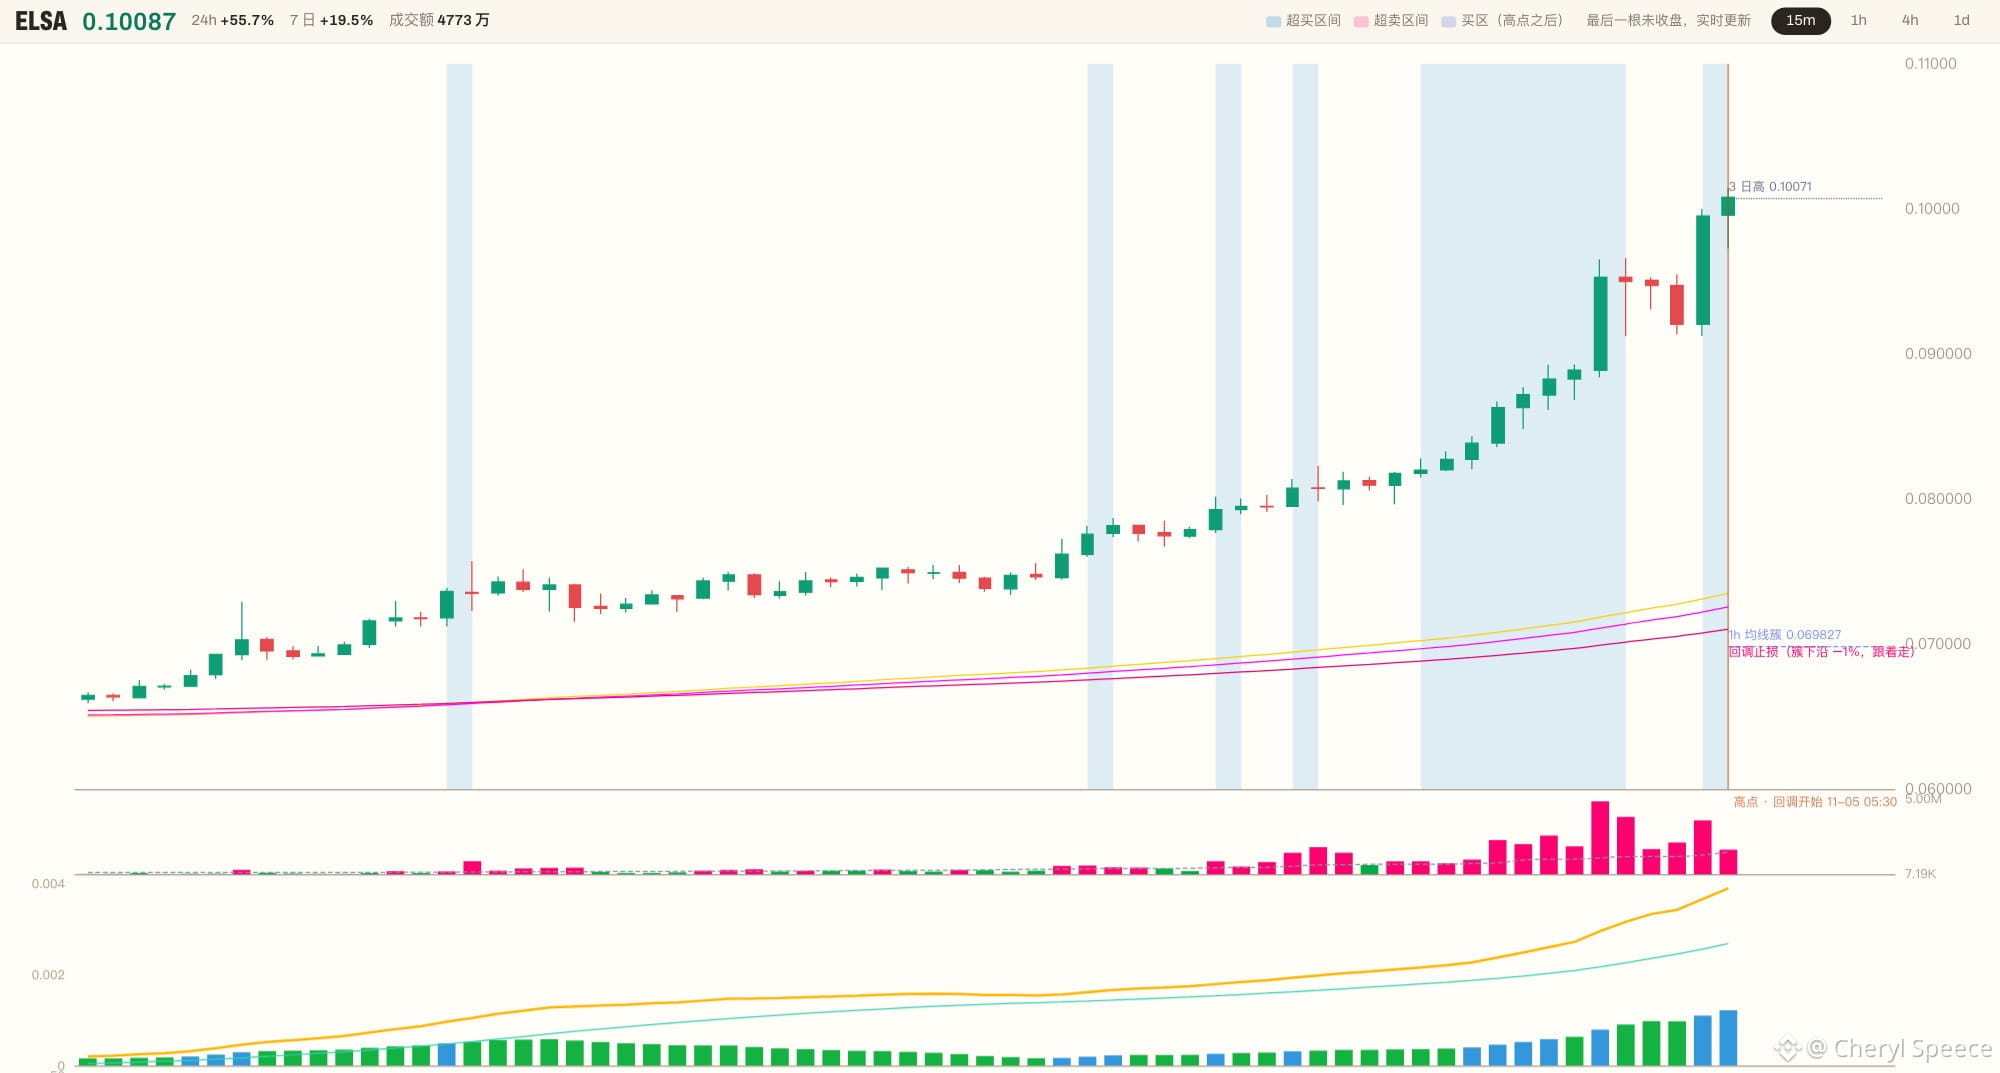
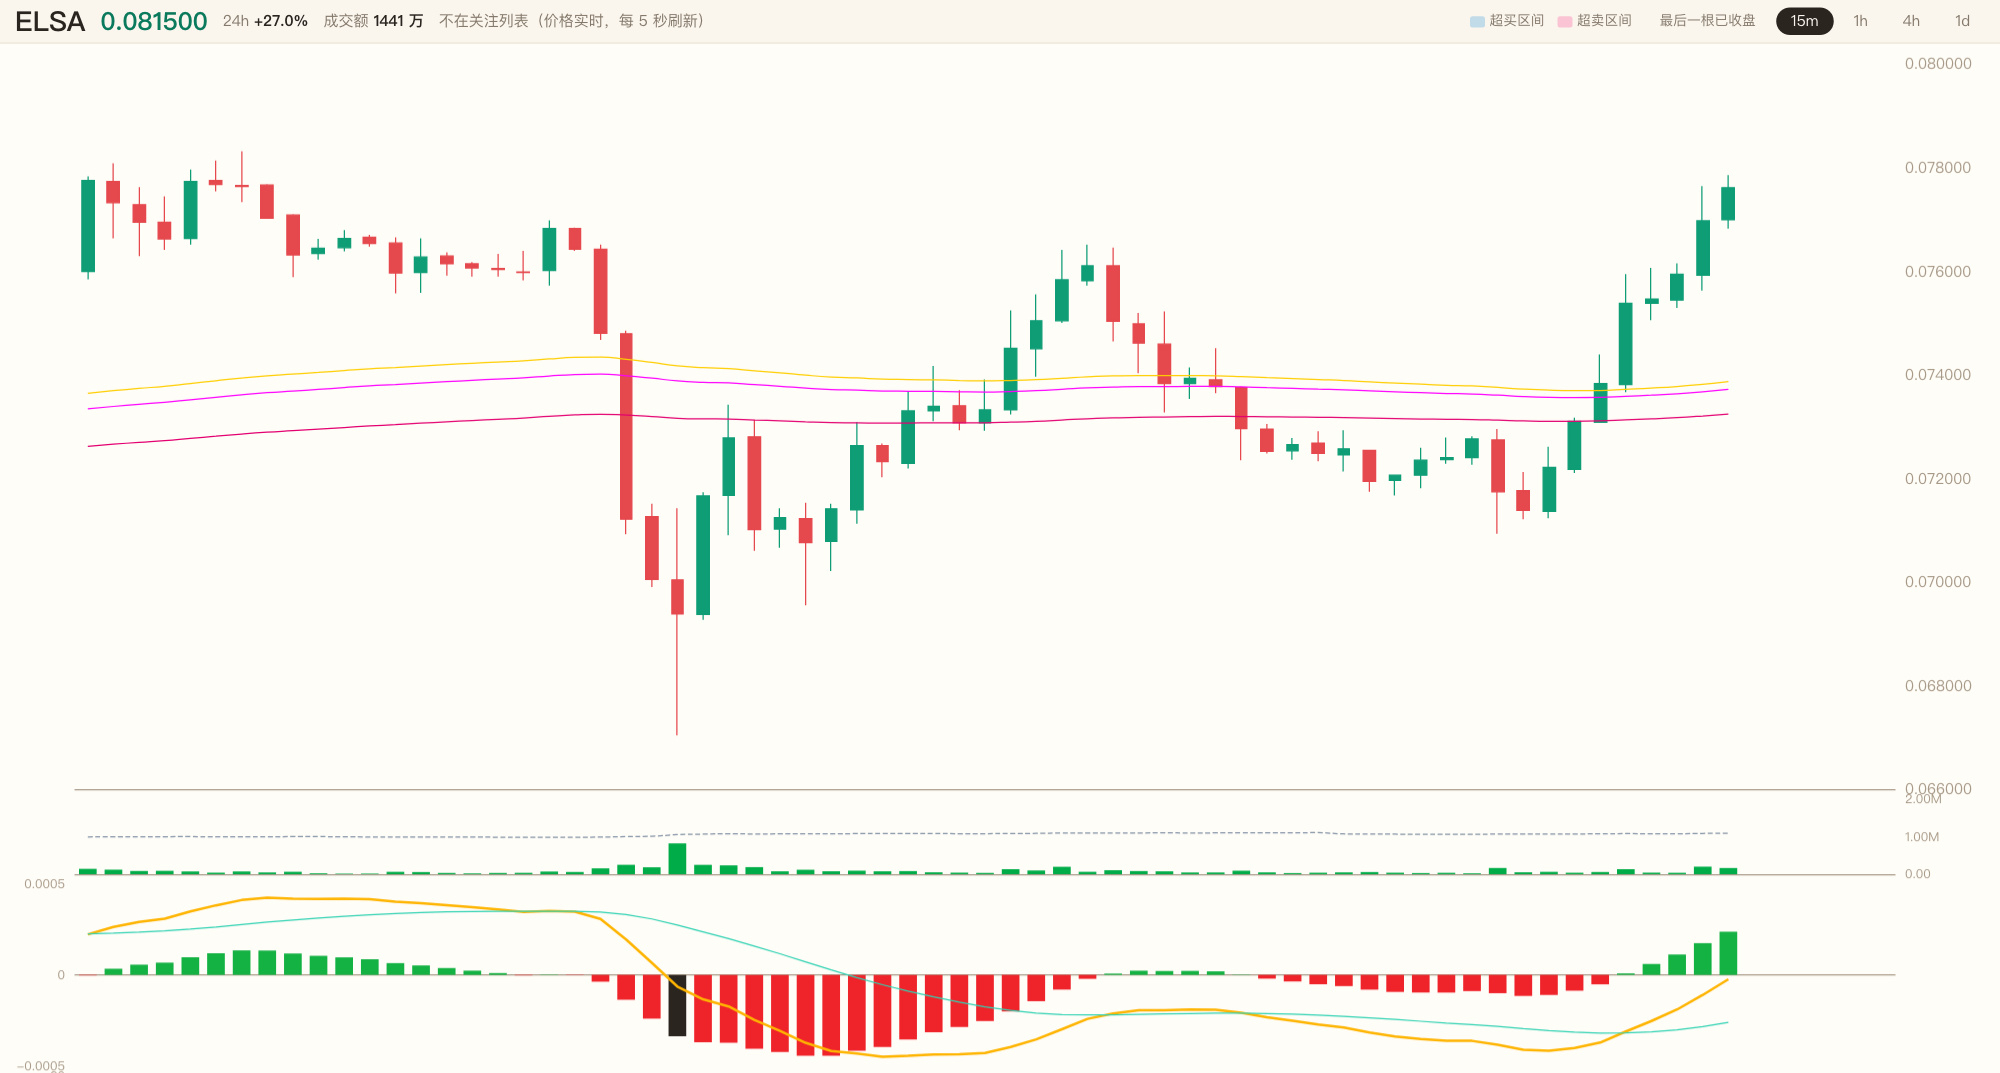
😤 23.29x volume. One big 15m bullish candle broke straight through 0.0966, which had capped price for 48 candles, and closed at 0.099510.
$ELSA closed at the 94% mark of its candle range, almost right at the high.
🔥 But when I lay out the conditions, only four of the seven light up. RSI 83.0, CCI 271, and price is +36.10% above the moving-average cluster. In the last 32 candles, 16 were overbought.
💀 On one side, a high-volume breakout above the previous high with a strong close; on the other, the bearish alignment still accounts for 45% of the last 96 candles. This is a rebound within a 1h downtrend, while the 1d trend still leans bearish. The five timeframes show a 17-to-2 bullish consensus, but the 1h gate hasn’t given me the green light.
👀 So I’m not opening a position. I’m not chasing this big green candle. I’ll wait to see if price pulls back without falling below the top of the moving-average cluster at 0.073118, and if the 1h trend stabilizes, then I’ll consider going long. For now, I’m watching.
⚡ 0.099510 is the price right in front of us; 0.073118 is the line I’ve drawn—will volume keep pushing it higher, or will this spike pull back first?
Here are the three charts. Are you betting on another push, or a drop back toward 0.073118? Pick a side in the comments. 🤔
#ETH #BTC $ETH $BTC
😤 23.29x volume. One big 15m bullish candle broke straight through 0.0966, which had capped price for 48 candles, and closed at 0.099510.
$ELSA closed at the 94% mark of its candle range, almost right at the high.
🔥 But when I lay out the conditions, only four of the seven light up. RSI 83.0, CCI 271, and price is +36.10% above the moving-average cluster. In the last 32 candles, 16 were overbought.
💀 On one side, a high-volume breakout above the previous high with a strong close; on the other, the bearish alignment still accounts for 45% of the last 96 candles. This is a rebound within a 1h downtrend, while the 1d trend still leans bearish. The five timeframes show a 17-to-2 bullish consensus, but the 1h gate hasn’t given me the green light.
👀 So I’m not opening a position. I’m not chasing this big green candle. I’ll wait to see if price pulls back without falling below the top of the moving-average cluster at 0.073118, and if the 1h trend stabilizes, then I’ll consider going long. For now, I’m watching.
⚡ 0.099510 is the price right in front of us; 0.073118 is the line I’ve drawn—will volume keep pushing it higher, or will this spike pull back first?
Here are the three charts. Are you betting on another push, or a drop back toward 0.073118? Pick a side in the comments. 🤔
#ETH #BTC $ETH $BTC
$ELSA closed at the 94% mark of its candle range, almost right at the high.
🔥 But when I lay out the conditions, only four of the seven light up. RSI 83.0, CCI 271, and price is +36.10% above the moving-average cluster. In the last 32 candles, 16 were overbought.
💀 On one side, a high-volume breakout above the previous high with a strong close; on the other, the bearish alignment still accounts for 45% of the last 96 candles. This is a rebound within a 1h downtrend, while the 1d trend still leans bearish. The five timeframes show a 17-to-2 bullish consensus, but the 1h gate hasn’t given me the green light.
👀 So I’m not opening a position. I’m not chasing this big green candle. I’ll wait to see if price pulls back without falling below the top of the moving-average cluster at 0.073118, and if the 1h trend stabilizes, then I’ll consider going long. For now, I’m watching.
⚡ 0.099510 is the price right in front of us; 0.073118 is the line I’ve drawn—will volume keep pushing it higher, or will this spike pull back first?
Here are the three charts. Are you betting on another push, or a drop back toward 0.073118? Pick a side in the comments. 🤔
#ETH #BTC $ETH $BTC
14
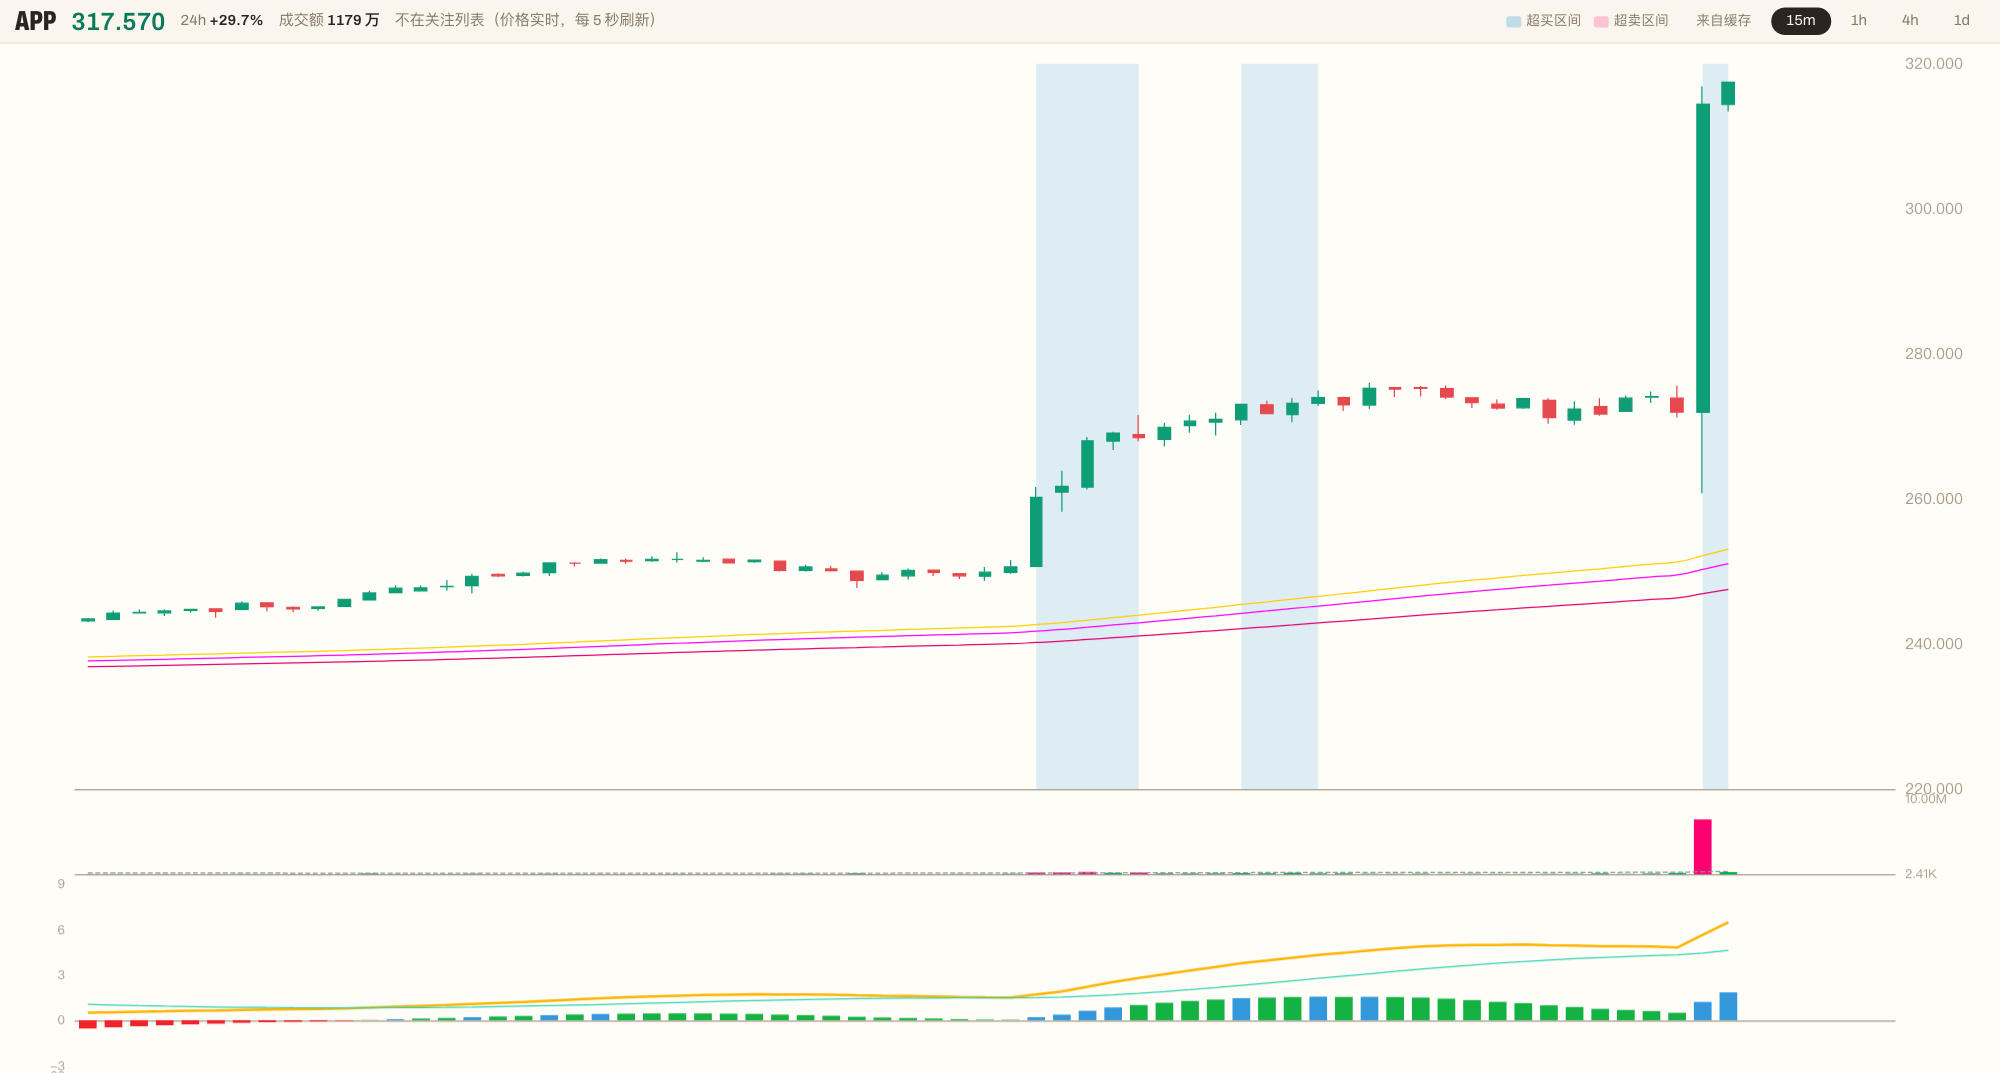
😤 410.1x volume. A single 15m candle blasted straight through 276.040, which had held for 12 hours, and closed at 314.420.
$APP That move— the volume was real, and so was the breakout. I stared at the screen and didn’t move.
💀 But with all twenty indicators laid out, only three lit up. RSI 86.6, CCI 350, and price +24.68% above the moving-average cluster—closing at the 96% mark of the candle. This isn’t a bullish trend move; it’s a high-volume push up through a crowd of bears.
🔥 On one side, volume and price both broke out, with the close almost at the high. On the other, both the 1h and 4h are just bouncing within a bearish trend, and none of the higher timeframes are giving the green light. Chasing it means buying into extreme heat.
👀 So I’m not opening a position. If it pulls back without falling below the top of the moving-average cluster, around 252.183, and the 1h stabilizes, then I’ll consider going long. For now, I’m watching.
⚡ 314.420 is the level it just broke through; 252.183 is the line I’ve drawn—will it use that volume to keep pushing, or pull back after the spike? We’ll see.
Here are the three charts. Are you betting it keeps pushing, or drops back toward 252.183 first? Pick a side in the comments. 🤔
#ETH #BTC $ETH $BTC
😤 410.1x volume. A single 15m candle blasted straight through 276.040, which had held for 12 hours, and closed at 314.420.
$APP That move— the volume was real, and so was the breakout. I stared at the screen and didn’t move.
💀 But with all twenty indicators laid out, only three lit up. RSI 86.6, CCI 350, and price +24.68% above the moving-average cluster—closing at the 96% mark of the candle. This isn’t a bullish trend move; it’s a high-volume push up through a crowd of bears.
🔥 On one side, volume and price both broke out, with the close almost at the high. On the other, both the 1h and 4h are just bouncing within a bearish trend, and none of the higher timeframes are giving the green light. Chasing it means buying into extreme heat.
👀 So I’m not opening a position. If it pulls back without falling below the top of the moving-average cluster, around 252.183, and the 1h stabilizes, then I’ll consider going long. For now, I’m watching.
⚡ 314.420 is the level it just broke through; 252.183 is the line I’ve drawn—will it use that volume to keep pushing, or pull back after the spike? We’ll see.
Here are the three charts. Are you betting it keeps pushing, or drops back toward 252.183 first? Pick a side in the comments. 🤔
#ETH #BTC $ETH $BTC
$APP That move— the volume was real, and so was the breakout. I stared at the screen and didn’t move.
💀 But with all twenty indicators laid out, only three lit up. RSI 86.6, CCI 350, and price +24.68% above the moving-average cluster—closing at the 96% mark of the candle. This isn’t a bullish trend move; it’s a high-volume push up through a crowd of bears.
🔥 On one side, volume and price both broke out, with the close almost at the high. On the other, both the 1h and 4h are just bouncing within a bearish trend, and none of the higher timeframes are giving the green light. Chasing it means buying into extreme heat.
👀 So I’m not opening a position. If it pulls back without falling below the top of the moving-average cluster, around 252.183, and the 1h stabilizes, then I’ll consider going long. For now, I’m watching.
⚡ 314.420 is the level it just broke through; 252.183 is the line I’ve drawn—will it use that volume to keep pushing, or pull back after the spike? We’ll see.
Here are the three charts. Are you betting it keeps pushing, or drops back toward 252.183 first? Pick a side in the comments. 🤔
#ETH #BTC $ETH $BTC
13
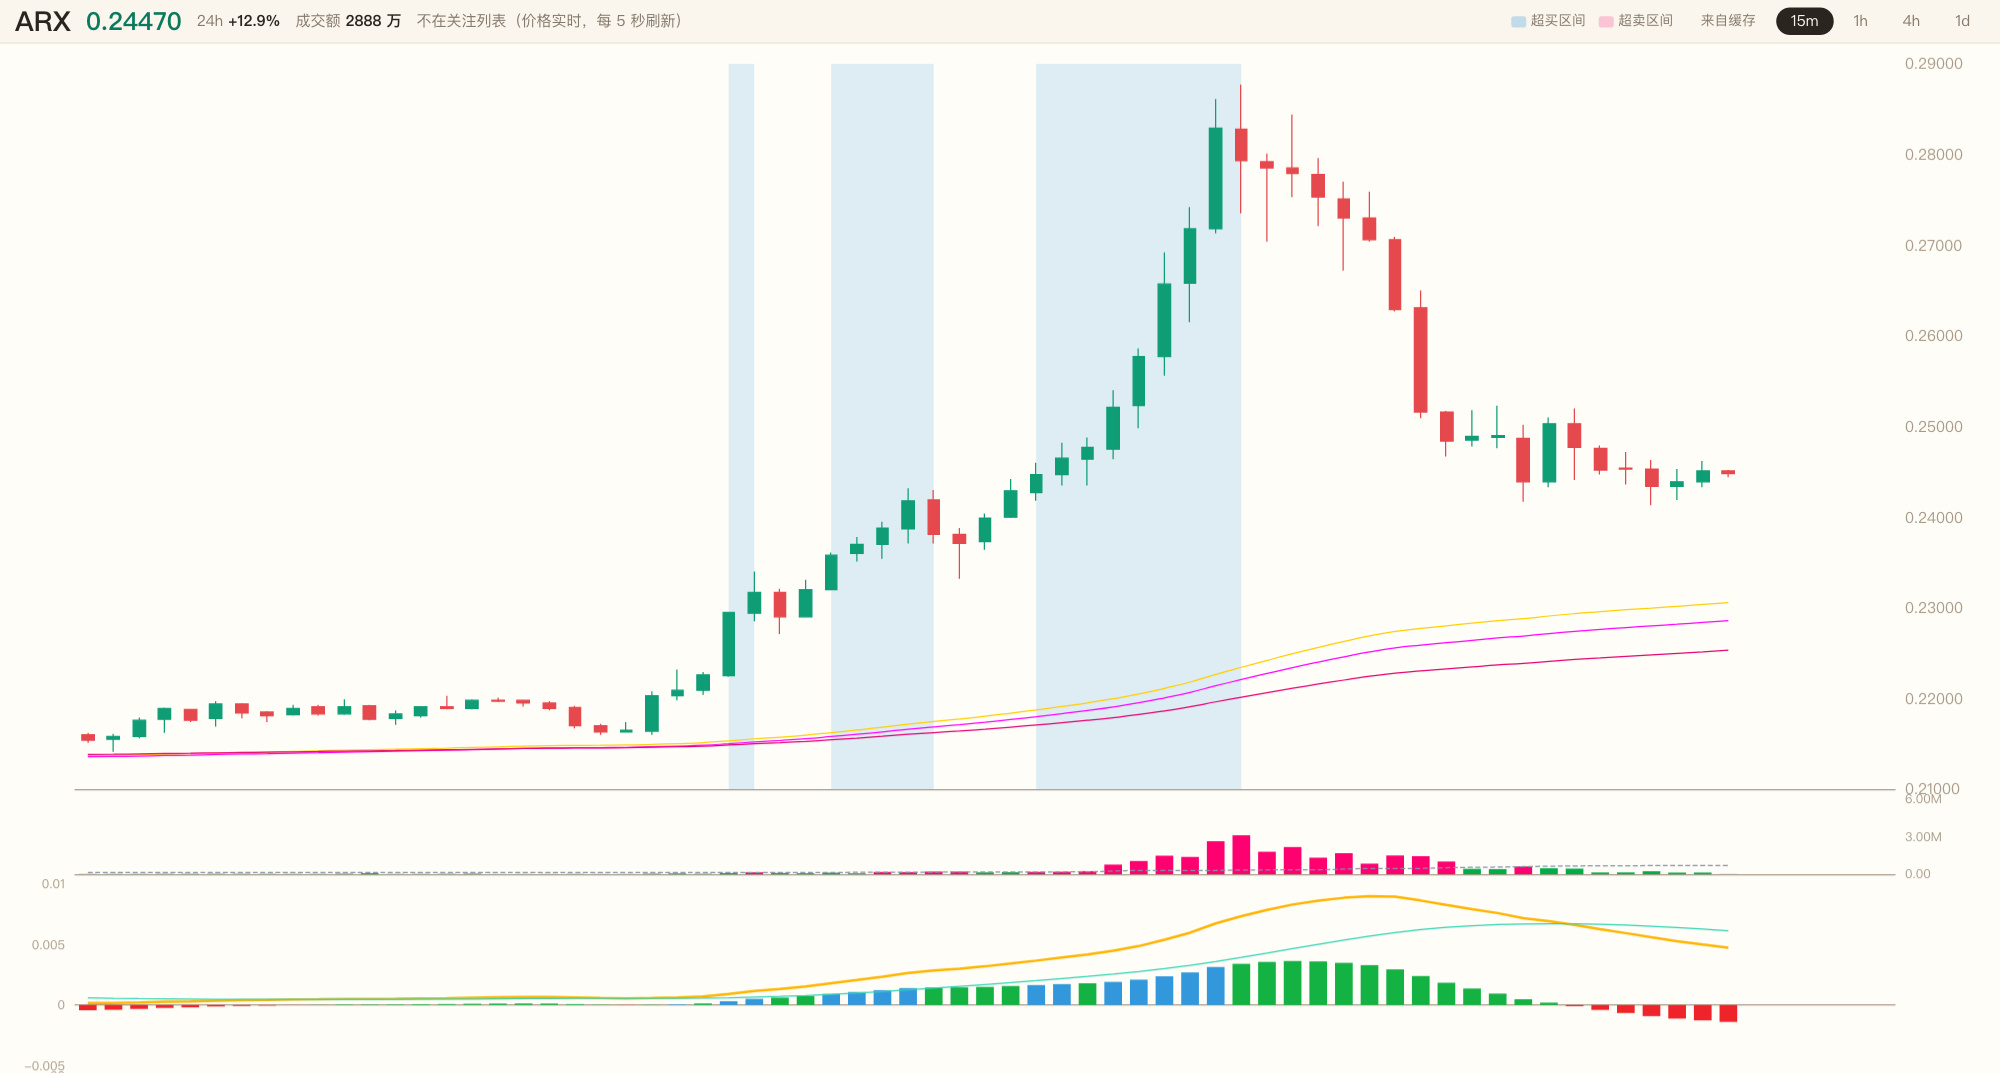
😤 0.24510. 152x volume—a single candle punched straight through the ceiling formed by long-term bears. This isn’t a recovery that ground its way up slowly; someone’s pouring it in by the bucket.
$ARX Fifteen minutes in, the price is already +6.39% above the moving-average cluster, plunging headfirst into overbought territory.
🔥 Here’s the bull-bear picture: on one side, a high-volume breakout above the previous 48 candles’ highs, with the close at 78% of the candle’s range; on the other, a rebound while the 1h trend is still bearish, and the 4h chart is all tangled up. The bulls score +10—looks intimidating.
💀 But I only count three out of seven criteria. RSI 88.9, CCI 408, and more than 27% above the cluster. This isn’t a takeoff with the trend; it’s chasing the wind at high altitude.
👀 So I’m not opening a single position. I’ll wait for a pullback that holds above the top of the moving-average cluster at 0.23037, and for the 1h chart to stabilize above it before considering a long. For now, just watching.
⚡ 0.24510 is the price right in front of us; 0.23037 is the line I’ve drawn—will it pull back and hold first, or will this momentum fizzle out completely?
Here are the three charts. Are you betting it’ll ride the volume and push higher, or spike up first and then pull back? Pick a side in the comments. 🤔
#ETH #BTC $ETH $BTC
😤 0.24510. 152x volume—a single candle punched straight through the ceiling formed by long-term bears. This isn’t a recovery that ground its way up slowly; someone’s pouring it in by the bucket.
$ARX Fifteen minutes in, the price is already +6.39% above the moving-average cluster, plunging headfirst into overbought territory.
🔥 Here’s the bull-bear picture: on one side, a high-volume breakout above the previous 48 candles’ highs, with the close at 78% of the candle’s range; on the other, a rebound while the 1h trend is still bearish, and the 4h chart is all tangled up. The bulls score +10—looks intimidating.
💀 But I only count three out of seven criteria. RSI 88.9, CCI 408, and more than 27% above the cluster. This isn’t a takeoff with the trend; it’s chasing the wind at high altitude.
👀 So I’m not opening a single position. I’ll wait for a pullback that holds above the top of the moving-average cluster at 0.23037, and for the 1h chart to stabilize above it before considering a long. For now, just watching.
⚡ 0.24510 is the price right in front of us; 0.23037 is the line I’ve drawn—will it pull back and hold first, or will this momentum fizzle out completely?
Here are the three charts. Are you betting it’ll ride the volume and push higher, or spike up first and then pull back? Pick a side in the comments. 🤔
#ETH #BTC $ETH $BTC
$ARX Fifteen minutes in, the price is already +6.39% above the moving-average cluster, plunging headfirst into overbought territory.
🔥 Here’s the bull-bear picture: on one side, a high-volume breakout above the previous 48 candles’ highs, with the close at 78% of the candle’s range; on the other, a rebound while the 1h trend is still bearish, and the 4h chart is all tangled up. The bulls score +10—looks intimidating.
💀 But I only count three out of seven criteria. RSI 88.9, CCI 408, and more than 27% above the cluster. This isn’t a takeoff with the trend; it’s chasing the wind at high altitude.
👀 So I’m not opening a single position. I’ll wait for a pullback that holds above the top of the moving-average cluster at 0.23037, and for the 1h chart to stabilize above it before considering a long. For now, just watching.
⚡ 0.24510 is the price right in front of us; 0.23037 is the line I’ve drawn—will it pull back and hold first, or will this momentum fizzle out completely?
Here are the three charts. Are you betting it’ll ride the volume and push higher, or spike up first and then pull back? Pick a side in the comments. 🤔
#ETH #BTC $ETH $BTC
7
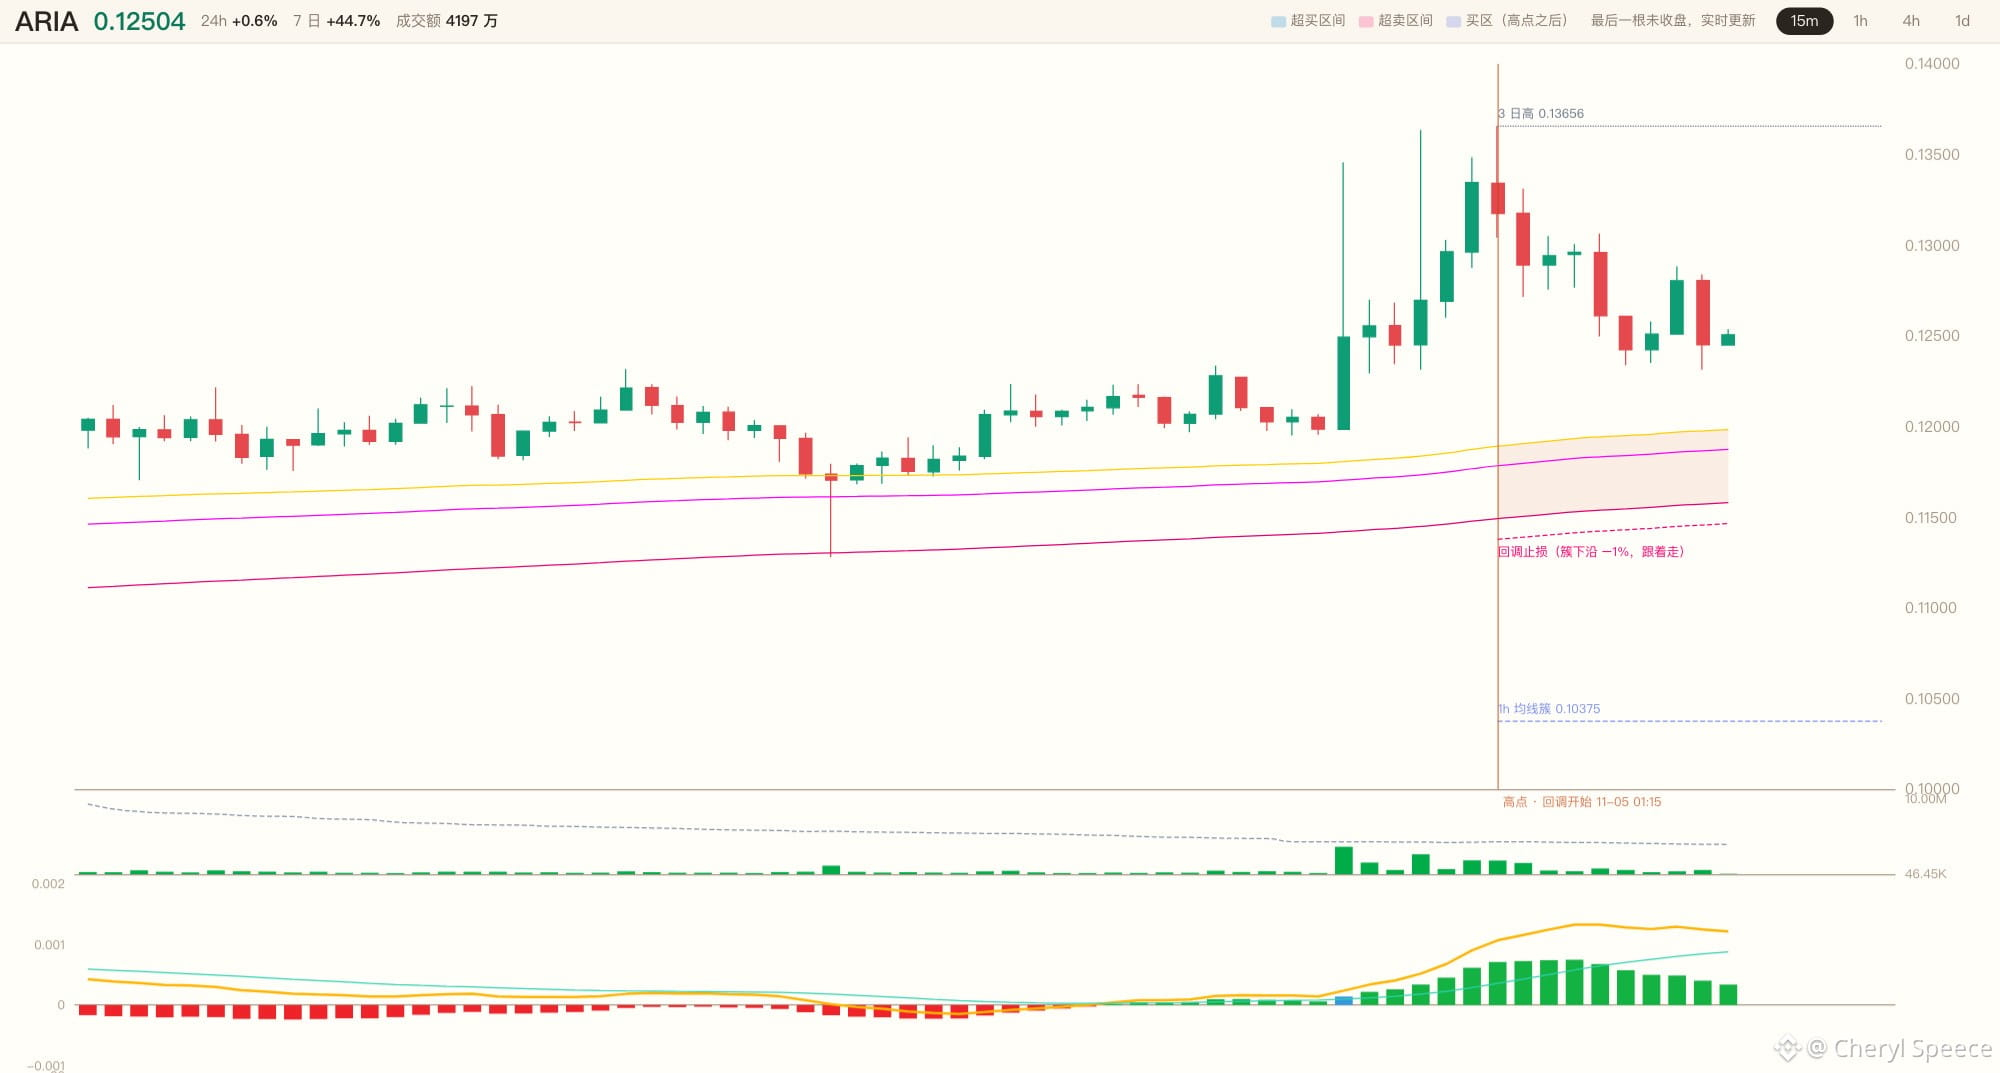
😤 0.12450, one huge bearish candle, down 2.77%, with a body 4.2 times the usual size—this isn’t a pullback; someone just kicked the door in.
After fifteen minutes at $ARIA , the price is still +3.96% above the moving-average cluster, but this candle slammed the close straight down to the 26% mark of the candlestick.
🔥 Here’s the bull-bear standoff: on one side, nearly a hundred candles in bullish alignment, not a single one missing, with the 1h and 4h charts both firmly above the cluster; on the other, the 1d chart is still bouncing within a downtrend, and CCI only reached 94.7—not quite enough to break 100.
💀 Six indicators say yes, two say no. I’m not opening a position; I’m just watching from here.
👀 What am I waiting for? CCI to cross back above 100, and the MACD histogram to turn positive. If those two don’t give the go-ahead, I won’t touch it even if 0.12450 gets cheaper.
⚡ 0.12450 is the price right now; that 100 line is the doorway I’m waiting for—is it going to turn bullish and signal first, or is this huge bearish candle just the beginning?
Here are the three charts. Are you betting on a recovery and a bullish turn, or another leg down? Pick a side in the comments. 🤔
#ETH #BTC $ETH $BTC
😤 0.12450, one huge bearish candle, down 2.77%, with a body 4.2 times the usual size—this isn’t a pullback; someone just kicked the door in.
After fifteen minutes at $ARIA , the price is still +3.96% above the moving-average cluster, but this candle slammed the close straight down to the 26% mark of the candlestick.
🔥 Here’s the bull-bear standoff: on one side, nearly a hundred candles in bullish alignment, not a single one missing, with the 1h and 4h charts both firmly above the cluster; on the other, the 1d chart is still bouncing within a downtrend, and CCI only reached 94.7—not quite enough to break 100.
💀 Six indicators say yes, two say no. I’m not opening a position; I’m just watching from here.
👀 What am I waiting for? CCI to cross back above 100, and the MACD histogram to turn positive. If those two don’t give the go-ahead, I won’t touch it even if 0.12450 gets cheaper.
⚡ 0.12450 is the price right now; that 100 line is the doorway I’m waiting for—is it going to turn bullish and signal first, or is this huge bearish candle just the beginning?
Here are the three charts. Are you betting on a recovery and a bullish turn, or another leg down? Pick a side in the comments. 🤔
#ETH #BTC $ETH $BTC
After fifteen minutes at $ARIA , the price is still +3.96% above the moving-average cluster, but this candle slammed the close straight down to the 26% mark of the candlestick.
🔥 Here’s the bull-bear standoff: on one side, nearly a hundred candles in bullish alignment, not a single one missing, with the 1h and 4h charts both firmly above the cluster; on the other, the 1d chart is still bouncing within a downtrend, and CCI only reached 94.7—not quite enough to break 100.
💀 Six indicators say yes, two say no. I’m not opening a position; I’m just watching from here.
👀 What am I waiting for? CCI to cross back above 100, and the MACD histogram to turn positive. If those two don’t give the go-ahead, I won’t touch it even if 0.12450 gets cheaper.
⚡ 0.12450 is the price right now; that 100 line is the doorway I’m waiting for—is it going to turn bullish and signal first, or is this huge bearish candle just the beginning?
Here are the three charts. Are you betting on a recovery and a bullish turn, or another leg down? Pick a side in the comments. 🤔
#ETH #BTC $ETH $BTC
24
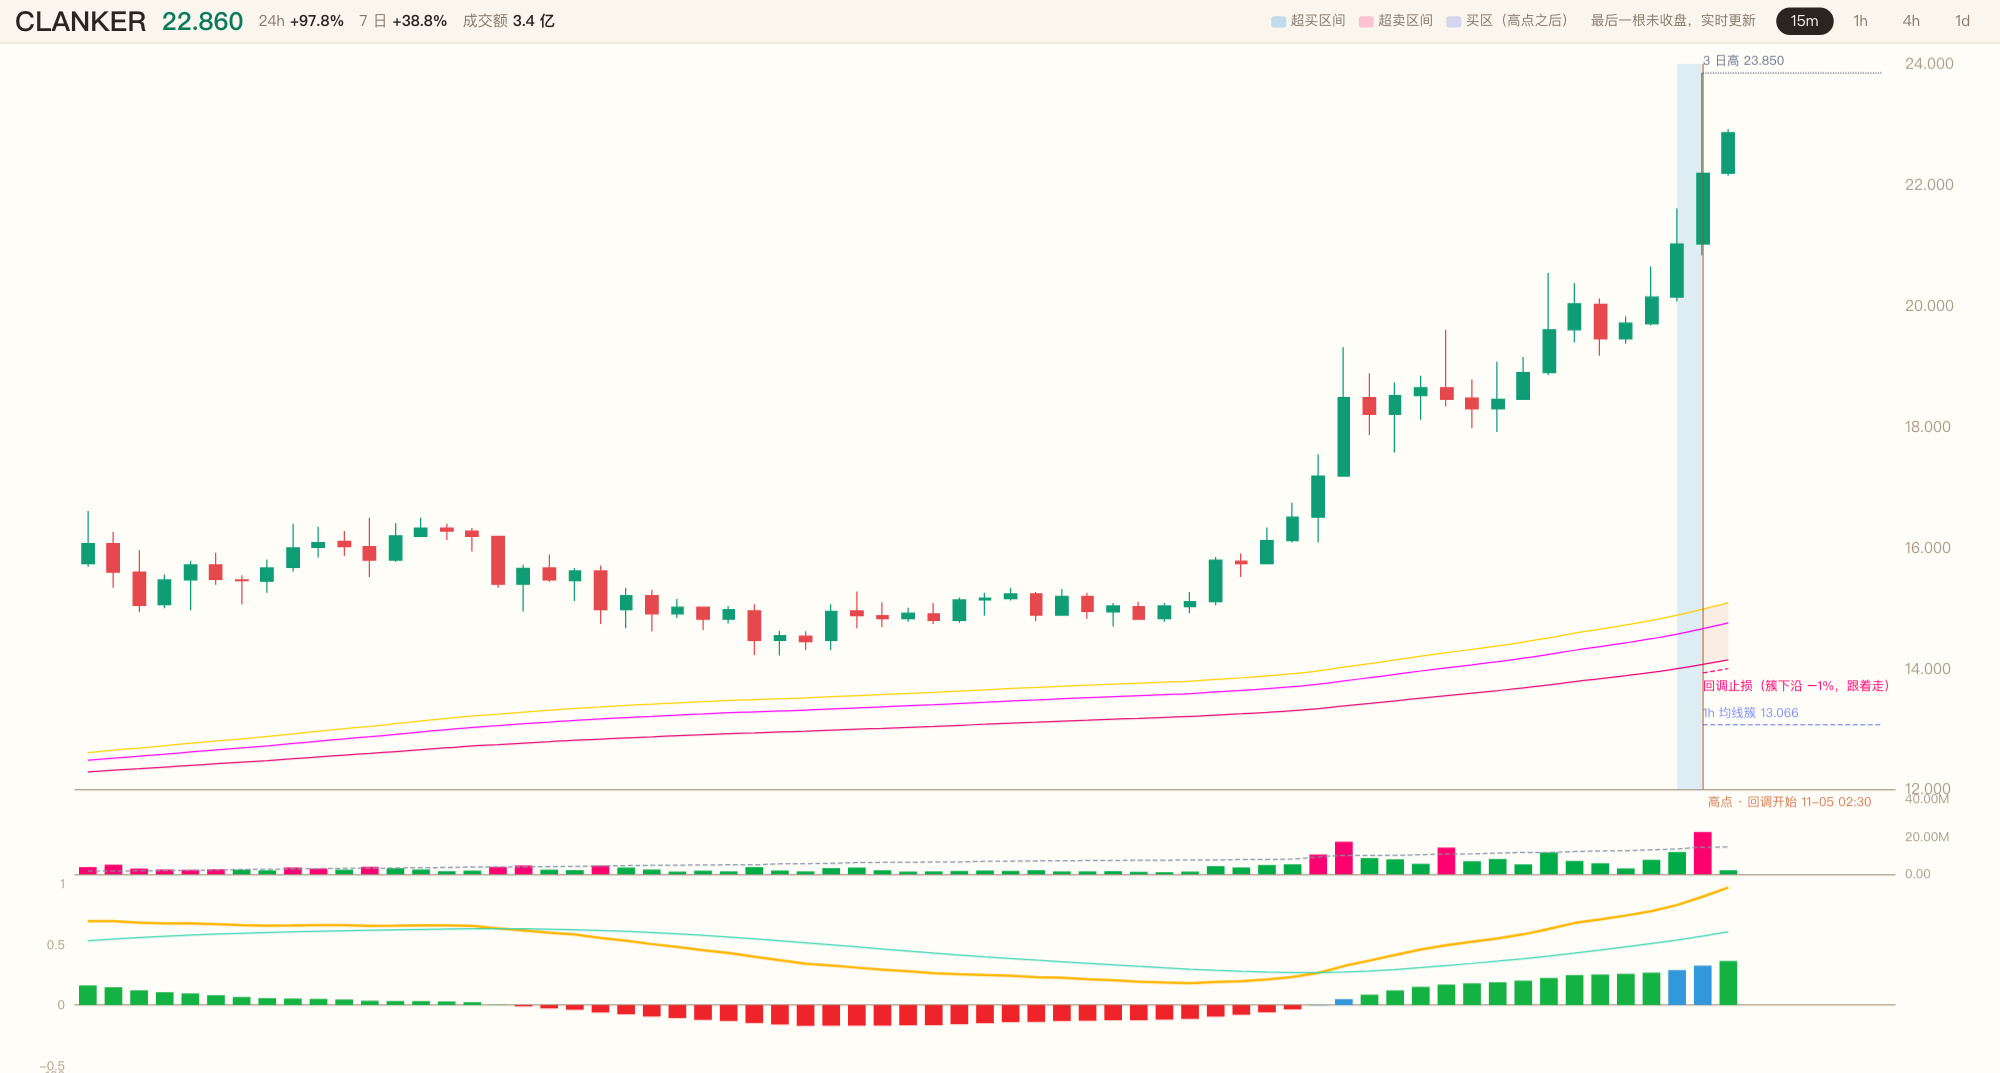
😤 9.8x volume, one candlestick blasted straight through 21.610, which had held for 12 hours, and closed at 22.190.
$CLANKER On this 15-minute candle, the volume is real, and so is the breakout. I stared at the screen without moving.
💀 But when I lay out the conditions, four are positive and three are negative—the 96-bar bearish alignment still accounts for 7%, the closing position is only 62%, the 1h is above the cluster, while the 4h and 1d are still bouncing within a bearish trend.
🔥 Price is 41.30% away from the moving-average cluster, RSI is 76.2, and CCI is 296. This isn't a bullish move with the trend—it's a high-volume breakout within a bearish pileup. Chasing it means buying into an overheated move.
👀 So I didn't open a single position. If it pulls back without falling below the top of the moving-average cluster, around 14.977, and the 1h holds steady, I'll reassess whether to go long. For now, I'm watching.
⚡ 22.190 is the level it just blasted through; 14.977 is the line I drew—which way will it go: push higher on volume, or pull back after this spike? We can talk then.
Here are the three charts. Are you betting it keeps pushing, or drops back near 14.977 first? Pick a side in the comments. 🤔
#ETH #BTC $ETH $BTC
😤 9.8x volume, one candlestick blasted straight through 21.610, which had held for 12 hours, and closed at 22.190.
$CLANKER On this 15-minute candle, the volume is real, and so is the breakout. I stared at the screen without moving.
💀 But when I lay out the conditions, four are positive and three are negative—the 96-bar bearish alignment still accounts for 7%, the closing position is only 62%, the 1h is above the cluster, while the 4h and 1d are still bouncing within a bearish trend.
🔥 Price is 41.30% away from the moving-average cluster, RSI is 76.2, and CCI is 296. This isn't a bullish move with the trend—it's a high-volume breakout within a bearish pileup. Chasing it means buying into an overheated move.
👀 So I didn't open a single position. If it pulls back without falling below the top of the moving-average cluster, around 14.977, and the 1h holds steady, I'll reassess whether to go long. For now, I'm watching.
⚡ 22.190 is the level it just blasted through; 14.977 is the line I drew—which way will it go: push higher on volume, or pull back after this spike? We can talk then.
Here are the three charts. Are you betting it keeps pushing, or drops back near 14.977 first? Pick a side in the comments. 🤔
#ETH #BTC $ETH $BTC
$CLANKER On this 15-minute candle, the volume is real, and so is the breakout. I stared at the screen without moving.
💀 But when I lay out the conditions, four are positive and three are negative—the 96-bar bearish alignment still accounts for 7%, the closing position is only 62%, the 1h is above the cluster, while the 4h and 1d are still bouncing within a bearish trend.
🔥 Price is 41.30% away from the moving-average cluster, RSI is 76.2, and CCI is 296. This isn't a bullish move with the trend—it's a high-volume breakout within a bearish pileup. Chasing it means buying into an overheated move.
👀 So I didn't open a single position. If it pulls back without falling below the top of the moving-average cluster, around 14.977, and the 1h holds steady, I'll reassess whether to go long. For now, I'm watching.
⚡ 22.190 is the level it just blasted through; 14.977 is the line I drew—which way will it go: push higher on volume, or pull back after this spike? We can talk then.
Here are the three charts. Are you betting it keeps pushing, or drops back near 14.977 first? Pick a side in the comments. 🤔
#ETH #BTC $ETH $BTC
32
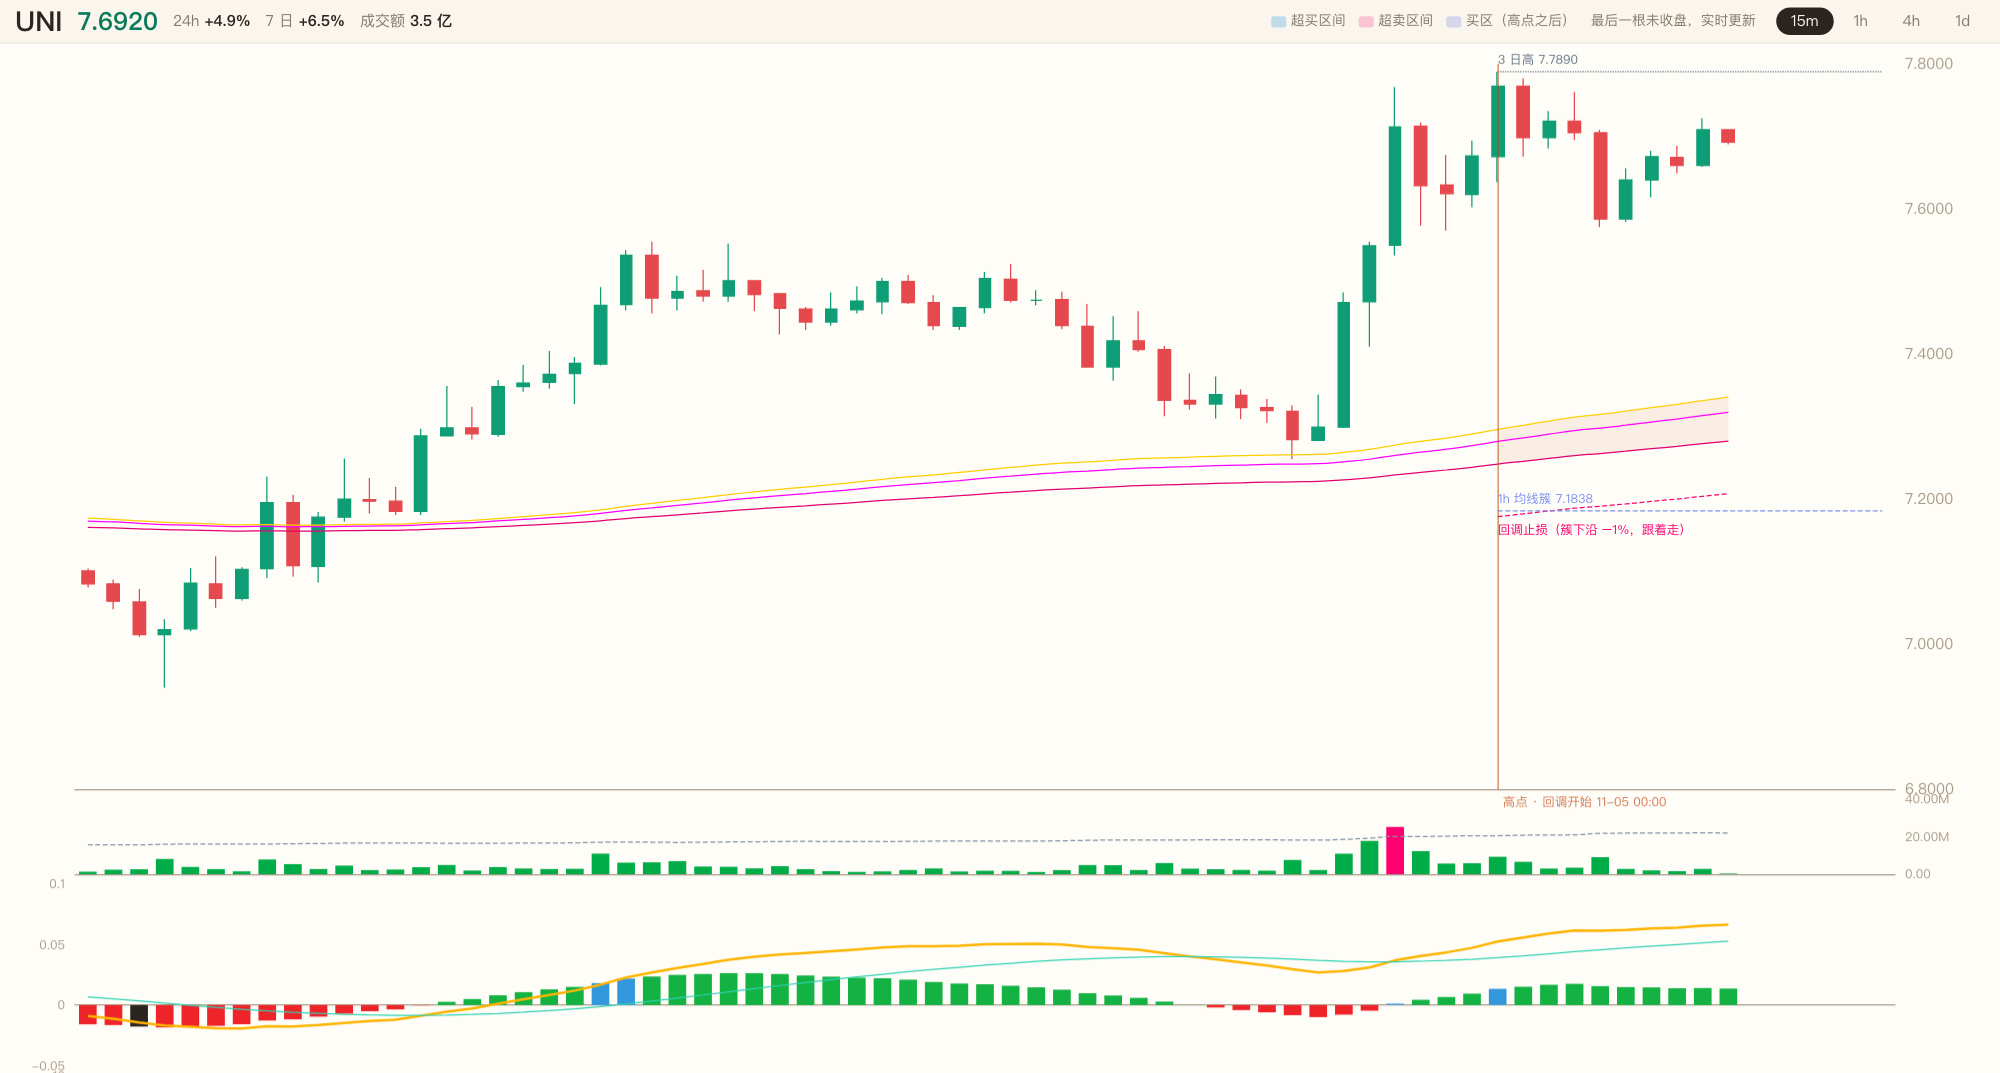
😤 42 candles. A full 42 candles before I finally got this move back—$UNI reclaimed the moving-average cluster on the 15-minute chart, closing at 7.7090.
🔥 After that earlier overbought surge, the pullback low plunged to 7.2550. One candle then pushed the price back above the cluster, up +5.09%. The MACD histogram turned positive at 0.01410, and CCI hit 146.1.
💀 Bulls and bears laid it all out: nearly 100 consecutive 15-minute candles are aligned bullishly, and both the 1h and 1d charts are above the cluster. But the 4h chart is still bouncing within a bearish trend—so the light hasn’t turned green yet.
👀 Seven out of eight signals agree, but I’m not chasing. I’m going long with a small position: 25% at the current price of 7.7090, and 75% placed at 7.3725 to wait for a pullback. Stop-loss at 7.2187. I’ll accept a 6.4% loss; if it breaks below that, I’m out.
⚡ 7.7090 is the price right now; 7.2187 is the line in the sand I’ve drawn. Will it keep pushing up along the cluster, or drop back to 7.3725 first to pick up buyers?
Here are the three charts. Are you betting on an immediate continuation, or waiting for a pullback before getting in? Pick a side in the comments. 🤔
#ETH #BTC $ETH $BTC
😤 42 candles. A full 42 candles before I finally got this move back—$UNI reclaimed the moving-average cluster on the 15-minute chart, closing at 7.7090.
🔥 After that earlier overbought surge, the pullback low plunged to 7.2550. One candle then pushed the price back above the cluster, up +5.09%. The MACD histogram turned positive at 0.01410, and CCI hit 146.1.
💀 Bulls and bears laid it all out: nearly 100 consecutive 15-minute candles are aligned bullishly, and both the 1h and 1d charts are above the cluster. But the 4h chart is still bouncing within a bearish trend—so the light hasn’t turned green yet.
👀 Seven out of eight signals agree, but I’m not chasing. I’m going long with a small position: 25% at the current price of 7.7090, and 75% placed at 7.3725 to wait for a pullback. Stop-loss at 7.2187. I’ll accept a 6.4% loss; if it breaks below that, I’m out.
⚡ 7.7090 is the price right now; 7.2187 is the line in the sand I’ve drawn. Will it keep pushing up along the cluster, or drop back to 7.3725 first to pick up buyers?
Here are the three charts. Are you betting on an immediate continuation, or waiting for a pullback before getting in? Pick a side in the comments. 🤔
#ETH #BTC $ETH $BTC
🔥 After that earlier overbought surge, the pullback low plunged to 7.2550. One candle then pushed the price back above the cluster, up +5.09%. The MACD histogram turned positive at 0.01410, and CCI hit 146.1.
💀 Bulls and bears laid it all out: nearly 100 consecutive 15-minute candles are aligned bullishly, and both the 1h and 1d charts are above the cluster. But the 4h chart is still bouncing within a bearish trend—so the light hasn’t turned green yet.
👀 Seven out of eight signals agree, but I’m not chasing. I’m going long with a small position: 25% at the current price of 7.7090, and 75% placed at 7.3725 to wait for a pullback. Stop-loss at 7.2187. I’ll accept a 6.4% loss; if it breaks below that, I’m out.
⚡ 7.7090 is the price right now; 7.2187 is the line in the sand I’ve drawn. Will it keep pushing up along the cluster, or drop back to 7.3725 first to pick up buyers?
Here are the three charts. Are you betting on an immediate continuation, or waiting for a pullback before getting in? Pick a side in the comments. 🤔
#ETH #BTC $ETH $BTC
31
😤 48x volume. One candle blasted straight through 0.080290, which had held for 12 hours, and closed at 0.080750.
$ELSA That 15-minute move was real volume, and a real breakout. I stared at the screen without moving.
💀 But when I lay out the conditions—only five of seven are flashing green. The bearish setup still accounts for 61% of nearly the last 96 candles. The 1h chart is bouncing while still in bearish territory, and the 1d chart hasn’t given the nod either.
🔥 This isn’t a bullish move with the trend; it’s a high-volume push upward amid a pile of bearish signals. Price is already 16.3% away from the moving-average cluster, with RSI at 75.5 and CCI at 164. Chasing it now means buying into extreme heat.
👀 So I’m staying out. If it pulls back without falling below the top of the moving-average cluster, around 0.069441, and the 1h chart stabilizes, then I’ll see if there’s a long to take. For now, I’m watching.
⚡ 0.080750 is the level it just broke through; 0.069441 is the line I’ve drawn. Will it pull back and hold first, or will this surge fizzle out?
Three charts right here. Are you betting it’ll ride the volume higher, or pull back after the spike before making another move? Pick a side in the comments. 🤔
#ETH #BTC $ETH $BTC
😤 48x volume. One candle blasted straight through 0.080290, which had held for 12 hours, and closed at 0.080750.
$ELSA That 15-minute move was real volume, and a real breakout. I stared at the screen without moving.
💀 But when I lay out the conditions—only five of seven are flashing green. The bearish setup still accounts for 61% of nearly the last 96 candles. The 1h chart is bouncing while still in bearish territory, and the 1d chart hasn’t given the nod either.
🔥 This isn’t a bullish move with the trend; it’s a high-volume push upward amid a pile of bearish signals. Price is already 16.3% away from the moving-average cluster, with RSI at 75.5 and CCI at 164. Chasing it now means buying into extreme heat.
👀 So I’m staying out. If it pulls back without falling below the top of the moving-average cluster, around 0.069441, and the 1h chart stabilizes, then I’ll see if there’s a long to take. For now, I’m watching.
⚡ 0.080750 is the level it just broke through; 0.069441 is the line I’ve drawn. Will it pull back and hold first, or will this surge fizzle out?
Three charts right here. Are you betting it’ll ride the volume higher, or pull back after the spike before making another move? Pick a side in the comments. 🤔
#ETH #BTC $ETH $BTC
$ELSA That 15-minute move was real volume, and a real breakout. I stared at the screen without moving.
💀 But when I lay out the conditions—only five of seven are flashing green. The bearish setup still accounts for 61% of nearly the last 96 candles. The 1h chart is bouncing while still in bearish territory, and the 1d chart hasn’t given the nod either.
🔥 This isn’t a bullish move with the trend; it’s a high-volume push upward amid a pile of bearish signals. Price is already 16.3% away from the moving-average cluster, with RSI at 75.5 and CCI at 164. Chasing it now means buying into extreme heat.
👀 So I’m staying out. If it pulls back without falling below the top of the moving-average cluster, around 0.069441, and the 1h chart stabilizes, then I’ll see if there’s a long to take. For now, I’m watching.
⚡ 0.080750 is the level it just broke through; 0.069441 is the line I’ve drawn. Will it pull back and hold first, or will this surge fizzle out?
Three charts right here. Are you betting it’ll ride the volume higher, or pull back after the spike before making another move? Pick a side in the comments. 🤔
#ETH #BTC $ETH $BTC
22
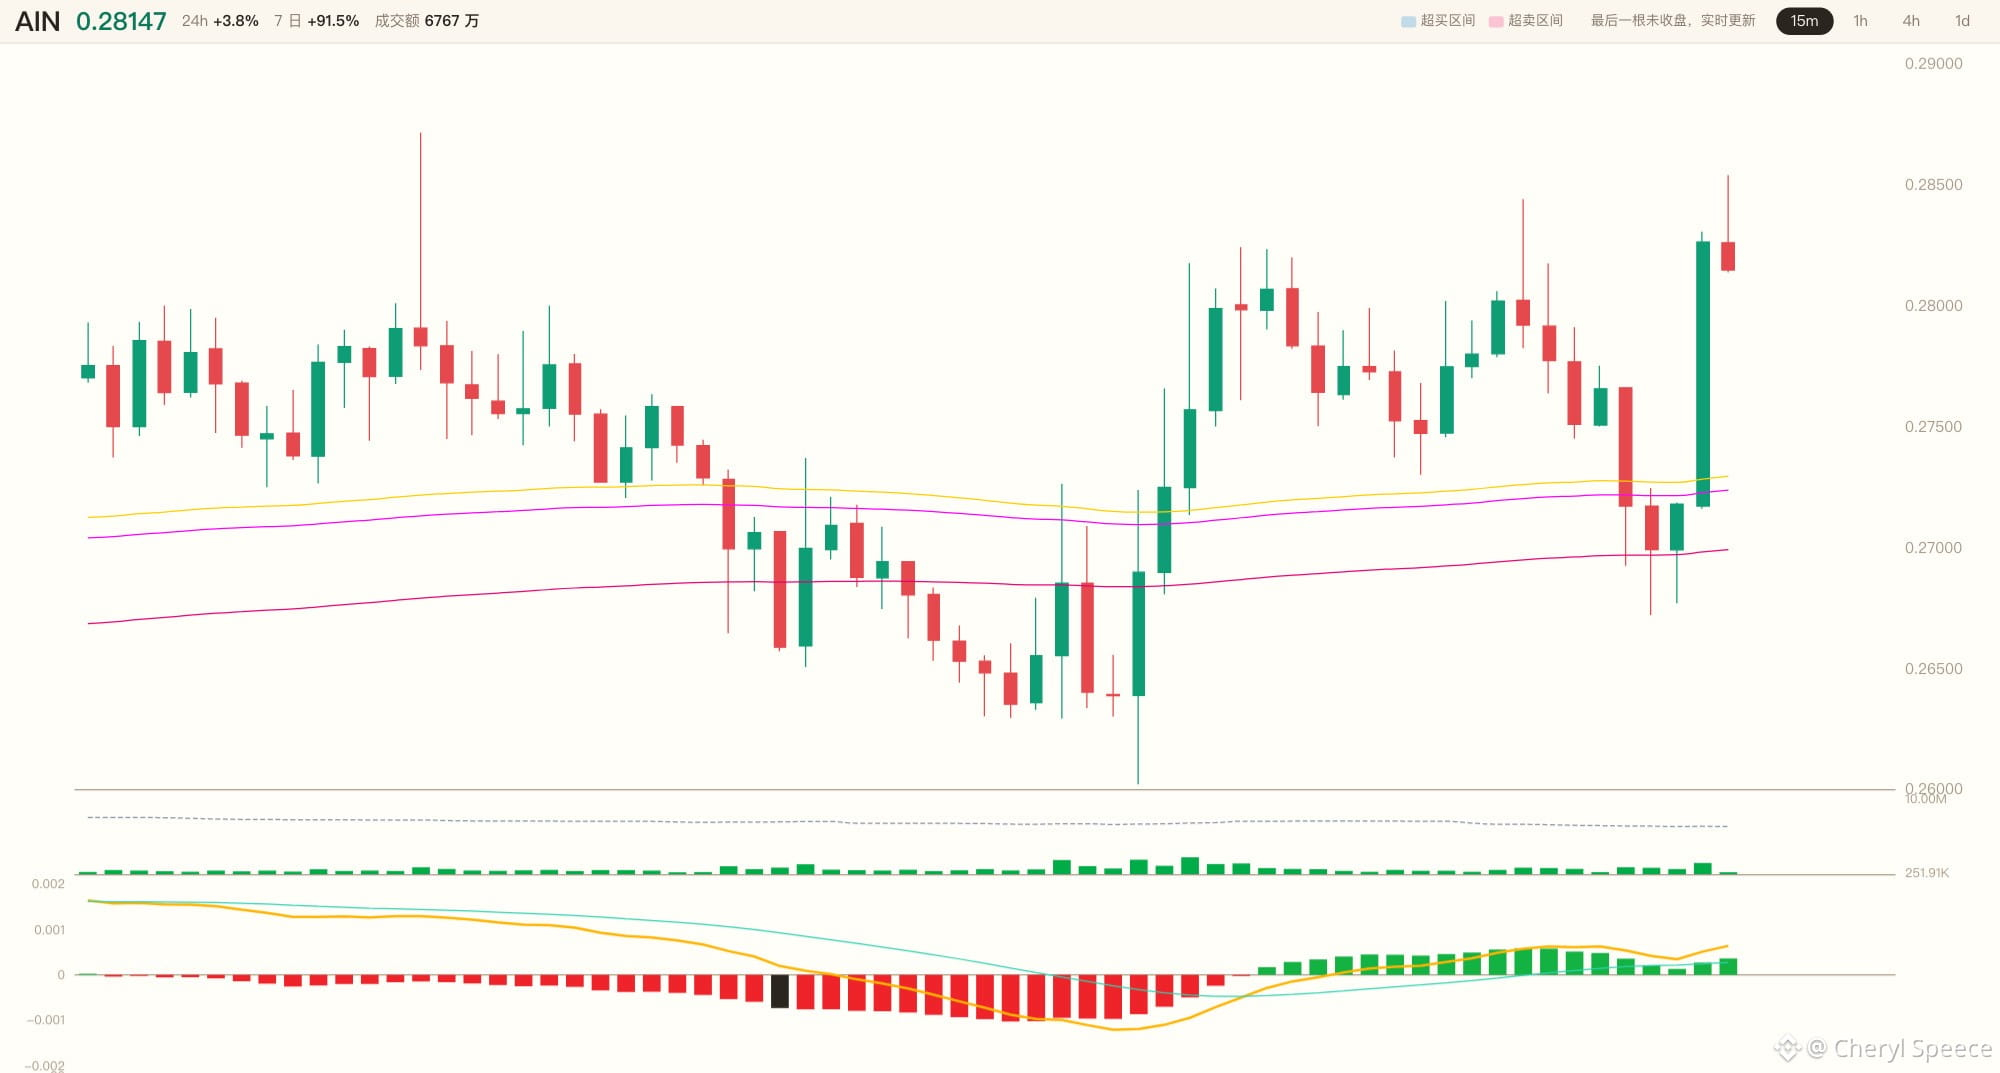
😤 0.28263— all eight conditions are flashing green, but I’m watching the screen and not rushing in.
$AIN This 15-minute candle closed 3.59% above the moving-average cluster, with CCI at 134.7 and the MACD histogram at 0.00027. The bullish alignment has held for all of the last 96 candles, and the close is still near the top, at 96% of the candle’s range.
🔥 Here’s the bull-bear breakdown: on one side, the 15m, 1h, and 4h charts are all above the cluster, and momentum is strengthening again. On the other, the 1d chart is still tangled up in the moving averages— that light hasn’t turned green.
💀 I’m not chasing the price, but I’m taking this setup. Going long with a small position: entry at 0.28263, stop loss at 0.25890. I can live with an 8.4% loss; if it breaks below, I’m out.
👀 0.28263 is the current price, while 0.25890 is the line in the sand I’ve drawn. Will it keep pushing along the cluster, or pull back first before making its next move?
Here are the three charts. Are you betting it keeps rising from here, or drops back toward 0.25890 first? Pick a side in the comments. 🤔
#ETH #BTC $ETH $BTC
😤 0.28263— all eight conditions are flashing green, but I’m watching the screen and not rushing in.
$AIN This 15-minute candle closed 3.59% above the moving-average cluster, with CCI at 134.7 and the MACD histogram at 0.00027. The bullish alignment has held for all of the last 96 candles, and the close is still near the top, at 96% of the candle’s range.
🔥 Here’s the bull-bear breakdown: on one side, the 15m, 1h, and 4h charts are all above the cluster, and momentum is strengthening again. On the other, the 1d chart is still tangled up in the moving averages— that light hasn’t turned green.
💀 I’m not chasing the price, but I’m taking this setup. Going long with a small position: entry at 0.28263, stop loss at 0.25890. I can live with an 8.4% loss; if it breaks below, I’m out.
👀 0.28263 is the current price, while 0.25890 is the line in the sand I’ve drawn. Will it keep pushing along the cluster, or pull back first before making its next move?
Here are the three charts. Are you betting it keeps rising from here, or drops back toward 0.25890 first? Pick a side in the comments. 🤔
#ETH #BTC $ETH $BTC
$AIN This 15-minute candle closed 3.59% above the moving-average cluster, with CCI at 134.7 and the MACD histogram at 0.00027. The bullish alignment has held for all of the last 96 candles, and the close is still near the top, at 96% of the candle’s range.
🔥 Here’s the bull-bear breakdown: on one side, the 15m, 1h, and 4h charts are all above the cluster, and momentum is strengthening again. On the other, the 1d chart is still tangled up in the moving averages— that light hasn’t turned green.
💀 I’m not chasing the price, but I’m taking this setup. Going long with a small position: entry at 0.28263, stop loss at 0.25890. I can live with an 8.4% loss; if it breaks below, I’m out.
👀 0.28263 is the current price, while 0.25890 is the line in the sand I’ve drawn. Will it keep pushing along the cluster, or pull back first before making its next move?
Here are the three charts. Are you betting it keeps rising from here, or drops back toward 0.25890 first? Pick a side in the comments. 🤔
#ETH #BTC $ETH $BTC
5
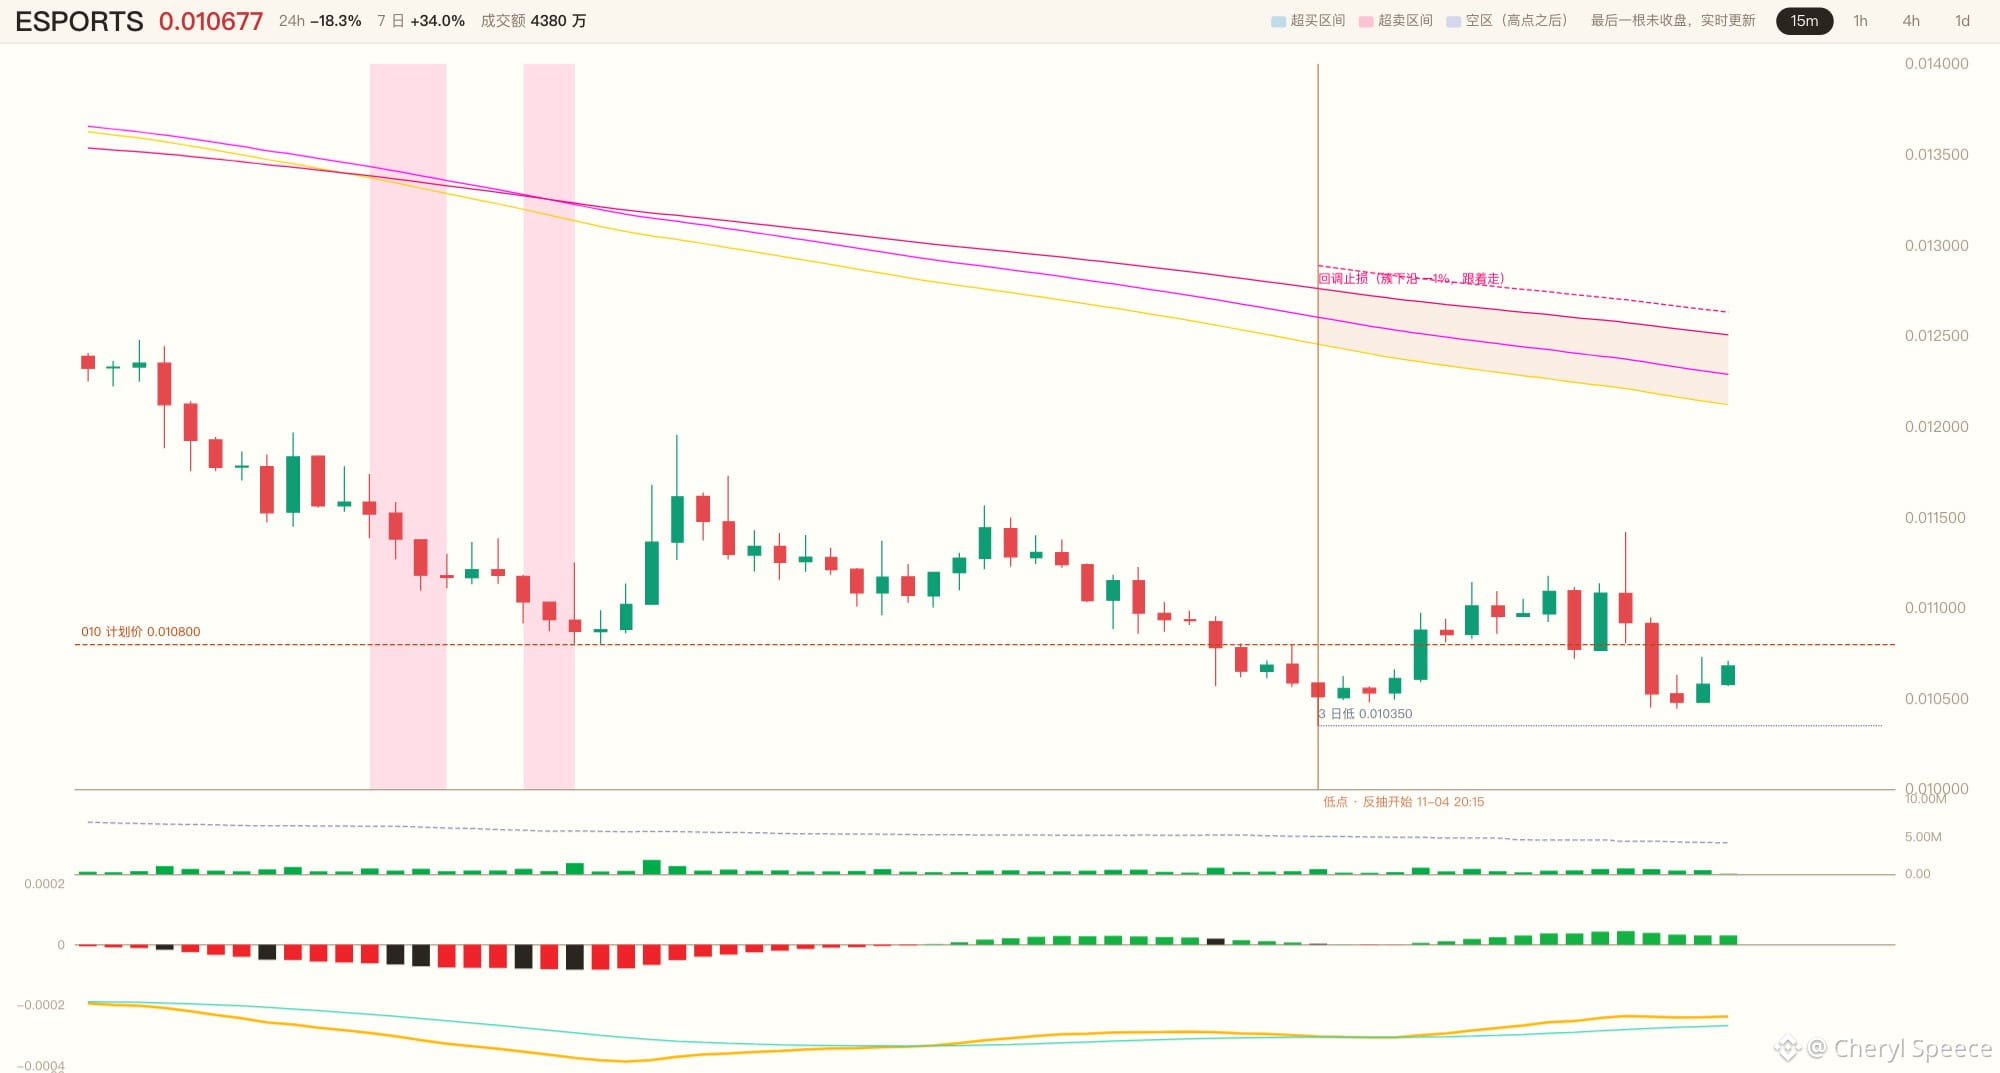
😤 0.010579, still 12.9% away from the moving-average cluster—I’d dare place a limit order, but I wouldn’t chase.
$ESPORTS fifteen-minute candles, 3.6x volume came crashing down, and the MACD histogram has climbed back above the zero line. The recovery is real, and so is the breakdown.
💀 Here’s the bull-bear setup: on one side, the histogram flipped positive after a high-volume breakdown, with the oversold low right beneath us; on the other, 1h, 4h, and 1d are all firmly in bear territory. Only three of the four core signals are lit, and DIF and DEA are both still below zero.
🔥 Don’t mistake a recovery for a reversal. This is oversold territory in a bear market—countertrend trades are for quick in-and-outs only.
👀 I’m not buying at 0.010579. I’ll place a limit order at 0.010800 and wait for a retest. Stop-loss at 0.009936. I can live with an 8% loss; if it breaks below, I’m out. If it doesn’t fill within twenty 15m candles, cancel it.
⚡ 0.010579 is the price right now; 0.010800 is the line I’ve drawn—will it retest first and let me in, or bounce straight off without looking back?
Here are the three charts. Are you betting on a retest to 0.010800 to get in, or do you think it won’t give us a chance at all? Pick a side in the comments. 🤔
#ETH #BTC $ETH $BTC
😤 0.010579, still 12.9% away from the moving-average cluster—I’d dare place a limit order, but I wouldn’t chase.
$ESPORTS fifteen-minute candles, 3.6x volume came crashing down, and the MACD histogram has climbed back above the zero line. The recovery is real, and so is the breakdown.
💀 Here’s the bull-bear setup: on one side, the histogram flipped positive after a high-volume breakdown, with the oversold low right beneath us; on the other, 1h, 4h, and 1d are all firmly in bear territory. Only three of the four core signals are lit, and DIF and DEA are both still below zero.
🔥 Don’t mistake a recovery for a reversal. This is oversold territory in a bear market—countertrend trades are for quick in-and-outs only.
👀 I’m not buying at 0.010579. I’ll place a limit order at 0.010800 and wait for a retest. Stop-loss at 0.009936. I can live with an 8% loss; if it breaks below, I’m out. If it doesn’t fill within twenty 15m candles, cancel it.
⚡ 0.010579 is the price right now; 0.010800 is the line I’ve drawn—will it retest first and let me in, or bounce straight off without looking back?
Here are the three charts. Are you betting on a retest to 0.010800 to get in, or do you think it won’t give us a chance at all? Pick a side in the comments. 🤔
#ETH #BTC $ETH $BTC
$ESPORTS fifteen-minute candles, 3.6x volume came crashing down, and the MACD histogram has climbed back above the zero line. The recovery is real, and so is the breakdown.
💀 Here’s the bull-bear setup: on one side, the histogram flipped positive after a high-volume breakdown, with the oversold low right beneath us; on the other, 1h, 4h, and 1d are all firmly in bear territory. Only three of the four core signals are lit, and DIF and DEA are both still below zero.
🔥 Don’t mistake a recovery for a reversal. This is oversold territory in a bear market—countertrend trades are for quick in-and-outs only.
👀 I’m not buying at 0.010579. I’ll place a limit order at 0.010800 and wait for a retest. Stop-loss at 0.009936. I can live with an 8% loss; if it breaks below, I’m out. If it doesn’t fill within twenty 15m candles, cancel it.
⚡ 0.010579 is the price right now; 0.010800 is the line I’ve drawn—will it retest first and let me in, or bounce straight off without looking back?
Here are the three charts. Are you betting on a retest to 0.010800 to get in, or do you think it won’t give us a chance at all? Pick a side in the comments. 🤔
#ETH #BTC $ETH $BTC
3
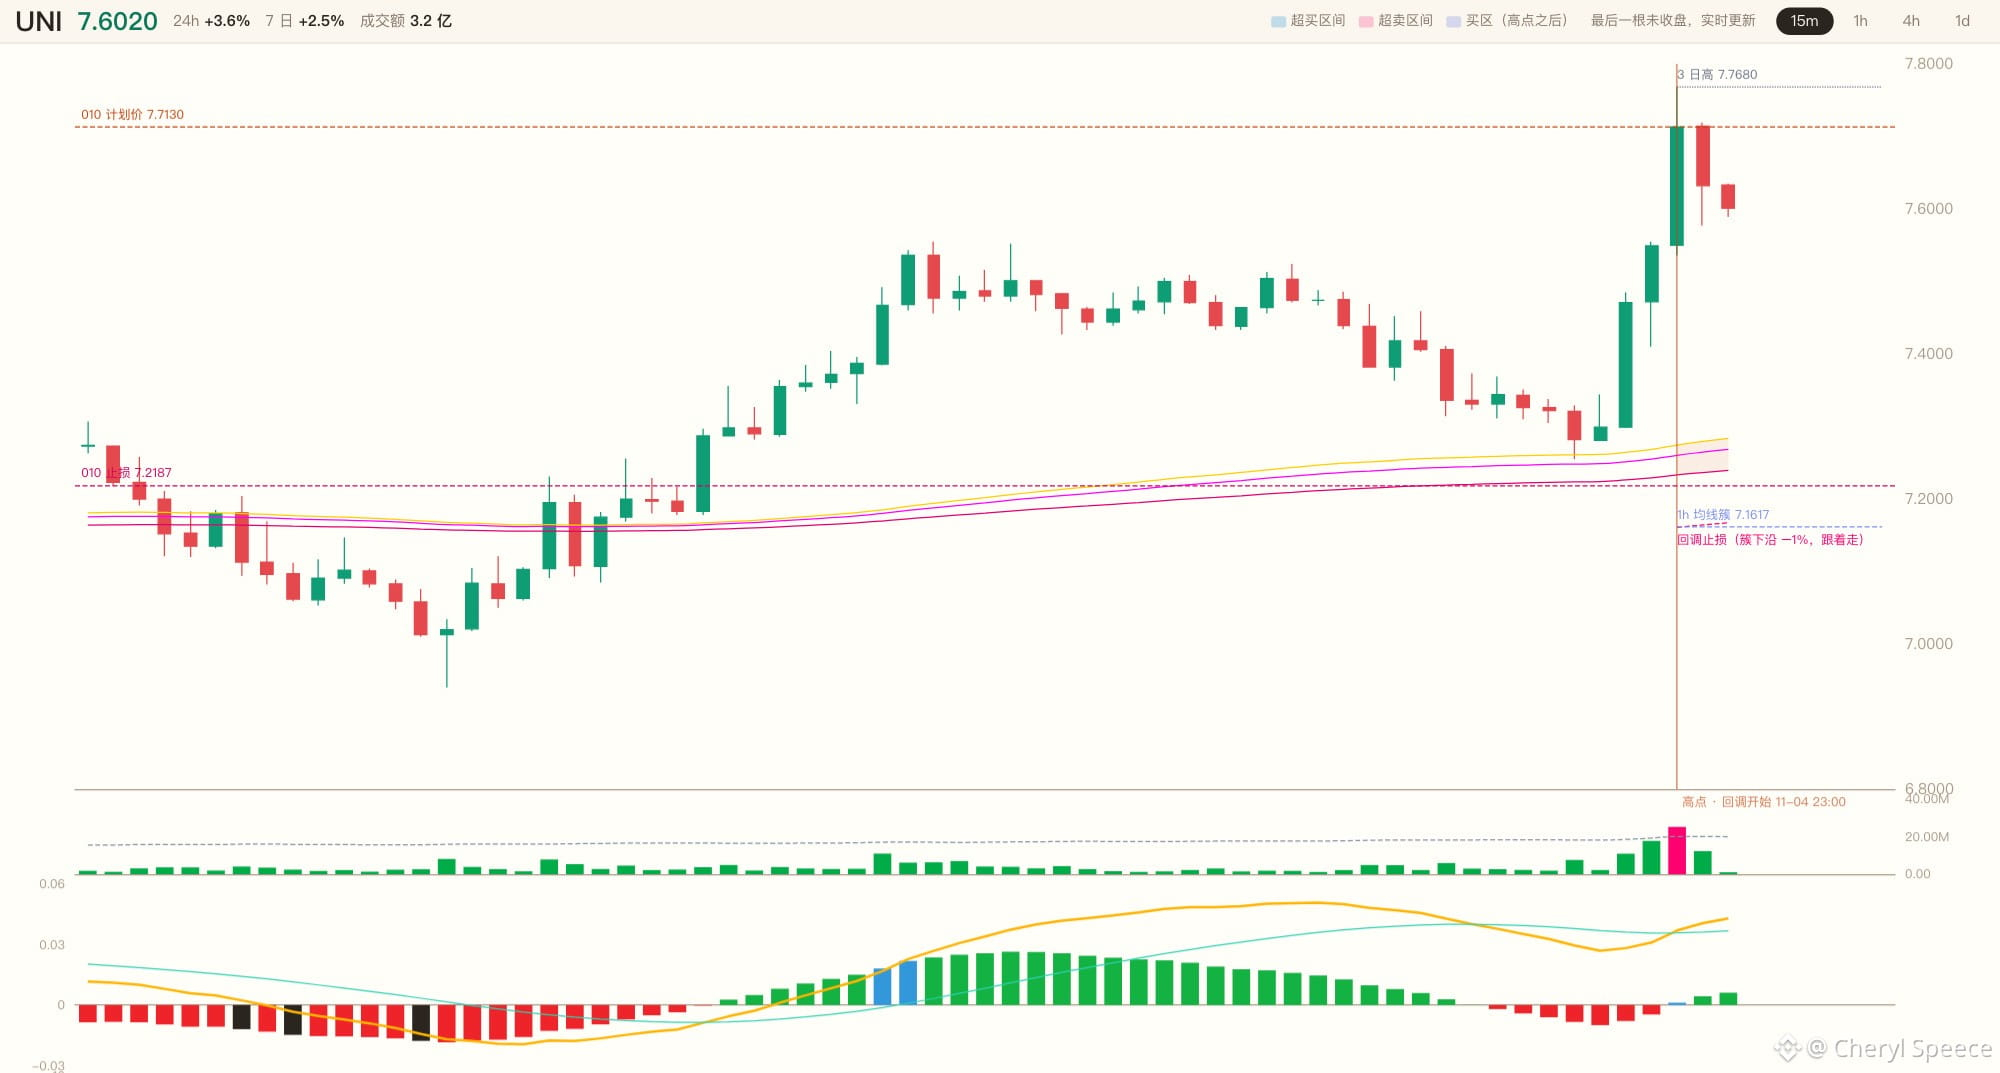
😤 After 31 candles in an overbought rally, price pulled back to 7.2550, then one candle reclaimed the moving-average cluster—$UNI . I’d been waiting for this pullback.
The 15m candle closed at 7.6320, back above the top of the cluster by +4.84%. The MACD histogram turned positive again at 0.00436, and CCI was 181.
💀 The bull-bear picture is clear: on one side, nearly 96 candles in a row showed a 100% bullish alignment, with both the 1h and 1d above the cluster. On the other, the 4h is still bouncing within a bearish trend. That light hasn’t turned green.
🔥 Eight indicators agree, but I’m watching the one that hasn’t turned green—this isn’t a reason to chase; it’s why I don’t dare go in heavy.
👀 Here’s my plan: go long with a small position. Enter with 25% at the current price of 7.6320, and leave 75% bids at 7.3158 to wait for a pullback. Stop-loss at 7.2187. I’ll accept a 5.4% loss; if it breaks below, I’m out.
⚡ 7.6320 is the price right now; 7.2187 is the line I’ve drawn in the sand. Will it keep pushing along the cluster, or pull back to 7.3158 first before making its next move?
Three charts right here. Are you betting it pushes straight on, or drops back to 7.3158 to pick up buyers first? Pick a side in the comments. 🤔
#ETH #BTC $ETH $BTC
😤 After 31 candles in an overbought rally, price pulled back to 7.2550, then one candle reclaimed the moving-average cluster—$UNI . I’d been waiting for this pullback.
The 15m candle closed at 7.6320, back above the top of the cluster by +4.84%. The MACD histogram turned positive again at 0.00436, and CCI was 181.
💀 The bull-bear picture is clear: on one side, nearly 96 candles in a row showed a 100% bullish alignment, with both the 1h and 1d above the cluster. On the other, the 4h is still bouncing within a bearish trend. That light hasn’t turned green.
🔥 Eight indicators agree, but I’m watching the one that hasn’t turned green—this isn’t a reason to chase; it’s why I don’t dare go in heavy.
👀 Here’s my plan: go long with a small position. Enter with 25% at the current price of 7.6320, and leave 75% bids at 7.3158 to wait for a pullback. Stop-loss at 7.2187. I’ll accept a 5.4% loss; if it breaks below, I’m out.
⚡ 7.6320 is the price right now; 7.2187 is the line I’ve drawn in the sand. Will it keep pushing along the cluster, or pull back to 7.3158 first before making its next move?
Three charts right here. Are you betting it pushes straight on, or drops back to 7.3158 to pick up buyers first? Pick a side in the comments. 🤔
#ETH #BTC $ETH $BTC
The 15m candle closed at 7.6320, back above the top of the cluster by +4.84%. The MACD histogram turned positive again at 0.00436, and CCI was 181.
💀 The bull-bear picture is clear: on one side, nearly 96 candles in a row showed a 100% bullish alignment, with both the 1h and 1d above the cluster. On the other, the 4h is still bouncing within a bearish trend. That light hasn’t turned green.
🔥 Eight indicators agree, but I’m watching the one that hasn’t turned green—this isn’t a reason to chase; it’s why I don’t dare go in heavy.
👀 Here’s my plan: go long with a small position. Enter with 25% at the current price of 7.6320, and leave 75% bids at 7.3158 to wait for a pullback. Stop-loss at 7.2187. I’ll accept a 5.4% loss; if it breaks below, I’m out.
⚡ 7.6320 is the price right now; 7.2187 is the line I’ve drawn in the sand. Will it keep pushing along the cluster, or pull back to 7.3158 first before making its next move?
Three charts right here. Are you betting it pushes straight on, or drops back to 7.3158 to pick up buyers first? Pick a side in the comments. 🤔
#ETH #BTC $ETH $BTC
28
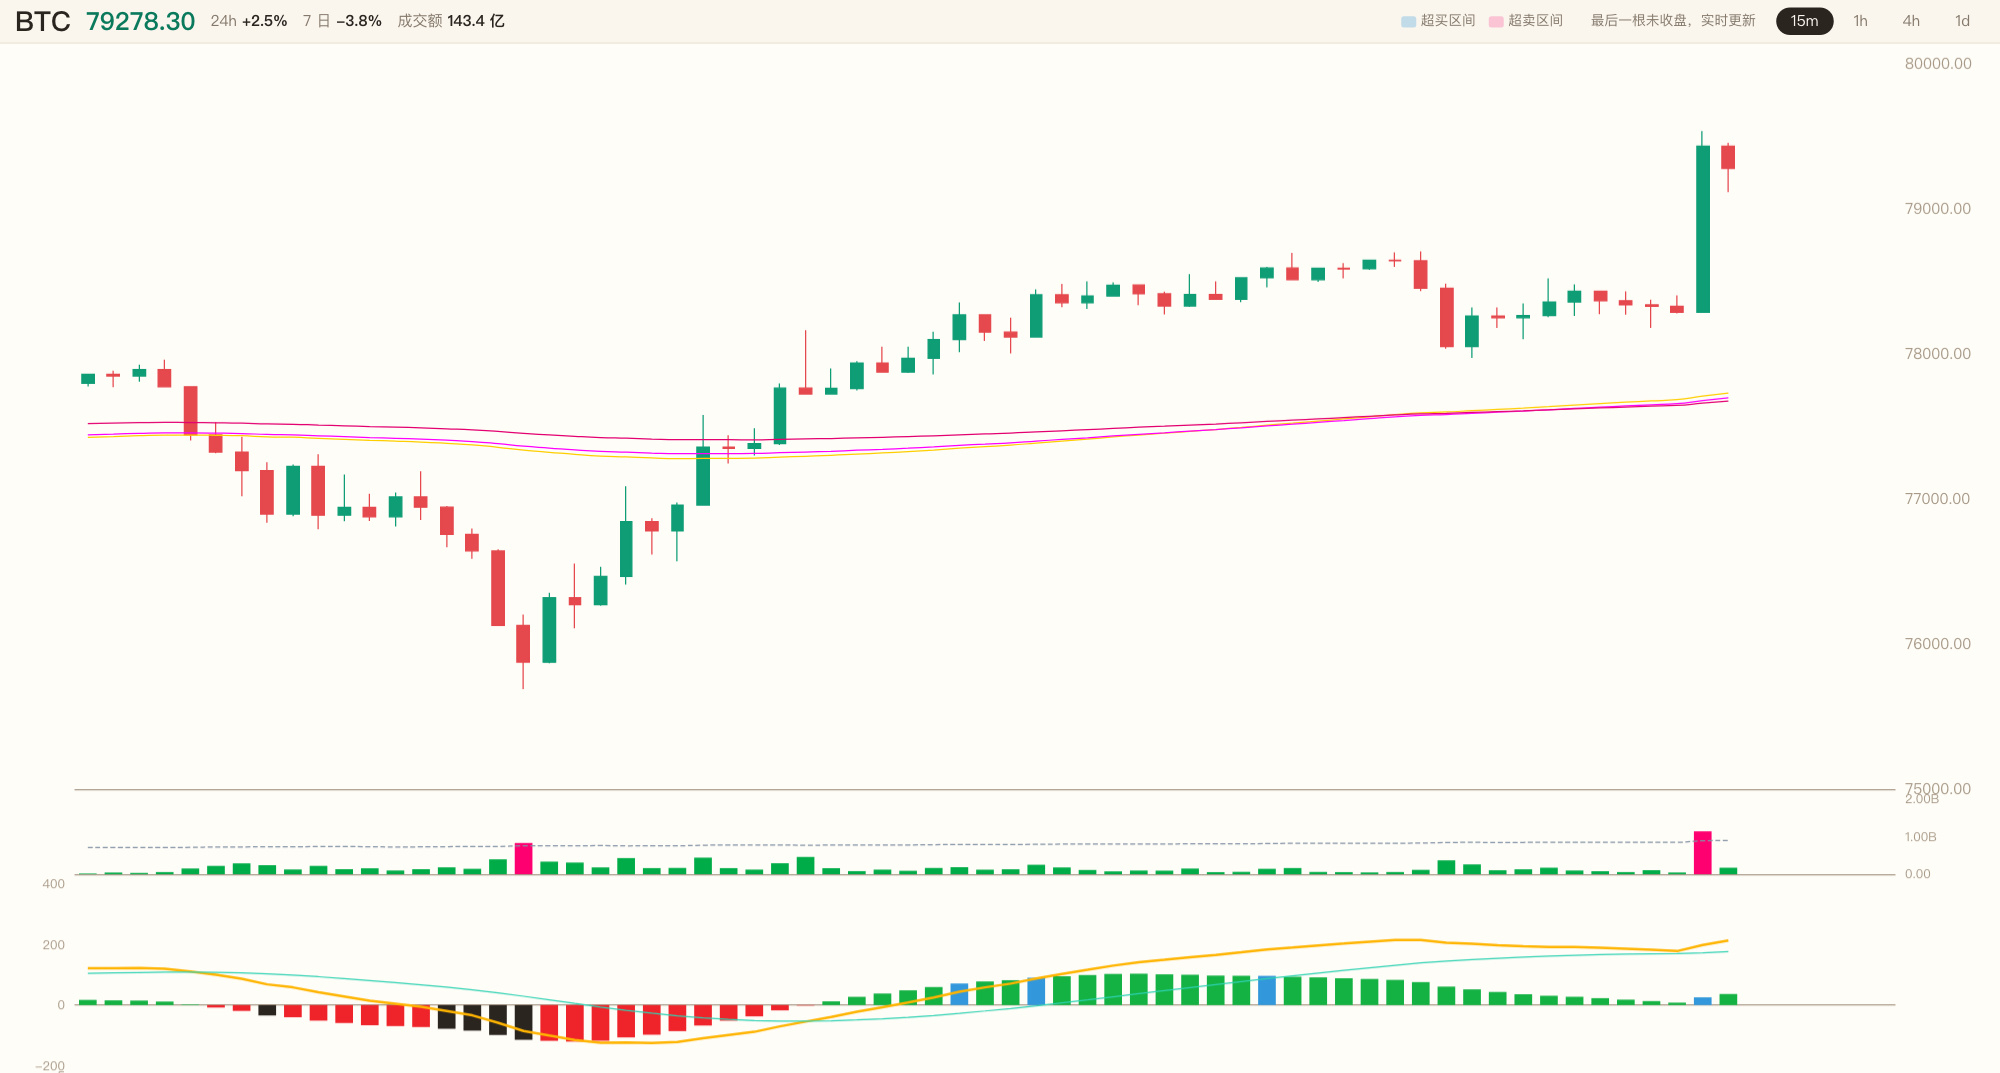
😤 10.2x volume—a single candle smashed through the 78706.80 ceiling that had held for 12 hours, closing at 79432.50.
$BTC That 15-minute move had real volume, and the breakout was real too. I stared at the screen for two seconds.
💀 But when I laid out the conditions one by one, all seven were flashing green: 15m bullish alignment, three lines converging, CCI at 223.8, MACD histogram at 25, and the close still sitting near the 92% high of the candle.
🔥 The thing is, the 1h is still bouncing within a bearish trend, and the 4h is below the cluster. The higher timeframes haven't given the green light, so I can't touch this trade.
👀 So I'm not entering. The plan is an entry at 79432.50 and a stop-loss at 77582.54. I'm willing to accept a 2.3% loss, but I'm not executing it now—not because I'm afraid, but because the 1h light hasn't turned green. I don't want to jump the gun against the trend.
⚡ 79432.50 is the level it just broke through; 77582.54 is the line in the sand I've drawn. Will it hold steady first and wait for the 1h to catch up, or will this surge fizzle out first?
Here are the three charts. Are you betting it rides the volume higher, or pulls back after the spike before making another move? Pick a side in the comments. 🤔
#ETH #BTC $ETH $BTC
😤 10.2x volume—a single candle smashed through the 78706.80 ceiling that had held for 12 hours, closing at 79432.50.
$BTC That 15-minute move had real volume, and the breakout was real too. I stared at the screen for two seconds.
💀 But when I laid out the conditions one by one, all seven were flashing green: 15m bullish alignment, three lines converging, CCI at 223.8, MACD histogram at 25, and the close still sitting near the 92% high of the candle.
🔥 The thing is, the 1h is still bouncing within a bearish trend, and the 4h is below the cluster. The higher timeframes haven't given the green light, so I can't touch this trade.
👀 So I'm not entering. The plan is an entry at 79432.50 and a stop-loss at 77582.54. I'm willing to accept a 2.3% loss, but I'm not executing it now—not because I'm afraid, but because the 1h light hasn't turned green. I don't want to jump the gun against the trend.
⚡ 79432.50 is the level it just broke through; 77582.54 is the line in the sand I've drawn. Will it hold steady first and wait for the 1h to catch up, or will this surge fizzle out first?
Here are the three charts. Are you betting it rides the volume higher, or pulls back after the spike before making another move? Pick a side in the comments. 🤔
#ETH #BTC $ETH $BTC
$BTC That 15-minute move had real volume, and the breakout was real too. I stared at the screen for two seconds.
💀 But when I laid out the conditions one by one, all seven were flashing green: 15m bullish alignment, three lines converging, CCI at 223.8, MACD histogram at 25, and the close still sitting near the 92% high of the candle.
🔥 The thing is, the 1h is still bouncing within a bearish trend, and the 4h is below the cluster. The higher timeframes haven't given the green light, so I can't touch this trade.
👀 So I'm not entering. The plan is an entry at 79432.50 and a stop-loss at 77582.54. I'm willing to accept a 2.3% loss, but I'm not executing it now—not because I'm afraid, but because the 1h light hasn't turned green. I don't want to jump the gun against the trend.
⚡ 79432.50 is the level it just broke through; 77582.54 is the line in the sand I've drawn. Will it hold steady first and wait for the 1h to catch up, or will this surge fizzle out first?
Here are the three charts. Are you betting it rides the volume higher, or pulls back after the spike before making another move? Pick a side in the comments. 🤔
#ETH #BTC $ETH $BTC
20
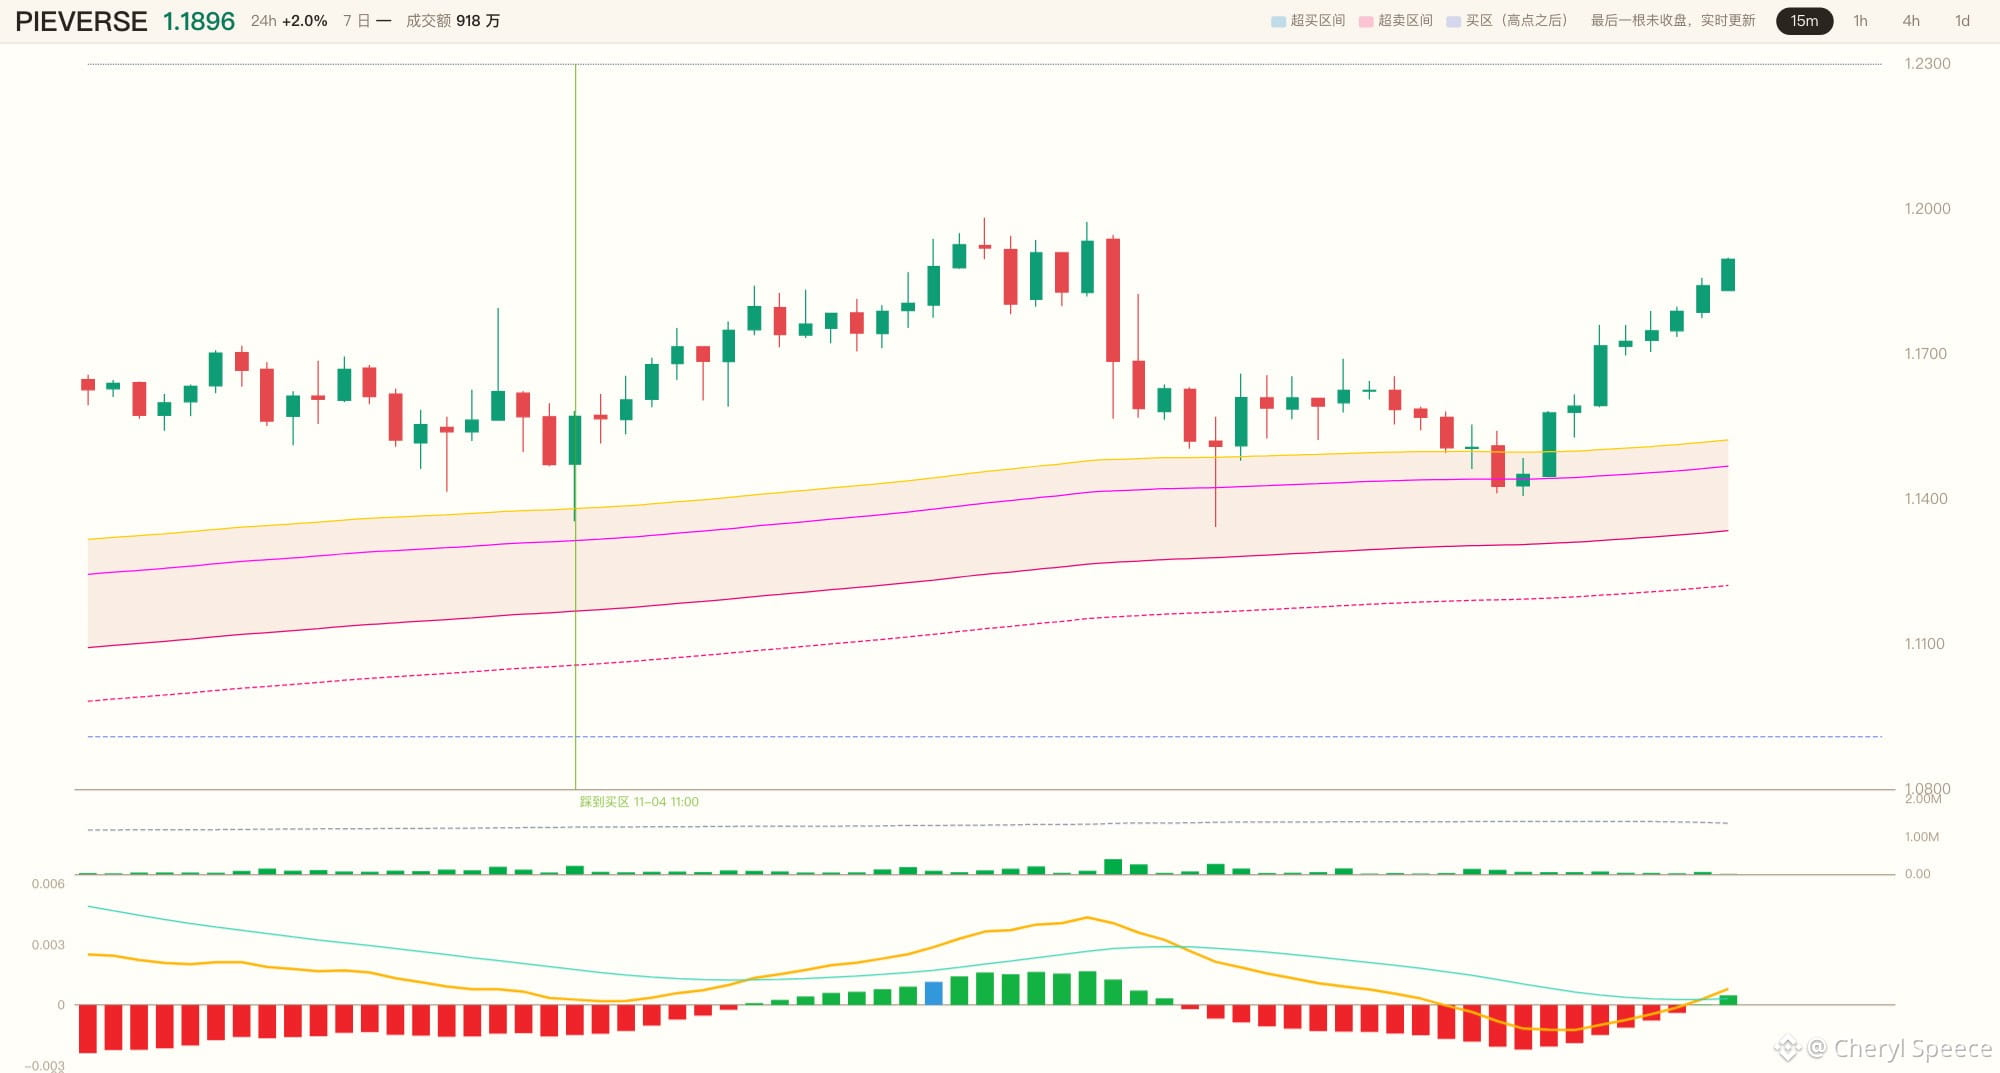
😤 At 1.1841, all eight conditions are lit, but the first thing I notice is that one light on the 4h chart is still off.
$PIEVERSE The 15-minute candle closed 2.81% above the moving-average cluster, CCI is at 144, the MACD histogram has just ticked up to 0.00003, and not a single one of the last 96 candles has broken bullish alignment.
💀 Here’s the bull-bear picture: on one side, the 15m, 1h, and 1d charts are all above the cluster, with the close sitting near the top—at 81% of the candle’s range; on the other, the 4h is still rebounding within a bearish trend, with only 2.81% of room before price reaches the top of the cluster.
🔥 Eight conditions give the nod: seven give me confidence to go with the trend, and one is the rock hanging over my head. This isn’t hesitation—it means I know what I’m getting into.
👀 I don’t chase highs, but I’m taking this trade. Going long with a small position: entry at 1.1841, stop-loss at 1.1285. I accept a 4.7% loss; if it breaks below, I’m out.
⚡ 1.1841 is the price right now; 1.1285 is the line I’ve drawn. Will it keep pushing along the cluster, or pull back first before making its move?
Here are the three charts. Are you betting it continues straight up, or drops back near 1.1285 first? Pick a side in the comments. 🤔
#ETH #BTC $ETH $BTC
😤 At 1.1841, all eight conditions are lit, but the first thing I notice is that one light on the 4h chart is still off.
$PIEVERSE The 15-minute candle closed 2.81% above the moving-average cluster, CCI is at 144, the MACD histogram has just ticked up to 0.00003, and not a single one of the last 96 candles has broken bullish alignment.
💀 Here’s the bull-bear picture: on one side, the 15m, 1h, and 1d charts are all above the cluster, with the close sitting near the top—at 81% of the candle’s range; on the other, the 4h is still rebounding within a bearish trend, with only 2.81% of room before price reaches the top of the cluster.
🔥 Eight conditions give the nod: seven give me confidence to go with the trend, and one is the rock hanging over my head. This isn’t hesitation—it means I know what I’m getting into.
👀 I don’t chase highs, but I’m taking this trade. Going long with a small position: entry at 1.1841, stop-loss at 1.1285. I accept a 4.7% loss; if it breaks below, I’m out.
⚡ 1.1841 is the price right now; 1.1285 is the line I’ve drawn. Will it keep pushing along the cluster, or pull back first before making its move?
Here are the three charts. Are you betting it continues straight up, or drops back near 1.1285 first? Pick a side in the comments. 🤔
#ETH #BTC $ETH $BTC
$PIEVERSE The 15-minute candle closed 2.81% above the moving-average cluster, CCI is at 144, the MACD histogram has just ticked up to 0.00003, and not a single one of the last 96 candles has broken bullish alignment.
💀 Here’s the bull-bear picture: on one side, the 15m, 1h, and 1d charts are all above the cluster, with the close sitting near the top—at 81% of the candle’s range; on the other, the 4h is still rebounding within a bearish trend, with only 2.81% of room before price reaches the top of the cluster.
🔥 Eight conditions give the nod: seven give me confidence to go with the trend, and one is the rock hanging over my head. This isn’t hesitation—it means I know what I’m getting into.
👀 I don’t chase highs, but I’m taking this trade. Going long with a small position: entry at 1.1841, stop-loss at 1.1285. I accept a 4.7% loss; if it breaks below, I’m out.
⚡ 1.1841 is the price right now; 1.1285 is the line I’ve drawn. Will it keep pushing along the cluster, or pull back first before making its move?
Here are the three charts. Are you betting it continues straight up, or drops back near 1.1285 first? Pick a side in the comments. 🤔
#ETH #BTC $ETH $BTC
8
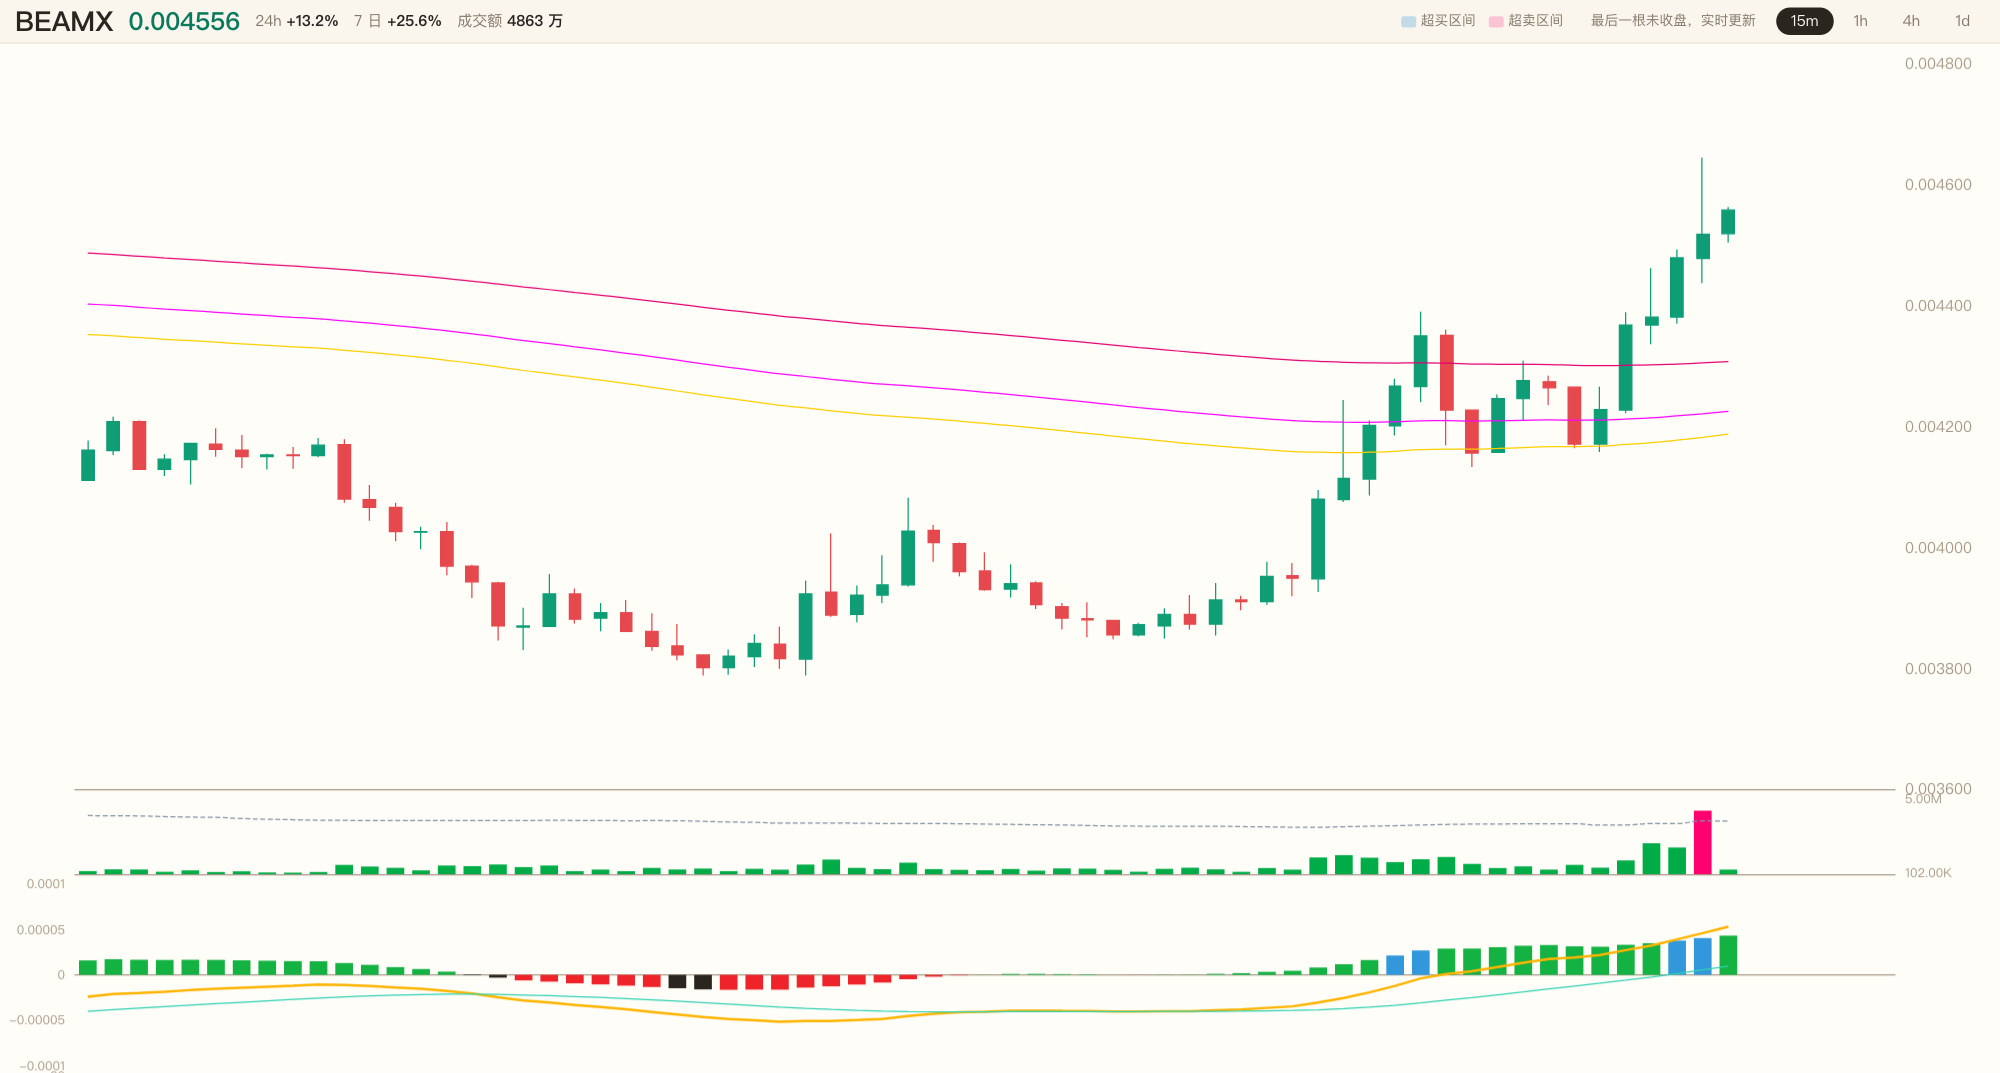
😤 11.3x volume. One candle punched straight through the 12-hour high of 0.004493, closing at 0.004518.
$BEAMX —on that 15-minute move, the volume really came in.
💀 But when I lay out the checklist item by item—all seven are green. The 1h and 4h are both above the moving-average cluster, but the 1d is still tangled up.
🔥 This isn’t a trend-following long. It’s a fire lit in a pile of shorts. The volume is here, and the price is at the right level, but the timeframes aren’t fully aligned. Chase it, and you might just be buying the last puff of a spike.
👀 I’m not opening a position. I’ll wait for a pullback. As long as it doesn’t fall back below the top of the moving-average cluster at 0.004300, and the 1h holds steady, then I’ll consider going long.
⚡ 0.004518 is the price right now; 0.004300 is the line in the sand I’m watching—is the pullback going to offer an entry, or will it bounce and leave without looking back?
Here are the three charts. Are you betting it pulls back to the top of the cluster to pick up buyers, or that it won’t offer a chance to get on board at all? Pick a side in the comments. 🤔
#ETH #BTC $ETH $BTC
😤 11.3x volume. One candle punched straight through the 12-hour high of 0.004493, closing at 0.004518.
$BEAMX —on that 15-minute move, the volume really came in.
💀 But when I lay out the checklist item by item—all seven are green. The 1h and 4h are both above the moving-average cluster, but the 1d is still tangled up.
🔥 This isn’t a trend-following long. It’s a fire lit in a pile of shorts. The volume is here, and the price is at the right level, but the timeframes aren’t fully aligned. Chase it, and you might just be buying the last puff of a spike.
👀 I’m not opening a position. I’ll wait for a pullback. As long as it doesn’t fall back below the top of the moving-average cluster at 0.004300, and the 1h holds steady, then I’ll consider going long.
⚡ 0.004518 is the price right now; 0.004300 is the line in the sand I’m watching—is the pullback going to offer an entry, or will it bounce and leave without looking back?
Here are the three charts. Are you betting it pulls back to the top of the cluster to pick up buyers, or that it won’t offer a chance to get on board at all? Pick a side in the comments. 🤔
#ETH #BTC $ETH $BTC
$BEAMX —on that 15-minute move, the volume really came in.
💀 But when I lay out the checklist item by item—all seven are green. The 1h and 4h are both above the moving-average cluster, but the 1d is still tangled up.
🔥 This isn’t a trend-following long. It’s a fire lit in a pile of shorts. The volume is here, and the price is at the right level, but the timeframes aren’t fully aligned. Chase it, and you might just be buying the last puff of a spike.
👀 I’m not opening a position. I’ll wait for a pullback. As long as it doesn’t fall back below the top of the moving-average cluster at 0.004300, and the 1h holds steady, then I’ll consider going long.
⚡ 0.004518 is the price right now; 0.004300 is the line in the sand I’m watching—is the pullback going to offer an entry, or will it bounce and leave without looking back?
Here are the three charts. Are you betting it pulls back to the top of the cluster to pick up buyers, or that it won’t offer a chance to get on board at all? Pick a side in the comments. 🤔
#ETH #BTC $ETH $BTC
15
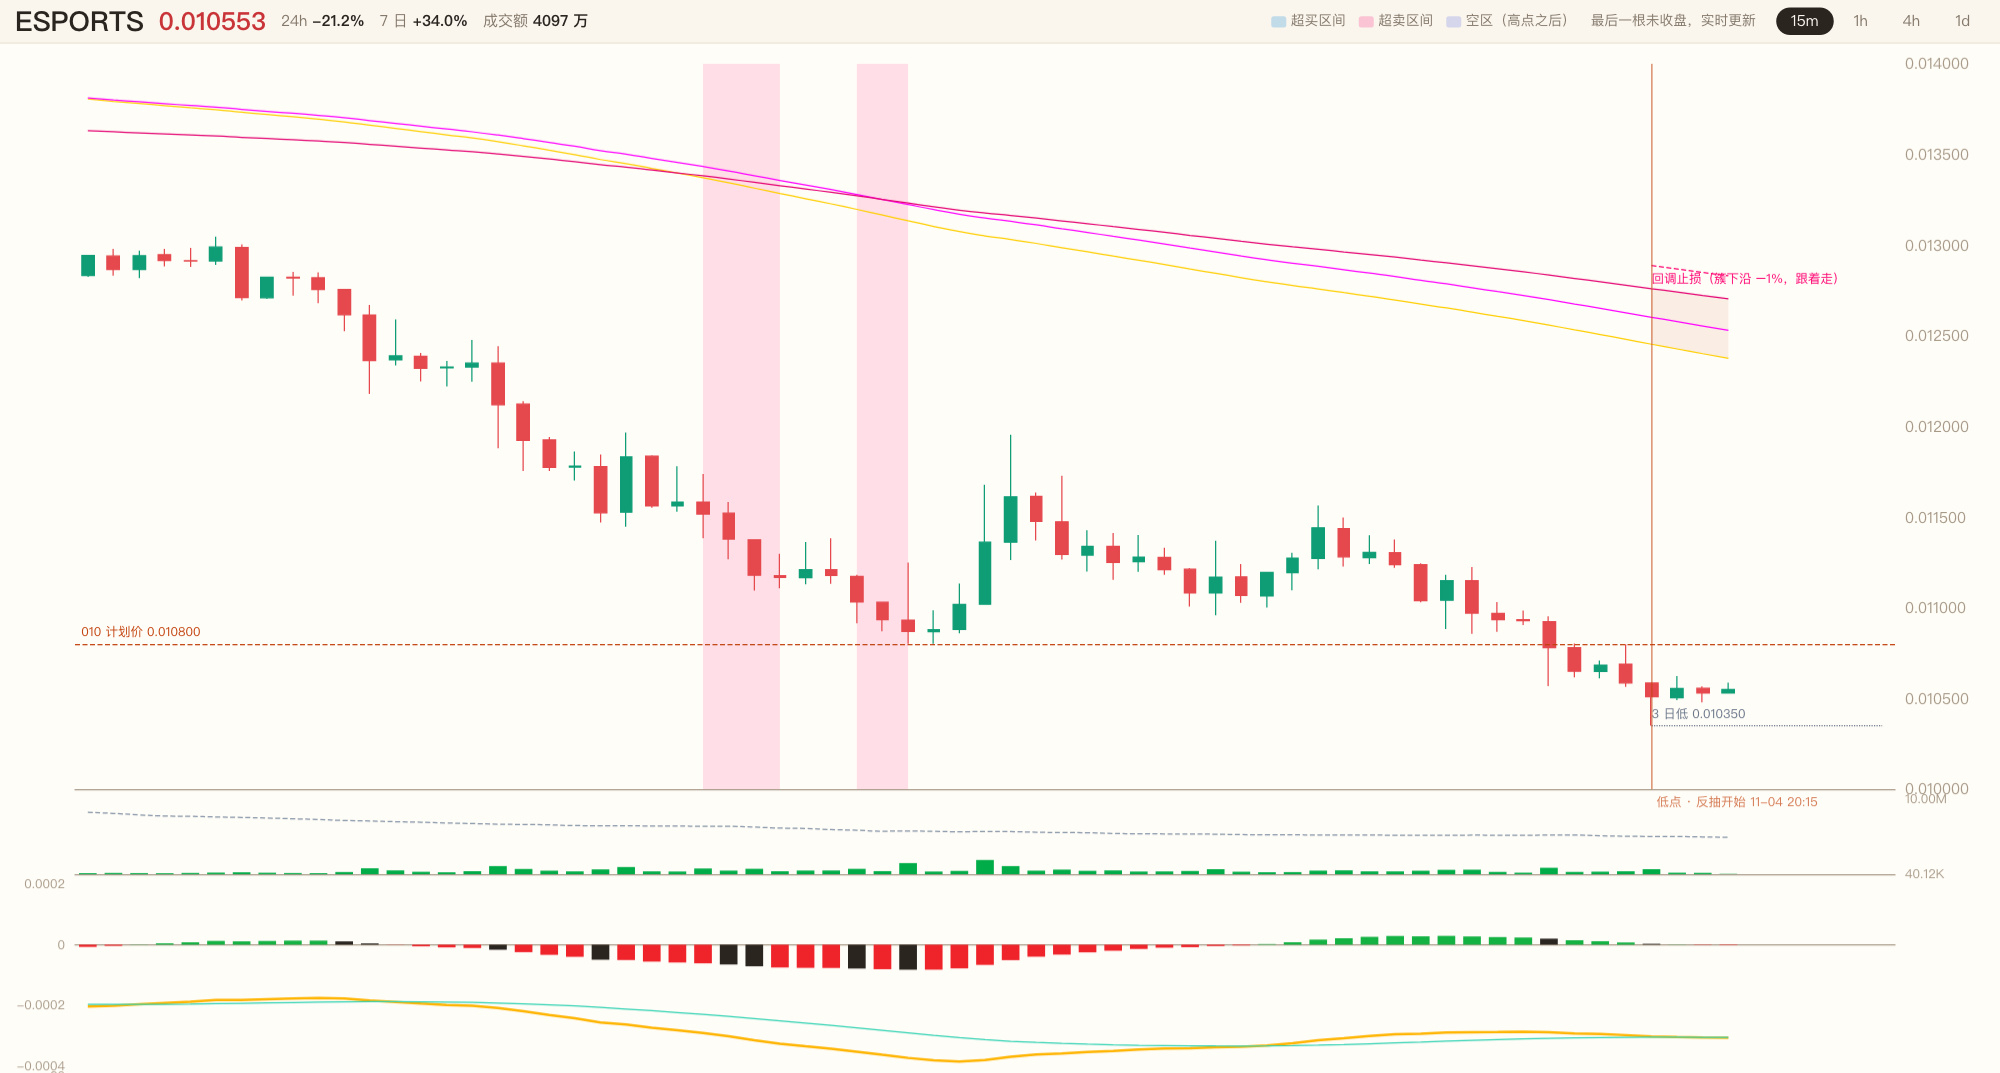
😤 0.010530, a 3.6x-volume candle smashed through—but I didn’t buy at the current price.
$ESPORTS broke down on heavy volume over fifteen minutes. The MACD histogram looks like it might climb back to the zero line, but it’s still below -0.00000, with DIF and DEA both stuck at -0.0003.
💀 Here’s the bull-bear setup: on one side, the 3.6x volume drove a hard selloff, with an oversold low right in sight; on the other, price is 15.1% below the moving-average cluster, and the 1h, 4h, and 1d charts are all firmly bearish. Only two of the four key conditions are lit.
🔥 This is an oversold bounce within a bearish trend, not a reversal. I’m not chasing a countertrend trade at 0.010530.
👀 I’ve got a limit order waiting at 0.010800—I’ll only step in if price pulls back there. Stop-loss at 0.009936. I’ll take the 8% loss if it comes, and exit if it breaks below. If it doesn’t fill within twenty 15m candles, I’ll cancel it.
⚡ 0.010530 is the price right now; 0.010800 is the level I’m waiting for—the key question is, will it pull back there and give me a chance, or bounce away without looking back?
Here are the three charts. Are you betting it pulls back to 0.010800 for an entry, or that it won’t give us a chance to get on board at all? Pick a side in the comments. 🤔
#ETH #BTC $ETH $BTC
😤 0.010530, a 3.6x-volume candle smashed through—but I didn’t buy at the current price.
$ESPORTS broke down on heavy volume over fifteen minutes. The MACD histogram looks like it might climb back to the zero line, but it’s still below -0.00000, with DIF and DEA both stuck at -0.0003.
💀 Here’s the bull-bear setup: on one side, the 3.6x volume drove a hard selloff, with an oversold low right in sight; on the other, price is 15.1% below the moving-average cluster, and the 1h, 4h, and 1d charts are all firmly bearish. Only two of the four key conditions are lit.
🔥 This is an oversold bounce within a bearish trend, not a reversal. I’m not chasing a countertrend trade at 0.010530.
👀 I’ve got a limit order waiting at 0.010800—I’ll only step in if price pulls back there. Stop-loss at 0.009936. I’ll take the 8% loss if it comes, and exit if it breaks below. If it doesn’t fill within twenty 15m candles, I’ll cancel it.
⚡ 0.010530 is the price right now; 0.010800 is the level I’m waiting for—the key question is, will it pull back there and give me a chance, or bounce away without looking back?
Here are the three charts. Are you betting it pulls back to 0.010800 for an entry, or that it won’t give us a chance to get on board at all? Pick a side in the comments. 🤔
#ETH #BTC $ETH $BTC
$ESPORTS broke down on heavy volume over fifteen minutes. The MACD histogram looks like it might climb back to the zero line, but it’s still below -0.00000, with DIF and DEA both stuck at -0.0003.
💀 Here’s the bull-bear setup: on one side, the 3.6x volume drove a hard selloff, with an oversold low right in sight; on the other, price is 15.1% below the moving-average cluster, and the 1h, 4h, and 1d charts are all firmly bearish. Only two of the four key conditions are lit.
🔥 This is an oversold bounce within a bearish trend, not a reversal. I’m not chasing a countertrend trade at 0.010530.
👀 I’ve got a limit order waiting at 0.010800—I’ll only step in if price pulls back there. Stop-loss at 0.009936. I’ll take the 8% loss if it comes, and exit if it breaks below. If it doesn’t fill within twenty 15m candles, I’ll cancel it.
⚡ 0.010530 is the price right now; 0.010800 is the level I’m waiting for—the key question is, will it pull back there and give me a chance, or bounce away without looking back?
Here are the three charts. Are you betting it pulls back to 0.010800 for an entry, or that it won’t give us a chance to get on board at all? Pick a side in the comments. 🤔
#ETH #BTC $ETH $BTC
16
Log in to explore more content
Join global crypto users on Binance Square
⚡️ Get latest and useful information about crypto.
💬 Trusted by the world’s largest crypto exchange.
👍 Discover real insights from verified creators.
Email / Phone number
Trending Topics
BinanceReopensWithdrawalsForMoreAssets
873,461 views
4,644 Discussing
Security Incident | Recovery Update #8: Withdrawals for More Assets to Reopen (2026-11-05)
Binance Announcement
·409 Likes
·1.8M views
Binance98PercentReplenished
202,402 views
1,898 Discussing
USStocksSlipandCryptoMarketUnderBroadPressure
17,389 views
258 Discussing