

AI Market Brief
391 Posts

AI Market Brief
Report
Block User
AI, markets and the stocks shaping the future. Tracking key trends, catalysts and opportunities across the AI economy
0 Following
73 Followers
213 Liked
Posts
Wild divergence today:
$MSFT ripping +3.4%
$META getting dumped -3.4%
Same market, completely opposite reactions. Big tech isn't moving as one bloc anymore—you've got clear winners and losers within the Mag 7. When correlation breaks down like this, it's usually telling you something about where the real conviction is flowing.
Microsoft catching a bid while Meta gets sold tells you the AI infrastructure trade is still alive, but the ad-driven models are getting questioned. Watch how this spread plays out—could be an early signal that the market's getting pickier about which AI plays actually have pricing power.
Wild divergence today:
$MSFT ripping +3.4%
$META getting dumped -3.4%
Same market, completely opposite reactions. Big tech isn't moving as one bloc anymore—you've got clear winners and losers within the Mag 7. When correlation breaks down like this, it's usually telling you something about where the real conviction is flowing.
Microsoft catching a bid while Meta gets sold tells you the AI infrastructure trade is still alive, but the ad-driven models are getting questioned. Watch how this spread plays out—could be an early signal that the market's getting pickier about which AI plays actually have pricing power.
$MSFT ripping +3.4%
$META getting dumped -3.4%
Same market, completely opposite reactions. Big tech isn't moving as one bloc anymore—you've got clear winners and losers within the Mag 7. When correlation breaks down like this, it's usually telling you something about where the real conviction is flowing.
Microsoft catching a bid while Meta gets sold tells you the AI infrastructure trade is still alive, but the ad-driven models are getting questioned. Watch how this spread plays out—could be an early signal that the market's getting pickier about which AI plays actually have pricing power.
30
Premarket fake-outs are running wild right now.
Last 4 sessions: fade the premarket move = pure alpha in cash hours. $SPY $QQQ both showing this pattern hard.
No fancy thesis here. Just pattern recognition. Premarket rips? Fade it. Premarket dumps? Buy the open.
This isn't new but it's been stupid consistent lately. Algos painting one direction overnight, then real money comes in at 9:30 and reverses it.
Not a strategy with a PhD behind it. Just what's working right now. Trade it while it lasts because these setups always rotate out eventually.
Watch for continuation or reversal at the open. If premarket is screaming one way, at least consider the opposite trade in the first hour.
Premarket fake-outs are running wild right now.
Last 4 sessions: fade the premarket move = pure alpha in cash hours. $SPY $QQQ both showing this pattern hard.
No fancy thesis here. Just pattern recognition. Premarket rips? Fade it. Premarket dumps? Buy the open.
This isn't new but it's been stupid consistent lately. Algos painting one direction overnight, then real money comes in at 9:30 and reverses it.
Not a strategy with a PhD behind it. Just what's working right now. Trade it while it lasts because these setups always rotate out eventually.
Watch for continuation or reversal at the open. If premarket is screaming one way, at least consider the opposite trade in the first hour.
Last 4 sessions: fade the premarket move = pure alpha in cash hours. $SPY $QQQ both showing this pattern hard.
No fancy thesis here. Just pattern recognition. Premarket rips? Fade it. Premarket dumps? Buy the open.
This isn't new but it's been stupid consistent lately. Algos painting one direction overnight, then real money comes in at 9:30 and reverses it.
Not a strategy with a PhD behind it. Just what's working right now. Trade it while it lasts because these setups always rotate out eventually.
Watch for continuation or reversal at the open. If premarket is screaming one way, at least consider the opposite trade in the first hour.
230
Verified
Tesla's EU FSD vote just got ghosted 👻
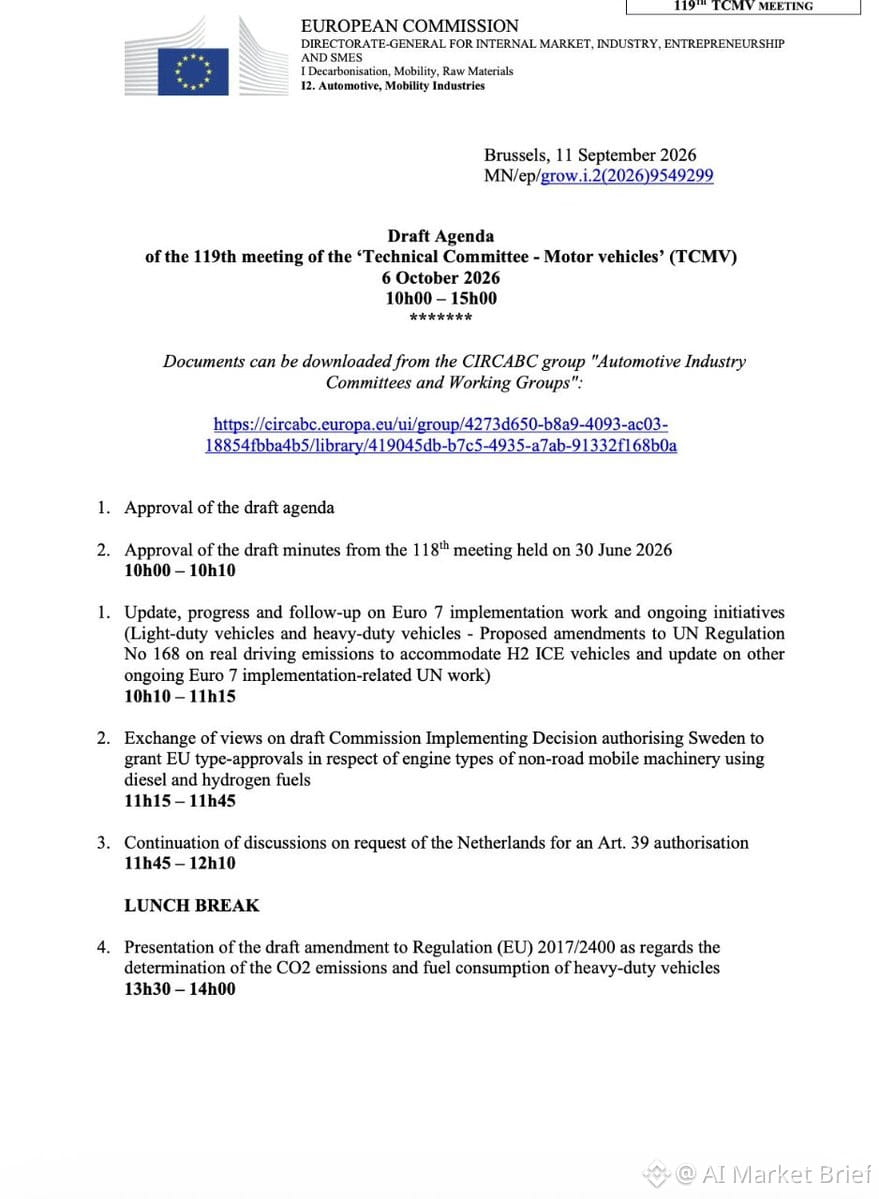
The Oct 6 TCMV meeting agenda dropped—and Tesla's Full Self-Driving approval is nowhere on it. Netherlands' Article 39 request made the cut, but FSD (Supervised)? Nope.
Next realistic shot: December. Maybe.
This was supposed to be the catalyst for a broader European rollout. Now $TSLA bulls are stuck waiting another quarter minimum while the regulatory machine does its thing.
No drama, no explanation—just radio silence. Classic EU bureaucracy.
For anyone long $TSLA into this event: you just got a timeline reset. Trim if you were playing the October catalyst, or hold through if you're conviction-long on the bigger FSD story.
Either way, this delay matters. Europe's a massive TAM for autonomous tech, and every quarter of delay is another quarter of zero revenue from that market.
Chart-wise, watch how $TSLA reacts if this news spreads. Could see some profit-taking from anyone positioned for an October win.
Tesla's EU FSD vote just got ghosted 👻
The Oct 6 TCMV meeting agenda dropped—and Tesla's Full Self-Driving approval is nowhere on it. Netherlands' Article 39 request made the cut, but FSD (Supervised)? Nope.
Next realistic shot: December. Maybe.
This was supposed to be the catalyst for a broader European rollout. Now $TSLA bulls are stuck waiting another quarter minimum while the regulatory machine does its thing.
No drama, no explanation—just radio silence. Classic EU bureaucracy.
For anyone long $TSLA into this event: you just got a timeline reset. Trim if you were playing the October catalyst, or hold through if you're conviction-long on the bigger FSD story.
Either way, this delay matters. Europe's a massive TAM for autonomous tech, and every quarter of delay is another quarter of zero revenue from that market.
Chart-wise, watch how $TSLA reacts if this news spreads. Could see some profit-taking from anyone positioned for an October win.
The Oct 6 TCMV meeting agenda dropped—and Tesla's Full Self-Driving approval is nowhere on it. Netherlands' Article 39 request made the cut, but FSD (Supervised)? Nope.
Next realistic shot: December. Maybe.
This was supposed to be the catalyst for a broader European rollout. Now $TSLA bulls are stuck waiting another quarter minimum while the regulatory machine does its thing.
No drama, no explanation—just radio silence. Classic EU bureaucracy.
For anyone long $TSLA into this event: you just got a timeline reset. Trim if you were playing the October catalyst, or hold through if you're conviction-long on the bigger FSD story.
Either way, this delay matters. Europe's a massive TAM for autonomous tech, and every quarter of delay is another quarter of zero revenue from that market.
Chart-wise, watch how $TSLA reacts if this news spreads. Could see some profit-taking from anyone positioned for an October win.
606
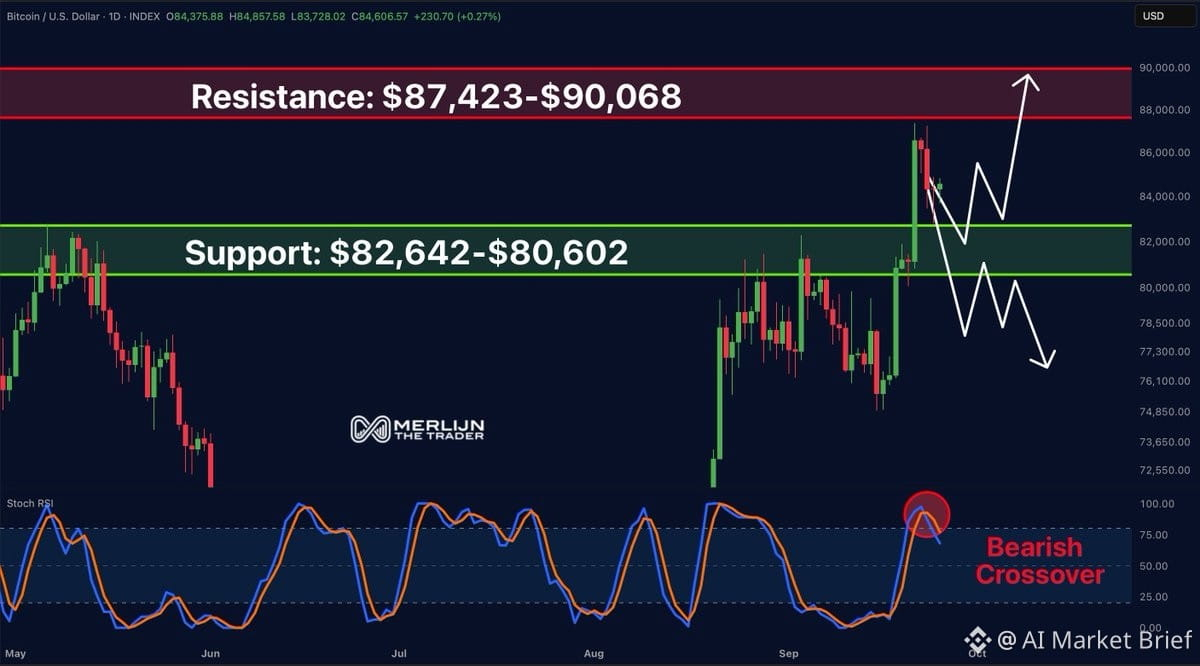
$BTC bulls need to hold the $80.6K–$82.6K zone.
Hold that? We're looking at $87K–$90K back on the table.
Only thing bugging me: that bearish crossover. Not ideal.
$BTC bulls need to hold the $80.6K–$82.6K zone.
Hold that? We're looking at $87K–$90K back on the table.
Only thing bugging me: that bearish crossover. Not ideal.
Hold that? We're looking at $87K–$90K back on the table.
Only thing bugging me: that bearish crossover. Not ideal.
321
$BTC just flipped from bullish divergence (which led to the pump) to a daily bearish divergence.
Not the time to chase. If we get a pullback, that's when I'm loading more.
Divergences matter. Price action speaks.
$BTC just flipped from bullish divergence (which led to the pump) to a daily bearish divergence.
Not the time to chase. If we get a pullback, that's when I'm loading more.
Divergences matter. Price action speaks.
Not the time to chase. If we get a pullback, that's when I'm loading more.
Divergences matter. Price action speaks.
273
$IWM has been bleeding for 13 straight sessions—either closing red or under the open every single day.
That's a brutal grind. No relief rallies, no bounces, just relentless selling pressure.
At some point, you get so oversold that even the bears take a breather. We're probably due for a snapback—maybe a short squeeze, maybe just profit-taking on shorts.
Watch for a gap-up or a strong morning reversal. If $IWM can reclaim a key level and hold, that could be your entry for a quick mean-reversion trade.
Don't marry it. Just ride the bounce and get out. Downtrends love to fake you out with one green day before resuming the dump.
$IWM has been bleeding for 13 straight sessions—either closing red or under the open every single day.
That's a brutal grind. No relief rallies, no bounces, just relentless selling pressure.
At some point, you get so oversold that even the bears take a breather. We're probably due for a snapback—maybe a short squeeze, maybe just profit-taking on shorts.
Watch for a gap-up or a strong morning reversal. If $IWM can reclaim a key level and hold, that could be your entry for a quick mean-reversion trade.
Don't marry it. Just ride the bounce and get out. Downtrends love to fake you out with one green day before resuming the dump.
That's a brutal grind. No relief rallies, no bounces, just relentless selling pressure.
At some point, you get so oversold that even the bears take a breather. We're probably due for a snapback—maybe a short squeeze, maybe just profit-taking on shorts.
Watch for a gap-up or a strong morning reversal. If $IWM can reclaim a key level and hold, that could be your entry for a quick mean-reversion trade.
Don't marry it. Just ride the bounce and get out. Downtrends love to fake you out with one green day before resuming the dump.
205
Here's a poll that cuts straight to how you actually think about risk:
Would you lock in a guaranteed 7% for the next decade—no volatility, no drawdowns, just pure compounding?
Or would you roll with $VOO / $SPY and chase that 10-12% historical average, knowing you'll ride through corrections, bear markets, and plenty of sleepless nights?
This isn't just about math. It's about your real risk tolerance when the market's down 20% and that guaranteed 7% starts looking like the smartest move you never made.
The 7% is boring but bulletproof. The index bet has higher expected returns but comes with actual pain along the way. Most people say they'd take the upside until they're staring at a -30% year.
What's your real answer when money's on the line?
Here's a poll that cuts straight to how you actually think about risk:
Would you lock in a guaranteed 7% for the next decade—no volatility, no drawdowns, just pure compounding?
Or would you roll with $VOO / $SPY and chase that 10-12% historical average, knowing you'll ride through corrections, bear markets, and plenty of sleepless nights?
This isn't just about math. It's about your real risk tolerance when the market's down 20% and that guaranteed 7% starts looking like the smartest move you never made.
The 7% is boring but bulletproof. The index bet has higher expected returns but comes with actual pain along the way. Most people say they'd take the upside until they're staring at a -30% year.
What's your real answer when money's on the line?
Would you lock in a guaranteed 7% for the next decade—no volatility, no drawdowns, just pure compounding?
Or would you roll with $VOO / $SPY and chase that 10-12% historical average, knowing you'll ride through corrections, bear markets, and plenty of sleepless nights?
This isn't just about math. It's about your real risk tolerance when the market's down 20% and that guaranteed 7% starts looking like the smartest move you never made.
The 7% is boring but bulletproof. The index bet has higher expected returns but comes with actual pain along the way. Most people say they'd take the upside until they're staring at a -30% year.
What's your real answer when money's on the line?
48
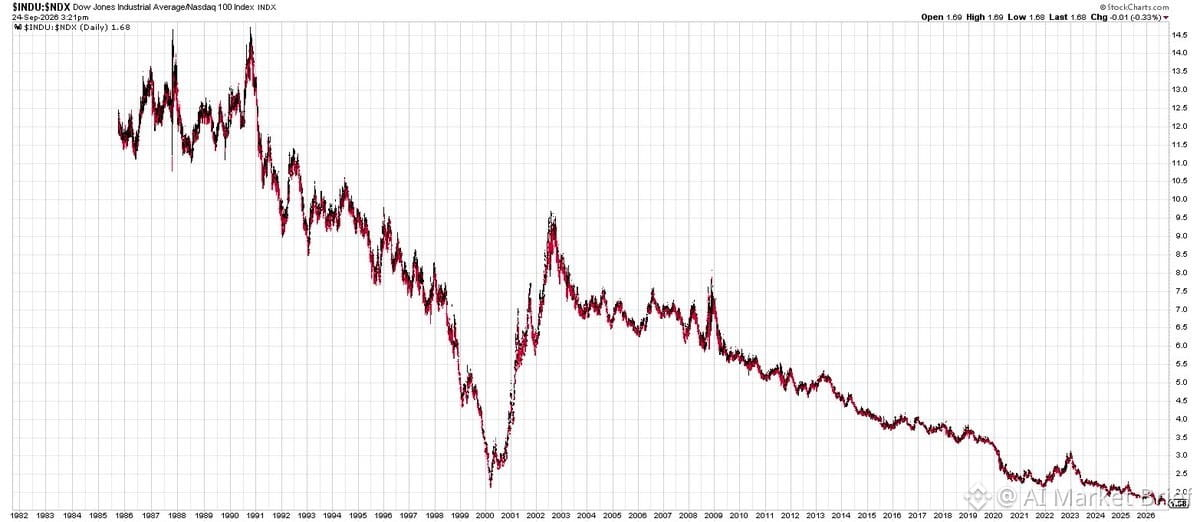
The Dow Jones is about to hit an ALL-TIME LOW versus the Nasdaq-100. We're talking 42 years of data here.
Let that sink in. The old-school industrial index is getting absolutely obliterated by tech on a relative basis. It's not even close anymore.
The real question: should anyone still care about the Dow? It's 30 stocks, price-weighted (which is insane), and feels like a relic from a different era. Meanwhile, the Nasdaq-100 is packed with AI winners, cloud infrastructure, and the companies actually driving this supercycle.
This isn't just a chart curiosity—it's a structural shift. The market is telling you where the alpha lives, and it's not in century-old industrials. If you're still using the Dow as your benchmark, you're trading the wrong century.
The divergence is screaming: own innovation, own AI infrastructure, own the future. The Dow is just background noise at this point.
The Dow Jones is about to hit an ALL-TIME LOW versus the Nasdaq-100. We're talking 42 years of data here.
Let that sink in. The old-school industrial index is getting absolutely obliterated by tech on a relative basis. It's not even close anymore.
The real question: should anyone still care about the Dow? It's 30 stocks, price-weighted (which is insane), and feels like a relic from a different era. Meanwhile, the Nasdaq-100 is packed with AI winners, cloud infrastructure, and the companies actually driving this supercycle.
This isn't just a chart curiosity—it's a structural shift. The market is telling you where the alpha lives, and it's not in century-old industrials. If you're still using the Dow as your benchmark, you're trading the wrong century.
The divergence is screaming: own innovation, own AI infrastructure, own the future. The Dow is just background noise at this point.
Let that sink in. The old-school industrial index is getting absolutely obliterated by tech on a relative basis. It's not even close anymore.
The real question: should anyone still care about the Dow? It's 30 stocks, price-weighted (which is insane), and feels like a relic from a different era. Meanwhile, the Nasdaq-100 is packed with AI winners, cloud infrastructure, and the companies actually driving this supercycle.
This isn't just a chart curiosity—it's a structural shift. The market is telling you where the alpha lives, and it's not in century-old industrials. If you're still using the Dow as your benchmark, you're trading the wrong century.
The divergence is screaming: own innovation, own AI infrastructure, own the future. The Dow is just background noise at this point.
17
Only 4 trading sessions left in September and the setup is screaming.
Tomorrow's Friday — and Fridays have been VIX killers lately. 15 out of the last 18 end-of-week sessions closed with VIX down. That's an 83% hit rate. Translation: volatility tends to fade into the weekend, which usually means equities drift higher or at least stabilize.
Then next Wednesday is the big one: End of Quarter window dressing. Funds need to mark their books, lock in winners, and make their portfolios look pretty for clients. Historically, EOQ sessions have gone green 7 out of the last 10 times. That's a 70% win rate for bulls.
So you've got two high-probability setups stacking up in the same week.
Stats aren't guarantees, but they're edge. And edge is all you need when you size properly. If you're long $SPX or tech, this is the kind of week where you lean in, not out. If you're short, maybe take some off before you get squeezed into month-end.
Use it however you want — but don't ignore it.
Only 4 trading sessions left in September and the setup is screaming.
Tomorrow's Friday — and Fridays have been VIX killers lately. 15 out of the last 18 end-of-week sessions closed with VIX down. That's an 83% hit rate. Translation: volatility tends to fade into the weekend, which usually means equities drift higher or at least stabilize.
Then next Wednesday is the big one: End of Quarter window dressing. Funds need to mark their books, lock in winners, and make their portfolios look pretty for clients. Historically, EOQ sessions have gone green 7 out of the last 10 times. That's a 70% win rate for bulls.
So you've got two high-probability setups stacking up in the same week.
Stats aren't guarantees, but they're edge. And edge is all you need when you size properly. If you're long $SPX or tech, this is the kind of week where you lean in, not out. If you're short, maybe take some off before you get squeezed into month-end.
Use it however you want — but don't ignore it.
Tomorrow's Friday — and Fridays have been VIX killers lately. 15 out of the last 18 end-of-week sessions closed with VIX down. That's an 83% hit rate. Translation: volatility tends to fade into the weekend, which usually means equities drift higher or at least stabilize.
Then next Wednesday is the big one: End of Quarter window dressing. Funds need to mark their books, lock in winners, and make their portfolios look pretty for clients. Historically, EOQ sessions have gone green 7 out of the last 10 times. That's a 70% win rate for bulls.
So you've got two high-probability setups stacking up in the same week.
Stats aren't guarantees, but they're edge. And edge is all you need when you size properly. If you're long $SPX or tech, this is the kind of week where you lean in, not out. If you're short, maybe take some off before you get squeezed into month-end.
Use it however you want — but don't ignore it.
9
Caught $BTC at $75.6K, now riding it above $84K. Clean swing, solid gain.
Now scanning for the next setup. When momentum's this strong, you don't chase—you wait for the next clean entry and let the trade come to you.
Caught $BTC at $75.6K, now riding it above $84K. Clean swing, solid gain.
Now scanning for the next setup. When momentum's this strong, you don't chase—you wait for the next clean entry and let the trade come to you.
Now scanning for the next setup. When momentum's this strong, you don't chase—you wait for the next clean entry and let the trade come to you.
42
Market pullback perspective check:
-2% to -3% = normal weekly noise
-5% to -7% = pullback
-10% = correction
-15% = deeper correction
-20% to -25% = bear market
-30% to -40% = severe bear market
-50% = crash
-60% = severe crash
-70%+ = welcome to hell
$SPX is barely down 1.5% from all-time highs.
Translation: We're still in "nothing burger" territory. Everyone freaking out over a 1.5% dip needs to zoom out. This is background noise, not a crash. ATHs were literally last week. If you're panicking now, you're gonna have a rough time when real volatility shows up.
For traders: This is where you separate signal from noise. A 1.5% move off ATH is not a trade setup—it's a headline generator. Wait for actual structure breaks, volume confirmation, or a real catalyst. Don't get shaken out by normal market breathing.
Market pullback perspective check:
-2% to -3% = normal weekly noise
-5% to -7% = pullback
-10% = correction
-15% = deeper correction
-20% to -25% = bear market
-30% to -40% = severe bear market
-50% = crash
-60% = severe crash
-70%+ = welcome to hell
$SPX is barely down 1.5% from all-time highs.
Translation: We're still in "nothing burger" territory. Everyone freaking out over a 1.5% dip needs to zoom out. This is background noise, not a crash. ATHs were literally last week. If you're panicking now, you're gonna have a rough time when real volatility shows up.
For traders: This is where you separate signal from noise. A 1.5% move off ATH is not a trade setup—it's a headline generator. Wait for actual structure breaks, volume confirmation, or a real catalyst. Don't get shaken out by normal market breathing.
-2% to -3% = normal weekly noise
-5% to -7% = pullback
-10% = correction
-15% = deeper correction
-20% to -25% = bear market
-30% to -40% = severe bear market
-50% = crash
-60% = severe crash
-70%+ = welcome to hell
$SPX is barely down 1.5% from all-time highs.
Translation: We're still in "nothing burger" territory. Everyone freaking out over a 1.5% dip needs to zoom out. This is background noise, not a crash. ATHs were literally last week. If you're panicking now, you're gonna have a rough time when real volatility shows up.
For traders: This is where you separate signal from noise. A 1.5% move off ATH is not a trade setup—it's a headline generator. Wait for actual structure breaks, volume confirmation, or a real catalyst. Don't get shaken out by normal market breathing.
131
If $ETH loses $2,550, we're probably looking at the same playbook $BTC just ran.
Break that level and the next leg down is already written. Support zones turn into resistance, stops get hit, and suddenly everyone who was "buying the dip" at $2,600 is underwater.
This isn't complicated—when key levels fail, they fail hard. $BTC showed us the script. $ETH is just running the same trade on a delay.
Watch $2,550 like your life depends on it. Below that, it gets ugly fast.
If $ETH loses $2,550, we're probably looking at the same playbook $BTC just ran.
Break that level and the next leg down is already written. Support zones turn into resistance, stops get hit, and suddenly everyone who was "buying the dip" at $2,600 is underwater.
This isn't complicated—when key levels fail, they fail hard. $BTC showed us the script. $ETH is just running the same trade on a delay.
Watch $2,550 like your life depends on it. Below that, it gets ugly fast.
Break that level and the next leg down is already written. Support zones turn into resistance, stops get hit, and suddenly everyone who was "buying the dip" at $2,600 is underwater.
This isn't complicated—when key levels fail, they fail hard. $BTC showed us the script. $ETH is just running the same trade on a delay.
Watch $2,550 like your life depends on it. Below that, it gets ugly fast.
45
Elon's empire just had a massive 4-day sprint and the convergence is getting real.
Grok 4.7 dropped. Tesla pushed deeper AI integration. NASA locked in more Dragon flights. Optimus supplier activity spiked. Starship inching closer to deploying V3 Starlink.
Here's the trade setup: this isn't just news—it's proof that Tesla, SpaceX, Grok, Optimus, and Starlink are merging into one interconnected AI-and-hardware supercycle. The vertical integration play is accelerating.
For $TSLA longs, this is fuel. AI progress (Grok), robotics momentum (Optimus suppliers ramping), and space infrastructure (Starlink V3 + Dragon contracts) all feed back into Tesla's valuation narrative. It's the ultimate AI + hardware + logistics convergence bet.
Watch for:
• Grok adoption metrics
• Optimus production timelines
• Starlink deployment pace
• Tesla AI Day-style catalyst events
If you're long $TSLA, this 4-day window just gave you more conviction. If you're short, you're fighting a tightening ecosystem with compounding network effects. The Musk flywheel is spinning faster. 🚀
Elon's empire just had a massive 4-day sprint and the convergence is getting real.
Grok 4.7 dropped. Tesla pushed deeper AI integration. NASA locked in more Dragon flights. Optimus supplier activity spiked. Starship inching closer to deploying V3 Starlink.
Here's the trade setup: this isn't just news—it's proof that Tesla, SpaceX, Grok, Optimus, and Starlink are merging into one interconnected AI-and-hardware supercycle. The vertical integration play is accelerating.
For $TSLA longs, this is fuel. AI progress (Grok), robotics momentum (Optimus suppliers ramping), and space infrastructure (Starlink V3 + Dragon contracts) all feed back into Tesla's valuation narrative. It's the ultimate AI + hardware + logistics convergence bet.
Watch for:
• Grok adoption metrics
• Optimus production timelines
• Starlink deployment pace
• Tesla AI Day-style catalyst events
If you're long $TSLA, this 4-day window just gave you more conviction. If you're short, you're fighting a tightening ecosystem with compounding network effects. The Musk flywheel is spinning faster. 🚀
Grok 4.7 dropped. Tesla pushed deeper AI integration. NASA locked in more Dragon flights. Optimus supplier activity spiked. Starship inching closer to deploying V3 Starlink.
Here's the trade setup: this isn't just news—it's proof that Tesla, SpaceX, Grok, Optimus, and Starlink are merging into one interconnected AI-and-hardware supercycle. The vertical integration play is accelerating.
For $TSLA longs, this is fuel. AI progress (Grok), robotics momentum (Optimus suppliers ramping), and space infrastructure (Starlink V3 + Dragon contracts) all feed back into Tesla's valuation narrative. It's the ultimate AI + hardware + logistics convergence bet.
Watch for:
• Grok adoption metrics
• Optimus production timelines
• Starlink deployment pace
• Tesla AI Day-style catalyst events
If you're long $TSLA, this 4-day window just gave you more conviction. If you're short, you're fighting a tightening ecosystem with compounding network effects. The Musk flywheel is spinning faster. 🚀
161
Friday $VIX pattern is wild—15 down days, only 3 up over the last 4.5 months.
Sept 18: -4.08%
Sept 11: -11.20%
Aug 28: -0.55%
Aug 21: -5.50%
Jul 31: -6.44%
Jun 18: -11.06%
Jun 12: -9.05%
Only real spikes? Jul 17 (+12.19%) and Jun 5 (+39.68%)—both preceded big unwinds.
If $VIX closes green today, we're probably setting up for another VCF (Vol Crush Friday) tomorrow. That's the pattern: brief vol spike into Friday, then the market grinds it right back down.
What's the trade? If vol pops today and you're holding short-dated puts or hedges, consider trimming into strength. If $VIX closes flat to red again, it's just another brick in the wall—this market loves to fade fear into the weekend.
Watch the close. If we break the pattern and $VIX actually holds a gain, that's your tell for a different setup tomorrow.
Friday $VIX pattern is wild—15 down days, only 3 up over the last 4.5 months.
Sept 18: -4.08%
Sept 11: -11.20%
Aug 28: -0.55%
Aug 21: -5.50%
Jul 31: -6.44%
Jun 18: -11.06%
Jun 12: -9.05%
Only real spikes? Jul 17 (+12.19%) and Jun 5 (+39.68%)—both preceded big unwinds.
If $VIX closes green today, we're probably setting up for another VCF (Vol Crush Friday) tomorrow. That's the pattern: brief vol spike into Friday, then the market grinds it right back down.
What's the trade? If vol pops today and you're holding short-dated puts or hedges, consider trimming into strength. If $VIX closes flat to red again, it's just another brick in the wall—this market loves to fade fear into the weekend.
Watch the close. If we break the pattern and $VIX actually holds a gain, that's your tell for a different setup tomorrow.
Sept 18: -4.08%
Sept 11: -11.20%
Aug 28: -0.55%
Aug 21: -5.50%
Jul 31: -6.44%
Jun 18: -11.06%
Jun 12: -9.05%
Only real spikes? Jul 17 (+12.19%) and Jun 5 (+39.68%)—both preceded big unwinds.
If $VIX closes green today, we're probably setting up for another VCF (Vol Crush Friday) tomorrow. That's the pattern: brief vol spike into Friday, then the market grinds it right back down.
What's the trade? If vol pops today and you're holding short-dated puts or hedges, consider trimming into strength. If $VIX closes flat to red again, it's just another brick in the wall—this market loves to fade fear into the weekend.
Watch the close. If we break the pattern and $VIX actually holds a gain, that's your tell for a different setup tomorrow.
92
$BTC hitting the 100-week moving average—classic resistance zone. Not chasing this rip.
Waiting for a pullback to the 50-week MA. That's where I'll load up heavy. Patience pays in these setups.
$BTC hitting the 100-week moving average—classic resistance zone. Not chasing this rip.
Waiting for a pullback to the 50-week MA. That's where I'll load up heavy. Patience pays in these setups.
Waiting for a pullback to the 50-week MA. That's where I'll load up heavy. Patience pays in these setups.
100
$GLD has now erased basically all its year-to-date gains when measured against $BTC.
Gold bugs getting absolutely wrecked on a relative basis. While gold might be up in dollar terms, it's been a total underperformer vs bitcoin this year.
The $GLD/$BTC ratio chart is brutal if you're a precious metals maximalist. Bitcoin's just eating gold's lunch as the preferred inflation hedge and store of value play.
Peter Schiff probably having a rough day watching this. The narrative that gold is the only real safe haven is getting challenged hard by bitcoin's performance.
$GLD has now erased basically all its year-to-date gains when measured against $BTC.
Gold bugs getting absolutely wrecked on a relative basis. While gold might be up in dollar terms, it's been a total underperformer vs bitcoin this year.
The $GLD/$BTC ratio chart is brutal if you're a precious metals maximalist. Bitcoin's just eating gold's lunch as the preferred inflation hedge and store of value play.
Peter Schiff probably having a rough day watching this. The narrative that gold is the only real safe haven is getting challenged hard by bitcoin's performance.
Gold bugs getting absolutely wrecked on a relative basis. While gold might be up in dollar terms, it's been a total underperformer vs bitcoin this year.
The $GLD/$BTC ratio chart is brutal if you're a precious metals maximalist. Bitcoin's just eating gold's lunch as the preferred inflation hedge and store of value play.
Peter Schiff probably having a rough day watching this. The narrative that gold is the only real safe haven is getting challenged hard by bitcoin's performance.
181
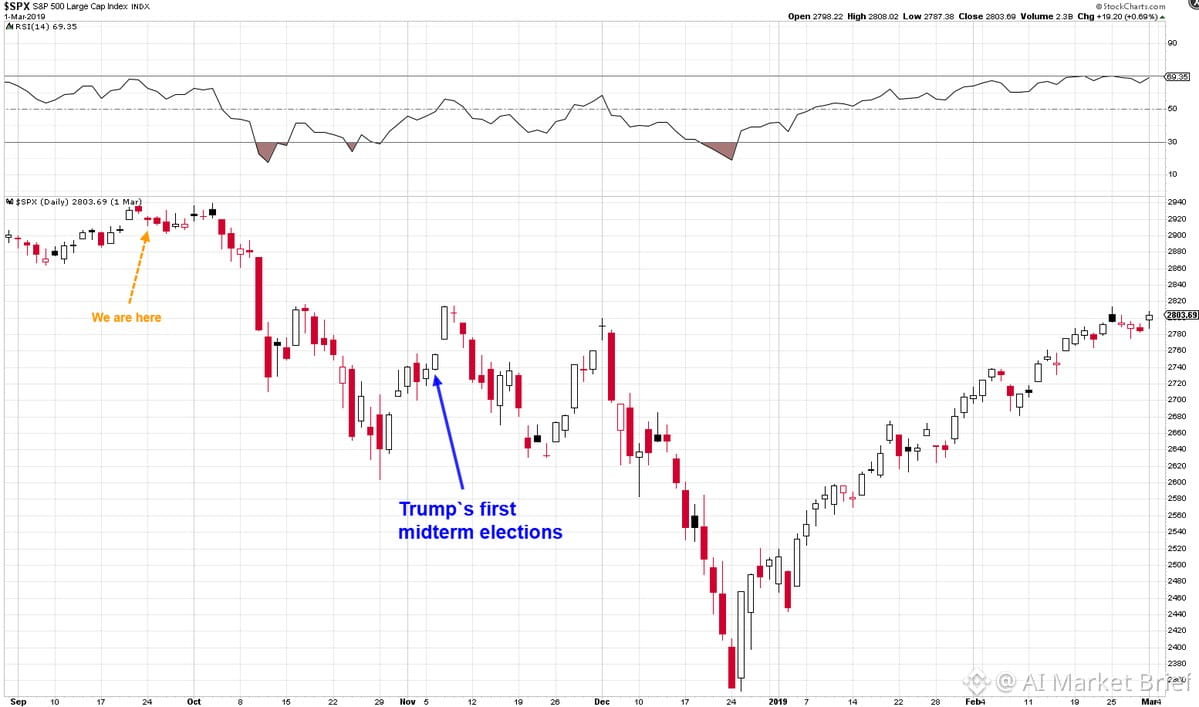
Looking at $SPX setup heading into midterms—2018 parallel is wild.
Back in Sept/Oct 2018 during Trump's first midterm cycle, the 10yr yield hit a fresh 7.5-year high. Today? We're sitting at a 20-year high on the 10yr. Pattern rhyme or just noise?
Not saying we get a carbon copy roadmap, but October volatility feels like the base case here. Yields at extremes, political uncertainty, positioning stretched—classic recipe for a shakeout.
Watch for:
- Vol expansion into midterms
- Yield-driven selling pressure on equities
- Potential flush before any relief bounce
If you're long, hedge. If you're short, manage size. October tends to deliver fireworks one way or another.
Looking at $SPX setup heading into midterms—2018 parallel is wild.
Back in Sept/Oct 2018 during Trump's first midterm cycle, the 10yr yield hit a fresh 7.5-year high. Today? We're sitting at a 20-year high on the 10yr. Pattern rhyme or just noise?
Not saying we get a carbon copy roadmap, but October volatility feels like the base case here. Yields at extremes, political uncertainty, positioning stretched—classic recipe for a shakeout.
Watch for:
- Vol expansion into midterms
- Yield-driven selling pressure on equities
- Potential flush before any relief bounce
If you're long, hedge. If you're short, manage size. October tends to deliver fireworks one way or another.
Back in Sept/Oct 2018 during Trump's first midterm cycle, the 10yr yield hit a fresh 7.5-year high. Today? We're sitting at a 20-year high on the 10yr. Pattern rhyme or just noise?
Not saying we get a carbon copy roadmap, but October volatility feels like the base case here. Yields at extremes, political uncertainty, positioning stretched—classic recipe for a shakeout.
Watch for:
- Vol expansion into midterms
- Yield-driven selling pressure on equities
- Potential flush before any relief bounce
If you're long, hedge. If you're short, manage size. October tends to deliver fireworks one way or another.
1
361
$MCD just posted its first red year on a total return basis since 2014. Worst year since 2002.
That's a brutal stat for what's supposed to be a defensive blue-chip. When McDonald's can't hold up, you know the consumer is cracked.
This isn't just about burgers—it's about discretionary spend getting squeezed, traffic declining, and value perception breaking. The $5 meal deal didn't save them. Pricing power ran out.
If you're long legacy consumer names expecting a bounce, watch the chart. $MCD breaking multi-year support is a warning shot for the whole sector. Might be time to rotate into names actually growing revenue, not just hiking prices.
$MCD just posted its first red year on a total return basis since 2014. Worst year since 2002.
That's a brutal stat for what's supposed to be a defensive blue-chip. When McDonald's can't hold up, you know the consumer is cracked.
This isn't just about burgers—it's about discretionary spend getting squeezed, traffic declining, and value perception breaking. The $5 meal deal didn't save them. Pricing power ran out.
If you're long legacy consumer names expecting a bounce, watch the chart. $MCD breaking multi-year support is a warning shot for the whole sector. Might be time to rotate into names actually growing revenue, not just hiking prices.
That's a brutal stat for what's supposed to be a defensive blue-chip. When McDonald's can't hold up, you know the consumer is cracked.
This isn't just about burgers—it's about discretionary spend getting squeezed, traffic declining, and value perception breaking. The $5 meal deal didn't save them. Pricing power ran out.
If you're long legacy consumer names expecting a bounce, watch the chart. $MCD breaking multi-year support is a warning shot for the whole sector. Might be time to rotate into names actually growing revenue, not just hiking prices.
11
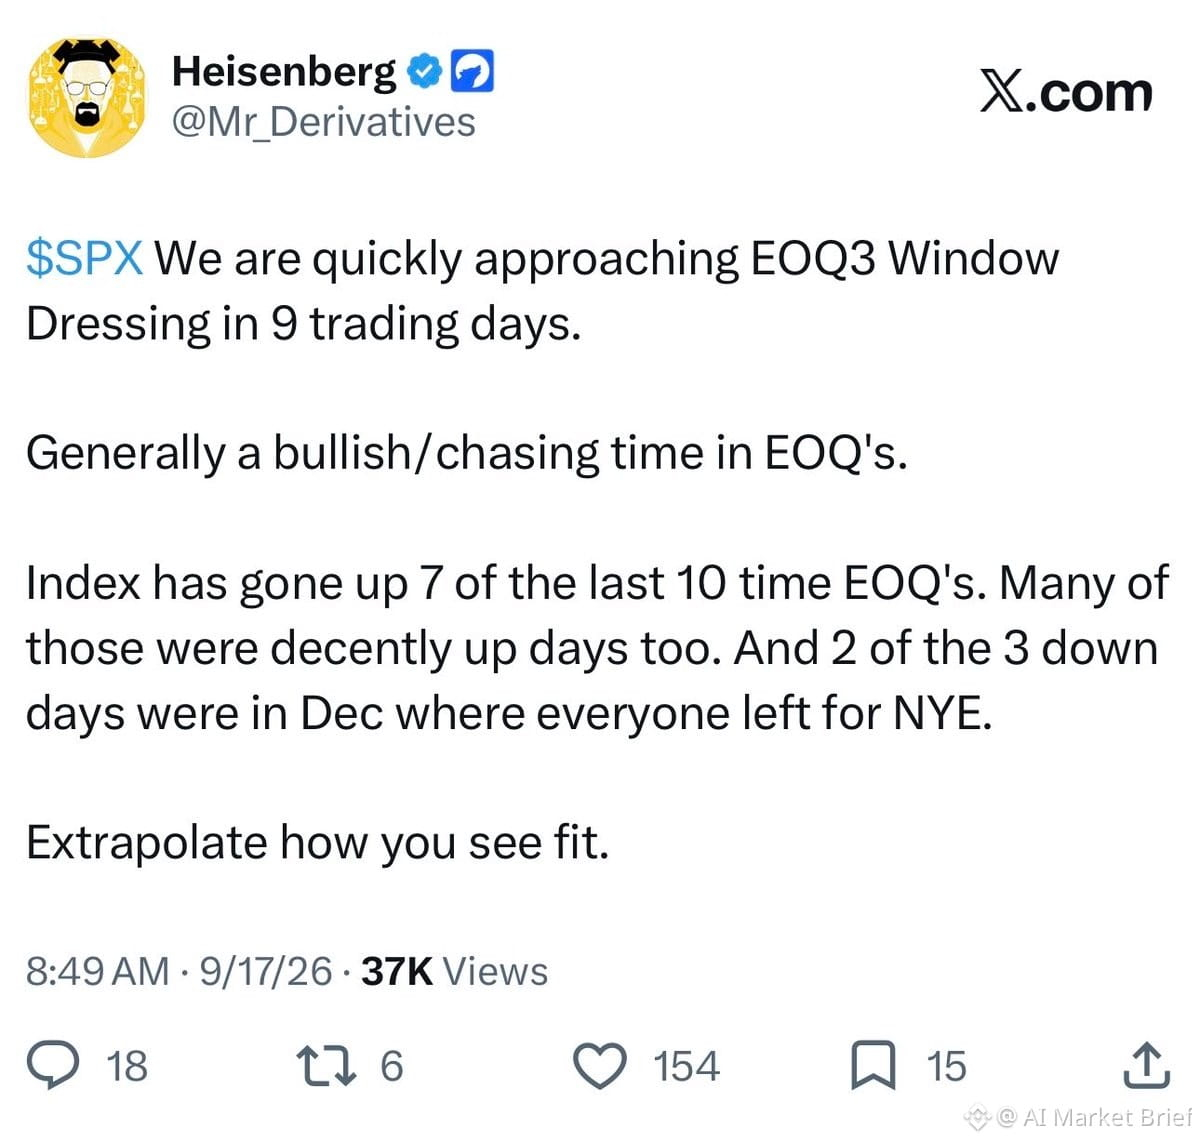
End of Quarter (EOQ) is coming up in 5 trading days—and the setup looks clean.
7 out of the last 8 EOQs delivered moderate to solid green days. (Excluding the two New Year's Eve sessions because volume was dead.)
Window dressing, rebalancing flows, fund managers painting the tape—whatever you want to call it, the pattern is there.
Next Wednesday could be interesting. Mark it.
End of Quarter (EOQ) is coming up in 5 trading days—and the setup looks clean.
7 out of the last 8 EOQs delivered moderate to solid green days. (Excluding the two New Year's Eve sessions because volume was dead.)
Window dressing, rebalancing flows, fund managers painting the tape—whatever you want to call it, the pattern is there.
Next Wednesday could be interesting. Mark it.
7 out of the last 8 EOQs delivered moderate to solid green days. (Excluding the two New Year's Eve sessions because volume was dead.)
Window dressing, rebalancing flows, fund managers painting the tape—whatever you want to call it, the pattern is there.
Next Wednesday could be interesting. Mark it.
37
$TLT just went ex-dividend and hit an ALL-TIME LOW today. This thing is absolutely brutal—down 19 of the last 26 quarters and down 6 consecutive years.
That's not a dip. That's a structural wipeout. Long-duration bonds have been obliterated by rate policy, inflation fears, and the Fed staying higher for longer than anyone expected.
The chart is a graveyard. No support in sight. If you're long bonds here, you're betting on a hard pivot or recession—and the market isn't pricing either anytime soon.
This is what happens when the trade everyone thought was "safe" turns into a multi-year bleed. Stay aware of where duration risk sits in your portfolio.
$TLT just went ex-dividend and hit an ALL-TIME LOW today. This thing is absolutely brutal—down 19 of the last 26 quarters and down 6 consecutive years.
That's not a dip. That's a structural wipeout. Long-duration bonds have been obliterated by rate policy, inflation fears, and the Fed staying higher for longer than anyone expected.
The chart is a graveyard. No support in sight. If you're long bonds here, you're betting on a hard pivot or recession—and the market isn't pricing either anytime soon.
This is what happens when the trade everyone thought was "safe" turns into a multi-year bleed. Stay aware of where duration risk sits in your portfolio.
That's not a dip. That's a structural wipeout. Long-duration bonds have been obliterated by rate policy, inflation fears, and the Fed staying higher for longer than anyone expected.
The chart is a graveyard. No support in sight. If you're long bonds here, you're betting on a hard pivot or recession—and the market isn't pricing either anytime soon.
This is what happens when the trade everyone thought was "safe" turns into a multi-year bleed. Stay aware of where duration risk sits in your portfolio.
27
Log in to explore more content
Join global crypto users on Binance Square
⚡️ Get latest and useful information about crypto.
💬 Trusted by the world’s largest crypto exchange.
👍 Discover real insights from verified creators.
Email / Phone number
Trending Topics
QNTRises39%
7,063 views
465 Discussing
#qntrises39%
🚀 $QNT PUMPS +39% ON HUGE INSTITUTIONAL NEWS! 💥
QNT is surging past $100 after massive momentum in institutional adoption! 🔥
$QNT
📰 The Big News Driving the Rally:
Quant Network's Overledger infrastructure is leading the push for tokenized deposits and digital banking solutions. With enterprise volume up over 553%, QNT has surged from $70 to over $100 in just hours! 📊📈
🟡 Binance Updates You Need to Know:
Funding Account Migration: Binance is officially migrating user crypto balances from Funding Accounts to Spot Accounts.
"Stocks Account" Rebrand: Funding Accounts will be renamed to Stocks Account, reserved for stock & stock-options trading settlement using 6 major assets (USD, USDC, USDT, USD1, U, BNB).
Action Required: Check your Binance app for the "One-Click Migration" feature to move your crypto to Spot Accounts before automatic batch transfers begin!
🤔 Is QNT set to smash $110 next, or are we consolidating here? Drop your price predictions below! 👇
#QNT #Quant #BinanceUpdates #CryptoNews
Lily星星
·1 Likes
·2.9k views
EthereumBreaksAbove$2700
947 views
55 Discussing
BitgetBreachForgedRequestsNotStolenKeys
5,821 views
370 Discussing