陈大炮_

Square Verified+
Top 30D Traders by Volume
62 Following
35.2K+ Followers
18.2K+ Liked
1 Badges
Posts
PINNED
·
--
You are invited to join my group Dapao’s chat room: https://app.binance.com/uni-qr/LKa1ZyCK
You are invited to join my group
Dapao’s chat room: https://app.binance.com/uni-qr/LKa1ZyCK
🎙️ Bitcoin Ethereum
avatar
End
02 h 28 m 06 s
245
0
0
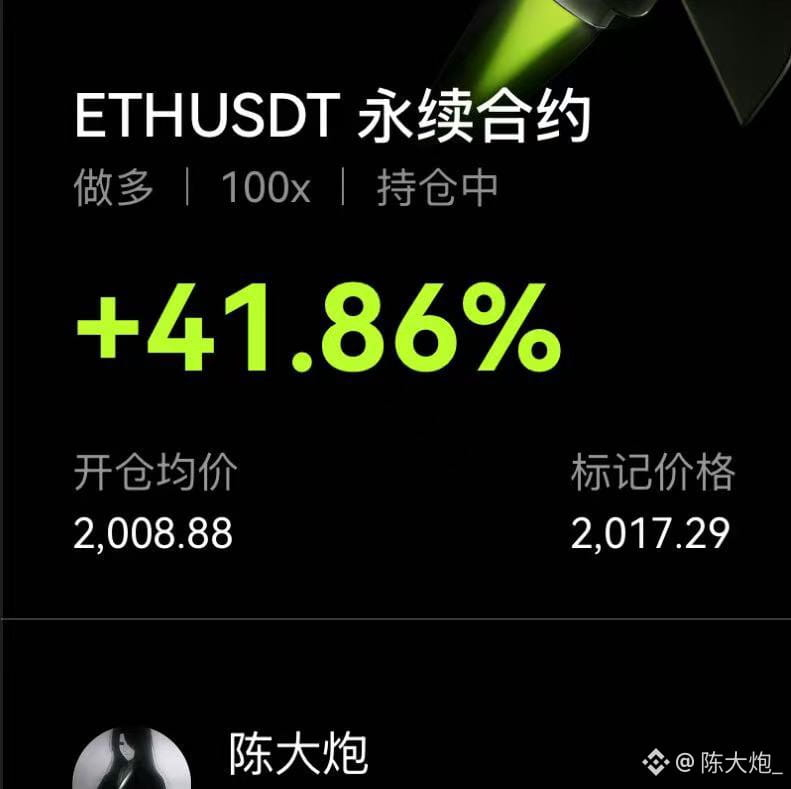
I just love catching needle tips.
陈大炮_
·
--
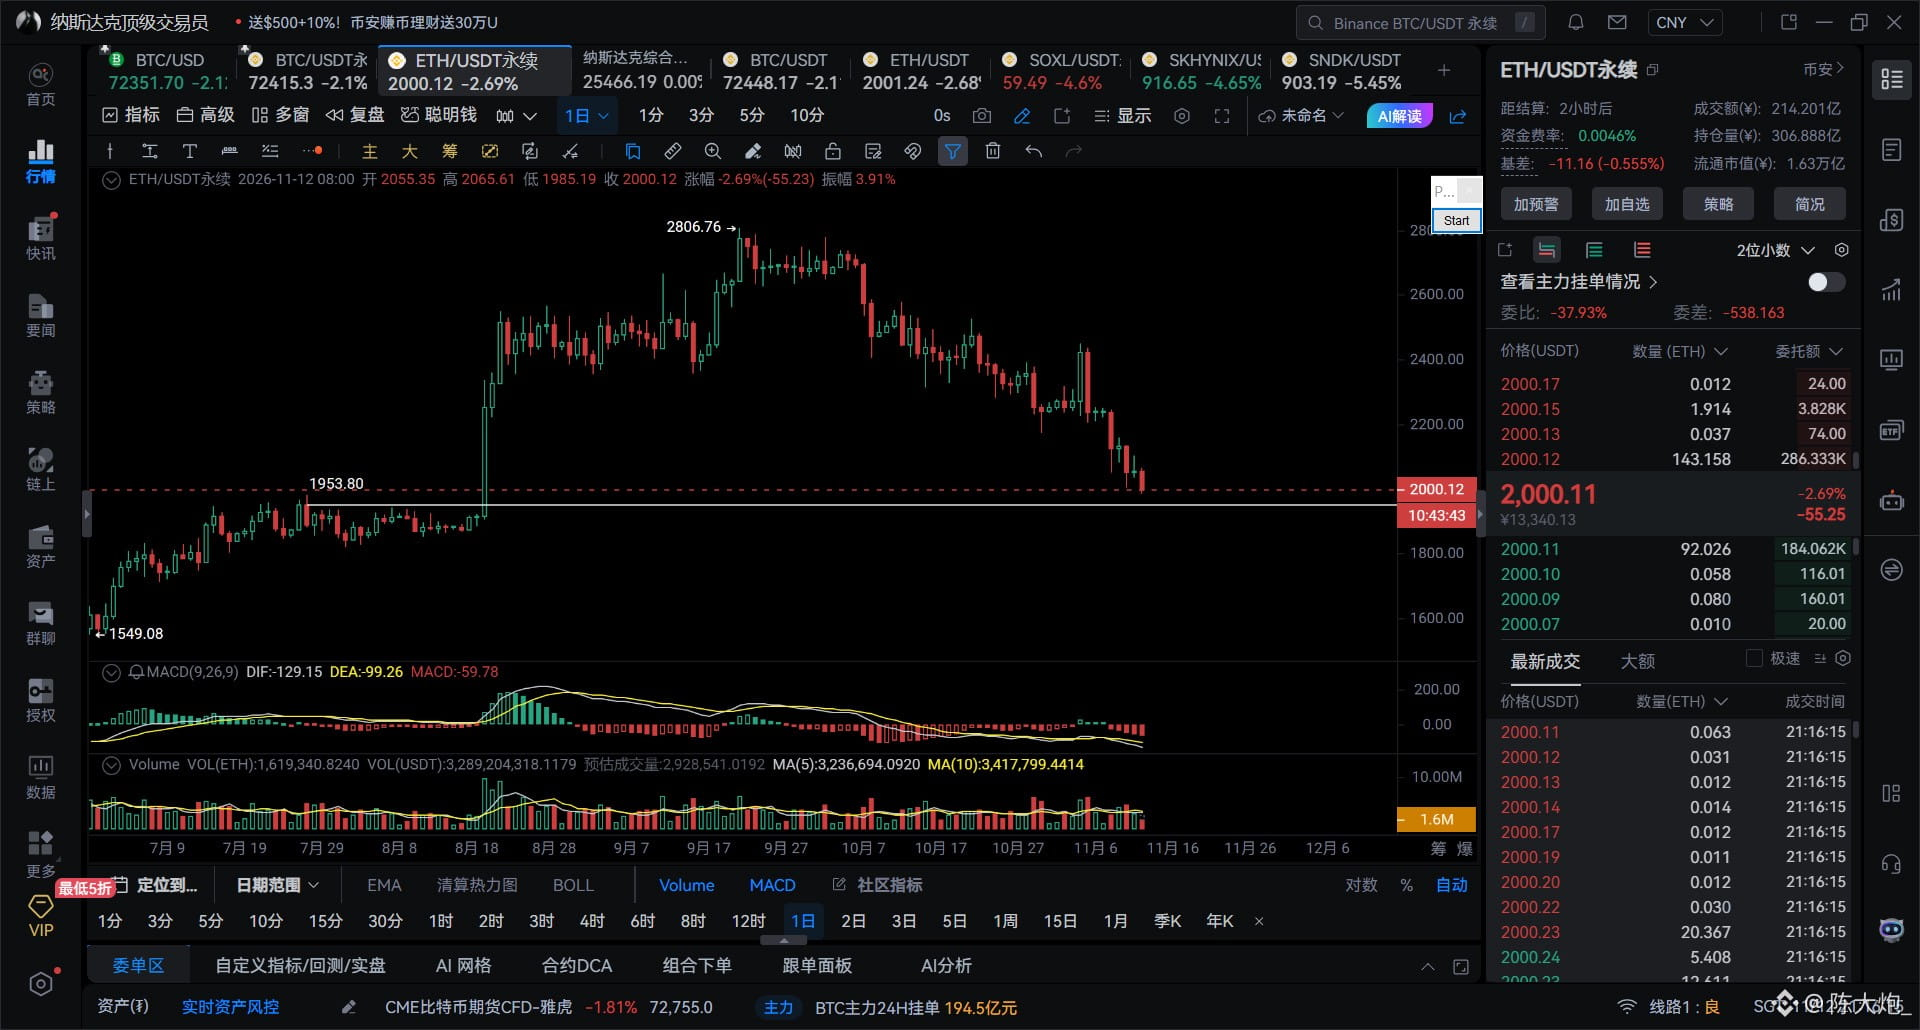
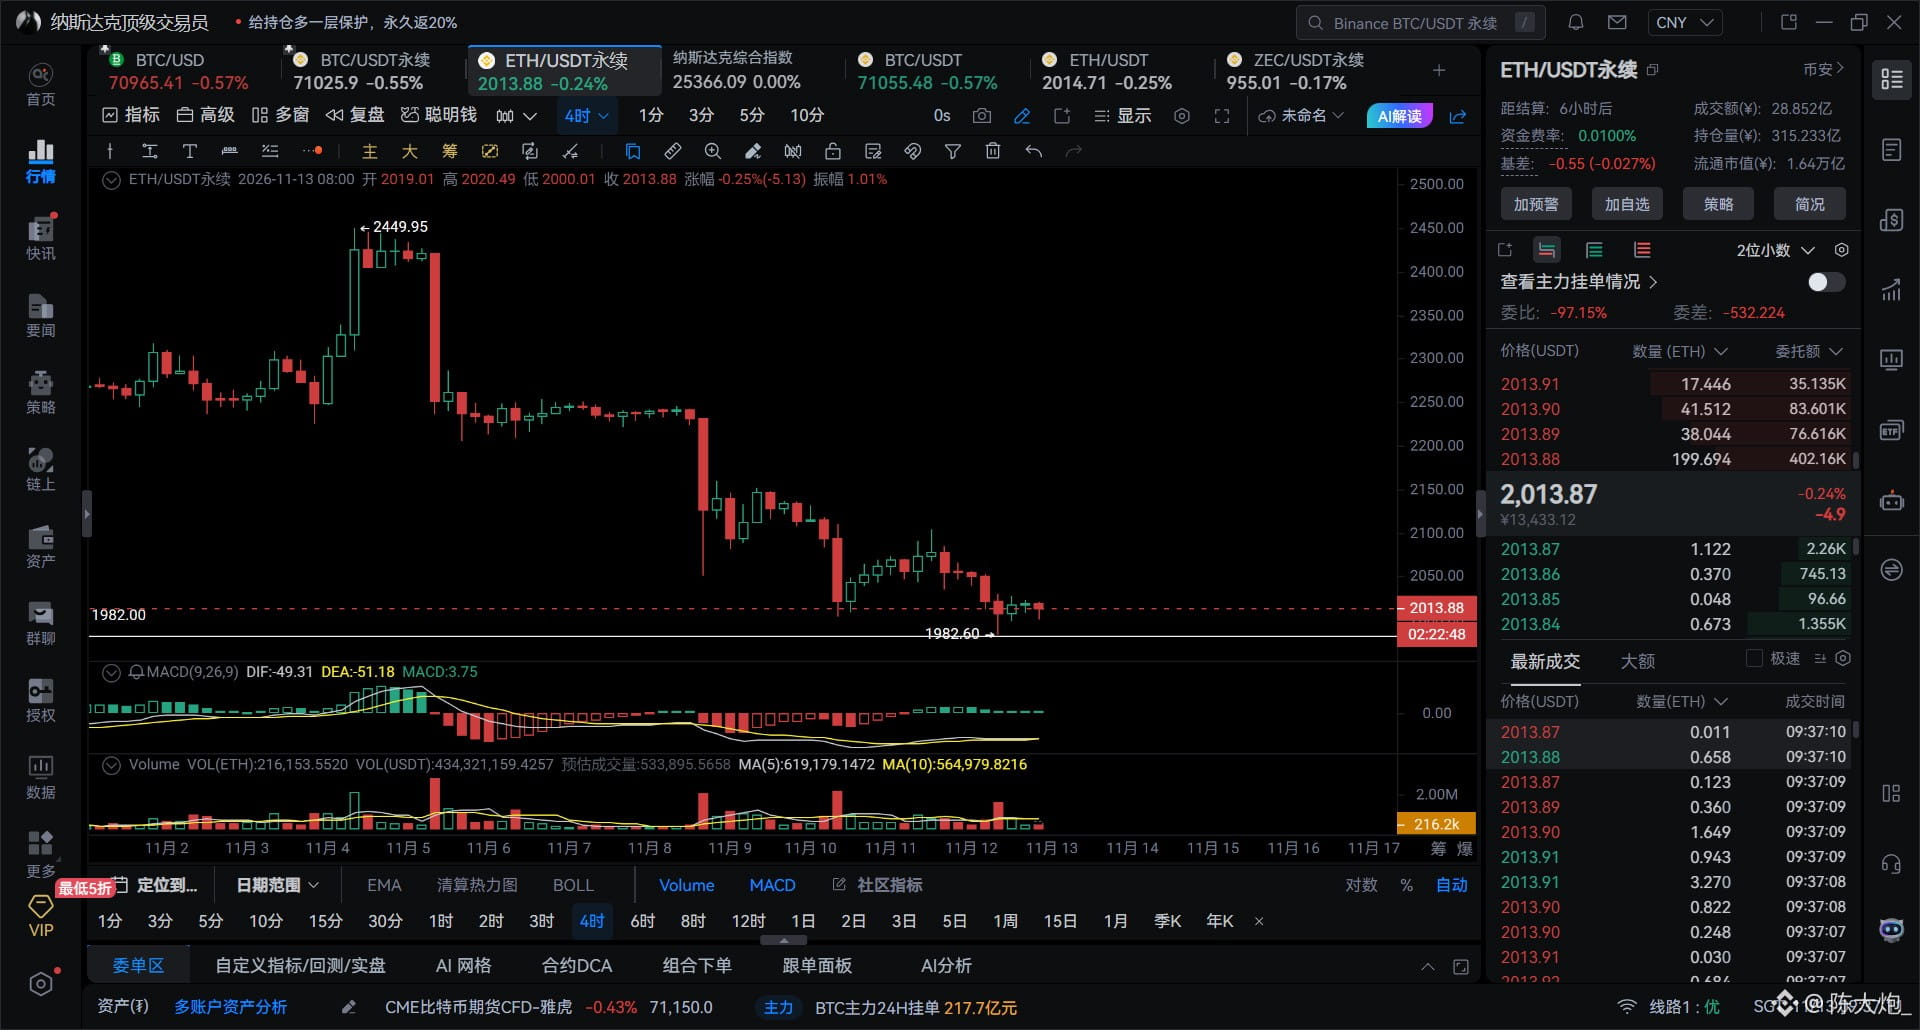
Ethereum is holding the $2,000 level much better than Bitcoin, so you can prioritize buying ETH on dips.
The 3- and 4-hour charts are bottoming out below the zero line. The only drawback is that Bitcoin is holding it back, preventing volume from picking up.
Intraday, watch for underwater rebounds on the 30- and 45-minute charts.
Intraday resistance: 2025 2050 2085 2106
Intraday support: 1982 1955 1936 1875
Ethereum is holding the $2,000 level much better than Bitcoin, so you can prioritize buying ETH on dips. The 3- and 4-hour charts are bottoming out below the zero line. The only drawback is that Bitcoin is holding it back, preventing volume from picking up. Intraday, watch for underwater rebounds on the 30- and 45-minute charts. Intraday resistance: 2025 2050 2085 2106 Intraday support: 1982 1955 1936 1875
Ethereum is holding the $2,000 level much better than Bitcoin, so you can prioritize buying ETH on dips.
The 3- and 4-hour charts are bottoming out below the zero line. The only drawback is that Bitcoin is holding it back, preventing volume from picking up.
Intraday, watch for underwater rebounds on the 30- and 45-minute charts.
Intraday resistance: 2025 2050 2085 2106
Intraday support: 1982 1955 1936 1875
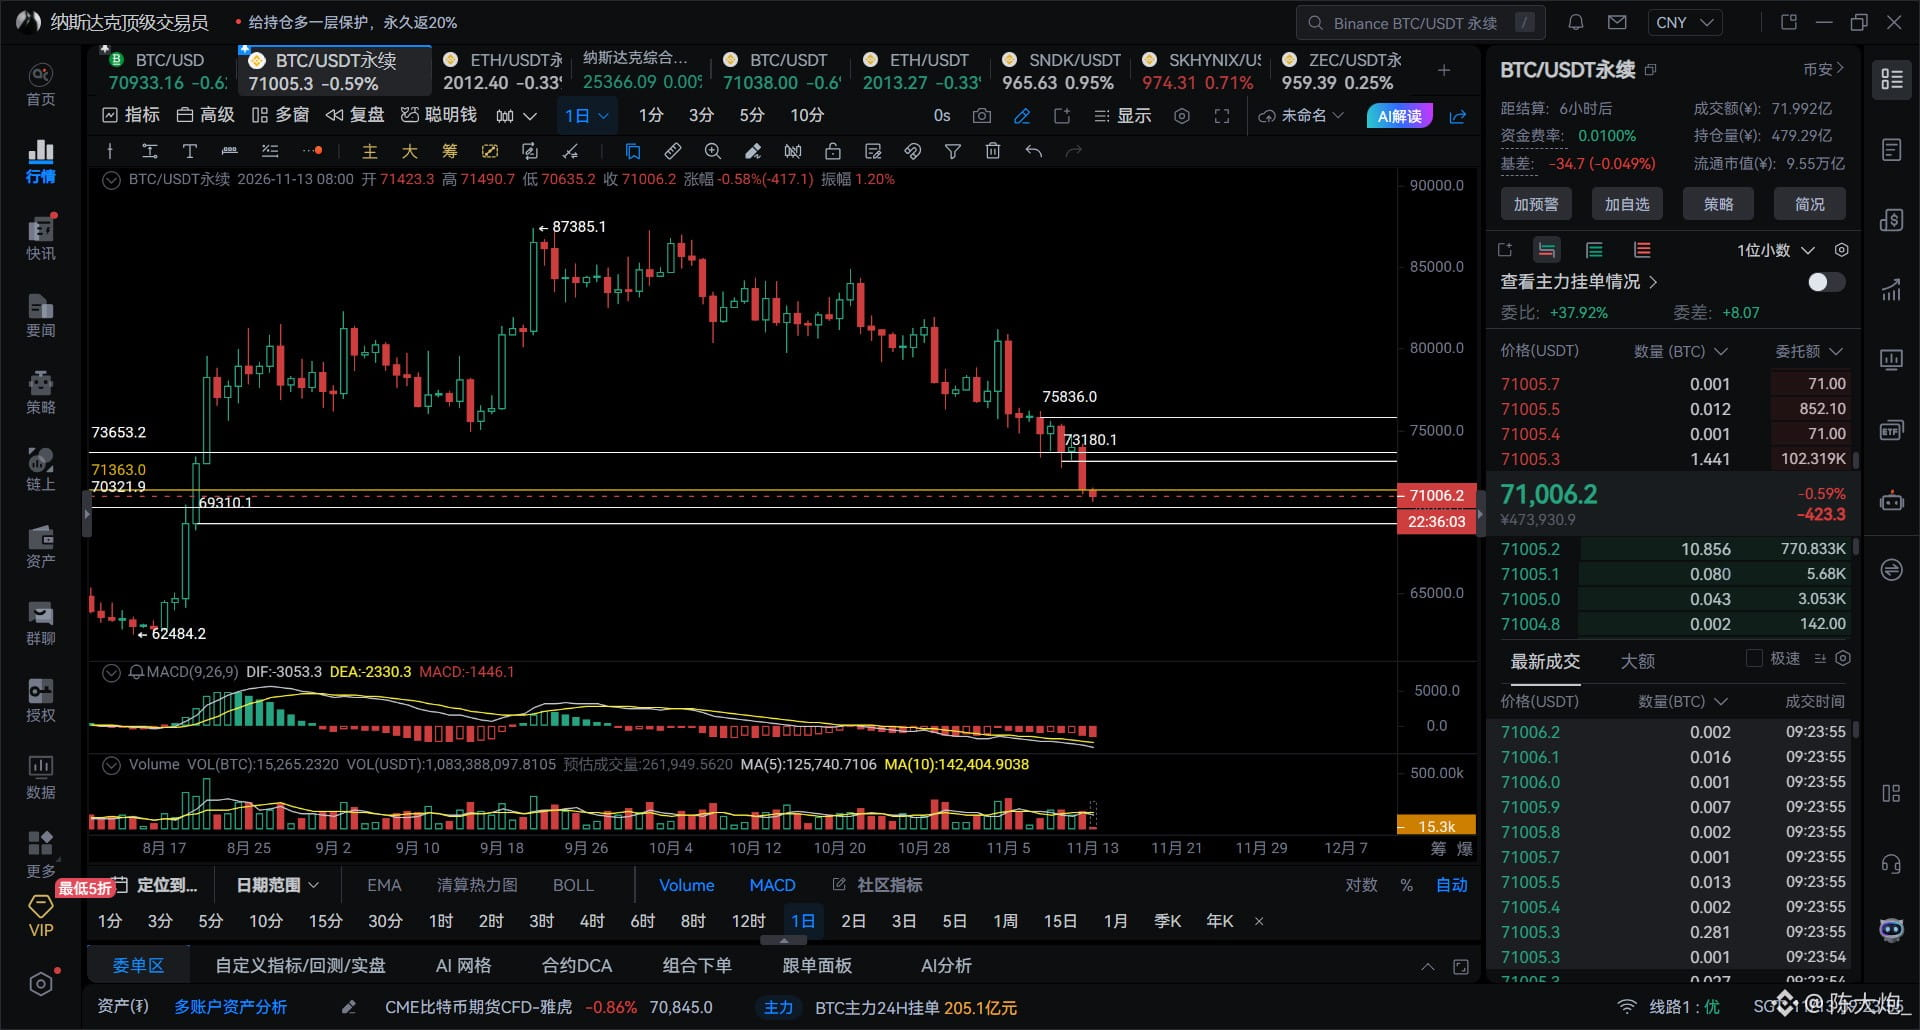
11.13 BTC Market Analysis Bitcoin is very weak. The 10-day chart has closed with a death cross. On the weekly chart, the 5-day/3-day death cross above the zero line favors shorting at higher levels. The daily chart is trending one-way below the zero line. There may still be an intraday pullback. The 70,300–70,500 area below is the last key support around 70,000. If 69,300 breaks, the next level is 68,500. The 15/30-minute charts are currently trying to form a bottom, but volume isn't picking up. Resistance above: 71,363 71,800 72,200 72,700
11.13 BTC Market Analysis
Bitcoin is very weak. The 10-day chart has closed with a death cross.
On the weekly chart, the 5-day/3-day death cross above the zero line favors shorting at higher levels. The daily chart is trending one-way below the zero line.
There may still be an intraday pullback. The 70,300–70,500 area below is the last key support around 70,000.
If 69,300 breaks, the next level is 68,500.
The 15/30-minute charts are currently trying to form a bottom, but volume isn't picking up.
Resistance above: 71,363 71,800 72,200 72,700
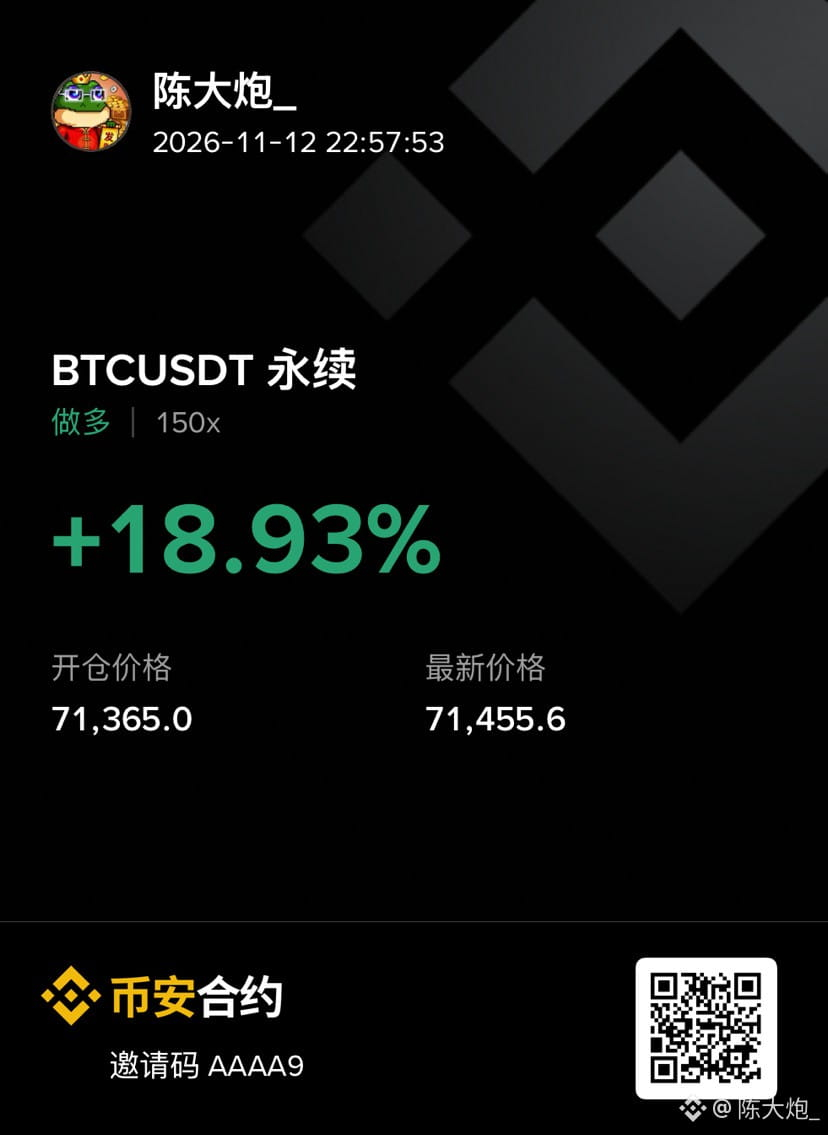
Bitcoin has entered a starter position to test the waters.
陈大炮_
·
--
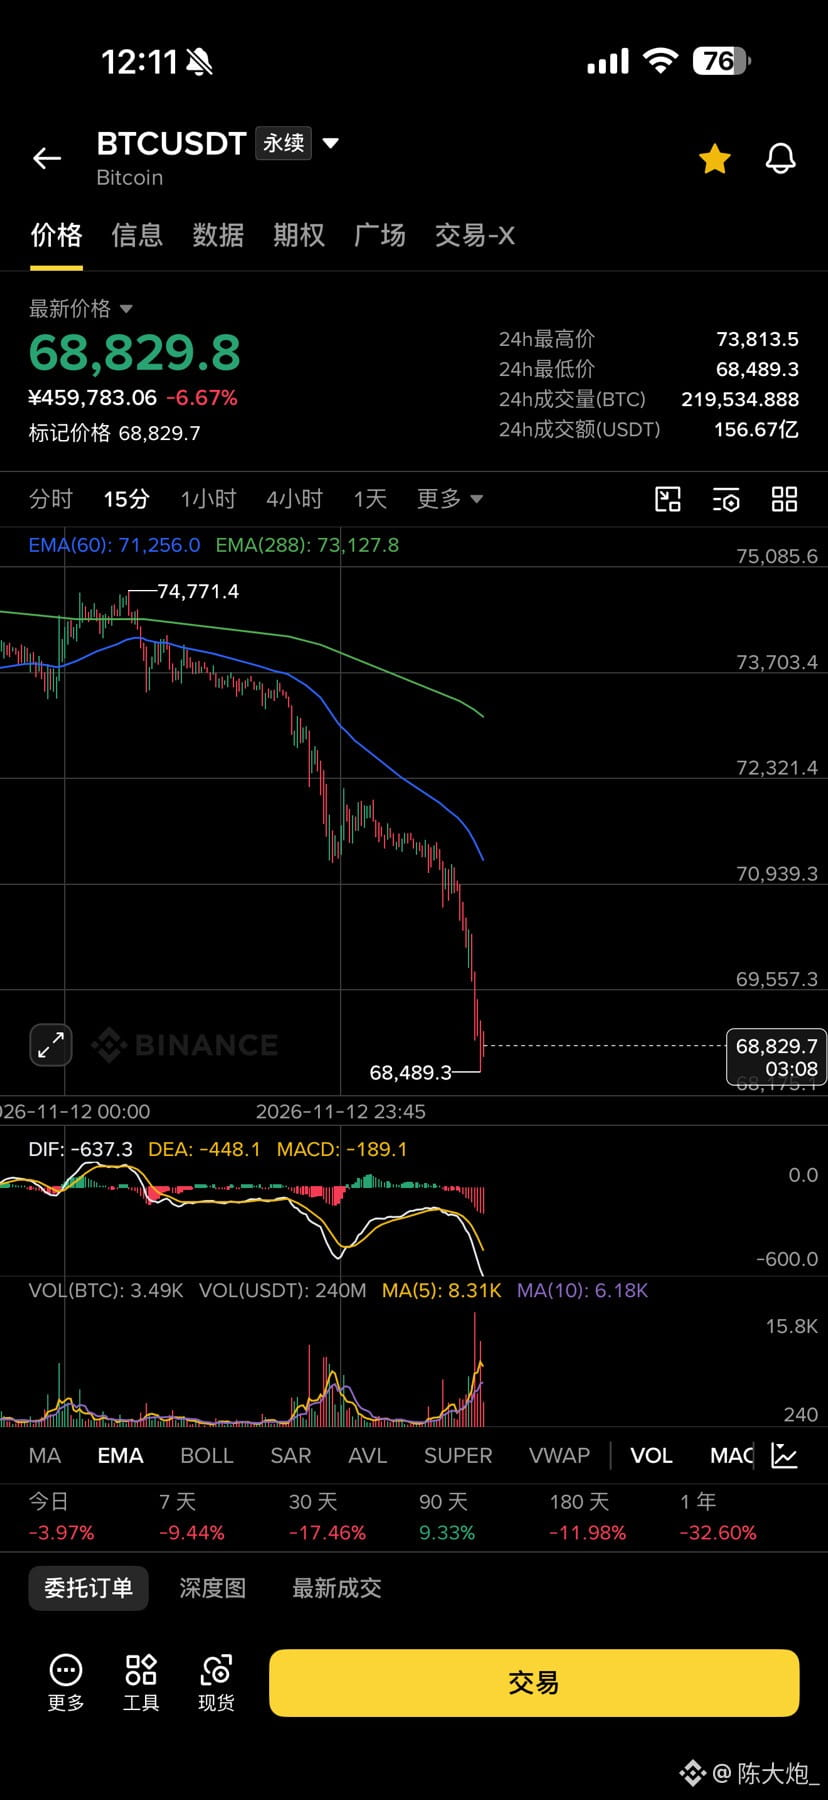
Bitcoin: 71363
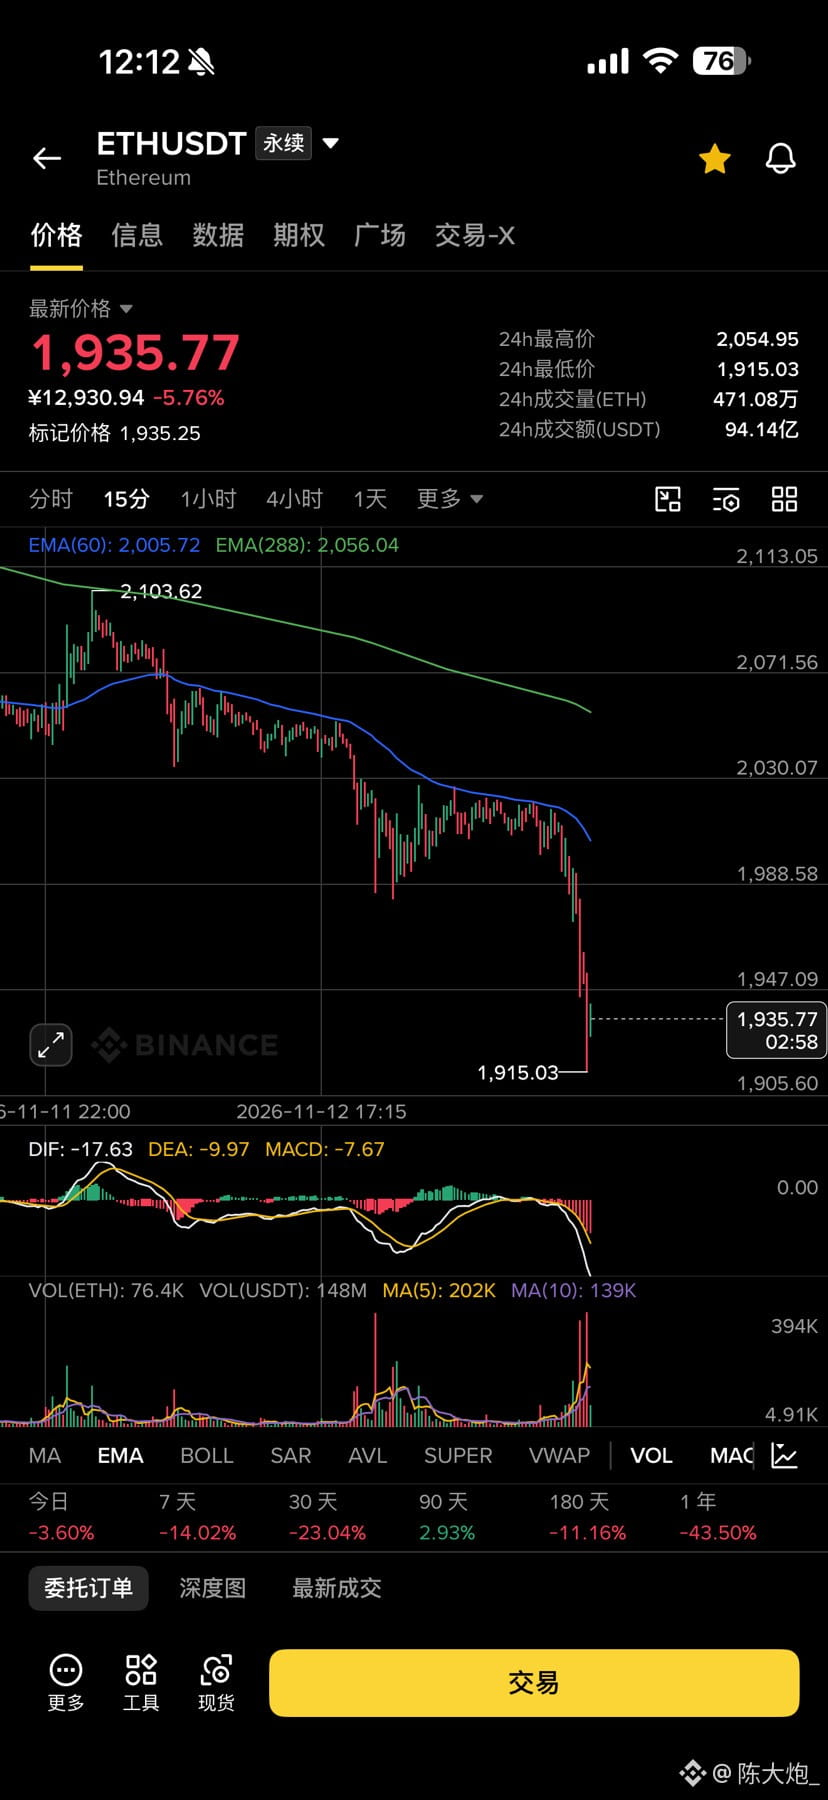
Ethereum: 1954
After three months, Ethereum falls below 2,000 again
🎙️ Bitcoin Ethereum
avatar
End
03 h 09 m 25 s
308
0
0
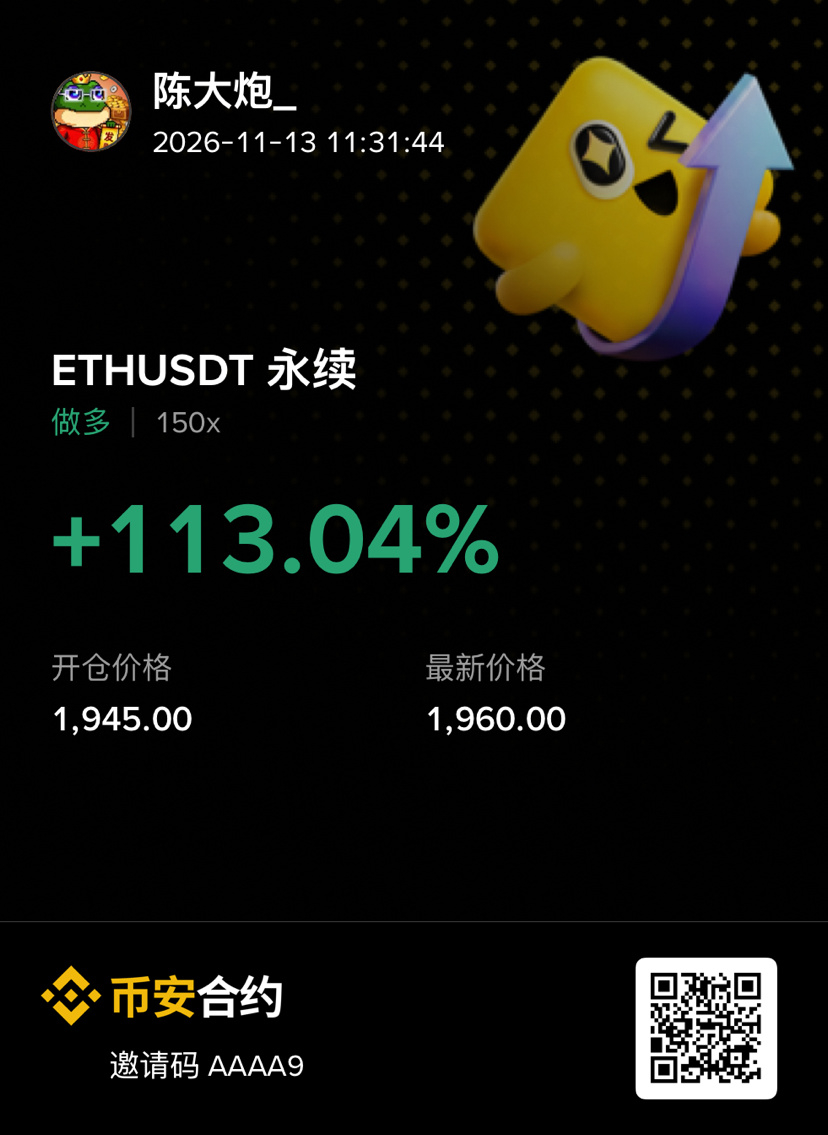
You can take profits and lock them in.
陈大炮_
·
--
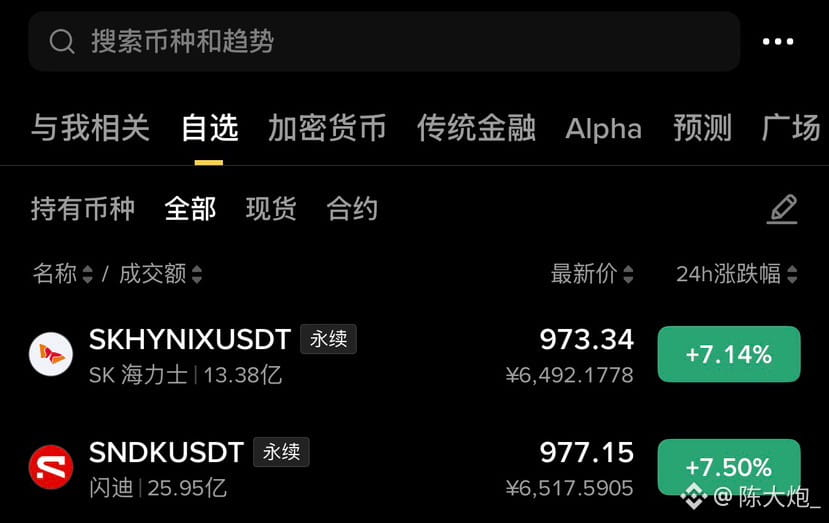
Evening market strategy
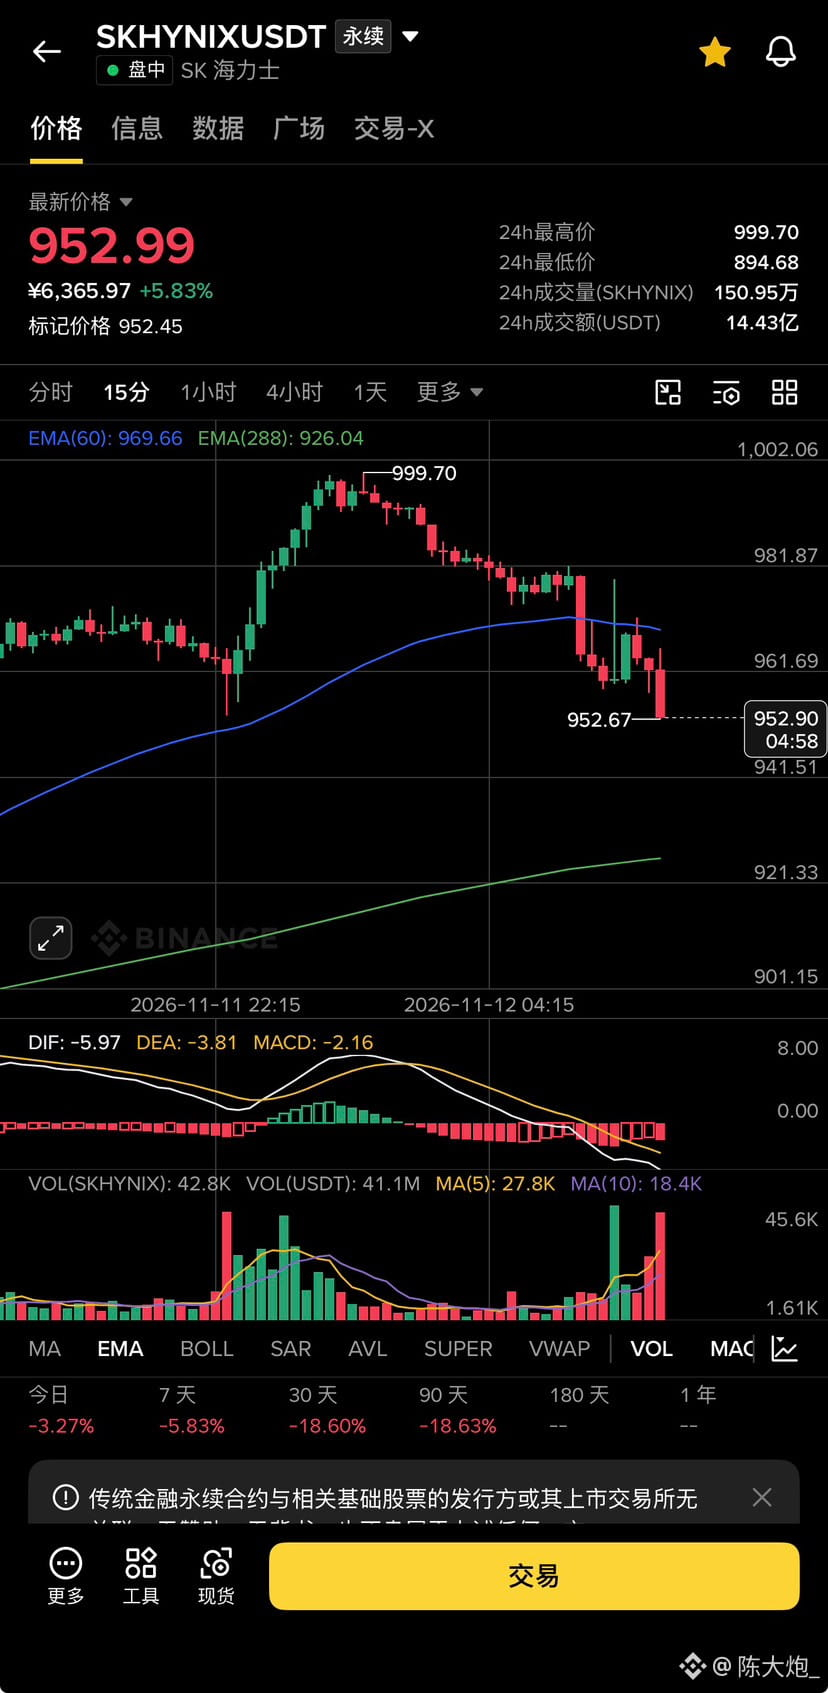
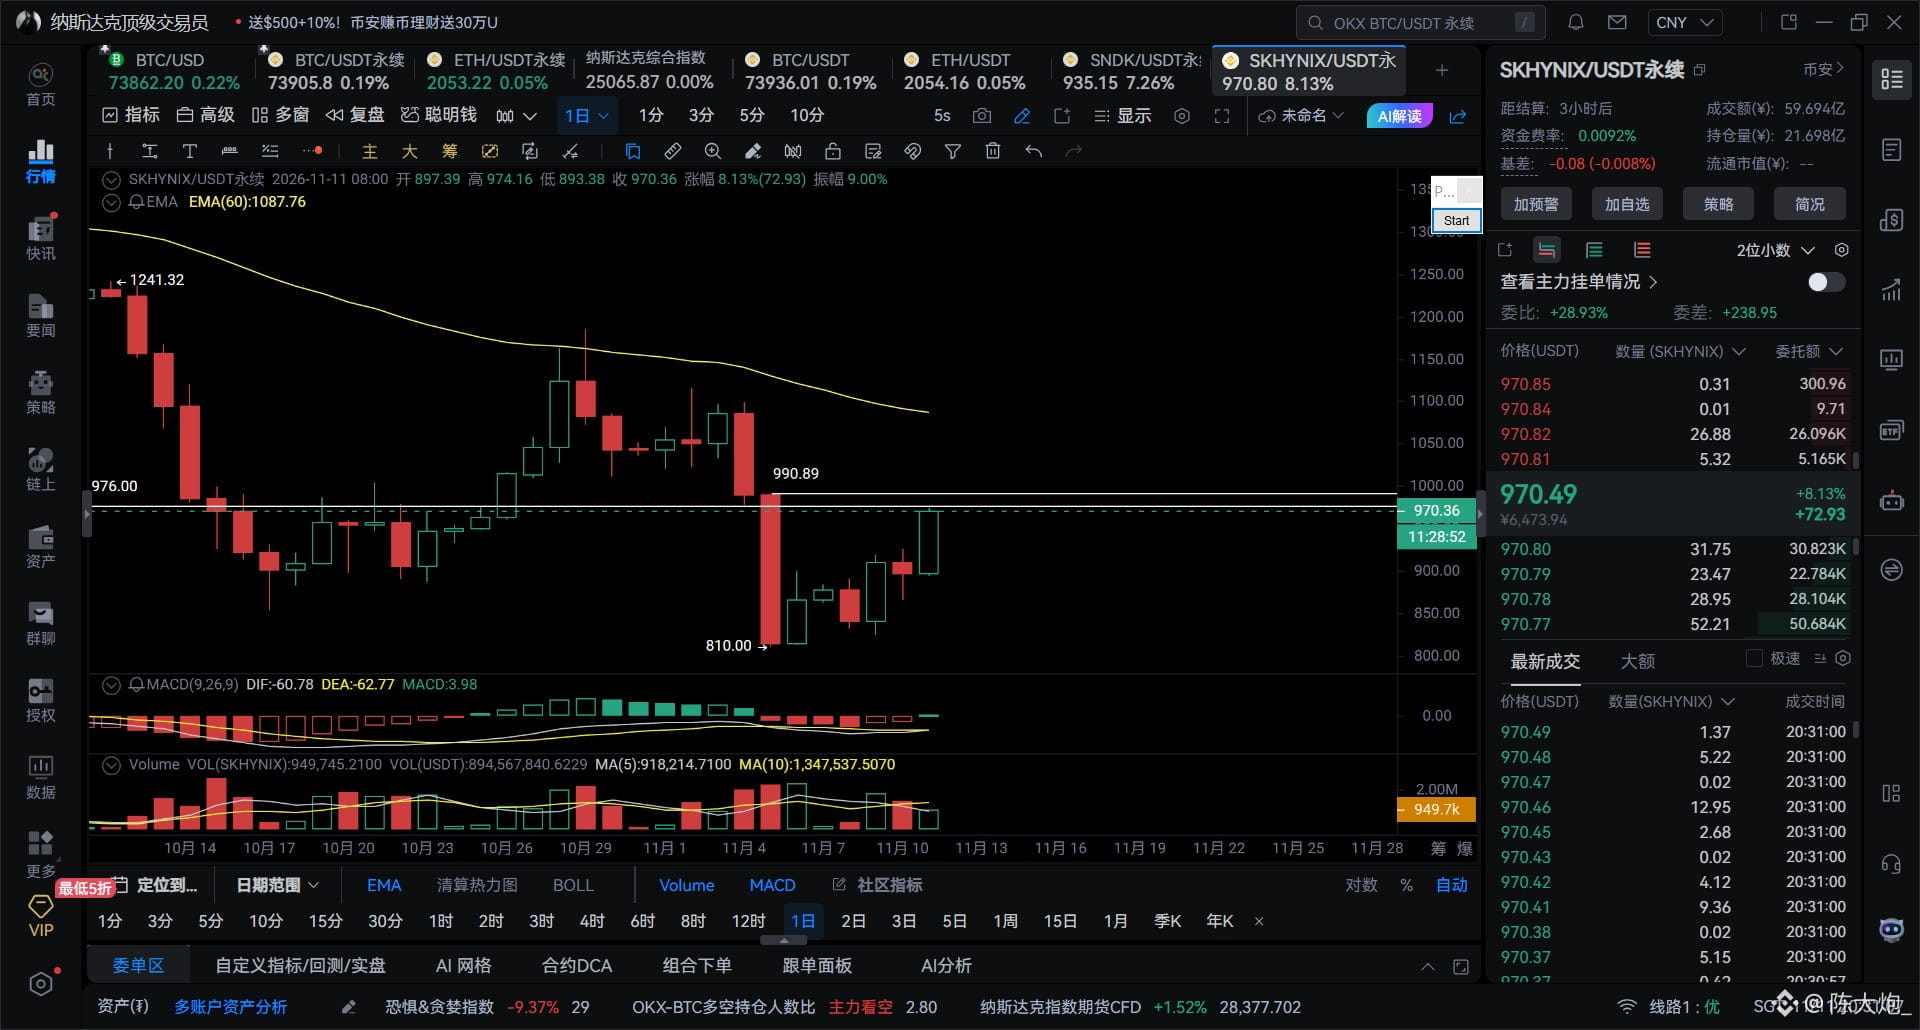
Short Hynix at 990; take profit at 948
Reason for short: Price is at the body of a daily bearish candle, where it is likely to encounter resistance and pull back.
On the chart, the 15/30-minute MACD suggests a short at a high, with a pullback to the zero line.
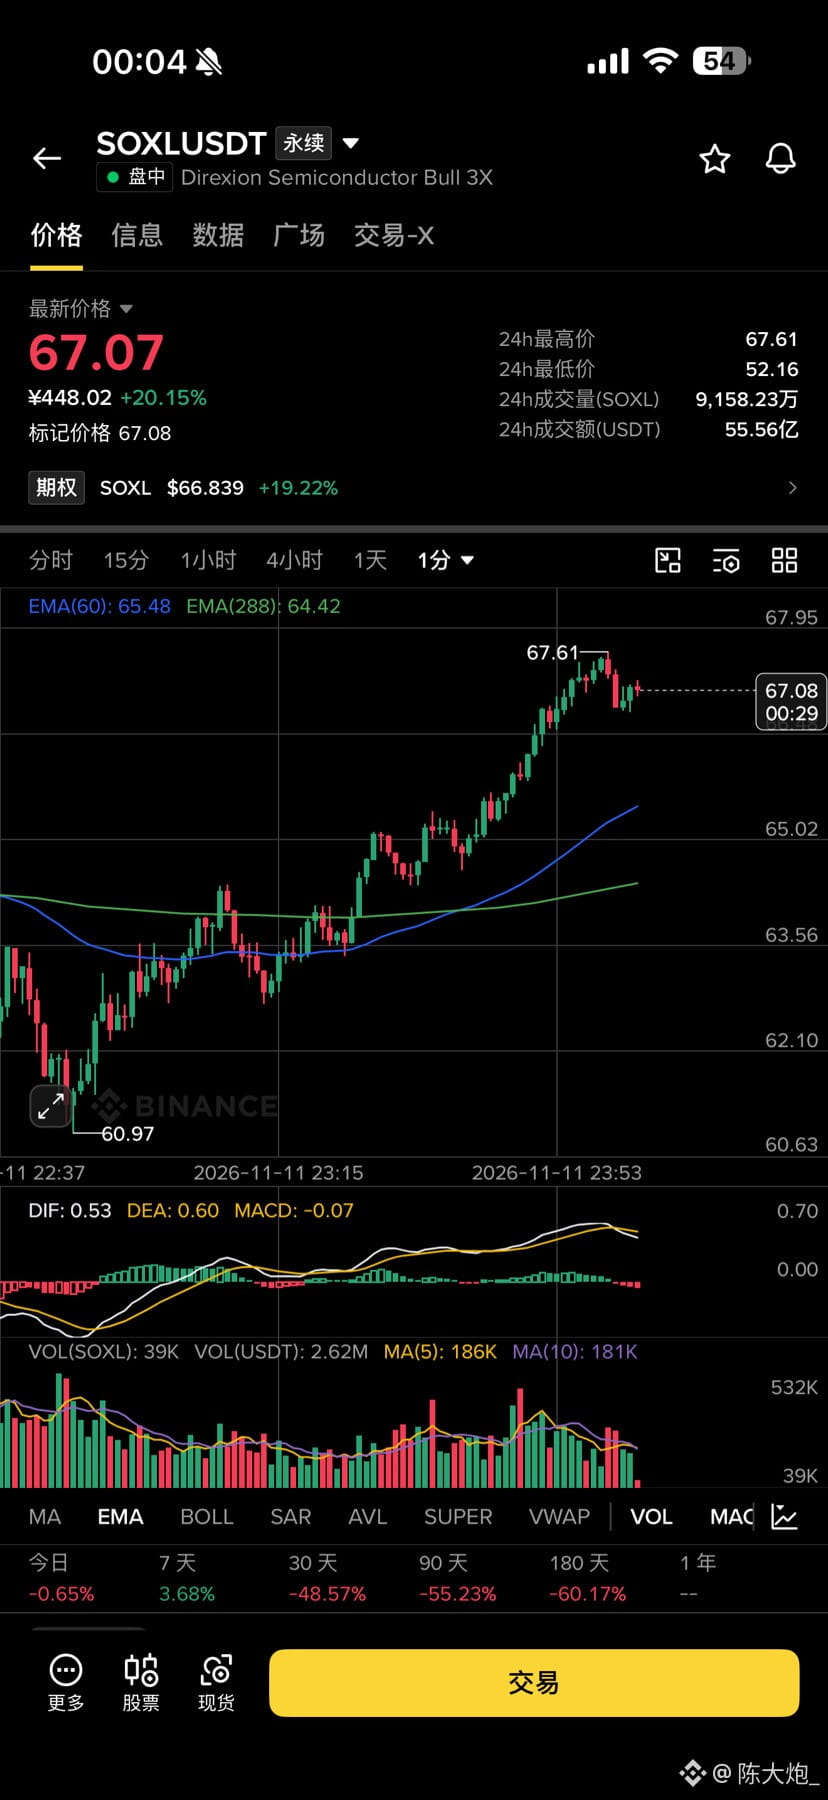
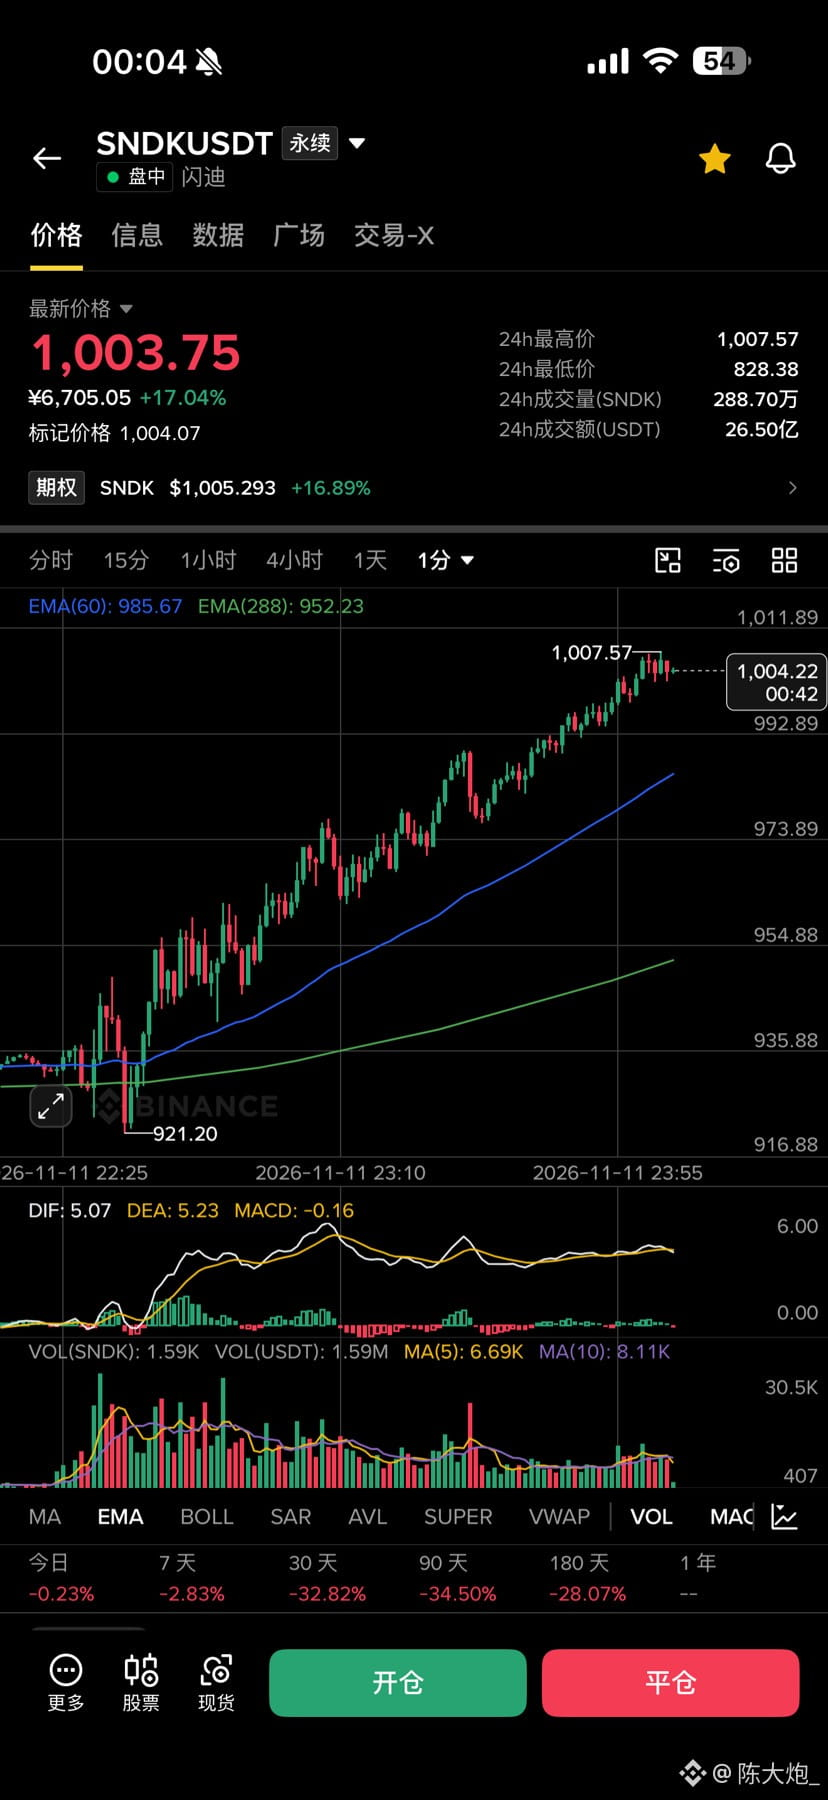
$SNDK It's been a long time since these two guys' prices moved in sync.
Evening market strategy Short Hynix at 990; take profit at 948 Reason for short: Price is at the body of a daily bearish candle, where it is likely to encounter resistance and pull back. On the chart, the 15/30-minute MACD suggests a short at a high, with a pullback to the zero line.
Evening market strategy
Short Hynix at 990; take profit at 948
Reason for short: Price is at the body of a daily bearish candle, where it is likely to encounter resistance and pull back.
On the chart, the 15/30-minute MACD suggests a short at a high, with a pullback to the zero line.
🎙️ Don't Rush to Buy the Dip on Long Positions
avatar
End
03 h 08 m 05 s
343
1
0
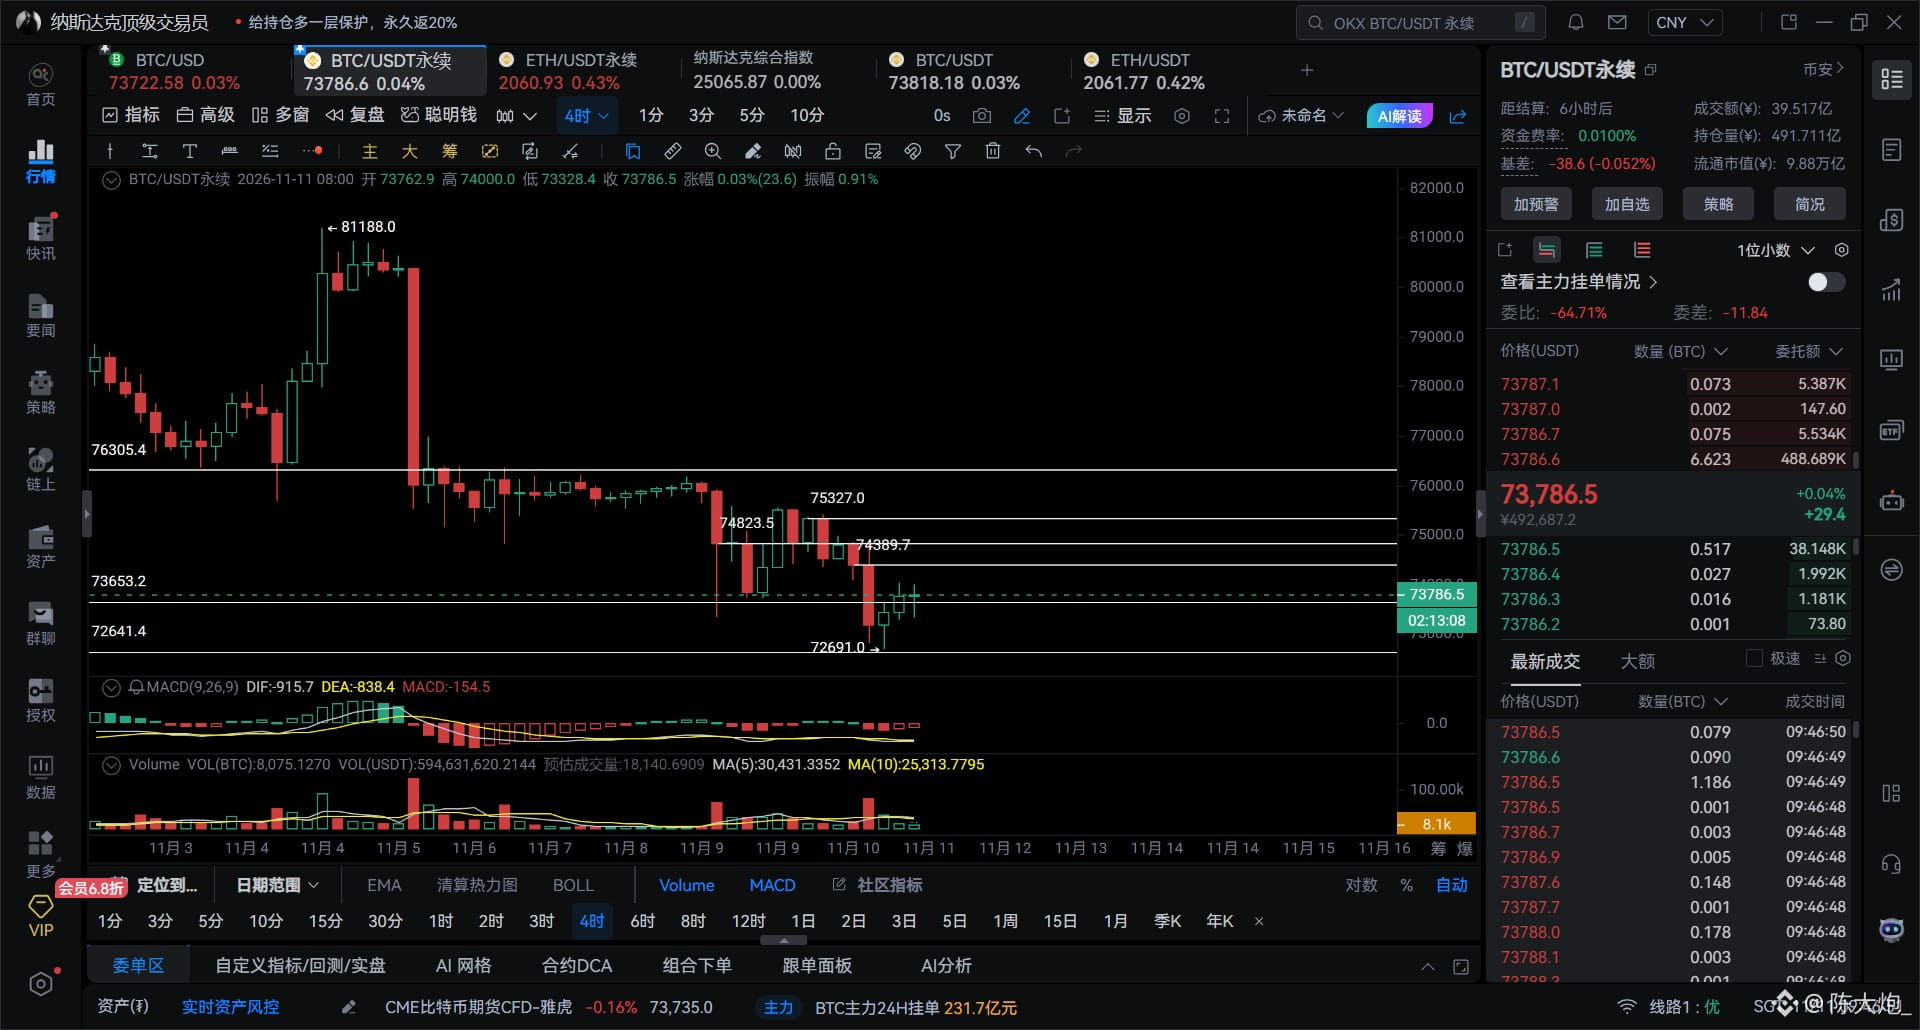
Bitcoin’s current price action is weak and in a gradual decline. Watch for the risk of a death cross on the 10-day line; if one occurs, it could trigger a larger drop. The daily MACD is opening downward, with no signs of converging. The 2/4-hour levels are hidden. There is a bottom on the 1-hour level, but the current 30/45-minute bottom pattern is weak. Short-term trades should be quick in and quick out, with strict stop-losses. Intraday resistance: 73844 74389 74823 75327 Support below: 73237 72700 71800 71300 If price breaks below 71300, pay close attention to the strength of support at 69800-69300. $BTC {future}(BTCUSDT)
Bitcoin’s current price action is weak and in a gradual decline.
Watch for the risk of a death cross on the 10-day line; if one occurs, it could trigger a larger drop.
The daily MACD is opening downward, with no signs of converging. The 2/4-hour levels are hidden.
There is a bottom on the 1-hour level, but the current 30/45-minute bottom pattern is weak.
Short-term trades should be quick in and quick out, with strict stop-losses.
Intraday resistance: 73844 74389 74823 75327
Support below: 73237 72700 71800 71300
If price breaks below 71300, pay close attention to the strength of support at 69800-69300.
$BTC
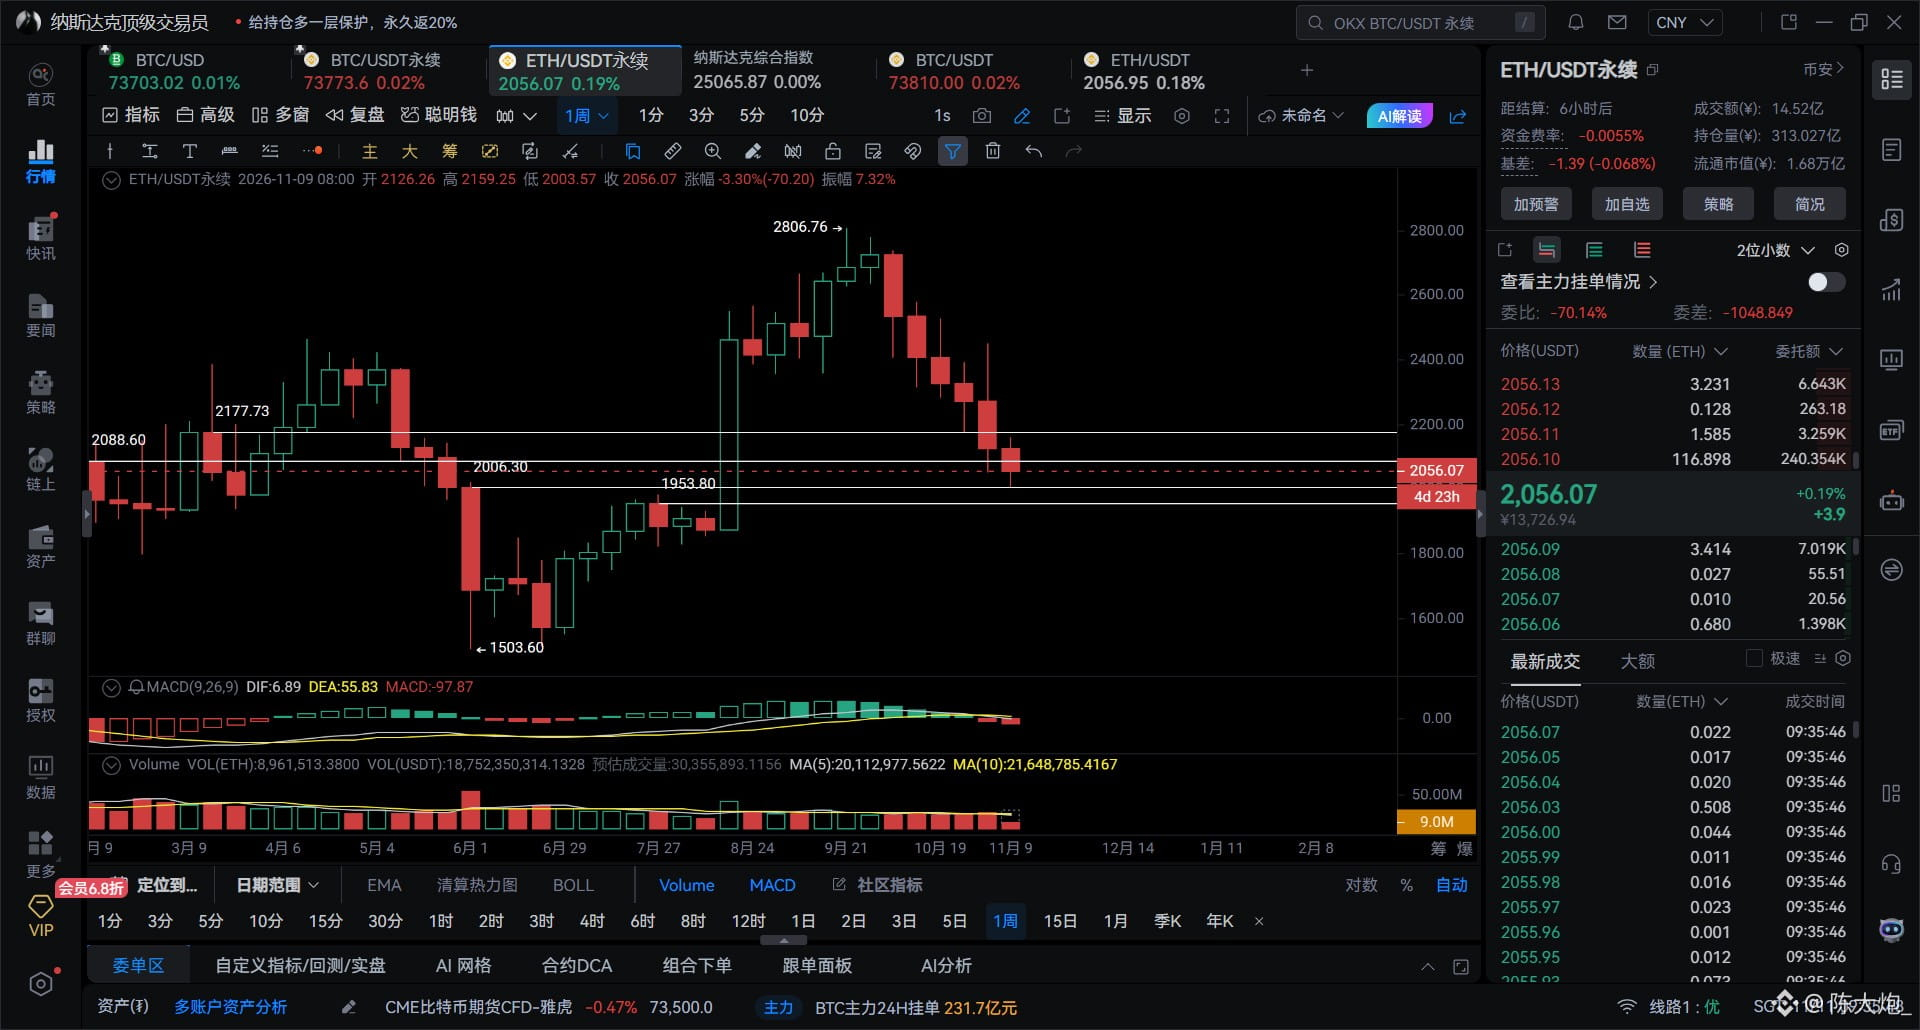
Ethereum perfectly retested the body of the weekly B-line level yesterday The market’s rebound is weak; ideally, a 4–6-hour bottom pattern should form There are still 2 more intraday rebound attempts; watch for the 4-hour hidden signal after the noon candle closes In the short term, we need to keep a close eye on whether the 2000 level breaks; below it, the levels are 1972–1943 Intraday resistance: 2064 2088 2106 2126 Intraday support: 2026 2007 1972 1943$ETH {future}(ETHUSDT)
Ethereum perfectly retested the body of the weekly B-line level yesterday
The market’s rebound is weak; ideally, a 4–6-hour bottom pattern should form
There are still 2 more intraday rebound attempts; watch for the 4-hour hidden signal after the noon candle closes
In the short term, we need to keep a close eye on whether the 2000 level breaks; below it, the levels are 1972–1943
Intraday resistance: 2064 2088 2106 2126
Intraday support: 2026 2007 1972 1943$ETH
Nailed Ethereum’s price levels perfectly 2060 secured—waiting for a pullback to keep trading
Nailed Ethereum’s price levels perfectly
2060 secured—waiting for a pullback to keep trading
陈大炮_
·
--
Ethereum: Watch for a downside wick tonight. Longs can open an initial position in the 2010–2006 range; add at 1970–1950. Take profit at 2050, with 2085 as the next target.
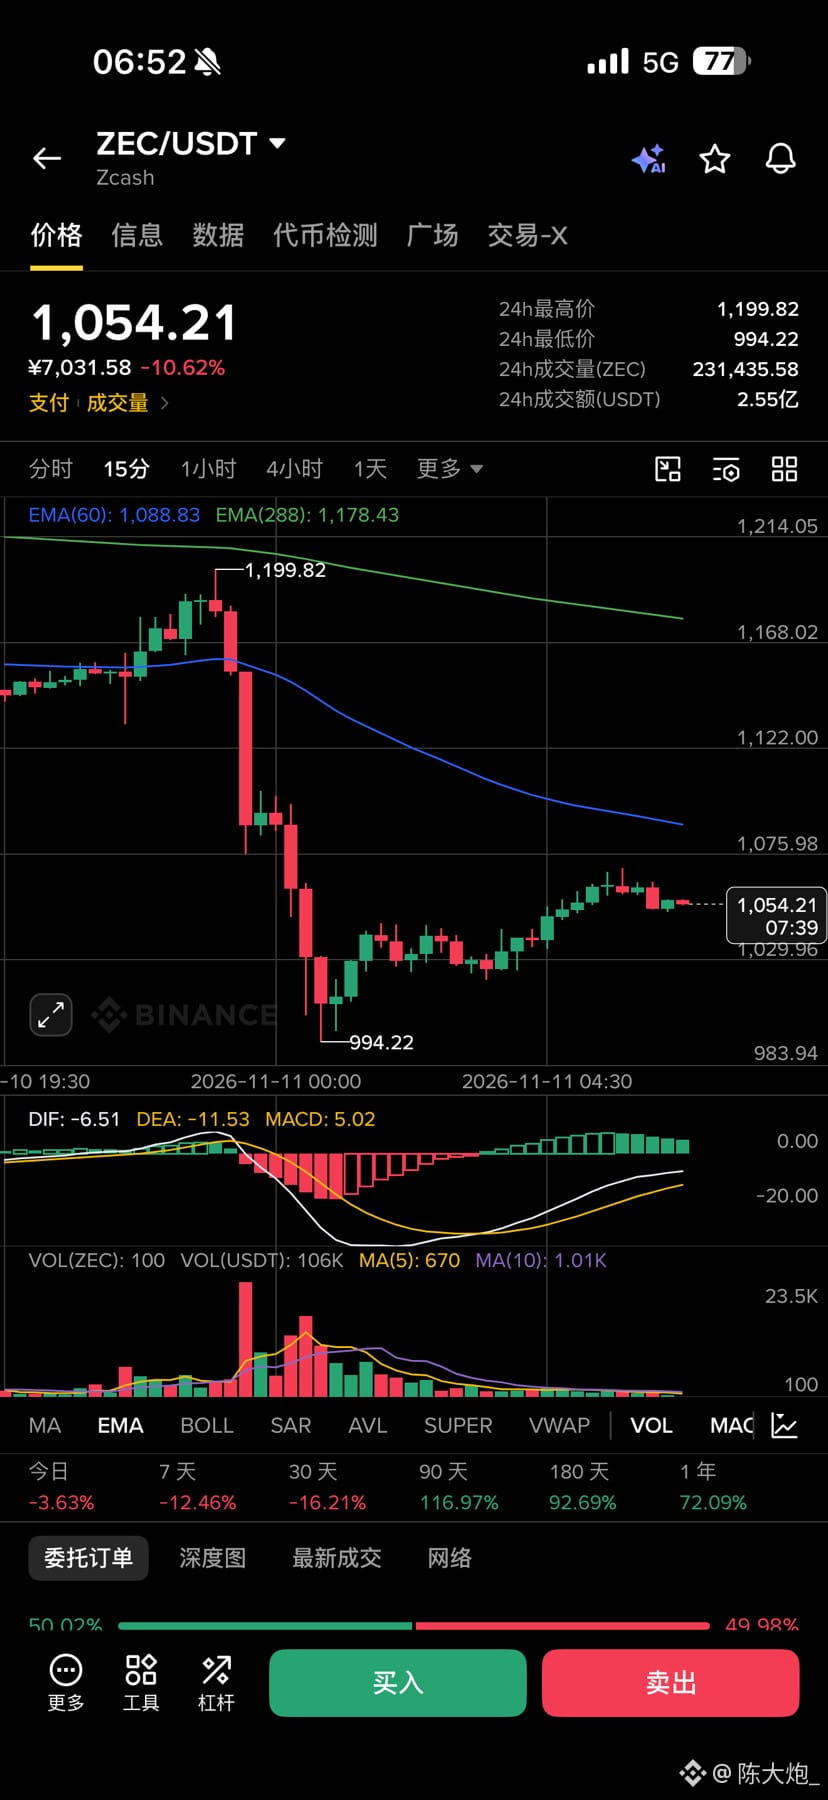
ZEC broke below Feels kinda gross Got stopped out😭
ZEC broke below
Feels kinda gross Got stopped out😭
陈大炮_
·
--
With tonight's CPI news providing support,
consider going long on ZEC if it pulls back to 1085–1065.
Stop loss: 1048; take profit target: 1125
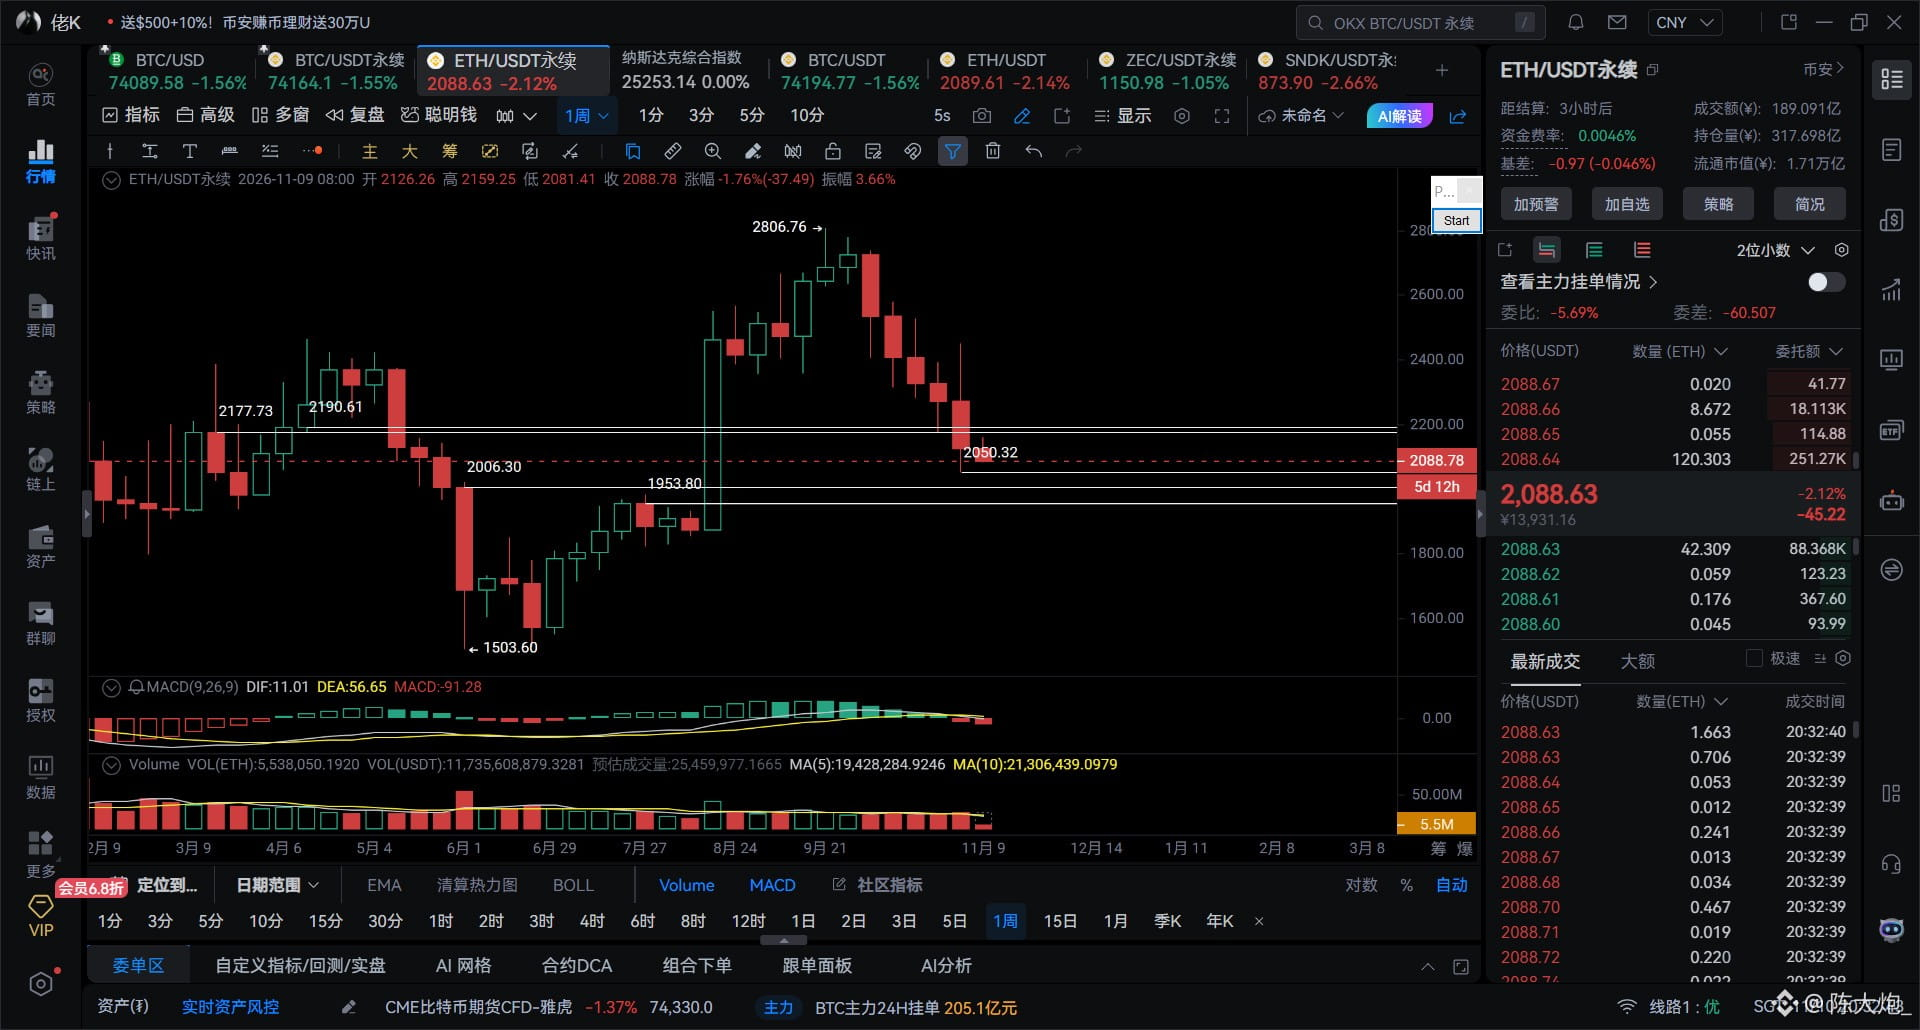
Ethereum: Watch for a downside wick tonight. Longs can open an initial position in the 2010–2006 range; add at 1970–1950. Take profit at 2050, with 2085 as the next target.
Log in to explore more content
Join global crypto users on Binance Square
⚡️ Get latest and useful information about crypto.
💬 Trusted by the world’s largest crypto exchange.
👍 Discover real insights from verified creators.
Email / Phone number
Sitemap
Cookie Preferences
Platform T&Cs