

XB-Crypto
485 Posts

XB-Crypto
Report
Block User
Crypto Technical Analyst | Price Action Trader | Trading Crypto, Forex, Stocks, Commodities & Indices | Market Makers Model Specialist | Trading Mentor

Level 1 Creator
Frequent Trader
4.9 Years
4 Following
10.8K+ Followers
4.0K+ Liked
1 Badges
Posts
All
Quotes
Videos
Live
PINNED
·
--
Bullish
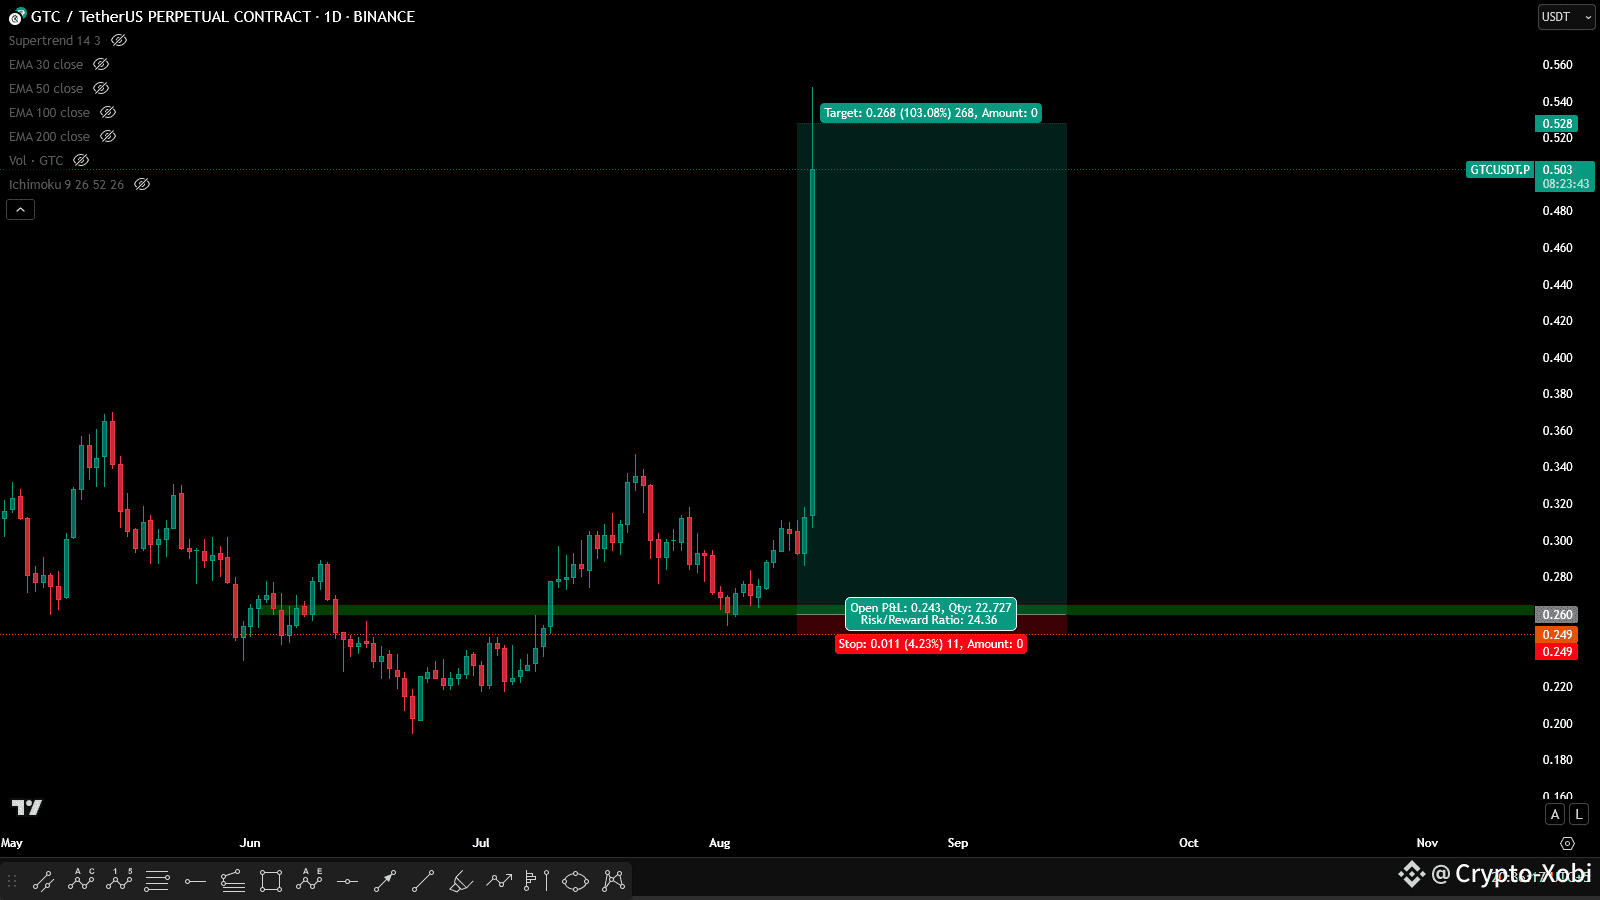
$GTC Trade Updates: Are you not entertained yet?
$GTC 1:24 Risk to Reward ratio trade completed successfully.
If you are not taking such high R/R trades, you are missing out on huge profits.
You can trade such an amazing type of trade with leverage and a single trade like this can recover all your loss in one single trade.
Huge congratulations to those who took this $GTC trade.🥂
#ETH5kNext? #BinanceAlphaAlert
{future}(GTCUSDT)
$GTC Trade Updates: Are you not entertained yet?
$GTC 1:24 Risk to Reward ratio trade completed successfully.
If you are not taking such high R/R trades, you are missing out on huge profits.
You can trade such an amazing type of trade with leverage and a single trade like this can recover all your loss in one single trade.
Huge congratulations to those who took this $GTC trade.🥂
#ETH5kNext? #BinanceAlphaAlert
$GTC 1:24 Risk to Reward ratio trade completed successfully.
If you are not taking such high R/R trades, you are missing out on huge profits.
You can trade such an amazing type of trade with leverage and a single trade like this can recover all your loss in one single trade.
Huge congratulations to those who took this $GTC trade.🥂
#ETH5kNext? #BinanceAlphaAlert
XB-Crypto
·
--
$GTC 1:24 R/R setup
1
5
575
PINNED
·
--
Bullish
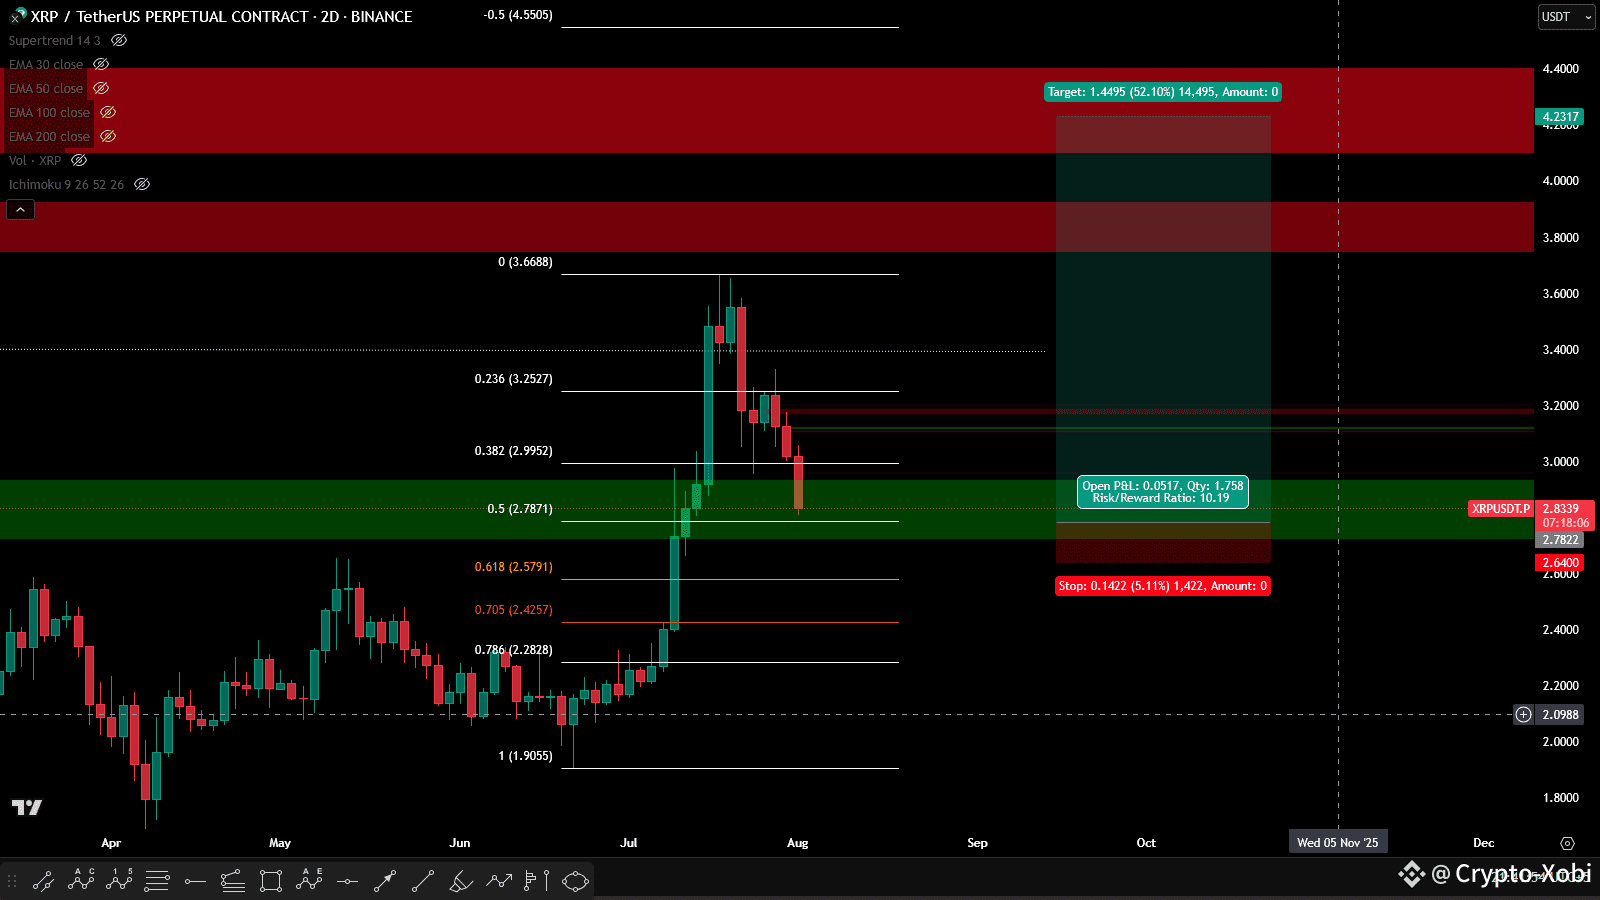
$XRP Updates: $XRP is at a very powerful higher time frame zone. That EQ confluence is something that can't be ignored.
I am expecting a powerful reversal from 0.5 Fib region.
$XRP at this zone offers an amazing 1:10 R/R.
I am very much interested in it. Let see how it plays out.
#ProjectCrypto #MarketPullback
{future}(XRPUSDT)
$XRP Updates: $XRP is at a very powerful higher time frame zone. That EQ confluence is something that can't be ignored.
I am expecting a powerful reversal from 0.5 Fib region.
$XRP at this zone offers an amazing 1:10 R/R.
I am very much interested in it. Let see how it plays out.
#ProjectCrypto #MarketPullback
I am expecting a powerful reversal from 0.5 Fib region.
$XRP at this zone offers an amazing 1:10 R/R.
I am very much interested in it. Let see how it plays out.
#ProjectCrypto #MarketPullback
1
6
630
·
--

Article
The Art of Losing: Why the Best Traders Are Experts at Being WrongWhat if I told you that one of the most important skills in trading has nothing to do with winning?
Most traders enter the market obsessed with being right. They spend countless hours studying charts, identifying patterns, refining strategies, and searching for that perfect entry.
But there's something they often overlook.
The best traders aren't necessarily the ones who predict the market correctly most often. They're the ones who have mastered the art of being wrong.
And that's a skill far more difficult to develop than most people realize.
The Market Doesn't Care About Your Opinion
Imagine spending hours analyzing $BTC . You've identified a beautiful demand zone, multiple technical confluences, and what looks like an excellent long opportunity.
You enter the trade.
Price initially moves in your favor, but suddenly the market reverses.
Now you're watching your position turn red.
What happens next?
For many traders, this is where the real battle begins.
They start looking for reasons to stay in the trade. They move their stop loss further away. They switch to higher timeframes, hoping to find something that supports their original idea.
And sometimes, they even add to a losing position.
Why?
Because somewhere along the way, their analysis became their identity.
They are no longer defending a trade. They are defending their ego.
But here's something every trader needs to understand:
The market doesn't know who you are. It doesn't care how much research you've done, how confident you feel, or how badly you need that trade to work.
Your analysis is simply a hypothesis.
And a hypothesis must always remain open to being proven wrong.
Think about this for a moment.
A professional trader can enter a position with complete confidence in their process and still accept a loss without hesitation.
Not because they enjoy losing money.
But because they understand that losing is an unavoidable part of operating in an uncertain environment.
They don't become emotionally attached to their predictions.
They understand that every trade is a probability, not a promise.
If the market confirms their idea, they manage the opportunity.
If the market invalidates their idea, they exit.
Simple in theory. Extremely difficult in practice.
The goal isn't to become comfortable with losing money carelessly. It's to become comfortable accepting a small, planned loss when the market proves your idea wrong.
A loss taken according to your trading plan isn't necessarily a mistake.
Sometimes, it's evidence of excellent execution.
Your Biggest Enemy Might Be Your Own Nervous System
Here's where trading psychology gets particularly interesting.
When a trade moves against you, your brain may interpret the potential financial loss as a threat.
Your heart rate increases. Your muscles tighten. Your breathing becomes faster and shallower.
Your body begins preparing for a fight-or-flight response.
And suddenly, the calm, rational trader who carefully planned the setup disappears.
In their place is someone desperately trying to escape discomfort.
You might close a perfectly valid trade too early.
Or worse, refuse to close an invalid trade because realizing the loss feels unbearable.
This is why trading psychology isn't just about positive thinking or repeating motivational quotes.
It's also about learning to regulate your physiological response to uncertainty.
The Crucible of Uncertainty
You cannot become a disciplined trader simply by reading about discipline.
You develop it through experience.
Through watching a promising setup fail.
Through taking a stop-loss and resisting the temptation to immediately recover the money.
Through seeing price reverse in your original direction after you've already exited.
Through accepting that you can make the correct decision and still experience an unfavorable outcome.
That's the crucible in which trading discipline is developed.
And there's a particularly important lesson hidden inside those experiences:
You don't need to know what the market will do next to make a good trading decision.
You only need to know what you'll do under different conditions.
Before entering, you should already understand where your idea becomes invalid, how much capital you're willing to risk, and what conditions would justify holding or exiting.
Once those decisions are made, your responsibility is to execute them.
Not to argue with the market.
Not to negotiate with your stop-loss.
And certainly not to prove that your prediction was correct.
The Freedom of Not Needing to Be Right
One of the biggest psychological breakthroughs a trader can experience is realizing that being wrong doesn't have to be a big deal.
Imagine risking $20 on a trade with a potential reward of $80.
You take the setup. The market invalidates it. You lose $20.
That's it.
You followed your process, respected your risk, and preserved your ability to participate in the next opportunity.
Of course, the strategy still needs a genuine statistical edge. Good risk management alone cannot turn a losing strategy into a profitable one.
But now imagine the alternative.
You refuse to accept that $20 loss. You move your stop. You add to the position. You convince yourself the market will eventually reverse.
What started as a small, manageable loss becomes a serious threat to your account.
All because you couldn't tolerate being wrong.
A trader who cannot accept a small loss will eventually be tempted to accept a much larger one.
This is why professional trading requires a fundamentally different mindset.
You stop asking, "How can I make sure this trade wins?"
And start asking, "How can I execute this idea correctly, regardless of the outcome?"
Become an Expert at Losing
The next time you enter a trade, pay attention to what happens inside you when price moves against your position.
Notice your heartbeat.
Notice the urge to interfere.
Notice how quickly your mind begins searching for evidence that you're still right.
Don't immediately obey those impulses.
Return to your trading plan.
Ask yourself whether the original setup remains valid.
If it does, manage the trade according to your rules.
If it doesn't, take the loss.
No drama. No revenge trading. No desperate attempt to win the money back.
Just another trade in a long series of probabilities.
Because ultimately, trading isn't about winning every battle.
It's about surviving enough battles, protecting your capital, and consistently executing a process that has a positive expectancy.
And perhaps the greatest paradox in trading is this:
The moment you stop desperately trying to avoid every loss may be the moment you finally begin developing the discipline required for long term success.
The market will give you countless opportunities to be wrong.
Your job is to make sure being wrong never becomes something you cannot recover from.
Learn to lose well. That's how you give yourself the opportunity to win over time.
#tradingpsychology
The Art of Losing: Why the Best Traders Are Experts at Being Wrong
What if I told you that one of the most important skills in trading has nothing to do with winning?
Most traders enter the market obsessed with being right. They spend countless hours studying charts, identifying patterns, refining strategies, and searching for that perfect entry.
But there's something they often overlook.
The best traders aren't necessarily the ones who predict the market correctly most often. They're the ones who have mastered the art of being wrong.
And that's a skill far more difficult to develop than most people realize.
The Market Doesn't Care About Your Opinion
Imagine spending hours analyzing $BTC . You've identified a beautiful demand zone, multiple technical confluences, and what looks like an excellent long opportunity.
You enter the trade.
Price initially moves in your favor, but suddenly the market reverses.
Now you're watching your position turn red.
What happens next?
For many traders, this is where the real battle begins.
They start looking for reasons to stay in the trade. They move their stop loss further away. They switch to higher timeframes, hoping to find something that supports their original idea.
And sometimes, they even add to a losing position.
Why?
Because somewhere along the way, their analysis became their identity.
They are no longer defending a trade. They are defending their ego.
But here's something every trader needs to understand:
The market doesn't know who you are. It doesn't care how much research you've done, how confident you feel, or how badly you need that trade to work.
Your analysis is simply a hypothesis.
And a hypothesis must always remain open to being proven wrong.
Think about this for a moment.
A professional trader can enter a position with complete confidence in their process and still accept a loss without hesitation.
Not because they enjoy losing money.
But because they understand that losing is an unavoidable part of operating in an uncertain environment.
They don't become emotionally attached to their predictions.
They understand that every trade is a probability, not a promise.
If the market confirms their idea, they manage the opportunity.
If the market invalidates their idea, they exit.
Simple in theory. Extremely difficult in practice.
The goal isn't to become comfortable with losing money carelessly. It's to become comfortable accepting a small, planned loss when the market proves your idea wrong.
A loss taken according to your trading plan isn't necessarily a mistake.
Sometimes, it's evidence of excellent execution.
Your Biggest Enemy Might Be Your Own Nervous System
Here's where trading psychology gets particularly interesting.
When a trade moves against you, your brain may interpret the potential financial loss as a threat.
Your heart rate increases. Your muscles tighten. Your breathing becomes faster and shallower.
Your body begins preparing for a fight-or-flight response.
And suddenly, the calm, rational trader who carefully planned the setup disappears.
In their place is someone desperately trying to escape discomfort.
You might close a perfectly valid trade too early.
Or worse, refuse to close an invalid trade because realizing the loss feels unbearable.
This is why trading psychology isn't just about positive thinking or repeating motivational quotes.
It's also about learning to regulate your physiological response to uncertainty.
The Crucible of Uncertainty
You cannot become a disciplined trader simply by reading about discipline.
You develop it through experience.
Through watching a promising setup fail.
Through taking a stop-loss and resisting the temptation to immediately recover the money.
Through seeing price reverse in your original direction after you've already exited.
Through accepting that you can make the correct decision and still experience an unfavorable outcome.
That's the crucible in which trading discipline is developed.
And there's a particularly important lesson hidden inside those experiences:
You don't need to know what the market will do next to make a good trading decision.
You only need to know what you'll do under different conditions.
Before entering, you should already understand where your idea becomes invalid, how much capital you're willing to risk, and what conditions would justify holding or exiting.
Once those decisions are made, your responsibility is to execute them.
Not to argue with the market.
Not to negotiate with your stop-loss.
And certainly not to prove that your prediction was correct.
The Freedom of Not Needing to Be Right
One of the biggest psychological breakthroughs a trader can experience is realizing that being wrong doesn't have to be a big deal.
Imagine risking $20 on a trade with a potential reward of $80.
You take the setup. The market invalidates it. You lose $20.
That's it.
You followed your process, respected your risk, and preserved your ability to participate in the next opportunity.
Of course, the strategy still needs a genuine statistical edge. Good risk management alone cannot turn a losing strategy into a profitable one.
But now imagine the alternative.
You refuse to accept that $20 loss. You move your stop. You add to the position. You convince yourself the market will eventually reverse.
What started as a small, manageable loss becomes a serious threat to your account.
All because you couldn't tolerate being wrong.
A trader who cannot accept a small loss will eventually be tempted to accept a much larger one.
This is why professional trading requires a fundamentally different mindset.
You stop asking, "How can I make sure this trade wins?"
And start asking, "How can I execute this idea correctly, regardless of the outcome?"
Become an Expert at Losing
The next time you enter a trade, pay attention to what happens inside you when price moves against your position.
Notice your heartbeat.
Notice the urge to interfere.
Notice how quickly your mind begins searching for evidence that you're still right.
Don't immediately obey those impulses.
Return to your trading plan.
Ask yourself whether the original setup remains valid.
If it does, manage the trade according to your rules.
If it doesn't, take the loss.
No drama. No revenge trading. No desperate attempt to win the money back.
Just another trade in a long series of probabilities.
Because ultimately, trading isn't about winning every battle.
It's about surviving enough battles, protecting your capital, and consistently executing a process that has a positive expectancy.
And perhaps the greatest paradox in trading is this:
The moment you stop desperately trying to avoid every loss may be the moment you finally begin developing the discipline required for long term success.
The market will give you countless opportunities to be wrong.
Your job is to make sure being wrong never becomes something you cannot recover from.
Learn to lose well. That's how you give yourself the opportunity to win over time.
#tradingpsychology
Most traders enter the market obsessed with being right. They spend countless hours studying charts, identifying patterns, refining strategies, and searching for that perfect entry.
But there's something they often overlook.
The best traders aren't necessarily the ones who predict the market correctly most often. They're the ones who have mastered the art of being wrong.
And that's a skill far more difficult to develop than most people realize.
The Market Doesn't Care About Your Opinion
Imagine spending hours analyzing $BTC . You've identified a beautiful demand zone, multiple technical confluences, and what looks like an excellent long opportunity.
You enter the trade.
Price initially moves in your favor, but suddenly the market reverses.
Now you're watching your position turn red.
What happens next?
For many traders, this is where the real battle begins.
They start looking for reasons to stay in the trade. They move their stop loss further away. They switch to higher timeframes, hoping to find something that supports their original idea.
And sometimes, they even add to a losing position.
Why?
Because somewhere along the way, their analysis became their identity.
They are no longer defending a trade. They are defending their ego.
But here's something every trader needs to understand:
The market doesn't know who you are. It doesn't care how much research you've done, how confident you feel, or how badly you need that trade to work.
Your analysis is simply a hypothesis.
And a hypothesis must always remain open to being proven wrong.
Think about this for a moment.
A professional trader can enter a position with complete confidence in their process and still accept a loss without hesitation.
Not because they enjoy losing money.
But because they understand that losing is an unavoidable part of operating in an uncertain environment.
They don't become emotionally attached to their predictions.
They understand that every trade is a probability, not a promise.
If the market confirms their idea, they manage the opportunity.
If the market invalidates their idea, they exit.
Simple in theory. Extremely difficult in practice.
The goal isn't to become comfortable with losing money carelessly. It's to become comfortable accepting a small, planned loss when the market proves your idea wrong.
A loss taken according to your trading plan isn't necessarily a mistake.
Sometimes, it's evidence of excellent execution.
Your Biggest Enemy Might Be Your Own Nervous System
Here's where trading psychology gets particularly interesting.
When a trade moves against you, your brain may interpret the potential financial loss as a threat.
Your heart rate increases. Your muscles tighten. Your breathing becomes faster and shallower.
Your body begins preparing for a fight-or-flight response.
And suddenly, the calm, rational trader who carefully planned the setup disappears.
In their place is someone desperately trying to escape discomfort.
You might close a perfectly valid trade too early.
Or worse, refuse to close an invalid trade because realizing the loss feels unbearable.
This is why trading psychology isn't just about positive thinking or repeating motivational quotes.
It's also about learning to regulate your physiological response to uncertainty.
The Crucible of Uncertainty
You cannot become a disciplined trader simply by reading about discipline.
You develop it through experience.
Through watching a promising setup fail.
Through taking a stop-loss and resisting the temptation to immediately recover the money.
Through seeing price reverse in your original direction after you've already exited.
Through accepting that you can make the correct decision and still experience an unfavorable outcome.
That's the crucible in which trading discipline is developed.
And there's a particularly important lesson hidden inside those experiences:
You don't need to know what the market will do next to make a good trading decision.
You only need to know what you'll do under different conditions.
Before entering, you should already understand where your idea becomes invalid, how much capital you're willing to risk, and what conditions would justify holding or exiting.
Once those decisions are made, your responsibility is to execute them.
Not to argue with the market.
Not to negotiate with your stop-loss.
And certainly not to prove that your prediction was correct.
The Freedom of Not Needing to Be Right
One of the biggest psychological breakthroughs a trader can experience is realizing that being wrong doesn't have to be a big deal.
Imagine risking $20 on a trade with a potential reward of $80.
You take the setup. The market invalidates it. You lose $20.
That's it.
You followed your process, respected your risk, and preserved your ability to participate in the next opportunity.
Of course, the strategy still needs a genuine statistical edge. Good risk management alone cannot turn a losing strategy into a profitable one.
But now imagine the alternative.
You refuse to accept that $20 loss. You move your stop. You add to the position. You convince yourself the market will eventually reverse.
What started as a small, manageable loss becomes a serious threat to your account.
All because you couldn't tolerate being wrong.
A trader who cannot accept a small loss will eventually be tempted to accept a much larger one.
This is why professional trading requires a fundamentally different mindset.
You stop asking, "How can I make sure this trade wins?"
And start asking, "How can I execute this idea correctly, regardless of the outcome?"
Become an Expert at Losing
The next time you enter a trade, pay attention to what happens inside you when price moves against your position.
Notice your heartbeat.
Notice the urge to interfere.
Notice how quickly your mind begins searching for evidence that you're still right.
Don't immediately obey those impulses.
Return to your trading plan.
Ask yourself whether the original setup remains valid.
If it does, manage the trade according to your rules.
If it doesn't, take the loss.
No drama. No revenge trading. No desperate attempt to win the money back.
Just another trade in a long series of probabilities.
Because ultimately, trading isn't about winning every battle.
It's about surviving enough battles, protecting your capital, and consistently executing a process that has a positive expectancy.
And perhaps the greatest paradox in trading is this:
The moment you stop desperately trying to avoid every loss may be the moment you finally begin developing the discipline required for long term success.
The market will give you countless opportunities to be wrong.
Your job is to make sure being wrong never becomes something you cannot recover from.
Learn to lose well. That's how you give yourself the opportunity to win over time.
#tradingpsychology
1
213
·
--
Bullish
XB-Crypto
·
--
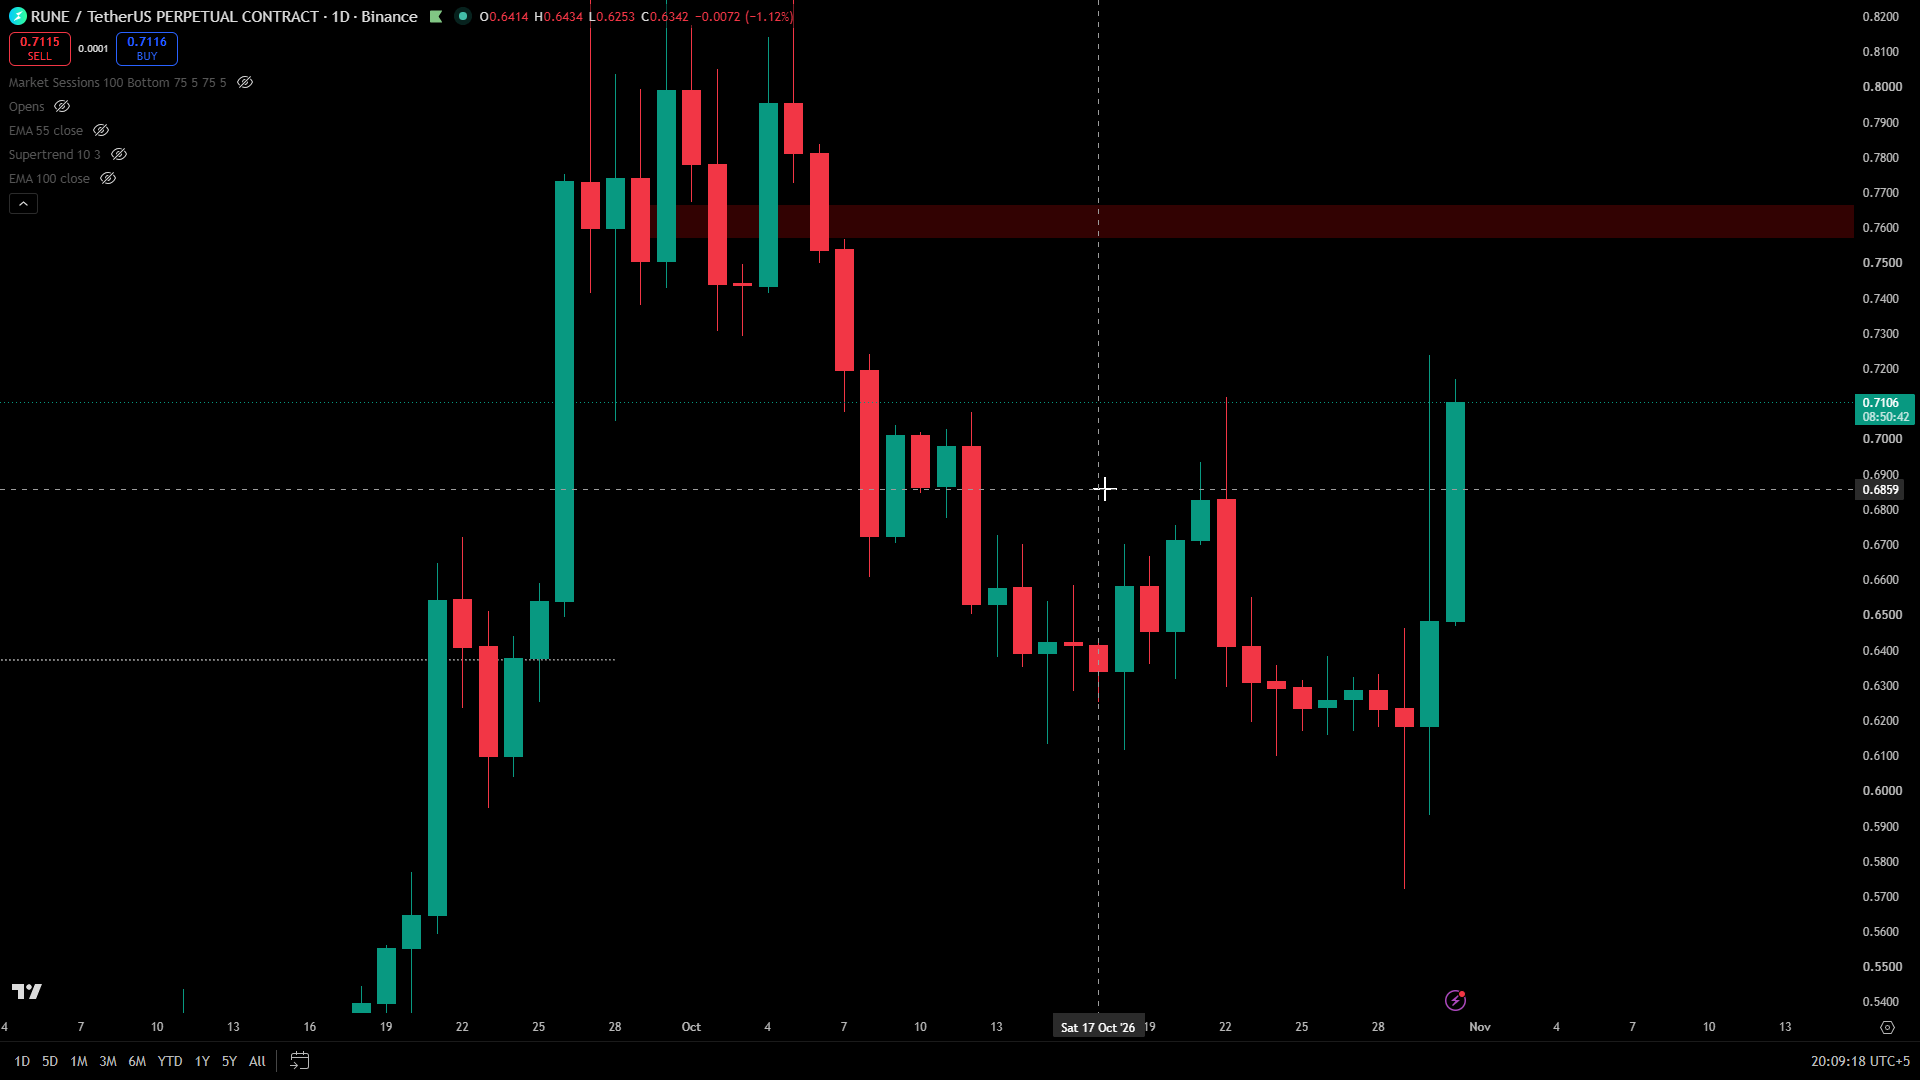
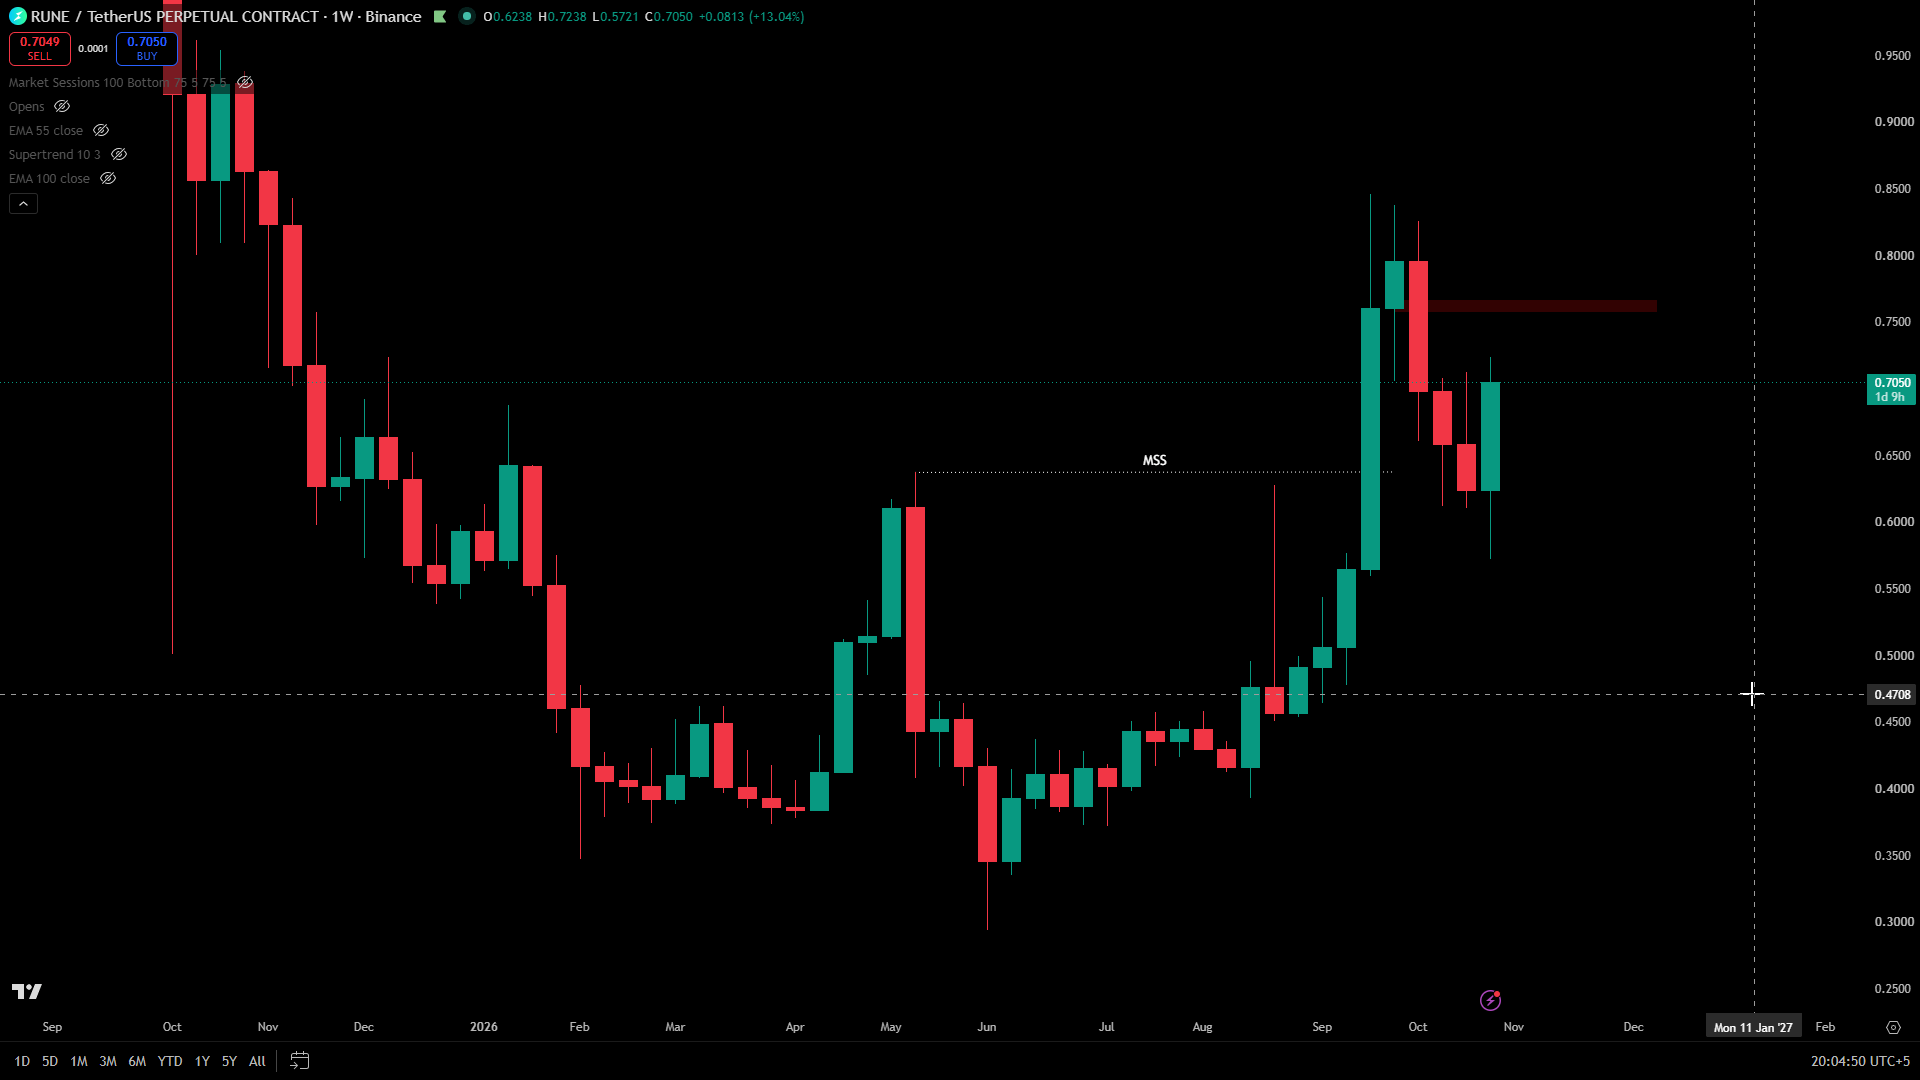
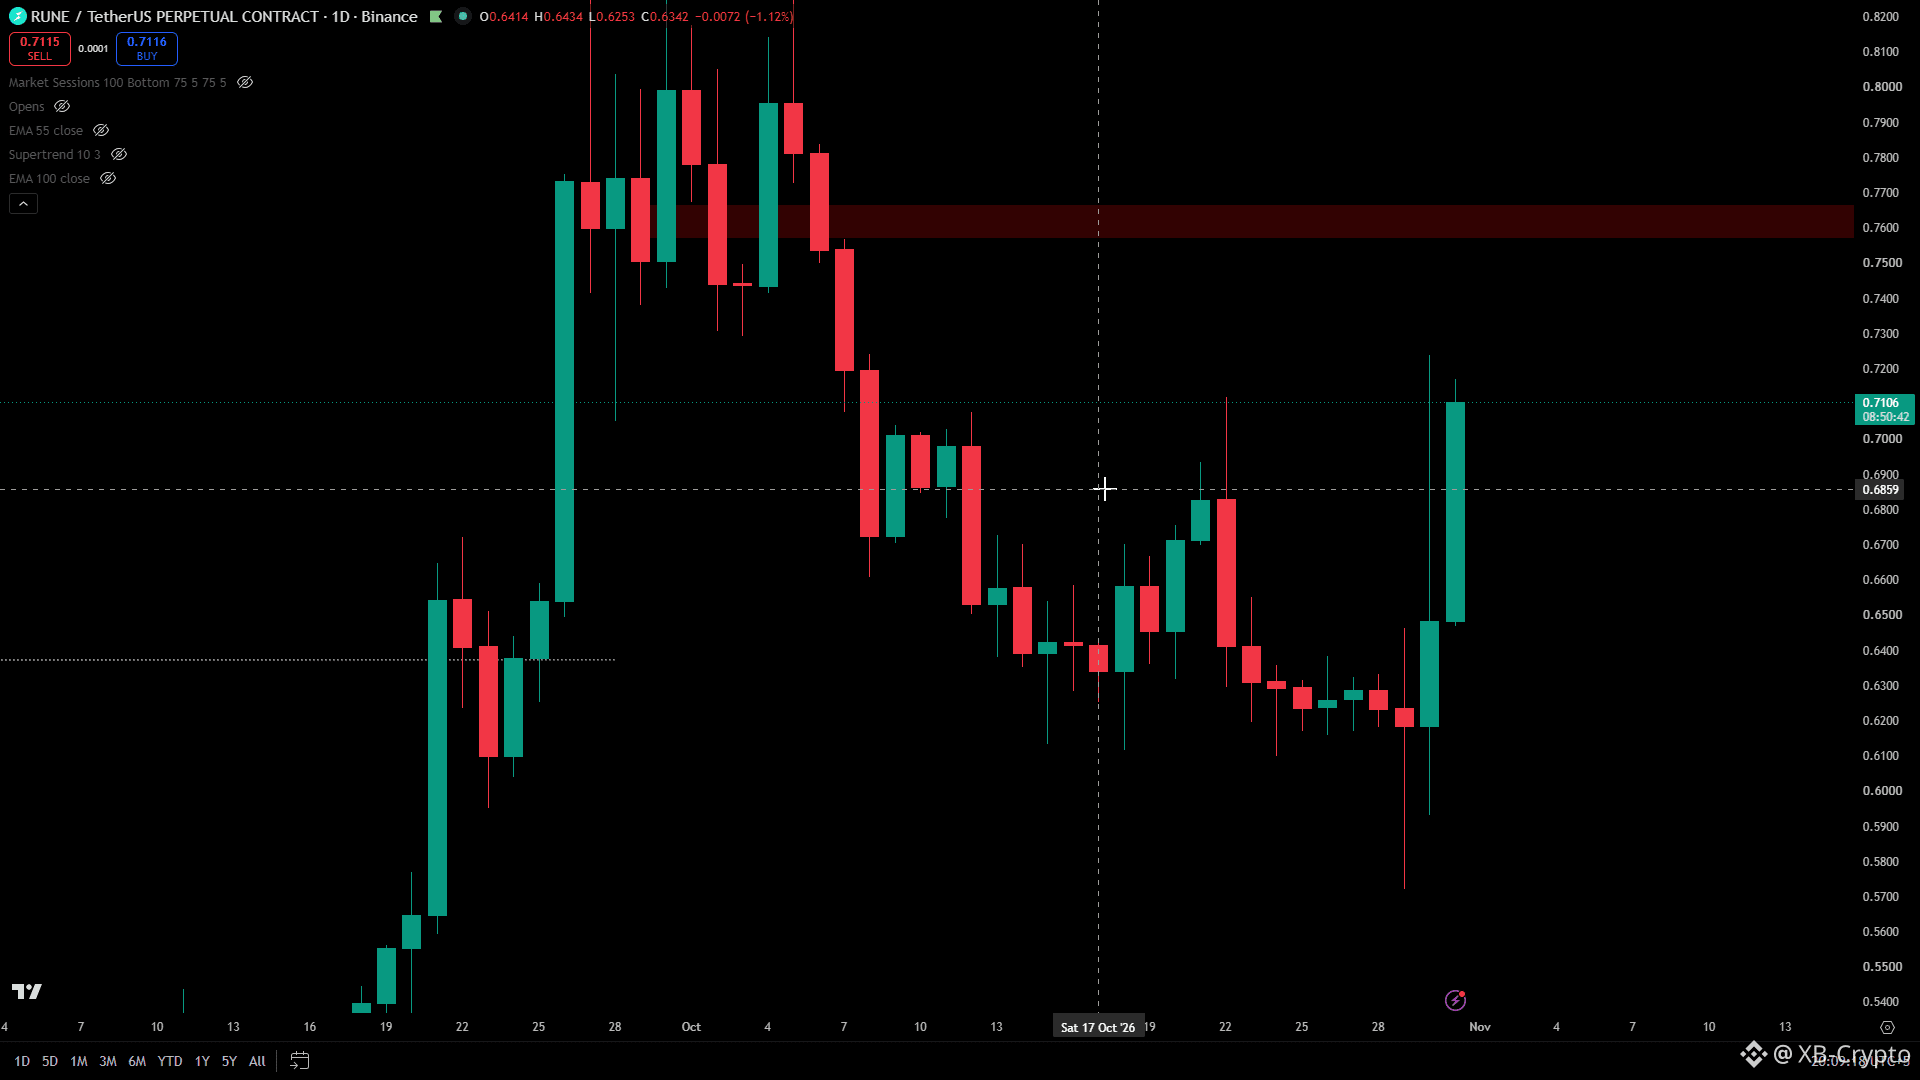
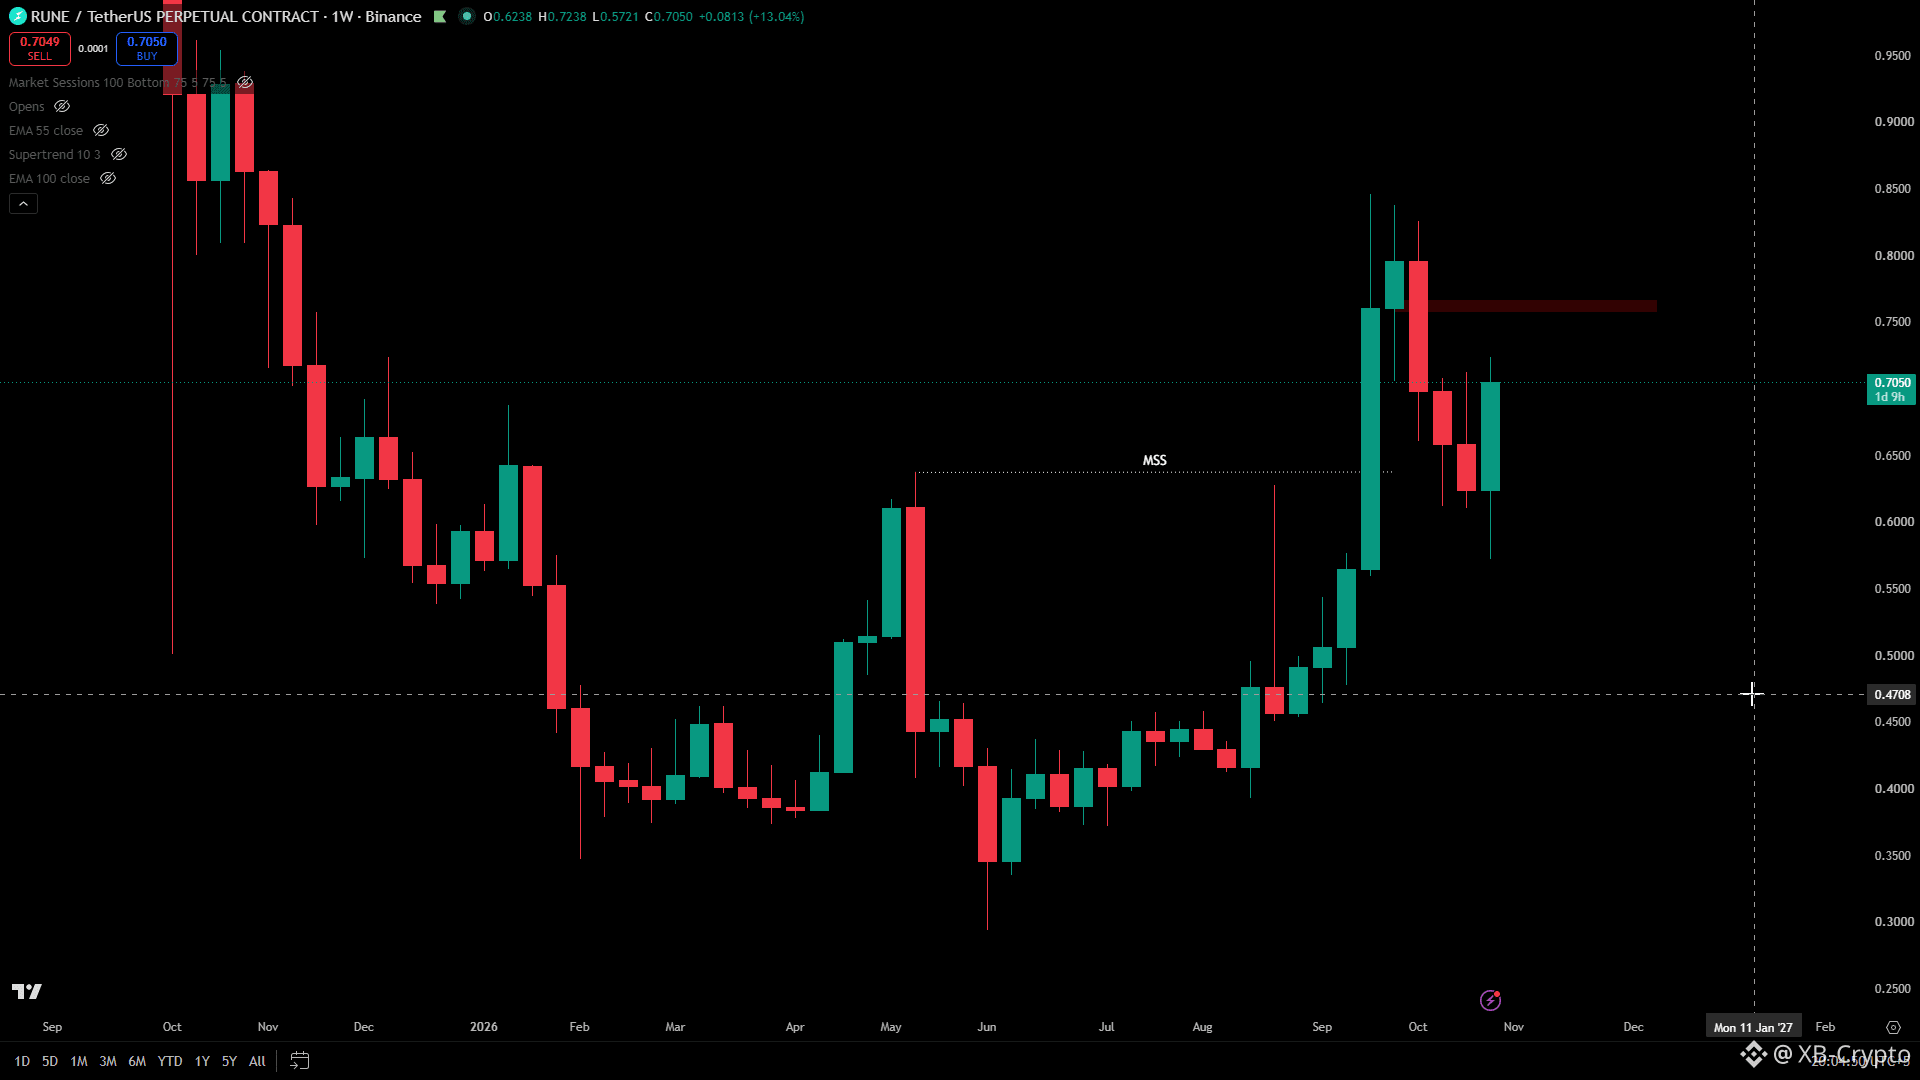
BullishJust noticed that $RUNE is looking very bullish on HTF. The price action has definitely caught my attention.
I am interested in going long, but not at the current price. I'd rather wait for a pullback into my preferred buying zone. And I already know where I want to enter.
Also I am watching the highlighted region in red for a potential quick short. $RUNE looks very bullish but the level is simply too good to ignore. So I will use less position size than normal on that short.
One more thing, if price breaks through this level and leaves behind a bullish FVG on the daily, the level will turn to bullish and we can look for a long on the retest.
Same level, different opportunities. It all depends on how price reacts.
Let's see how this plays out.
#alcoins #Rune
I am interested in going long, but not at the current price. I'd rather wait for a pullback into my preferred buying zone. And I already know where I want to enter.
Also I am watching the highlighted region in red for a potential quick short. $RUNE looks very bullish but the level is simply too good to ignore. So I will use less position size than normal on that short.
One more thing, if price breaks through this level and leaves behind a bullish FVG on the daily, the level will turn to bullish and we can look for a long on the retest.
Same level, different opportunities. It all depends on how price reacts.
Let's see how this plays out.
#alcoins #Rune
115
·
--
Bullish
Just noticed that $RUNE is looking very bullish on HTF. The price action has definitely caught my attention.
I am interested in going long, but not at the current price. I'd rather wait for a pullback into my preferred buying zone. And I already know where I want to enter.
Also I am watching the highlighted region in red for a potential quick short. $RUNE looks very bullish but the level is simply too good to ignore. So I will use less position size than normal on that short.
One more thing, if price breaks through this level and leaves behind a bullish FVG on the daily, the level will turn to bullish and we can look for a long on the retest.
Same level, different opportunities. It all depends on how price reacts.
Let's see how this plays out.
#alcoins #Rune
Just noticed that $RUNE is looking very bullish on HTF. The price action has definitely caught my attention.
I am interested in going long, but not at the current price. I'd rather wait for a pullback into my preferred buying zone. And I already know where I want to enter.
Also I am watching the highlighted region in red for a potential quick short. $RUNE looks very bullish but the level is simply too good to ignore. So I will use less position size than normal on that short.
One more thing, if price breaks through this level and leaves behind a bullish FVG on the daily, the level will turn to bullish and we can look for a long on the retest.
Same level, different opportunities. It all depends on how price reacts.
Let's see how this plays out.
#alcoins #Rune
I am interested in going long, but not at the current price. I'd rather wait for a pullback into my preferred buying zone. And I already know where I want to enter.
Also I am watching the highlighted region in red for a potential quick short. $RUNE looks very bullish but the level is simply too good to ignore. So I will use less position size than normal on that short.
One more thing, if price breaks through this level and leaves behind a bullish FVG on the daily, the level will turn to bullish and we can look for a long on the retest.
Same level, different opportunities. It all depends on how price reacts.
Let's see how this plays out.
#alcoins #Rune
1
1
476
·
--

Article
$BTC, $ETH & ETH/BTC: Could This Be the Final Shakeout Before a Major Rally?Something interesting is developing across the crypto market, and I believe it's worth paying close attention to. While Bitcoin and Ethereum are going down and bearish headlines surrounding the reported Binance hack are fueling fear, three important charts are simultaneously approaching higher timeframe bullish levels. And that's where my bullish thesis begins. Why I'm Watching for a Bullish Reversal
$ETH — Monthly Key Zone Ethereum is testing a major monthly bullish zone around 2,055–2,225, which also contains the 0.50–0.618 Fibonacci retracement area marked on my chart. This is a potential higher-timeframe demand zone where I'm looking for buyers to defend price. If the zone holds and bullish structure develops, my upside objective is around $3,179, offering an attractive potential risk-to-reward ratio of approximately 8.66:1 based on my planned setup.
$BTC — Bullish Key Level
Bitcoin is currently trading at 3D bullish order block. If price bounces from here, it could form a potential double bottom. Although there is a stronger bullish zone around 70K - 72K but considering where $ETH and ETH/BTC are trading on their higher timeframes, we cannot ignore the possibility of a reversal from current levels. I am keeping both scenarios in mind. Whether BTC reverses here or drops into the lower demand zone first, I'm prepared for either outcome and will let price action guide my next move. I am building longs at the current levels and I know my invalidation.
ETH/BTC — Higher Timeframe Bullish Confluence
This is particularly important. If ETH/BTC reacts positively from the 14D Breaker Block behind an FVG, it would suggest Ethereum is beginning to outperform Bitcoin. Combined with ETH/USDT holding monthly BB behind an FVG, that would provide stronger confirmation of the bullish thesis.
A Classic Setup for Retail Panic Before a Major Reversal?
This is where things get particularly interesting. Think about the timing. Bitcoin, Ethereum, and ETH/BTC are all approaching major bullish levels, yet the market is flooded with bearish headlines and fear. This is a classic environment where retail traders can be shaken out of their positions just before a potential major reversal. As prices fall, fear pushes traders to sell near support, close their longs, or open shorts expecting further downside. Stop-losses accumulate beneath obvious lows, creating pools of liquidity. Of course, this doesn't guarantee a reversal. But the combination of higher timeframe bullish confluences and widespread fear is exactly the kind of setup I'm watching.
The interesting thing about trading is that opportunities exist on both sides of the market. Whether prices go up or down, what matters is knowing where to enter, when to exit, and how much risk to take.
A Little Something for Serious Traders!
I've decided to start an exclusive group for those who are serious about trading and want to take their skills to the next level. I'm keeping the fee at just $5/month because I want everyone to have a chance to join, see what I offer, and decide for themselves if it's worth it. You can literally recover your fee in one small trade. Here's what you can expect: 3–4 trade setups every week. Technical analysis on demand. Educational content and trading psychology. Personal guidance on trades, position sizing, and risk management.
🔥 Here's the deal: The first 50 members get to keep the $5/month price for life, as long as they stay subscribed. After the introductory offer, the regular fee will be $50/month. I don't want this to be just another signals group. I want you to understand why we're taking a trade, how to manage it, and when to stay out of the market. If you've been following my analysis and like the way I approach the market, I'd love to have you on board. Only 50 spots at $5/month. Join while they're available! Link here [https://app.binance.com/uni-qr/BWo6PppN](https://app.binance.com/uni-qr/BWo6PppN)
#BTC #ETH
$BTC, $ETH & ETH/BTC: Could This Be the Final Shakeout Before a Major Rally?
Something interesting is developing across the crypto market, and I believe it's worth paying close attention to. While Bitcoin and Ethereum are going down and bearish headlines surrounding the reported Binance hack are fueling fear, three important charts are simultaneously approaching higher timeframe bullish levels. And that's where my bullish thesis begins. Why I'm Watching for a Bullish Reversal
$ETH — Monthly Key Zone Ethereum is testing a major monthly bullish zone around 2,055–2,225, which also contains the 0.50–0.618 Fibonacci retracement area marked on my chart. This is a potential higher-timeframe demand zone where I'm looking for buyers to defend price. If the zone holds and bullish structure develops, my upside objective is around $3,179, offering an attractive potential risk-to-reward ratio of approximately 8.66:1 based on my planned setup.
$BTC — Bullish Key Level
Bitcoin is currently trading at 3D bullish order block. If price bounces from here, it could form a potential double bottom. Although there is a stronger bullish zone around 70K - 72K but considering where $ETH and ETH/BTC are trading on their higher timeframes, we cannot ignore the possibility of a reversal from current levels. I am keeping both scenarios in mind. Whether BTC reverses here or drops into the lower demand zone first, I'm prepared for either outcome and will let price action guide my next move. I am building longs at the current levels and I know my invalidation.
ETH/BTC — Higher Timeframe Bullish Confluence
This is particularly important. If ETH/BTC reacts positively from the 14D Breaker Block behind an FVG, it would suggest Ethereum is beginning to outperform Bitcoin. Combined with ETH/USDT holding monthly BB behind an FVG, that would provide stronger confirmation of the bullish thesis.
A Classic Setup for Retail Panic Before a Major Reversal?
This is where things get particularly interesting. Think about the timing. Bitcoin, Ethereum, and ETH/BTC are all approaching major bullish levels, yet the market is flooded with bearish headlines and fear. This is a classic environment where retail traders can be shaken out of their positions just before a potential major reversal. As prices fall, fear pushes traders to sell near support, close their longs, or open shorts expecting further downside. Stop-losses accumulate beneath obvious lows, creating pools of liquidity. Of course, this doesn't guarantee a reversal. But the combination of higher timeframe bullish confluences and widespread fear is exactly the kind of setup I'm watching.
The interesting thing about trading is that opportunities exist on both sides of the market. Whether prices go up or down, what matters is knowing where to enter, when to exit, and how much risk to take.
A Little Something for Serious Traders!
I've decided to start an exclusive group for those who are serious about trading and want to take their skills to the next level. I'm keeping the fee at just $5/month because I want everyone to have a chance to join, see what I offer, and decide for themselves if it's worth it. You can literally recover your fee in one small trade. Here's what you can expect: 3–4 trade setups every week. Technical analysis on demand. Educational content and trading psychology. Personal guidance on trades, position sizing, and risk management.
🔥 Here's the deal: The first 50 members get to keep the $5/month price for life, as long as they stay subscribed. After the introductory offer, the regular fee will be $50/month. I don't want this to be just another signals group. I want you to understand why we're taking a trade, how to manage it, and when to stay out of the market. If you've been following my analysis and like the way I approach the market, I'd love to have you on board. Only 50 spots at $5/month. Join while they're available! Link here https://app.binance.com/uni-qr/BWo6PppN
#BTC #ETH
$ETH — Monthly Key Zone Ethereum is testing a major monthly bullish zone around 2,055–2,225, which also contains the 0.50–0.618 Fibonacci retracement area marked on my chart. This is a potential higher-timeframe demand zone where I'm looking for buyers to defend price. If the zone holds and bullish structure develops, my upside objective is around $3,179, offering an attractive potential risk-to-reward ratio of approximately 8.66:1 based on my planned setup.
$BTC — Bullish Key Level
Bitcoin is currently trading at 3D bullish order block. If price bounces from here, it could form a potential double bottom. Although there is a stronger bullish zone around 70K - 72K but considering where $ETH and ETH/BTC are trading on their higher timeframes, we cannot ignore the possibility of a reversal from current levels. I am keeping both scenarios in mind. Whether BTC reverses here or drops into the lower demand zone first, I'm prepared for either outcome and will let price action guide my next move. I am building longs at the current levels and I know my invalidation.
ETH/BTC — Higher Timeframe Bullish Confluence
This is particularly important. If ETH/BTC reacts positively from the 14D Breaker Block behind an FVG, it would suggest Ethereum is beginning to outperform Bitcoin. Combined with ETH/USDT holding monthly BB behind an FVG, that would provide stronger confirmation of the bullish thesis.
A Classic Setup for Retail Panic Before a Major Reversal?
This is where things get particularly interesting. Think about the timing. Bitcoin, Ethereum, and ETH/BTC are all approaching major bullish levels, yet the market is flooded with bearish headlines and fear. This is a classic environment where retail traders can be shaken out of their positions just before a potential major reversal. As prices fall, fear pushes traders to sell near support, close their longs, or open shorts expecting further downside. Stop-losses accumulate beneath obvious lows, creating pools of liquidity. Of course, this doesn't guarantee a reversal. But the combination of higher timeframe bullish confluences and widespread fear is exactly the kind of setup I'm watching.
The interesting thing about trading is that opportunities exist on both sides of the market. Whether prices go up or down, what matters is knowing where to enter, when to exit, and how much risk to take.
A Little Something for Serious Traders!
I've decided to start an exclusive group for those who are serious about trading and want to take their skills to the next level. I'm keeping the fee at just $5/month because I want everyone to have a chance to join, see what I offer, and decide for themselves if it's worth it. You can literally recover your fee in one small trade. Here's what you can expect: 3–4 trade setups every week. Technical analysis on demand. Educational content and trading psychology. Personal guidance on trades, position sizing, and risk management.
🔥 Here's the deal: The first 50 members get to keep the $5/month price for life, as long as they stay subscribed. After the introductory offer, the regular fee will be $50/month. I don't want this to be just another signals group. I want you to understand why we're taking a trade, how to manage it, and when to stay out of the market. If you've been following my analysis and like the way I approach the market, I'd love to have you on board. Only 50 spots at $5/month. Join while they're available! Link here https://app.binance.com/uni-qr/BWo6PppN
#BTC #ETH
2
2
2.3k
·
--
$LTC level has been taken perfectly. You are already up almost 3R if are in this trade. Close half now and add again if it revisit the level.
$LTC level has been taken perfectly. You are already up almost 3R if are in this trade. Close half now and add again if it revisit the level.
XB-Crypto
·
--
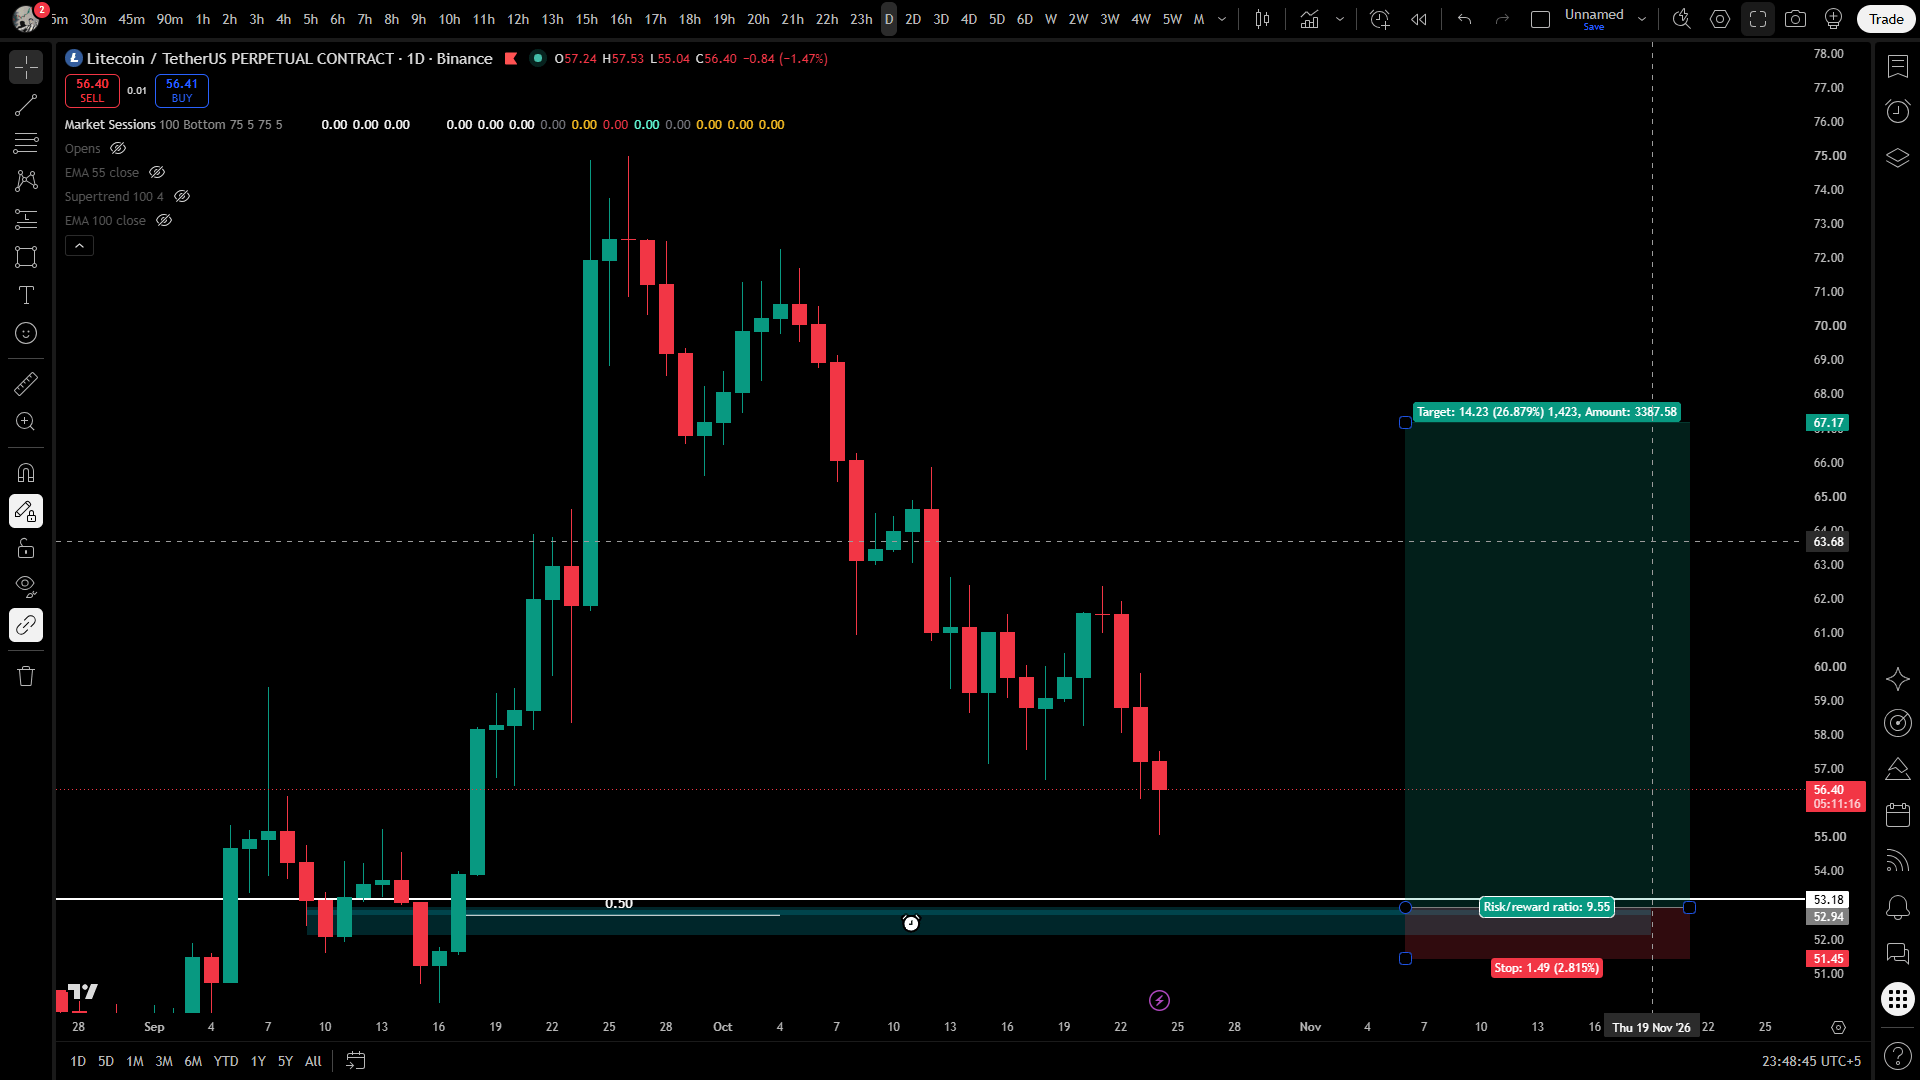
$LTC has a very bullish level around 52$-53$. Reversal from this region is highly probable. I will be looking to enter around 52.88. This $LTC zone is offering a very good r/r of 10. I will buy in spot as well as in Future. Probability is high here.
1
3.2k
·
--
Bearish
$BTC Down, $ETH Down, and the Market Is in the Red! 🔴
Well, just look at the market today!
$BTC , $ETH, and most altcoins are taking a hit. If you've been following my recent posts, you'll remember that I warned about this possibility two days ago.
Since then, I've been sharing potential short setups across multiple coins, and we're now seeing that bearish scenario play out.
I will soon be looking to take bullish setups at my predefined levels. Some have already been shared, and I'll be sharing some more opportunities.
The approach remains simple: Plan, wait, execute, repeat. Always with proper risk management.
For now, enjoy the move down!
#BTC #ETH #altcoins
$BTC Down, $ETH Down, and the Market Is in the Red! 🔴
Well, just look at the market today!
$BTC , $ETH , and most altcoins are taking a hit. If you've been following my recent posts, you'll remember that I warned about this possibility two days ago.
Since then, I've been sharing potential short setups across multiple coins, and we're now seeing that bearish scenario play out.
I will soon be looking to take bullish setups at my predefined levels. Some have already been shared, and I'll be sharing some more opportunities.
The approach remains simple: Plan, wait, execute, repeat. Always with proper risk management.
For now, enjoy the move down!
#BTC #ETH #altcoins
Well, just look at the market today!
$BTC , $ETH , and most altcoins are taking a hit. If you've been following my recent posts, you'll remember that I warned about this possibility two days ago.
Since then, I've been sharing potential short setups across multiple coins, and we're now seeing that bearish scenario play out.
I will soon be looking to take bullish setups at my predefined levels. Some have already been shared, and I'll be sharing some more opportunities.
The approach remains simple: Plan, wait, execute, repeat. Always with proper risk management.
For now, enjoy the move down!
#BTC #ETH #altcoins

290
·
--
Bearish
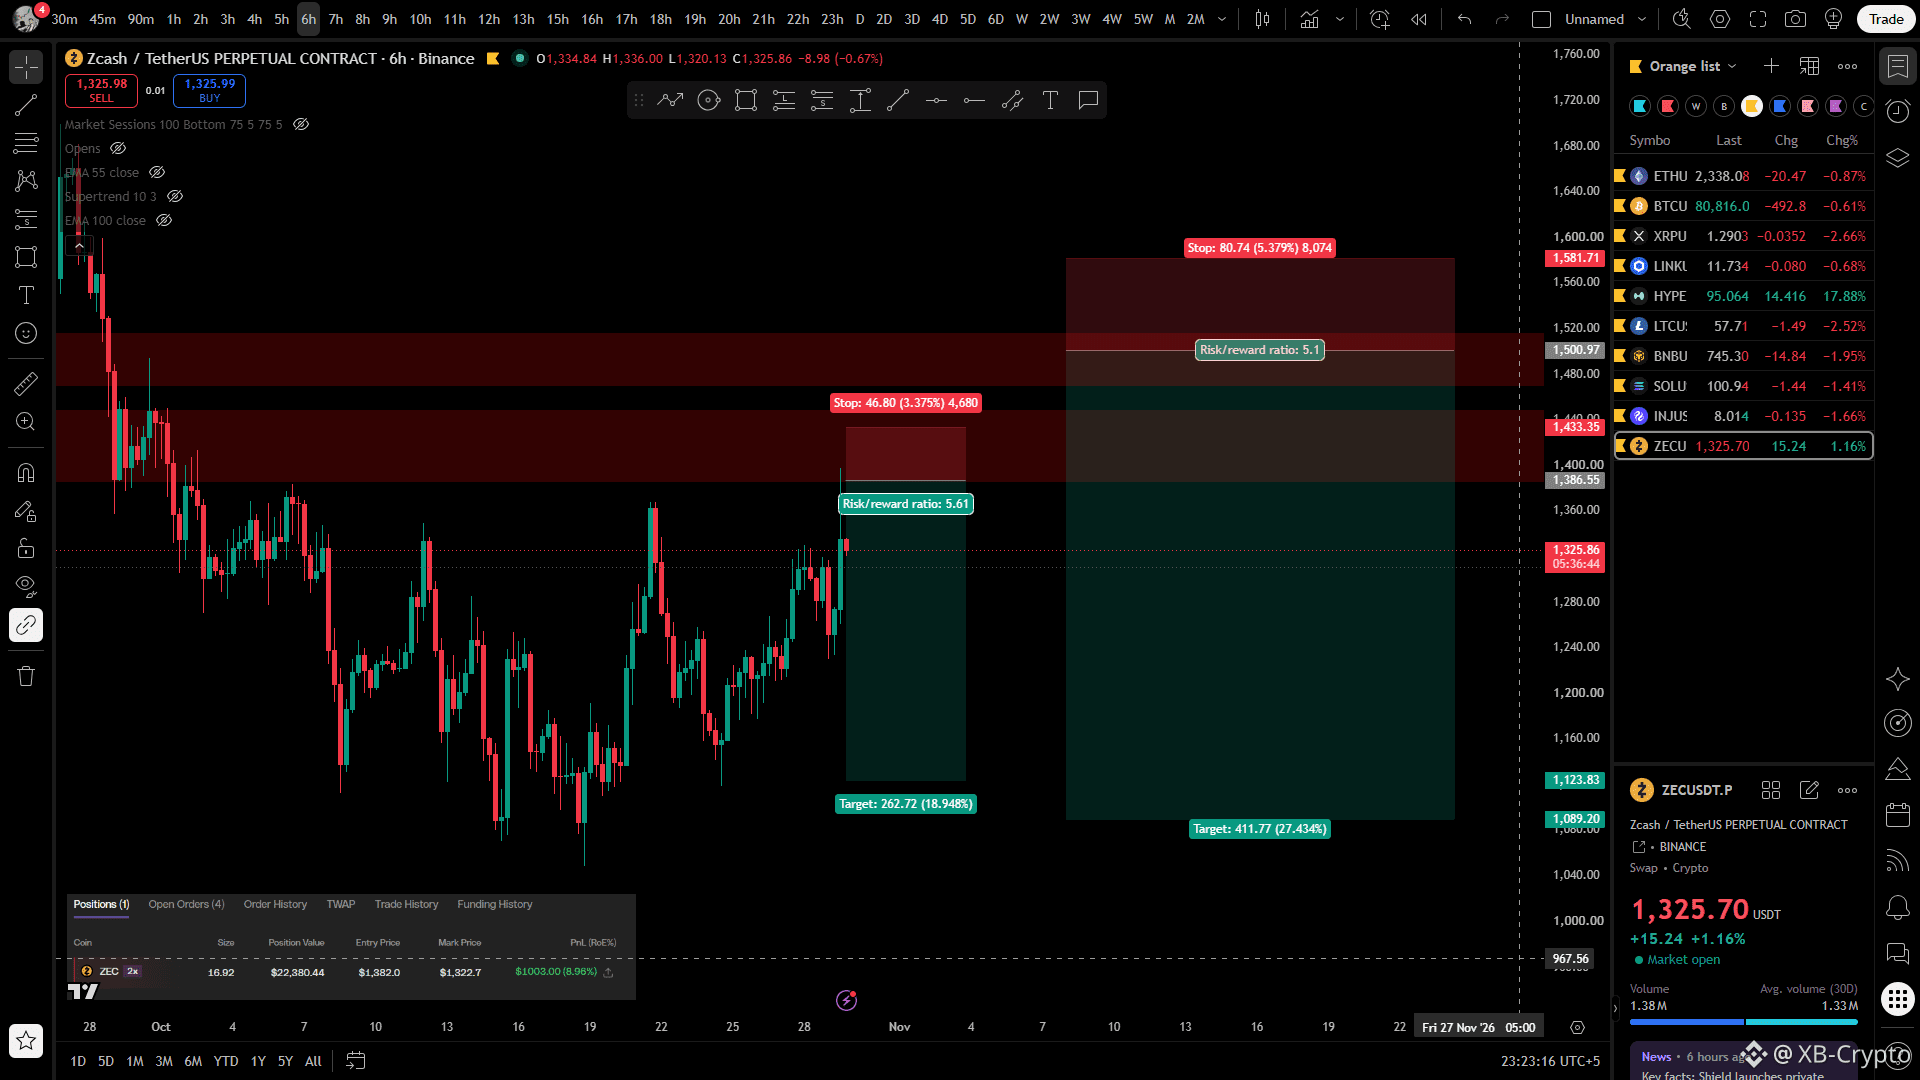
$HYPE Done. $ZEC Paying. More Opportunities Ahead! 💰
I've already shared both my bullish and bearish levels for the most of the coins on my watchlist. Now it's simply a matter of waiting for price to reach them.
Any coin that reaches my planned bearish level is a potential short for me.
Shared $HYPE earlier and mentioned that it has strong bullish momentum so I am shirting with less size which I did and got stopped out.
As for $ZEC, I have two bearish levels marked on my chart. Price reached the first one, I took the short, and it worked nicely. I've already closed 50% of my position in profit, enough to cover my original stop-loss risk.
If ZEC rallies again and reaches my second bearish level, I'll be looking for another short opportunity.
The same approach applies to the rest of my watchlist.
I'm not chasing prices. I already know where I want to do business. Now I'm letting the market come to me.
Let's see which one reaches my level next.
#EarningsSeason #altcoins
$HYPE Done. $ZEC Paying. More Opportunities Ahead! 💰
I've already shared both my bullish and bearish levels for the most of the coins on my watchlist. Now it's simply a matter of waiting for price to reach them.
Any coin that reaches my planned bearish level is a potential short for me.
Shared $HYPE earlier and mentioned that it has strong bullish momentum so I am shirting with less size which I did and got stopped out.
As for $ZEC , I have two bearish levels marked on my chart. Price reached the first one, I took the short, and it worked nicely. I've already closed 50% of my position in profit, enough to cover my original stop-loss risk.
If ZEC rallies again and reaches my second bearish level, I'll be looking for another short opportunity.
The same approach applies to the rest of my watchlist.
I'm not chasing prices. I already know where I want to do business. Now I'm letting the market come to me.
Let's see which one reaches my level next.
#EarningsSeason #altcoins
I've already shared both my bullish and bearish levels for the most of the coins on my watchlist. Now it's simply a matter of waiting for price to reach them.
Any coin that reaches my planned bearish level is a potential short for me.
Shared $HYPE earlier and mentioned that it has strong bullish momentum so I am shirting with less size which I did and got stopped out.
As for $ZEC , I have two bearish levels marked on my chart. Price reached the first one, I took the short, and it worked nicely. I've already closed 50% of my position in profit, enough to cover my original stop-loss risk.
If ZEC rallies again and reaches my second bearish level, I'll be looking for another short opportunity.
The same approach applies to the rest of my watchlist.
I'm not chasing prices. I already know where I want to do business. Now I'm letting the market come to me.
Let's see which one reaches my level next.
#EarningsSeason #altcoins
584
·
--
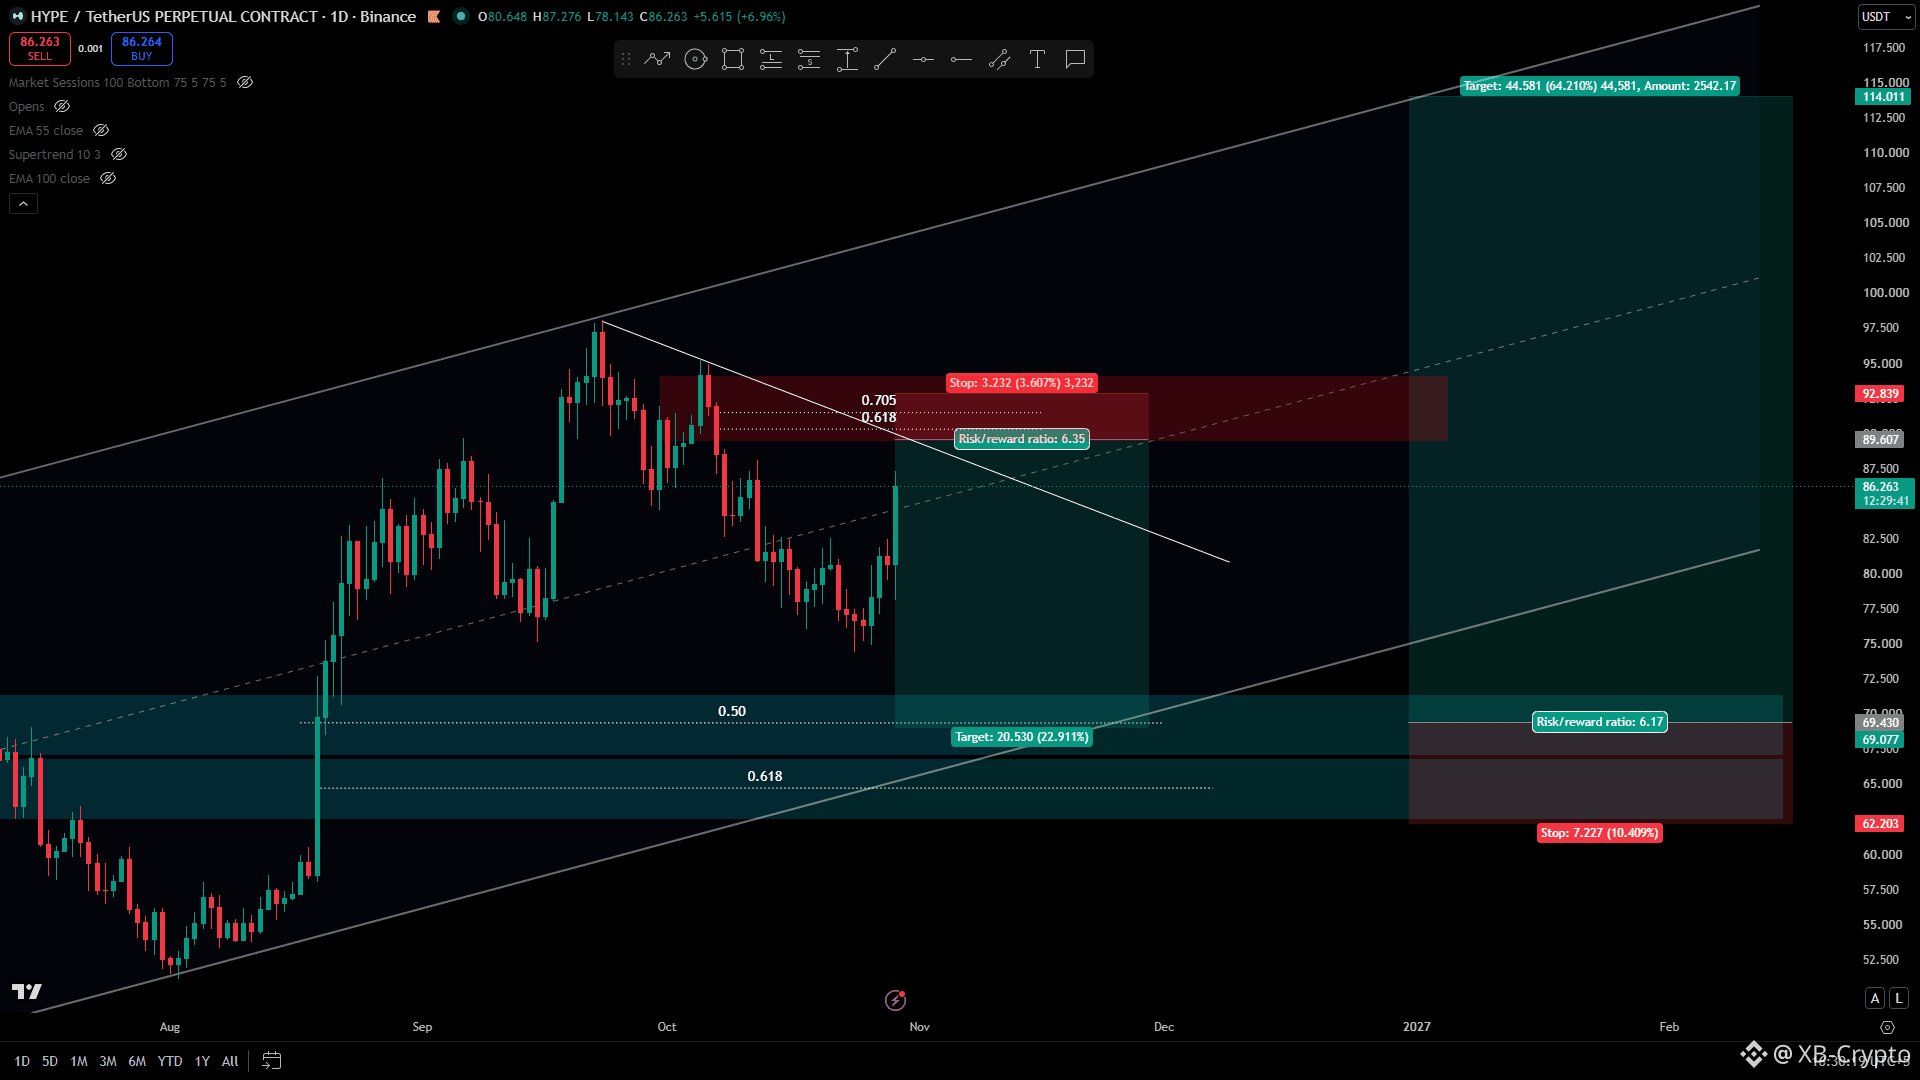
Before $HYPE Makes Its Next Big Move, I Think It Has One More Stop to Make
$HYPE is showing some bullish strength today, but I’m not convinced the downside move is over yet.
There’s a very strong HTF bullish liquidity zone around down, and I believe price could revisit that area before making a significant move higher.
For now, I’m looking for a potential short around the highlighted zone, targeting that lower key area.
I know I could be wrong, especially with today's bullish momentum. That's why I'll be risking less than usual and keeping my position size small.
The bigger picture is bullish for me, but I believe there could be one more opportunity on the short side before the real move begins.
Let's see how the price reacts.
#hype #TechnicalAnalysis
{future}(HYPEUSDT)
Before $HYPE Makes Its Next Big Move, I Think It Has One More Stop to Make
$HYPE is showing some bullish strength today, but I’m not convinced the downside move is over yet.
There’s a very strong HTF bullish liquidity zone around down, and I believe price could revisit that area before making a significant move higher.
For now, I’m looking for a potential short around the highlighted zone, targeting that lower key area.
I know I could be wrong, especially with today's bullish momentum. That's why I'll be risking less than usual and keeping my position size small.
The bigger picture is bullish for me, but I believe there could be one more opportunity on the short side before the real move begins.
Let's see how the price reacts.
#hype #TechnicalAnalysis
$HYPE is showing some bullish strength today, but I’m not convinced the downside move is over yet.
There’s a very strong HTF bullish liquidity zone around down, and I believe price could revisit that area before making a significant move higher.
For now, I’m looking for a potential short around the highlighted zone, targeting that lower key area.
I know I could be wrong, especially with today's bullish momentum. That's why I'll be risking less than usual and keeping my position size small.
The bigger picture is bullish for me, but I believe there could be one more opportunity on the short side before the real move begins.
Let's see how the price reacts.
#hype #TechnicalAnalysis
562
·
--
Bearish
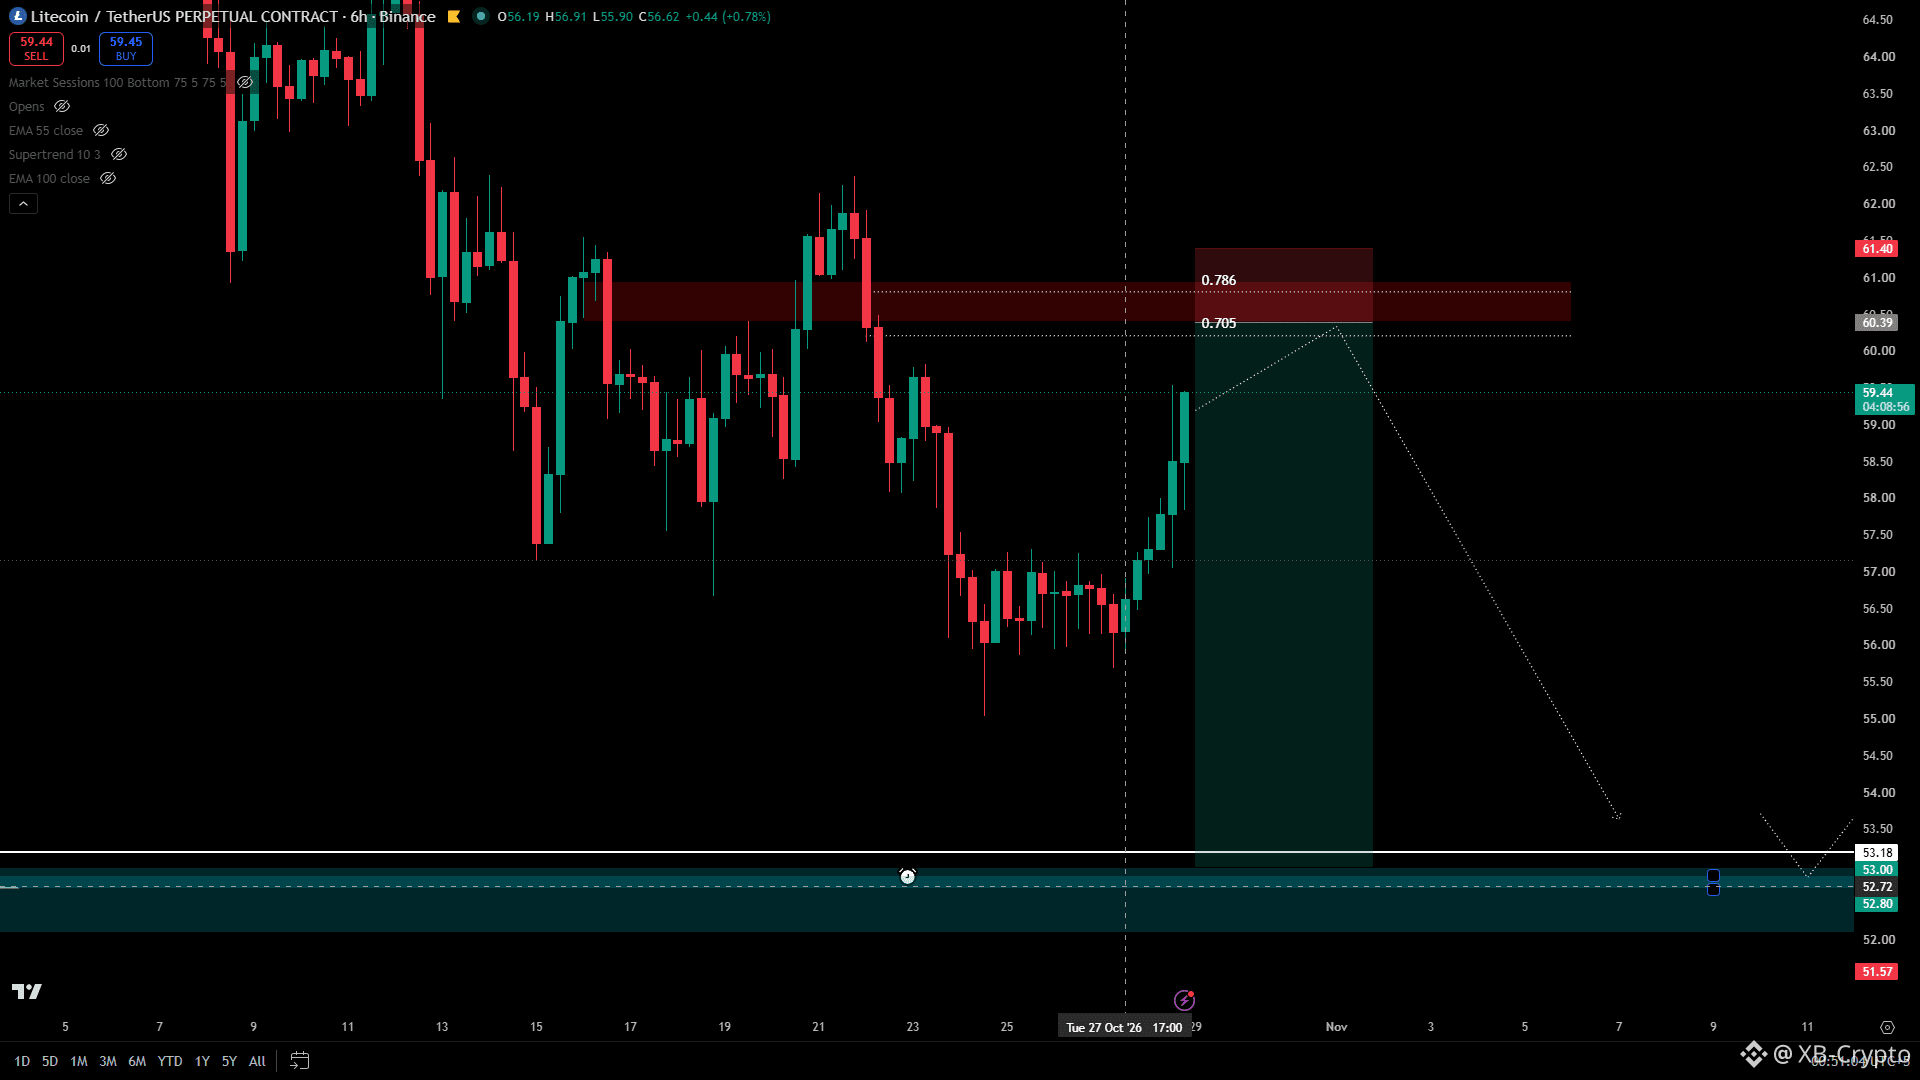
$LTC is almost at my first bearish level, and I'm taking this setup if price gets there.
I fully accept the risk. The R/R is excellent, and this is exactly the kind of opportunity I'm willing to take.
Will it work? I don't know. But I know my risk, my invalidation, and what I'm aiming for.
#altcoins #LTC📈
{future}(LTCUSDT)
$LTC is almost at my first bearish level, and I'm taking this setup if price gets there.
I fully accept the risk. The R/R is excellent, and this is exactly the kind of opportunity I'm willing to take.
Will it work? I don't know. But I know my risk, my invalidation, and what I'm aiming for.
#altcoins #LTC📈
I fully accept the risk. The R/R is excellent, and this is exactly the kind of opportunity I'm willing to take.
Will it work? I don't know. But I know my risk, my invalidation, and what I'm aiming for.
#altcoins #LTC📈
2
501
·
--

Article
$SHIB: The Opportunity Nobody Wants Until It's Too LateEveryone Wants the Pump, But Who's Willing to Buy Before It Happens?
What if $SHIB is setting up for one of those moves everyone wishes they'd caught earlier?
I've been looking at SHIB across the weekly, 3D, 2D, and daily charts, and there's a setup I'm watching closely.
After a brutal downtrend, $SHIB has started showing early signs of a possible reversal. We've already seen a Market Structure Shift (MSS) on the lower timeframes, but the bigger trend hasn't turned bullish yet.
Here's where things get interesting.
I'm watching two demand zones around $0.0000041–$0.0000046 for potential spot accumulation.
Ideally, I'd like to see price revisit these areas, shake out some impatient holders, and then show buyers stepping back in.
Why am I interested?
Because from the lower demand zone, I'm looking at a potential 155% upside move toward $0.0000113.
That doesn't mean the rally is guaranteed. If demand fails, the entire setup needs reassessment.
I'm not buying just because SHIB looks cheap, and I'm certainly not chasing green candles.
I'd rather accumulate when nobody wants it than chase it when everyone starts talking about it.
The real question is whether SHIB gives us one more opportunity at these levels before its next major move.
$#SHIB #shibaInu #memecoin🚀🚀🚀 #altcoins
$SHIB: The Opportunity Nobody Wants Until It's Too Late
Everyone Wants the Pump, But Who's Willing to Buy Before It Happens?
What if $SHIB is setting up for one of those moves everyone wishes they'd caught earlier?
I've been looking at SHIB across the weekly, 3D, 2D, and daily charts, and there's a setup I'm watching closely.
After a brutal downtrend, $SHIB has started showing early signs of a possible reversal. We've already seen a Market Structure Shift (MSS) on the lower timeframes, but the bigger trend hasn't turned bullish yet.
Here's where things get interesting.
I'm watching two demand zones around $0.0000041–$0.0000046 for potential spot accumulation.
Ideally, I'd like to see price revisit these areas, shake out some impatient holders, and then show buyers stepping back in.
Why am I interested?
Because from the lower demand zone, I'm looking at a potential 155% upside move toward $0.0000113.
That doesn't mean the rally is guaranteed. If demand fails, the entire setup needs reassessment.
I'm not buying just because SHIB looks cheap, and I'm certainly not chasing green candles.
I'd rather accumulate when nobody wants it than chase it when everyone starts talking about it.
The real question is whether SHIB gives us one more opportunity at these levels before its next major move.
$#SHIB #shibaInu #memecoin🚀🚀🚀 #altcoins
What if $SHIB is setting up for one of those moves everyone wishes they'd caught earlier?
I've been looking at SHIB across the weekly, 3D, 2D, and daily charts, and there's a setup I'm watching closely.
After a brutal downtrend, $SHIB has started showing early signs of a possible reversal. We've already seen a Market Structure Shift (MSS) on the lower timeframes, but the bigger trend hasn't turned bullish yet.
Here's where things get interesting.
I'm watching two demand zones around $0.0000041–$0.0000046 for potential spot accumulation.
Ideally, I'd like to see price revisit these areas, shake out some impatient holders, and then show buyers stepping back in.
Why am I interested?
Because from the lower demand zone, I'm looking at a potential 155% upside move toward $0.0000113.
That doesn't mean the rally is guaranteed. If demand fails, the entire setup needs reassessment.
I'm not buying just because SHIB looks cheap, and I'm certainly not chasing green candles.
I'd rather accumulate when nobody wants it than chase it when everyone starts talking about it.
The real question is whether SHIB gives us one more opportunity at these levels before its next major move.
$#SHIB #shibaInu #memecoin🚀🚀🚀 #altcoins
1
16
2.9k
·
--
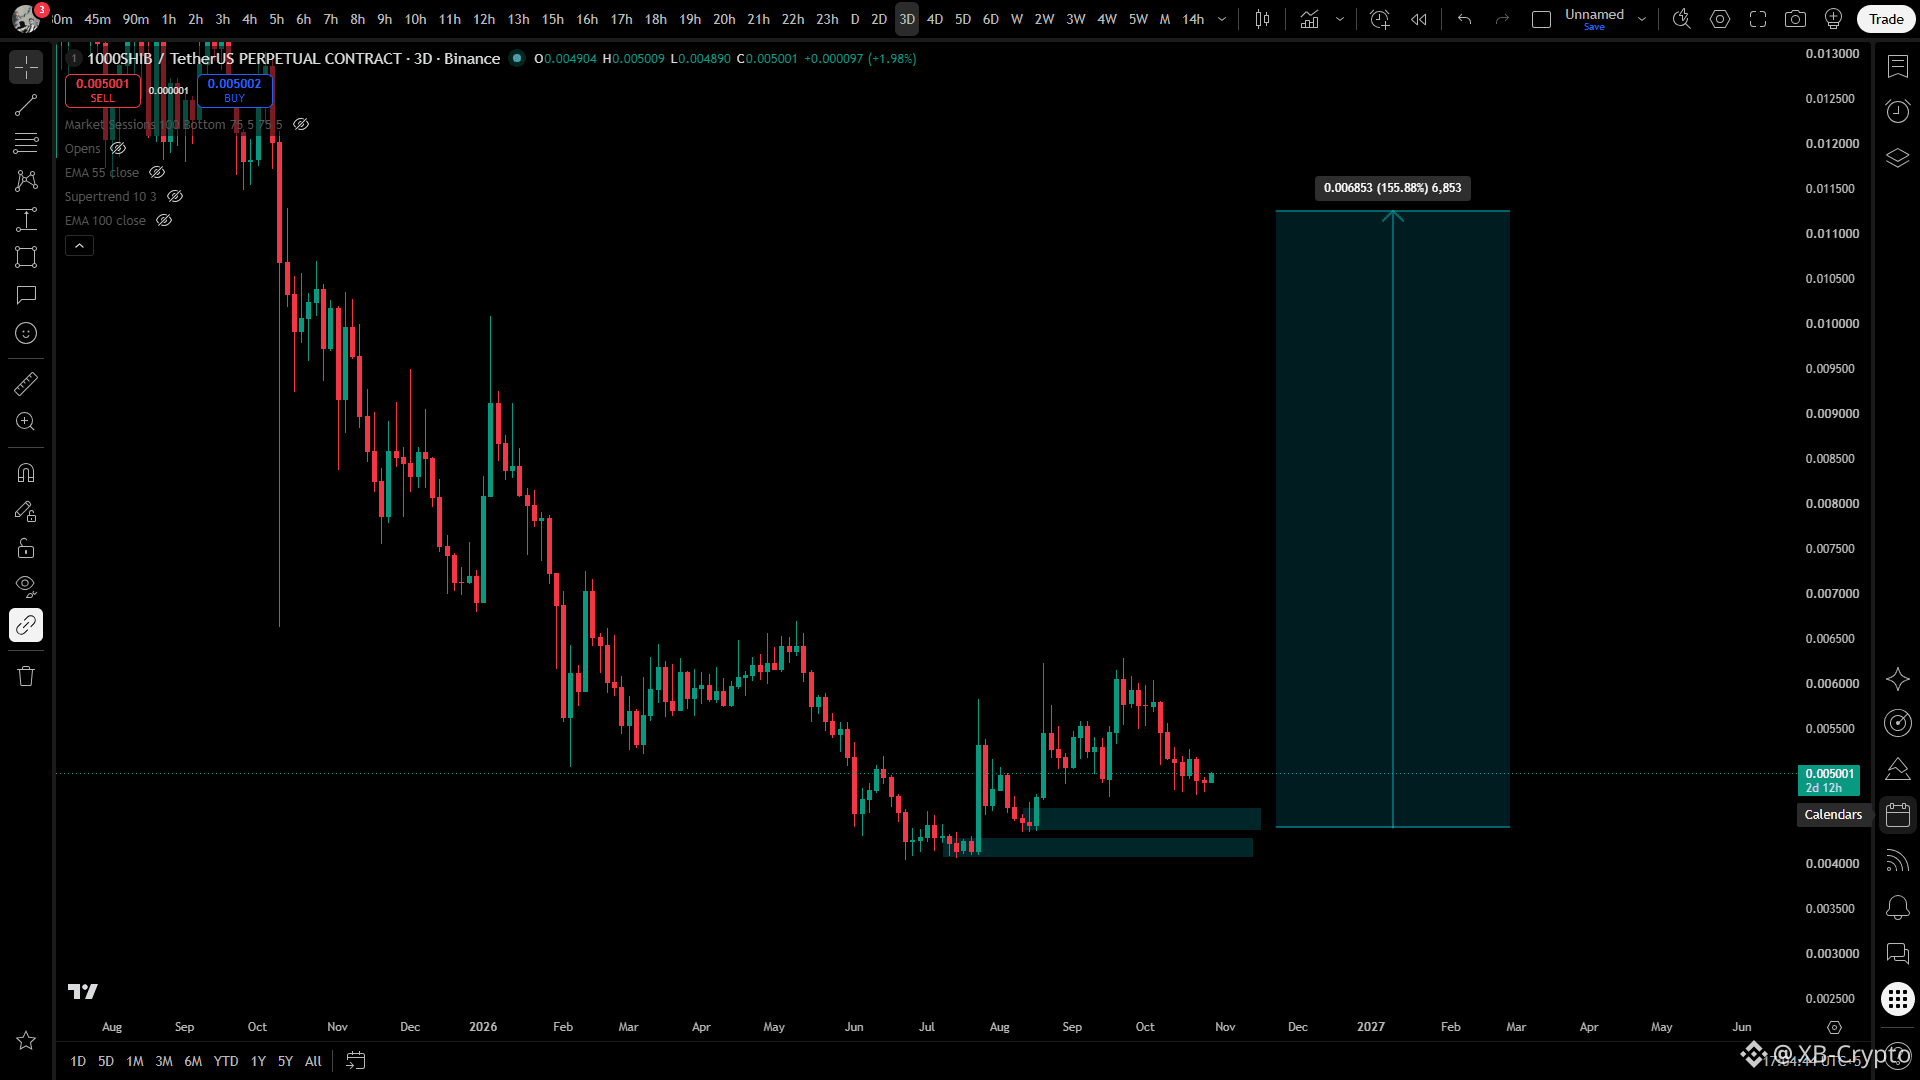
$1000SHIB : What if the next big move starts from down here?
I am watching the highlighted zones for potential spot accumulation before what could be an explosive move.
Not chasing it here. If price gives me those levels, I'll be looking to load up.
$1000SHIB is heavily accumulated down there. Some explosive move might be pending.
#SHIB
{spot}(SHIBUSDT)
$1000SHIB : What if the next big move starts from down here?
I am watching the highlighted zones for potential spot accumulation before what could be an explosive move.
Not chasing it here. If price gives me those levels, I'll be looking to load up.
$1000SHIB is heavily accumulated down there. Some explosive move might be pending.
#SHIB
I am watching the highlighted zones for potential spot accumulation before what could be an explosive move.
Not chasing it here. If price gives me those levels, I'll be looking to load up.
$1000SHIB is heavily accumulated down there. Some explosive move might be pending.
#SHIB
1
831
·
--
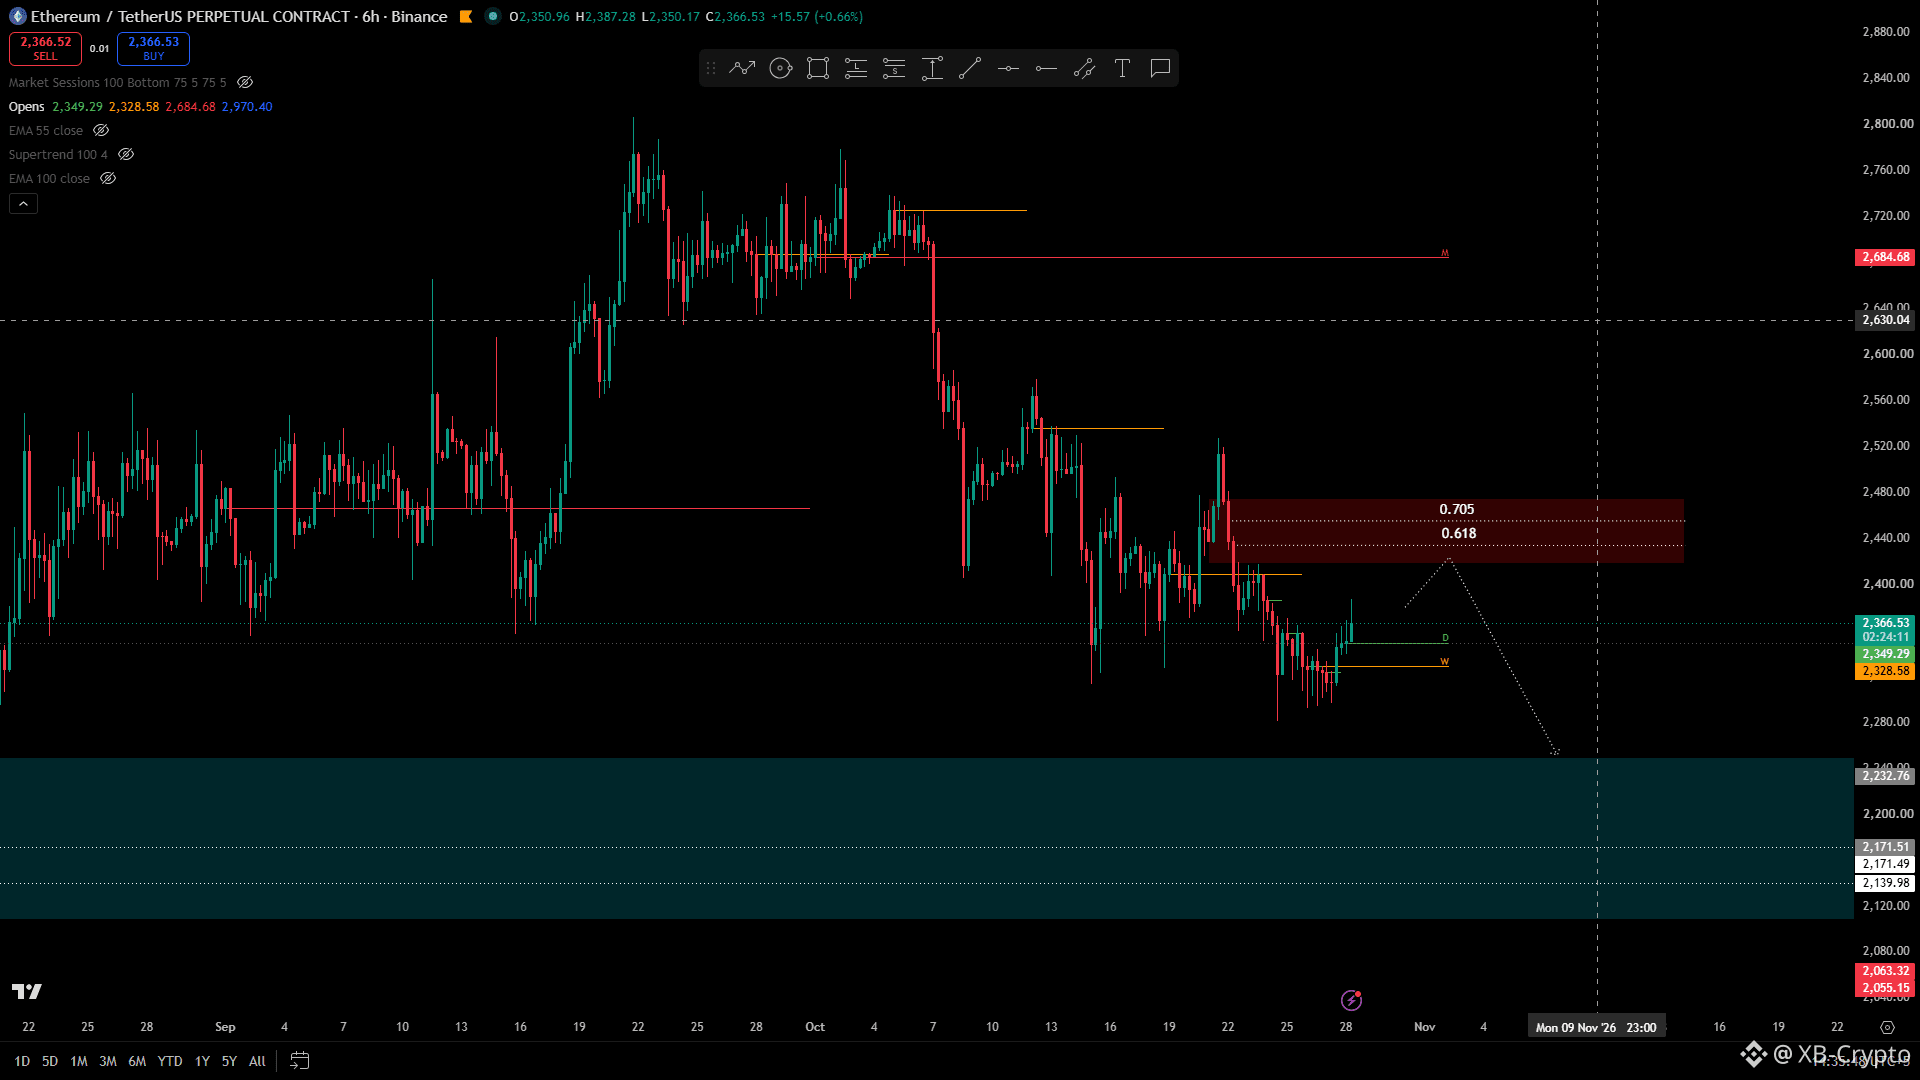
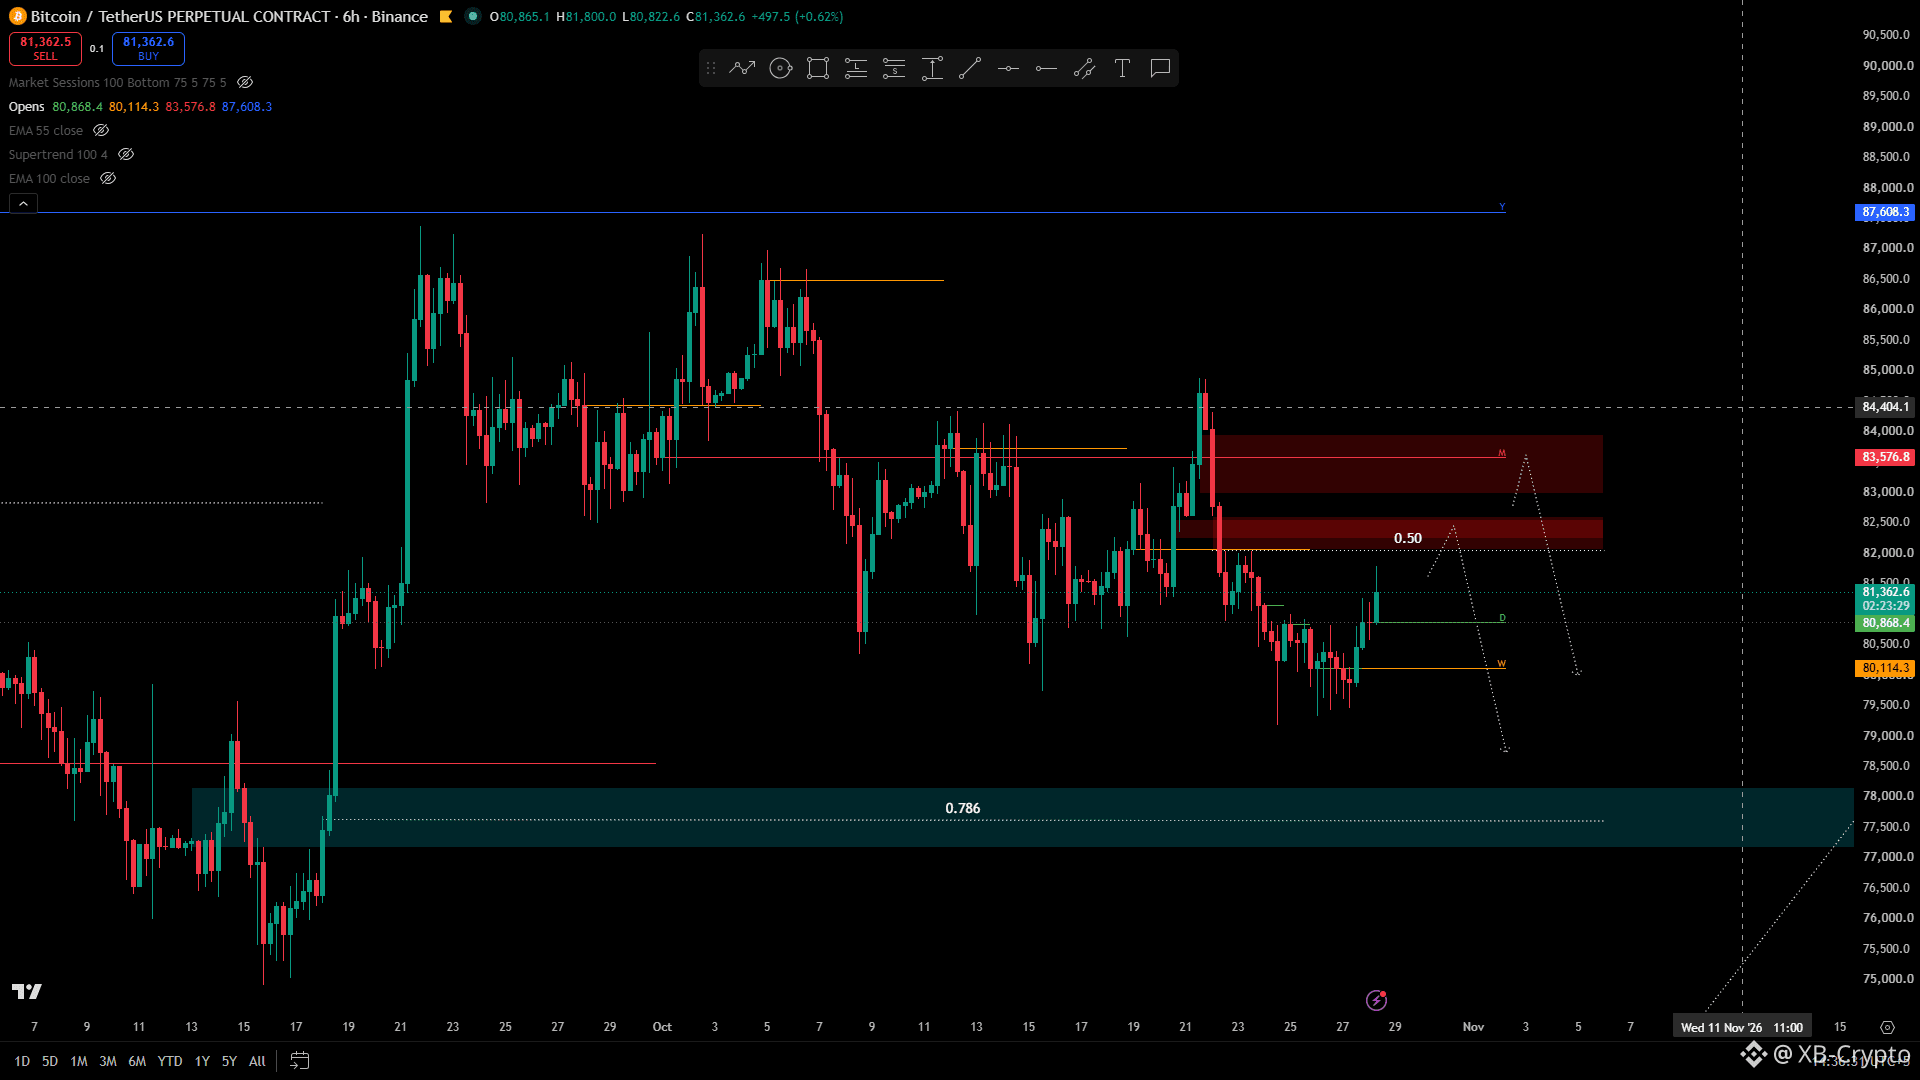
$BTC & $ETH: I’m Not Chasing Longs Here!
I'll be extra careful with my longs if price reaches the highlighted red zones.
Both $BTC and $ETH still have some unfinished business down below, and I wouldn't be surprised to see another leg down before a meaningful recovery.
For now, I'll be watching how price reacts at those red zones. A clear rejection could open the door for another move toward the lower demand areas.
I'm not blindly bearish, but I don't want to get too comfortable with longs just yet.
Patience first. Let price come to my levels.
#BTC走势分析 #ETH
$BTC & $ETH : I’m Not Chasing Longs Here!
I'll be extra careful with my longs if price reaches the highlighted red zones.
Both $BTC and $ETH still have some unfinished business down below, and I wouldn't be surprised to see another leg down before a meaningful recovery.
For now, I'll be watching how price reacts at those red zones. A clear rejection could open the door for another move toward the lower demand areas.
I'm not blindly bearish, but I don't want to get too comfortable with longs just yet.
Patience first. Let price come to my levels.
#BTC走势分析 #ETH
I'll be extra careful with my longs if price reaches the highlighted red zones.
Both $BTC and $ETH still have some unfinished business down below, and I wouldn't be surprised to see another leg down before a meaningful recovery.
For now, I'll be watching how price reacts at those red zones. A clear rejection could open the door for another move toward the lower demand areas.
I'm not blindly bearish, but I don't want to get too comfortable with longs just yet.
Patience first. Let price come to my levels.
#BTC走势分析 #ETH
1
394
·
--
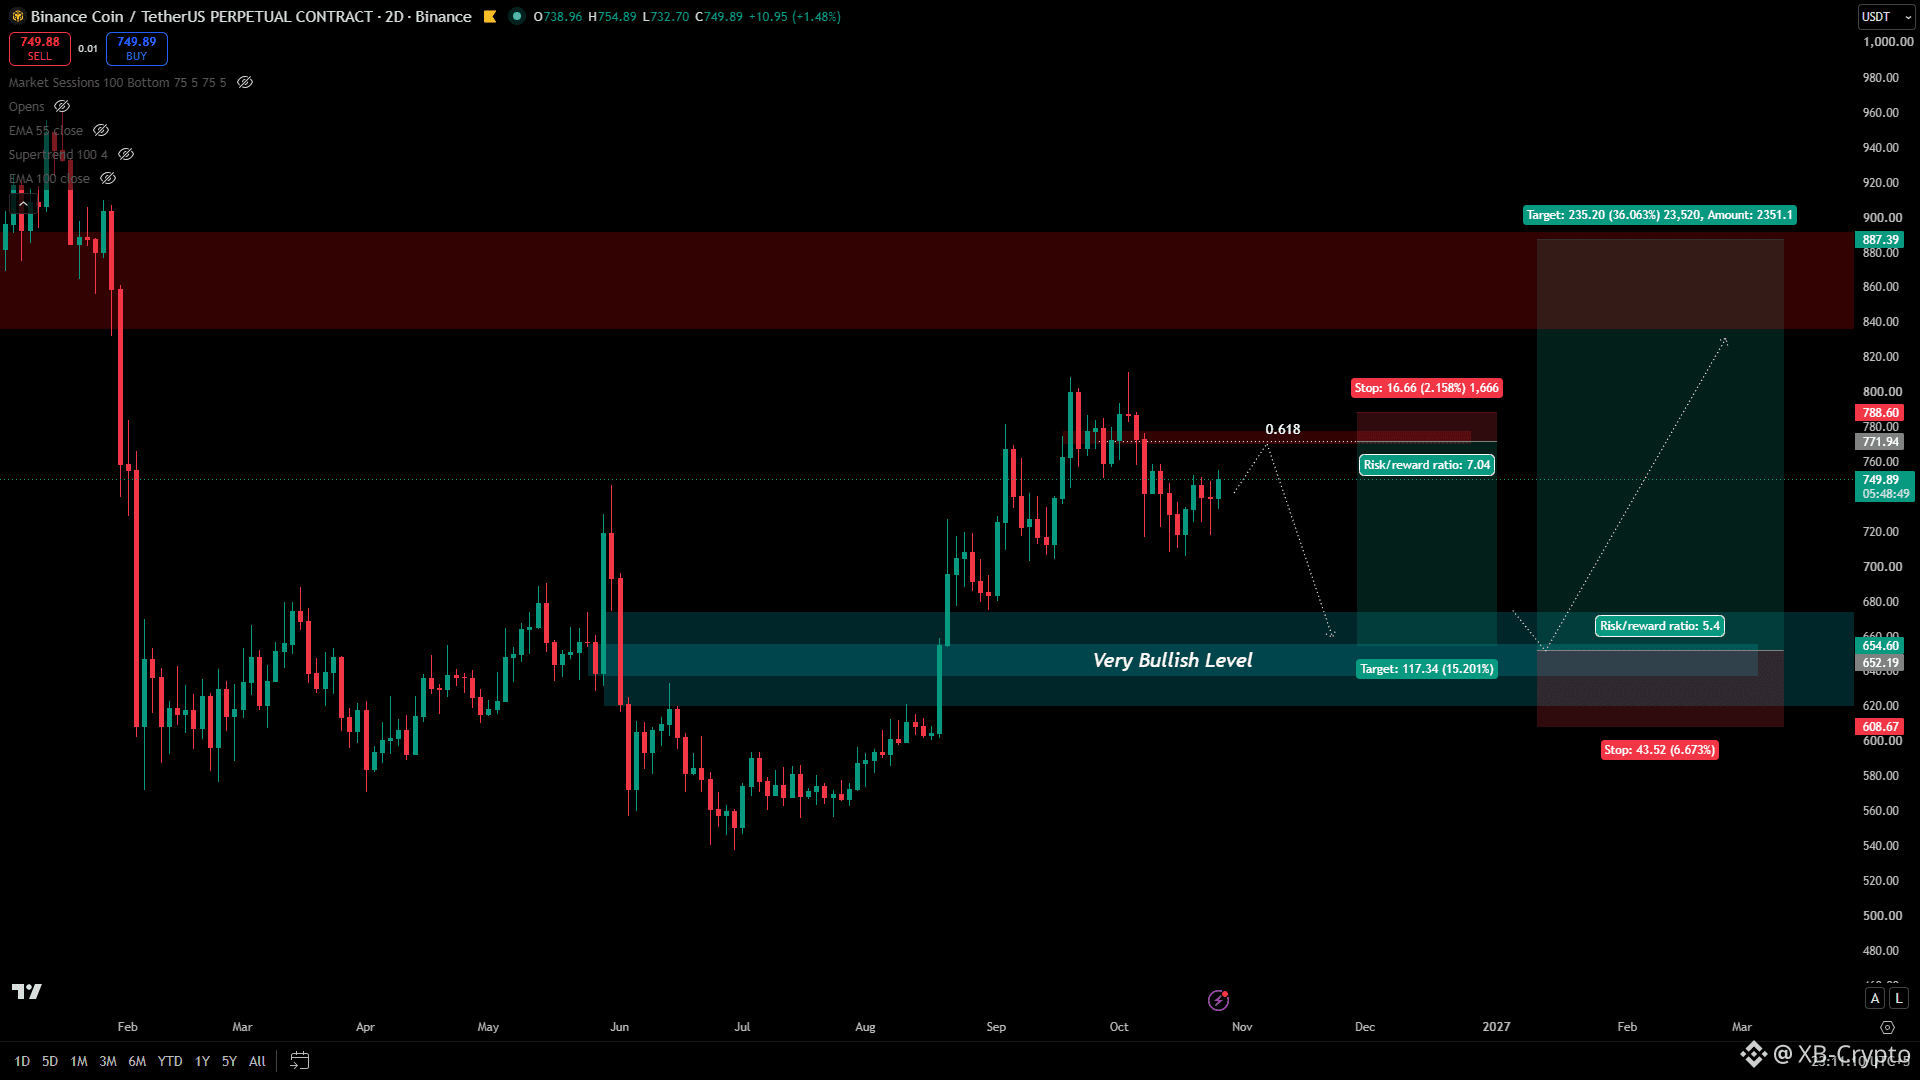
When I look at $BNB on higher timeframes, I’m not just looking for a direction. I’m looking at how price could move from one important zone to another and where the next opportunity might develop.
Right now, I have two scenarios in mind: a potential short first, followed by a long setup if price reaches a major Liquidity zone.
Here’s how I’m looking at it.
First Opportunity: A Potential Short in to the major Liquidity Zone
$BNB is currently trading around $751, below the $772–$779 area, which I’m watching as potential resistance.
This area has a 3D Breaker Block with the 0.618 Fibonacci level, making it an important zone to monitor. If price retraces into this region and shows clear rejection, I’ll consider a short position.
My main target is the $654 area, with the possibility of further downside toward $635–$620.
My short trade plan:
- Entry area: $772–$779, subject to rejection
- Target: $654
- Extended target: $635–$620
- Invalidation: Above $788.60
The idea is to capture a potential pullback rather than assume BNB will continue moving higher without a correction.
Of course, reaching the key area alone isn't enough. I want to see how price behaves there before making a decision.
Second Opportunity: A Potential Long From Major Liquidity Zone
The more interesting part of this chart, in my opinion, is the Liquidity zone between $657 and $655 which is 2D BB behind two FVG’s, inside Monthly BB behind an FVG. This area has the potential for a significant bullish reversal.
My long trade plan:
- Area of interest: $655–$635
- First target: $771–$788
- Extended target: $850–$887
- Invalidation: Below $608.67
The Liquidity zone is where I want to pay attention, but the actual entry will depend on price
I don't need to predict the entire move in advance. I just need to identify the important areas and wait for the market to show its hand.
#BNB_Market_Update #bnb
{future}(BNBUSDT)
When I look at $BNB on higher timeframes, I’m not just looking for a direction. I’m looking at how price could move from one important zone to another and where the next opportunity might develop.
Right now, I have two scenarios in mind: a potential short first, followed by a long setup if price reaches a major Liquidity zone.
Here’s how I’m looking at it.
First Opportunity: A Potential Short in to the major Liquidity Zone
$BNB is currently trading around $751, below the $772–$779 area, which I’m watching as potential resistance.
This area has a 3D Breaker Block with the 0.618 Fibonacci level, making it an important zone to monitor. If price retraces into this region and shows clear rejection, I’ll consider a short position.
My main target is the $654 area, with the possibility of further downside toward $635–$620.
My short trade plan:
- Entry area: $772–$779, subject to rejection
- Target: $654
- Extended target: $635–$620
- Invalidation: Above $788.60
The idea is to capture a potential pullback rather than assume BNB will continue moving higher without a correction.
Of course, reaching the key area alone isn't enough. I want to see how price behaves there before making a decision.
Second Opportunity: A Potential Long From Major Liquidity Zone
The more interesting part of this chart, in my opinion, is the Liquidity zone between $657 and $655 which is 2D BB behind two FVG’s, inside Monthly BB behind an FVG. This area has the potential for a significant bullish reversal.
My long trade plan:
- Area of interest: $655–$635
- First target: $771–$788
- Extended target: $850–$887
- Invalidation: Below $608.67
The Liquidity zone is where I want to pay attention, but the actual entry will depend on price
I don't need to predict the entire move in advance. I just need to identify the important areas and wait for the market to show its hand.
#BNB_Market_Update #bnb
Right now, I have two scenarios in mind: a potential short first, followed by a long setup if price reaches a major Liquidity zone.
Here’s how I’m looking at it.
First Opportunity: A Potential Short in to the major Liquidity Zone
$BNB is currently trading around $751, below the $772–$779 area, which I’m watching as potential resistance.
This area has a 3D Breaker Block with the 0.618 Fibonacci level, making it an important zone to monitor. If price retraces into this region and shows clear rejection, I’ll consider a short position.
My main target is the $654 area, with the possibility of further downside toward $635–$620.
My short trade plan:
- Entry area: $772–$779, subject to rejection
- Target: $654
- Extended target: $635–$620
- Invalidation: Above $788.60
The idea is to capture a potential pullback rather than assume BNB will continue moving higher without a correction.
Of course, reaching the key area alone isn't enough. I want to see how price behaves there before making a decision.
Second Opportunity: A Potential Long From Major Liquidity Zone
The more interesting part of this chart, in my opinion, is the Liquidity zone between $657 and $655 which is 2D BB behind two FVG’s, inside Monthly BB behind an FVG. This area has the potential for a significant bullish reversal.
My long trade plan:
- Area of interest: $655–$635
- First target: $771–$788
- Extended target: $850–$887
- Invalidation: Below $608.67
The Liquidity zone is where I want to pay attention, but the actual entry will depend on price
I don't need to predict the entire move in advance. I just need to identify the important areas and wait for the market to show its hand.
#BNB_Market_Update #bnb
1
224
·
--
Article
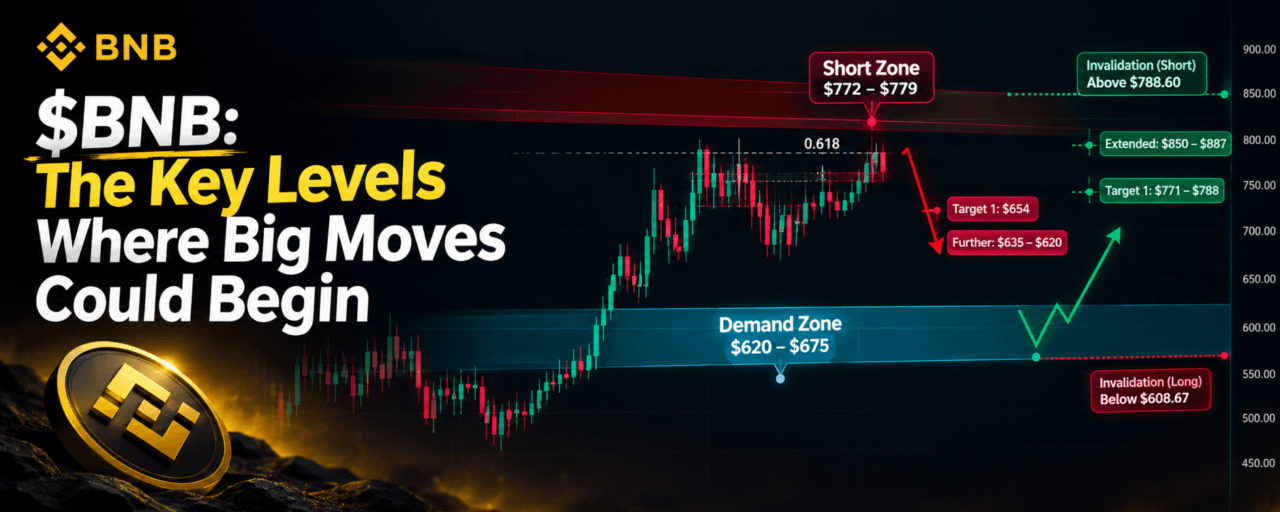
$BNB: The Levels That Could Trigger the Next Big MoveWhen I look at $BNB on higher timeframes, I’m not just looking for a direction. I’m looking at how price could move from one important zone to another and where the next opportunity might develop.
Right now, I have two scenarios in mind: a potential short first, followed by a long setup if price reaches a major Liquidity zone.
Here’s how I’m looking at it. First Opportunity: A Potential Short in to the major Liquidity Zone
$BNB is currently trading around $751, below the $772–$779 area, which I’m watching as potential resistance. This area has a 3D Breaker Block with the 0.618 Fibonacci level, making it an important zone to monitor. If price retraces into this region and shows clear rejection, I’ll consider a short position. My main target is the $654 area, with the possibility of further downside toward $635–$620. My short trade plan:
Entry area: $772–$779, subject to rejectionTarget: $654Extended target: $635–$620Invalidation: Above $788.60
The idea is to capture a potential pullback rather than assume BNB will continue moving higher without a correction.
Of course, reaching the key area alone isn't enough. I want to see how price behaves there before making a decision.
Second Opportunity: A Potential Long From Major Liquidity Zone
The more interesting part of this chart, in my opinion, is the Liquidity zone between $657 and $655 which is 2D BB behind two FVG’s, inside Monthly BB behind an FVG. This area has the potential for a significant bullish reversal. My long trade plan:
Area of interest: $655–$635First target: $771–$788Extended target: $850–$887Invalidation: Below $608.67
The Liquidity zone is where I want to pay attention, but the actual entry will depend on price I don't need to predict the entire move in advance. I just need to identify the important areas and wait for the market to show its hand. If $BNB rejects the resistance area, the short could offer an opportunity to capture a move toward demand. Once price reaches that zone, I can reassess the structure and look for a possible long. That doesn't mean the short must happen before the long. The market can always take a different path, and either setup could fail to develop. The key is to remain flexible and respond to what price actually does. For now, I'm watching $772–$779 for a possible short and $655–$635 for a potential long. No chasing, no forcing trades, and no assuming that a level will hold just because it looks good on the chart. I'll let price come to the areas that matter and wait for confirmation before taking action. Good trading isn't about catching every move. It's about being prepared when the right opportunity comes. Good Luck!!!
{future}(BNBUSDT)
#bnb #BNB_Market_Update
$BNB: The Levels That Could Trigger the Next Big Move
When I look at $BNB on higher timeframes, I’m not just looking for a direction. I’m looking at how price could move from one important zone to another and where the next opportunity might develop.
Right now, I have two scenarios in mind: a potential short first, followed by a long setup if price reaches a major Liquidity zone.
Here’s how I’m looking at it. First Opportunity: A Potential Short in to the major Liquidity Zone
$BNB is currently trading around $751, below the $772–$779 area, which I’m watching as potential resistance. This area has a 3D Breaker Block with the 0.618 Fibonacci level, making it an important zone to monitor. If price retraces into this region and shows clear rejection, I’ll consider a short position. My main target is the $654 area, with the possibility of further downside toward $635–$620. My short trade plan:
Entry area: $772–$779, subject to rejectionTarget: $654Extended target: $635–$620Invalidation: Above $788.60
The idea is to capture a potential pullback rather than assume BNB will continue moving higher without a correction.
Of course, reaching the key area alone isn't enough. I want to see how price behaves there before making a decision.
Second Opportunity: A Potential Long From Major Liquidity Zone
The more interesting part of this chart, in my opinion, is the Liquidity zone between $657 and $655 which is 2D BB behind two FVG’s, inside Monthly BB behind an FVG. This area has the potential for a significant bullish reversal. My long trade plan:
Area of interest: $655–$635First target: $771–$788Extended target: $850–$887Invalidation: Below $608.67
The Liquidity zone is where I want to pay attention, but the actual entry will depend on price I don't need to predict the entire move in advance. I just need to identify the important areas and wait for the market to show its hand. If $BNB rejects the resistance area, the short could offer an opportunity to capture a move toward demand. Once price reaches that zone, I can reassess the structure and look for a possible long. That doesn't mean the short must happen before the long. The market can always take a different path, and either setup could fail to develop. The key is to remain flexible and respond to what price actually does. For now, I'm watching $772–$779 for a possible short and $655–$635 for a potential long. No chasing, no forcing trades, and no assuming that a level will hold just because it looks good on the chart. I'll let price come to the areas that matter and wait for confirmation before taking action. Good trading isn't about catching every move. It's about being prepared when the right opportunity comes. Good Luck!!!
#bnb #BNB_Market_Update
Right now, I have two scenarios in mind: a potential short first, followed by a long setup if price reaches a major Liquidity zone.
Here’s how I’m looking at it. First Opportunity: A Potential Short in to the major Liquidity Zone
$BNB is currently trading around $751, below the $772–$779 area, which I’m watching as potential resistance. This area has a 3D Breaker Block with the 0.618 Fibonacci level, making it an important zone to monitor. If price retraces into this region and shows clear rejection, I’ll consider a short position. My main target is the $654 area, with the possibility of further downside toward $635–$620. My short trade plan:
Entry area: $772–$779, subject to rejectionTarget: $654Extended target: $635–$620Invalidation: Above $788.60
The idea is to capture a potential pullback rather than assume BNB will continue moving higher without a correction.
Of course, reaching the key area alone isn't enough. I want to see how price behaves there before making a decision.
Second Opportunity: A Potential Long From Major Liquidity Zone
The more interesting part of this chart, in my opinion, is the Liquidity zone between $657 and $655 which is 2D BB behind two FVG’s, inside Monthly BB behind an FVG. This area has the potential for a significant bullish reversal. My long trade plan:
Area of interest: $655–$635First target: $771–$788Extended target: $850–$887Invalidation: Below $608.67
The Liquidity zone is where I want to pay attention, but the actual entry will depend on price I don't need to predict the entire move in advance. I just need to identify the important areas and wait for the market to show its hand. If $BNB rejects the resistance area, the short could offer an opportunity to capture a move toward demand. Once price reaches that zone, I can reassess the structure and look for a possible long. That doesn't mean the short must happen before the long. The market can always take a different path, and either setup could fail to develop. The key is to remain flexible and respond to what price actually does. For now, I'm watching $772–$779 for a possible short and $655–$635 for a potential long. No chasing, no forcing trades, and no assuming that a level will hold just because it looks good on the chart. I'll let price come to the areas that matter and wait for confirmation before taking action. Good trading isn't about catching every move. It's about being prepared when the right opportunity comes. Good Luck!!!
#bnb #BNB_Market_Update
1
460
·
--
Bullish
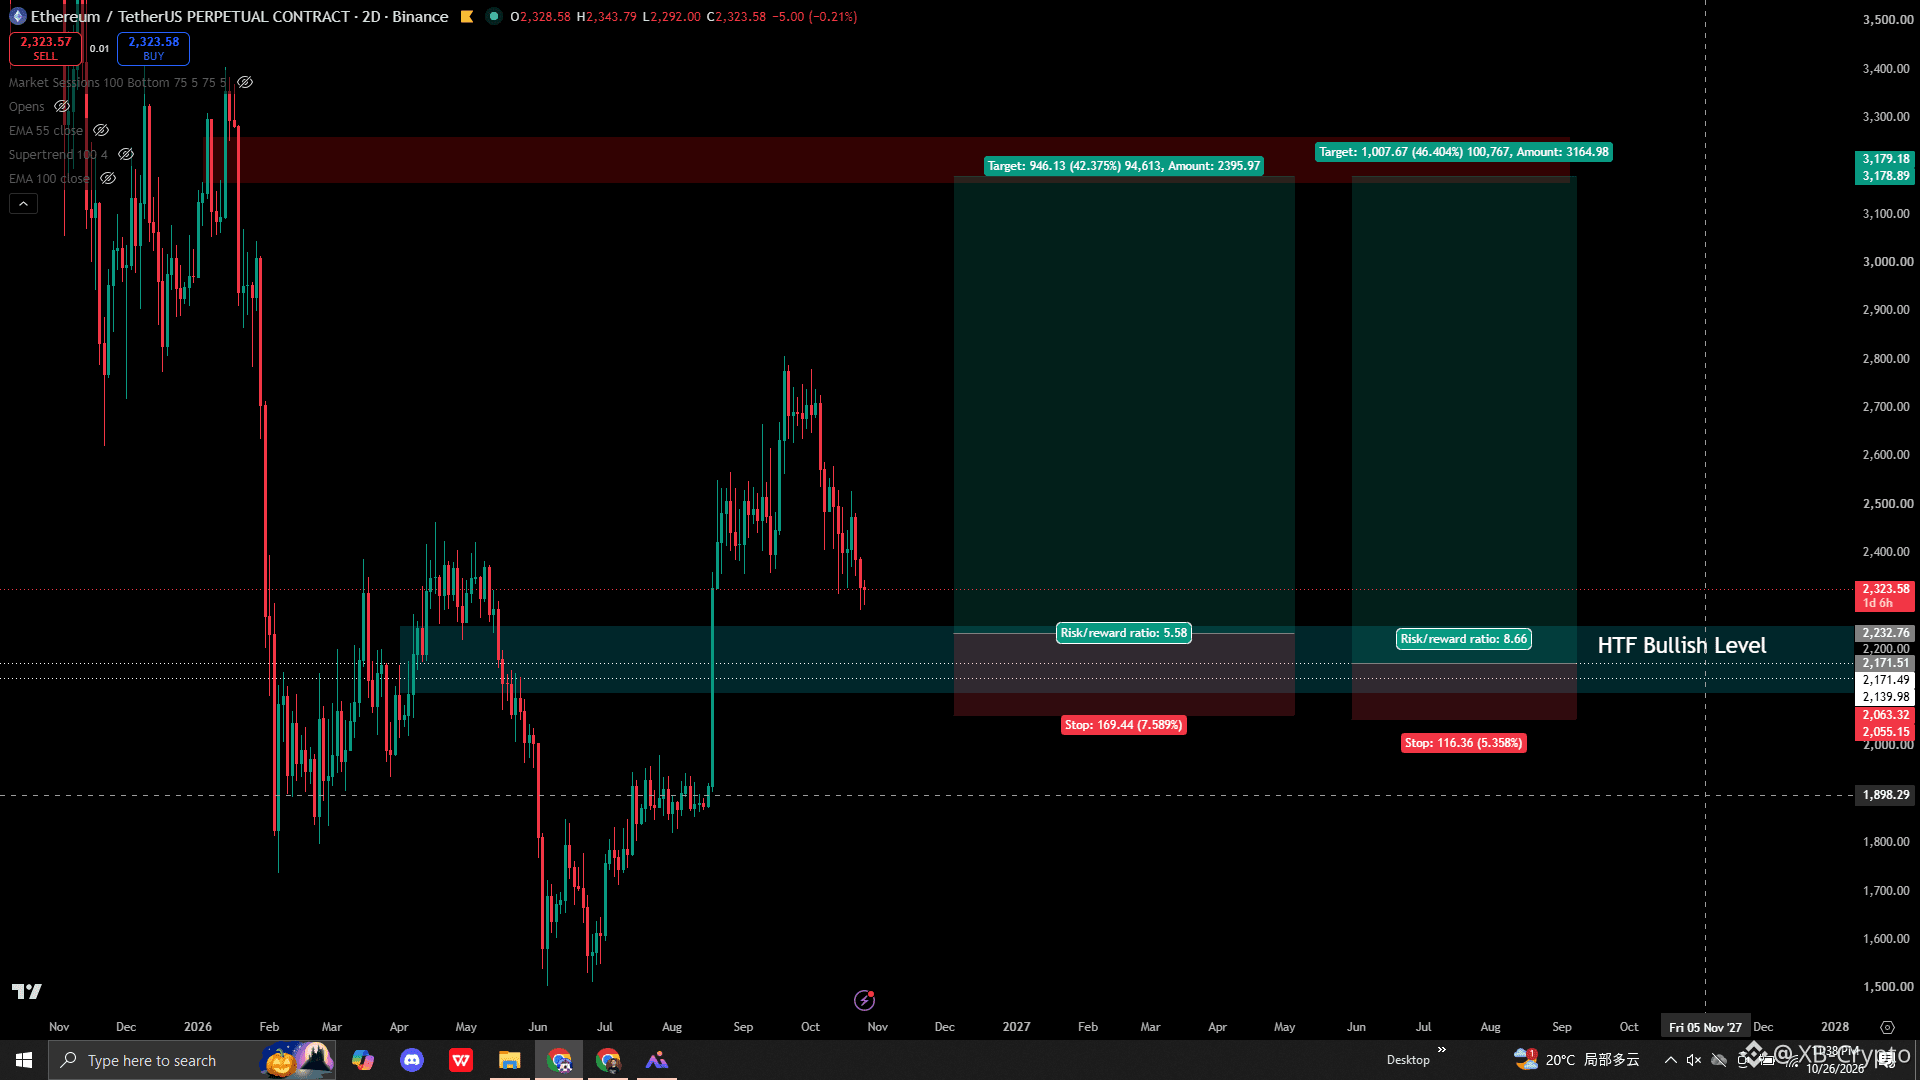
$ETH Swing Trade setup: I have shared this level in live yesterday but I am writing about it in detail here. We have a very bullish level highlighted in blue with clear target highlighted in red. This zone is very powerful that can initiate a bullish reversal, keep in mind nothing is certain, only the probability is high there.
I will take this trade both in spot and in future. For the spot the pre planned entry is around 2,230$ with stoploss around 2,066$ and Target is 3,180. In future I will be interested in entering around2,171 with same SL and TP as above.
Also keep eye on some other coins that has clear HTF bullish levels like $LTC , $Hype, $BNB , $SOL. I have shared the HYPE and LTC setups already and will share the rest soon.
#BinancePick #EarningsSeason
$ETH Swing Trade setup: I have shared this level in live yesterday but I am writing about it in detail here. We have a very bullish level highlighted in blue with clear target highlighted in red. This zone is very powerful that can initiate a bullish reversal, keep in mind nothing is certain, only the probability is high there.
I will take this trade both in spot and in future. For the spot the pre planned entry is around 2,230$ with stoploss around 2,066$ and Target is 3,180. In future I will be interested in entering around2,171 with same SL and TP as above.
Also keep eye on some other coins that has clear HTF bullish levels like $LTC , $Hype, $BNB , $SOL. I have shared the HYPE and LTC setups already and will share the rest soon.
#BinancePick #EarningsSeason
I will take this trade both in spot and in future. For the spot the pre planned entry is around 2,230$ with stoploss around 2,066$ and Target is 3,180. In future I will be interested in entering around2,171 with same SL and TP as above.
Also keep eye on some other coins that has clear HTF bullish levels like $LTC , $Hype, $BNB , $SOL. I have shared the HYPE and LTC setups already and will share the rest soon.
#BinancePick #EarningsSeason
247
·
--
$HYPE Technical Analysis
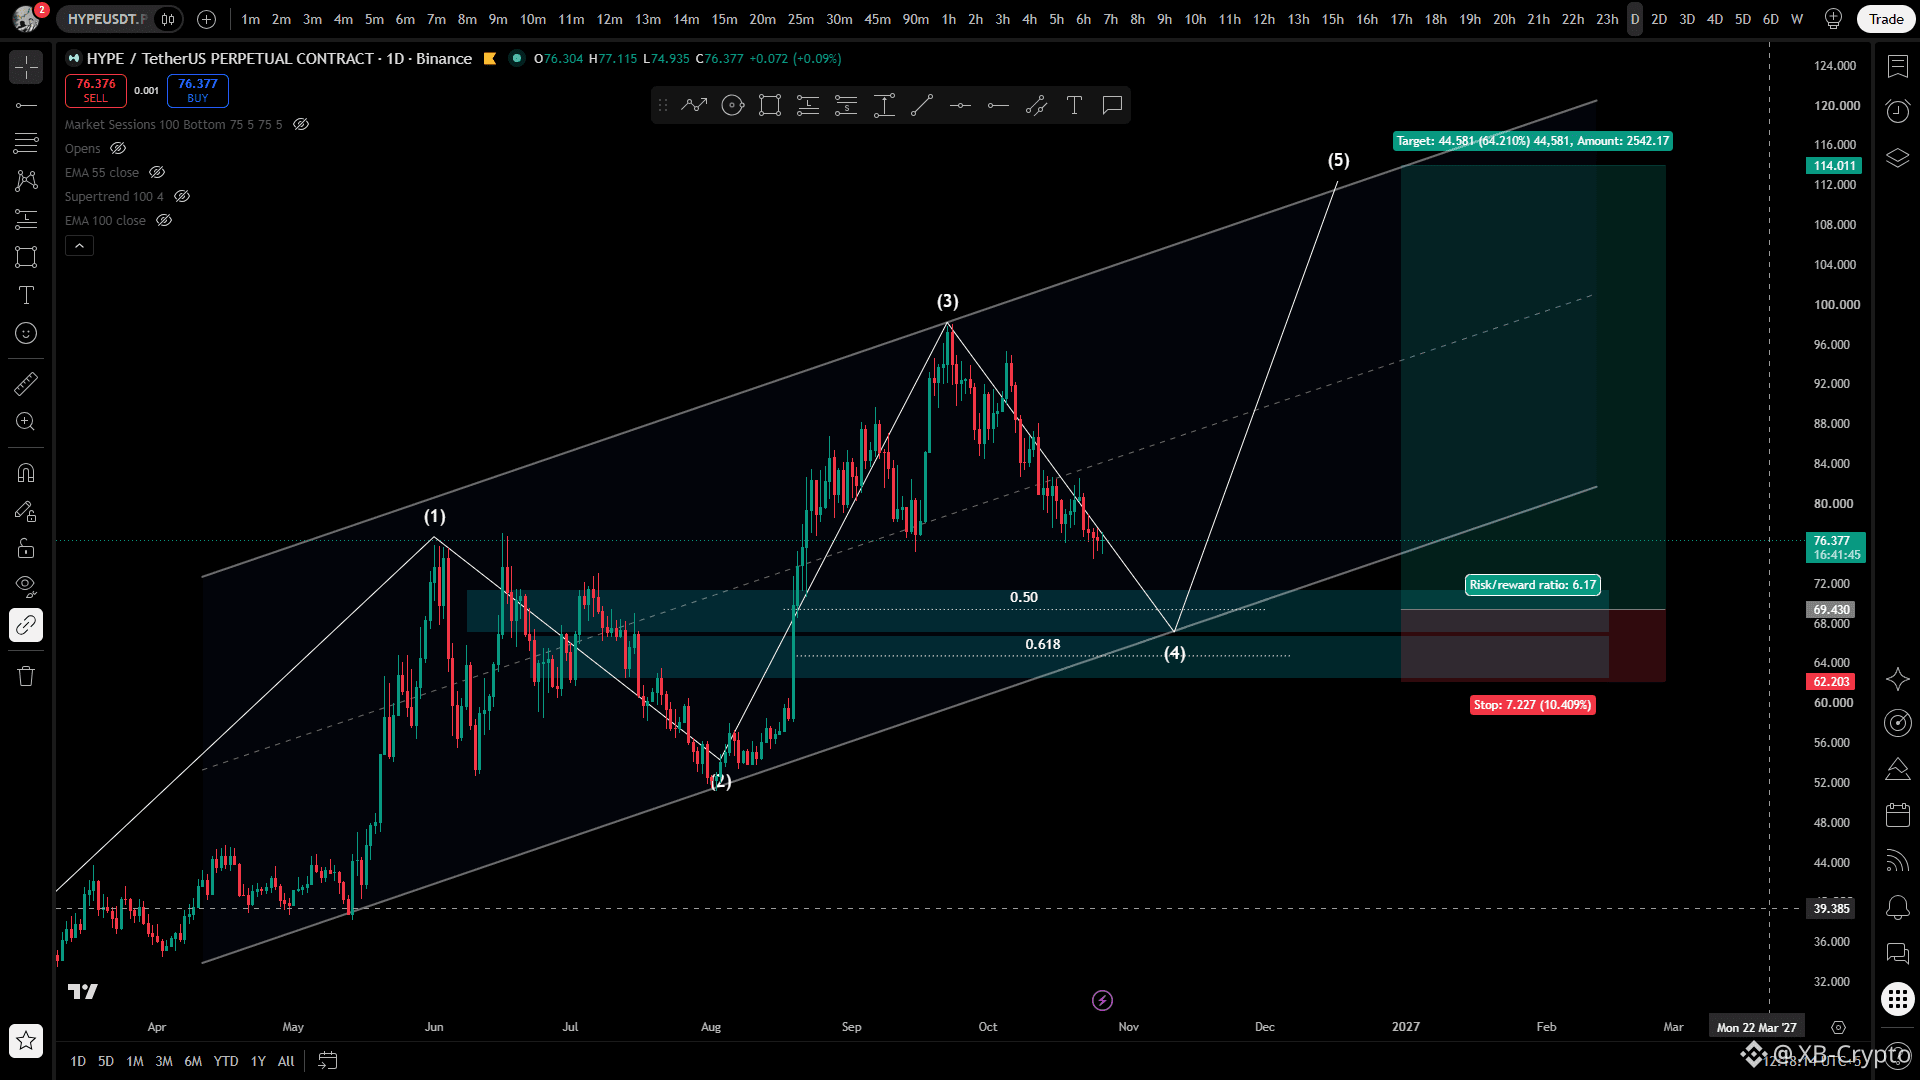
Keep a close eye on the highlighted region. This HTF level could act as a key reversal zone, potentially triggering the next bullish wave for $HYPE.
If $BTC drops toward the 77K–78K key support zone, there is a strong possibility that $HYPE will revisit this region before making its next move higher.
#EarningsSeason
{future}(BTCUSDT)
{future}(HYPEUSDT)
$HYPE Technical Analysis
Keep a close eye on the highlighted region. This HTF level could act as a key reversal zone, potentially triggering the next bullish wave for $HYPE .
If $BTC drops toward the 77K–78K key support zone, there is a strong possibility that $HYPE will revisit this region before making its next move higher.
#EarningsSeason
Keep a close eye on the highlighted region. This HTF level could act as a key reversal zone, potentially triggering the next bullish wave for $HYPE .
If $BTC drops toward the 77K–78K key support zone, there is a strong possibility that $HYPE will revisit this region before making its next move higher.
#EarningsSeason
214
Log in to explore more content
Join global crypto users on Binance Square
⚡️ Get latest and useful information about crypto.
💬 Trusted by the world’s largest crypto exchange.
👍 Discover real insights from verified creators.
Email / Phone number
Trending Topics
BinanceRestores28FiatWithdrawals
3,259 views
119 Discussing
Binance Restores Fiat Withdrawals for USD, AED and Three Asian Currencies, Bringing the Total to 28
Binance News
·7 Likes
·2.3k views
BinanceProcesses$4.65BWithdrawals
61,705 views
270 Discussing
ETHFalls16.1%InOctober
0 views
0 Discussing