
彼得兔TWO
2.4k Posts

彼得兔TWO
Report
Block User
深耕合约交易,btc持有者, 独立交易员.美股.加密.贵金属交易.江恩理论
Frequent Trader
1.2 Years
75 Following
1.0K+ Followers
2.2K+ Liked
Posts
All
Quotes
Videos
Live
PINNED
·
--
Everyone can add friends by entering in the search box:
Input > Chat Room > Copy ID: 1129067177
Steps to add friends 🎈 see images 1, 2, 3
Let's not get separated, okay? I will accompany you on this path of Binance.
#加密市场观察
Everyone can add friends by entering in the search box:
Input > Chat Room > Copy ID: 1129067177
Steps to add friends 🎈 see images 1, 2, 3
Let's not get separated, okay? I will accompany you on this path of Binance.
#加密市场观察
Input > Chat Room > Copy ID: 1129067177
Steps to add friends 🎈 see images 1, 2, 3
Let's not get separated, okay? I will accompany you on this path of Binance.
#加密市场观察




1
1
2
263
·
--
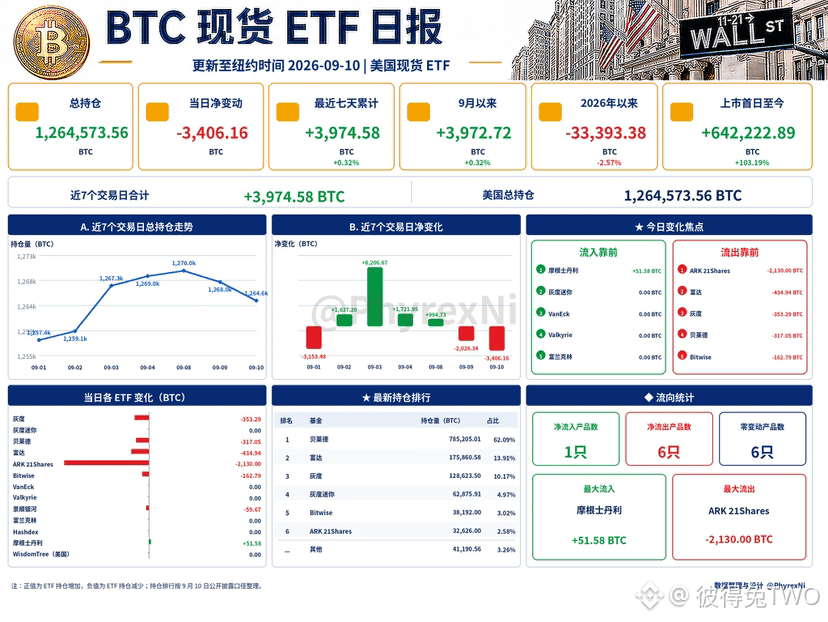
On September 10, $BTC spot ETF total holdings fell to 1,264,573.56 BTC. Net holdings decreased by 3,406.16 BTC on the day, marking the second consecutive effective trading day of net outflows. Compared with September 9’s 2,026.34 BTC, the single-day outflow expanded by about 68%.
On that day, only 1 product had net accumulation, 6 had net reductions, and 6 were unchanged. Total inflows were only 51.58 BTC, while total outflows reached 3,457.74 BTC, showing a clear bias toward reduction in fund structure. The largest single-product outflow reached 2,130 BTC, accounting for about 62% of all outflows that day. So this day was not a case of many products each slightly reducing positions, but rather several large sell orders pushing the overall direction into negative territory.
At present, the most recent 7 effective trading days still show a cumulative net increase of 3,974.58 BTC, and since September the cumulative increase is 3,972.72 BTC. In the short term, it has not officially turned into net outflows yet, but the funding advantage established earlier has been rapidly compressed. $BTC
{future}(BTCUSDT)
On September 10, $BTC spot ETF total holdings fell to 1,264,573.56 BTC. Net holdings decreased by 3,406.16 BTC on the day, marking the second consecutive effective trading day of net outflows. Compared with September 9’s 2,026.34 BTC, the single-day outflow expanded by about 68%.
On that day, only 1 product had net accumulation, 6 had net reductions, and 6 were unchanged. Total inflows were only 51.58 BTC, while total outflows reached 3,457.74 BTC, showing a clear bias toward reduction in fund structure. The largest single-product outflow reached 2,130 BTC, accounting for about 62% of all outflows that day. So this day was not a case of many products each slightly reducing positions, but rather several large sell orders pushing the overall direction into negative territory.
At present, the most recent 7 effective trading days still show a cumulative net increase of 3,974.58 BTC, and since September the cumulative increase is 3,972.72 BTC. In the short term, it has not officially turned into net outflows yet, but the funding advantage established earlier has been rapidly compressed. $BTC
On that day, only 1 product had net accumulation, 6 had net reductions, and 6 were unchanged. Total inflows were only 51.58 BTC, while total outflows reached 3,457.74 BTC, showing a clear bias toward reduction in fund structure. The largest single-product outflow reached 2,130 BTC, accounting for about 62% of all outflows that day. So this day was not a case of many products each slightly reducing positions, but rather several large sell orders pushing the overall direction into negative territory.
At present, the most recent 7 effective trading days still show a cumulative net increase of 3,974.58 BTC, and since September the cumulative increase is 3,972.72 BTC. In the short term, it has not officially turned into net outflows yet, but the funding advantage established earlier has been rapidly compressed. $BTC
971
·
--
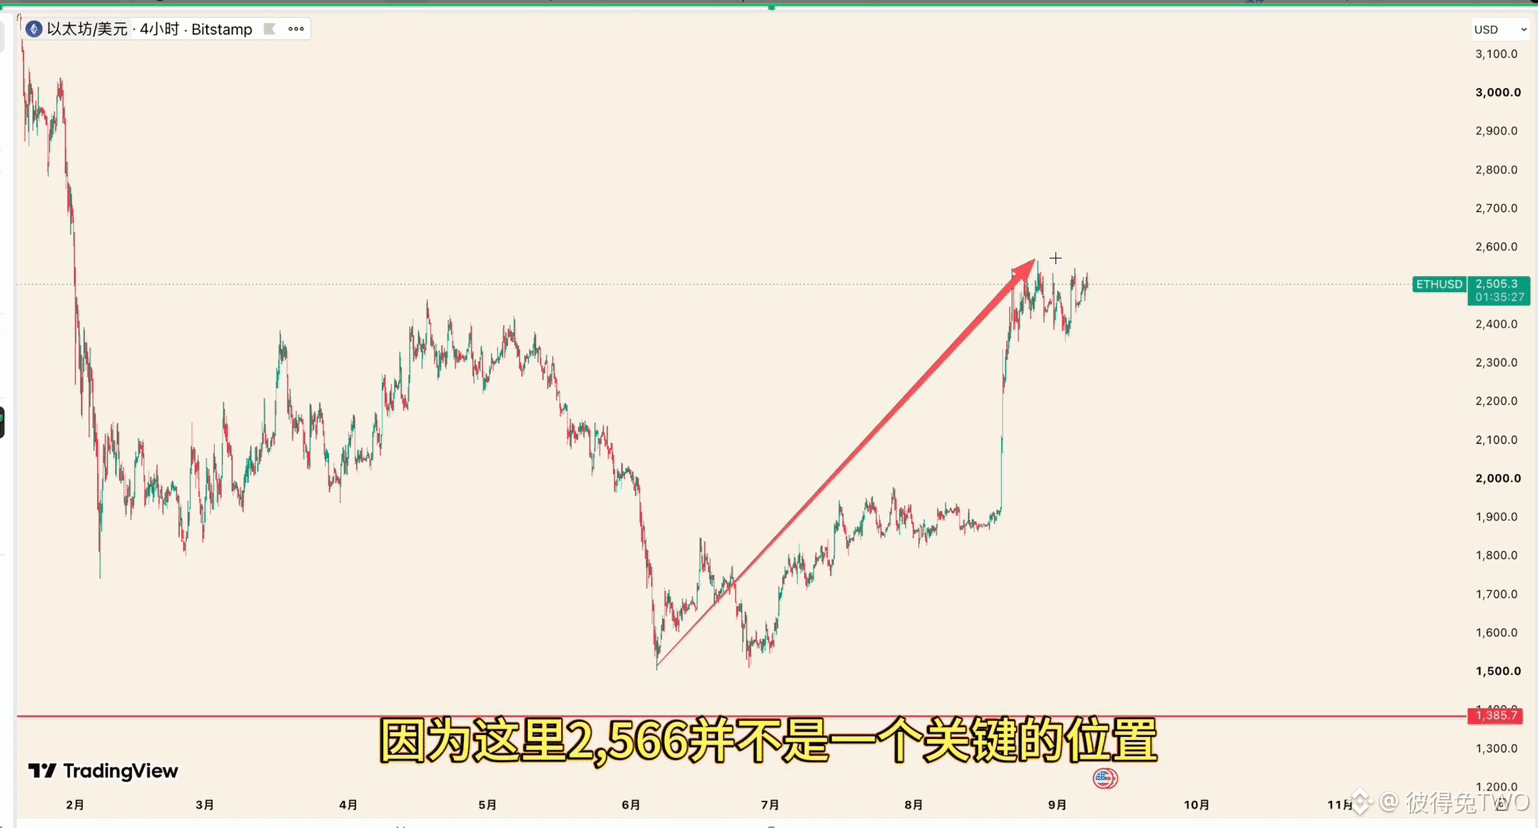
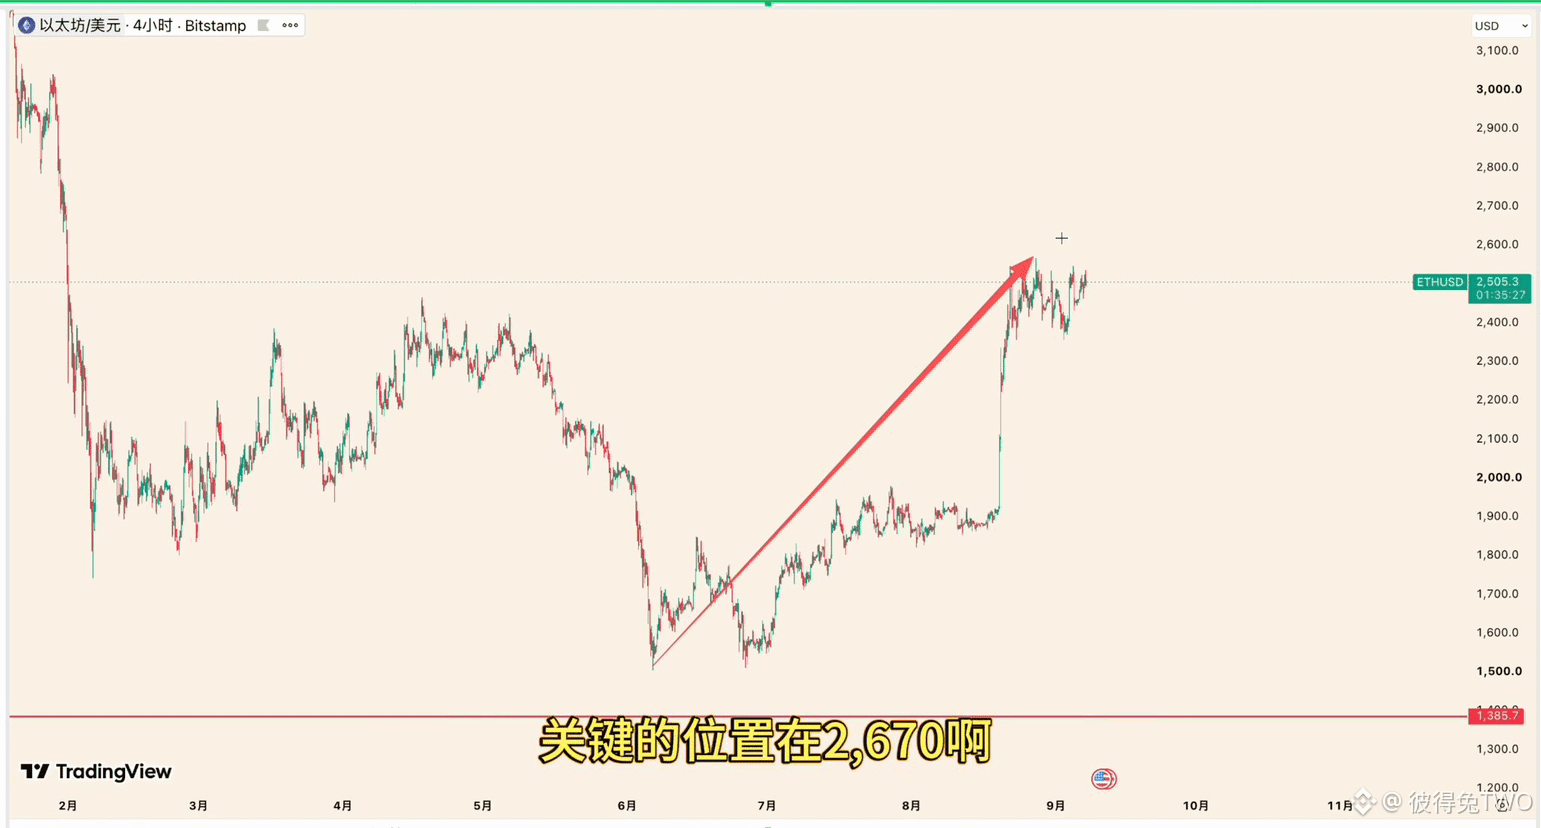
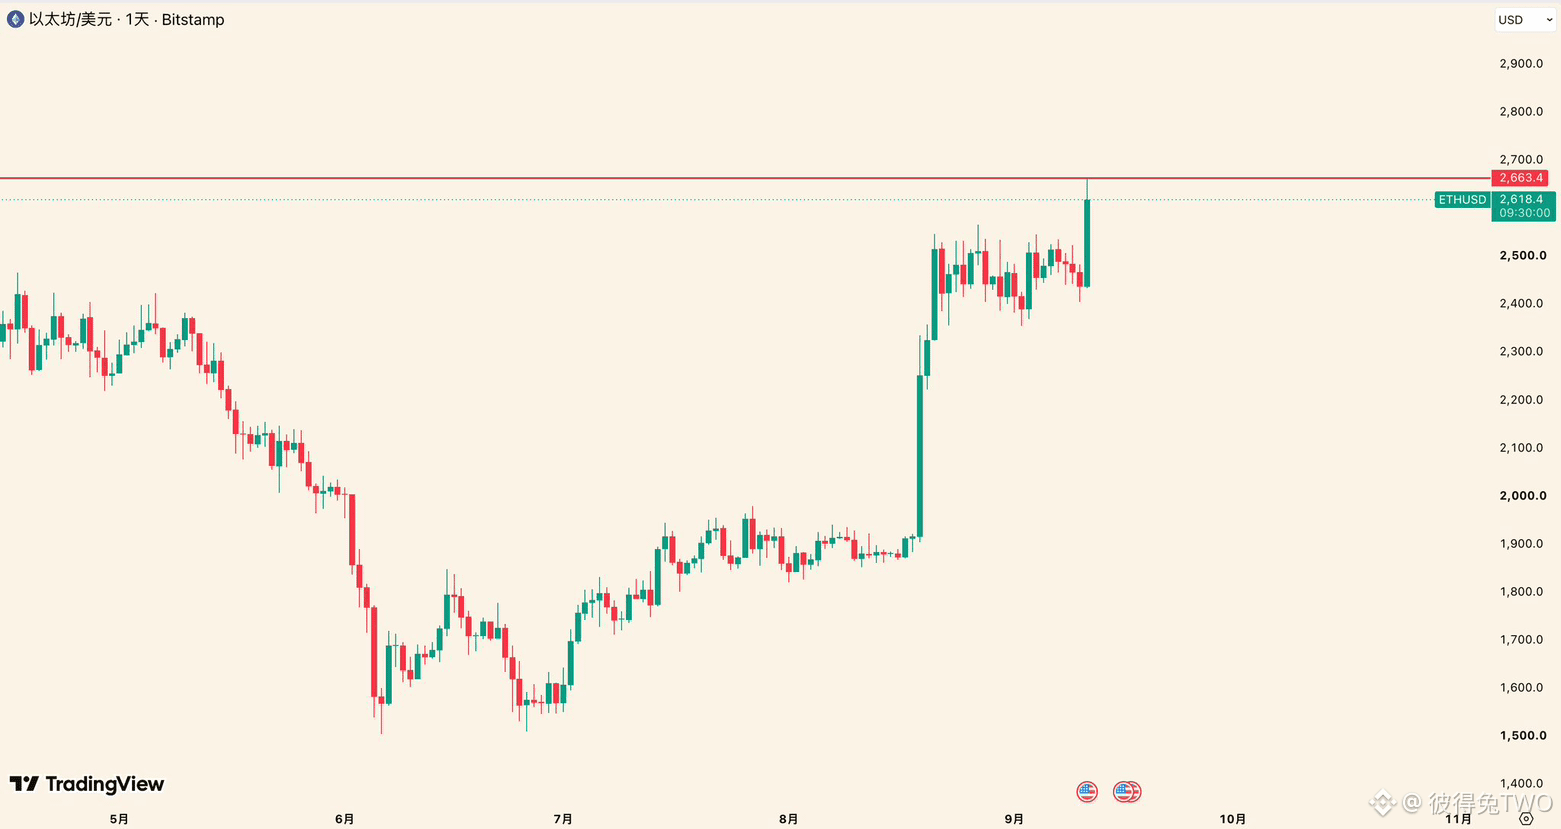
In the video from September 7, it was mentioned that the key location for $ETH is near 2670, not 2556. Now ETH has come to 2663.4.
In this Sunday’s video analysis, we will follow up on ETH’s subsequent price action. If you care about ETH’s market, you’d better not miss it. $ETH #ETH走势分析
In the video from September 7, it was mentioned that the key location for $ETH is near 2670, not 2556. Now ETH has come to 2663.4.
In this Sunday’s video analysis, we will follow up on ETH’s subsequent price action. If you care about ETH’s market, you’d better not miss it. $ETH #ETH走势分析
In this Sunday’s video analysis, we will follow up on ETH’s subsequent price action. If you care about ETH’s market, you’d better not miss it. $ETH #ETH走势分析
1
1.5k
·
--
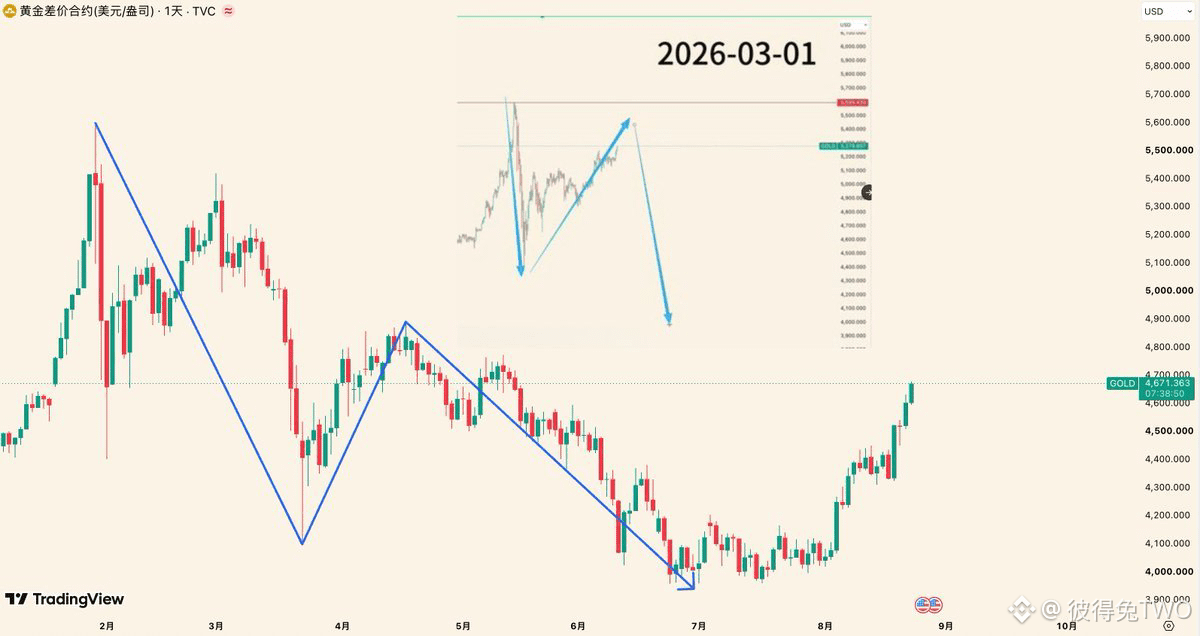
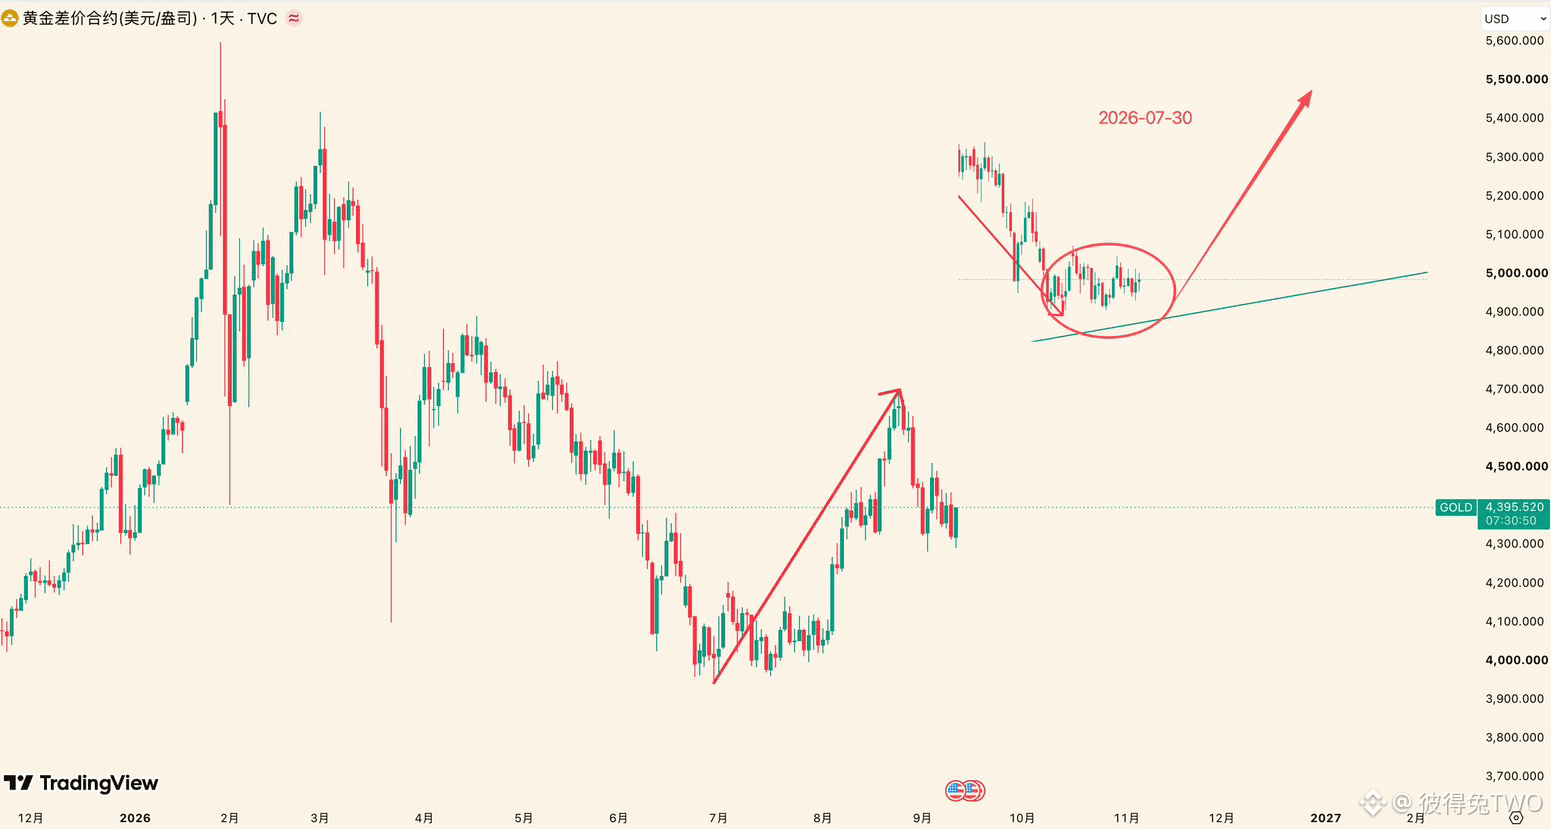
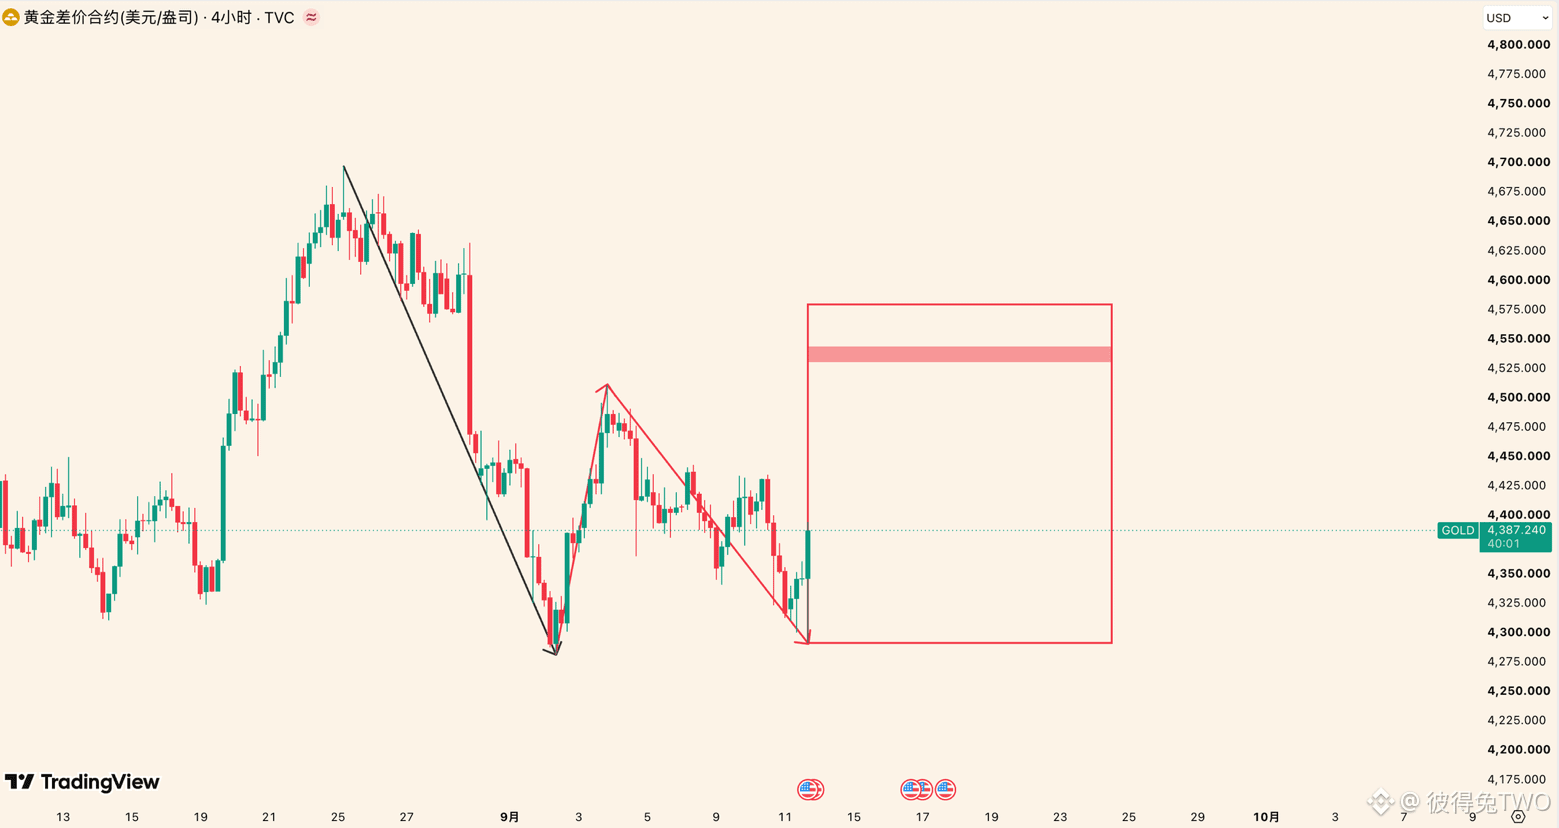
$XAU gold price outlook analysis 2026.09.11
As shown in Figures 1 and 2, since March we have forecast almost all trend moves in gold over the past half year. These two phases belong to the kind of行情 (market trends) with relatively high certainty and smooth movement, and there will be similar opportunities afterward.
At a smaller scale, let’s look at it this way first: the pullback in gold that started from 4282 is temporarily regarded as a rebound targeting the decline in the black segment shown in Figure 3. The 4282–4510 portion is the first rebound. 4510–4291 is the pullback of that first rebound. If gold breaks above 4400 and holds above that level, we assume the pullback ends; then the move starting from 4291 is a rebound at the same level as 4282–4510, with resistance levels at 4516–4538. If it can hold above, it may expand the degree/scale; we will follow up on that later.
It’s important to note that after the break above 4400, daily candles are no longer allowed to break back down; otherwise, what runs from 4291 may only be a rebound against the decline segment from 4510–4291.$XAU
{future}(XAUUSDT)
$XAUT
{future}(XAUTUSDT)
#xau
$XAU gold price outlook analysis 2026.09.11
As shown in Figures 1 and 2, since March we have forecast almost all trend moves in gold over the past half year. These two phases belong to the kind of行情 (market trends) with relatively high certainty and smooth movement, and there will be similar opportunities afterward.
At a smaller scale, let’s look at it this way first: the pullback in gold that started from 4282 is temporarily regarded as a rebound targeting the decline in the black segment shown in Figure 3. The 4282–4510 portion is the first rebound. 4510–4291 is the pullback of that first rebound. If gold breaks above 4400 and holds above that level, we assume the pullback ends; then the move starting from 4291 is a rebound at the same level as 4282–4510, with resistance levels at 4516–4538. If it can hold above, it may expand the degree/scale; we will follow up on that later.
It’s important to note that after the break above 4400, daily candles are no longer allowed to break back down; otherwise, what runs from 4291 may only be a rebound against the decline segment from 4510–4291.$XAU
$XAUT
#xau
As shown in Figures 1 and 2, since March we have forecast almost all trend moves in gold over the past half year. These two phases belong to the kind of行情 (market trends) with relatively high certainty and smooth movement, and there will be similar opportunities afterward.
At a smaller scale, let’s look at it this way first: the pullback in gold that started from 4282 is temporarily regarded as a rebound targeting the decline in the black segment shown in Figure 3. The 4282–4510 portion is the first rebound. 4510–4291 is the pullback of that first rebound. If gold breaks above 4400 and holds above that level, we assume the pullback ends; then the move starting from 4291 is a rebound at the same level as 4282–4510, with resistance levels at 4516–4538. If it can hold above, it may expand the degree/scale; we will follow up on that later.
It’s important to note that after the break above 4400, daily candles are no longer allowed to break back down; otherwise, what runs from 4291 may only be a rebound against the decline segment from 4510–4291.$XAU
$XAUT
#xau
420
·
--
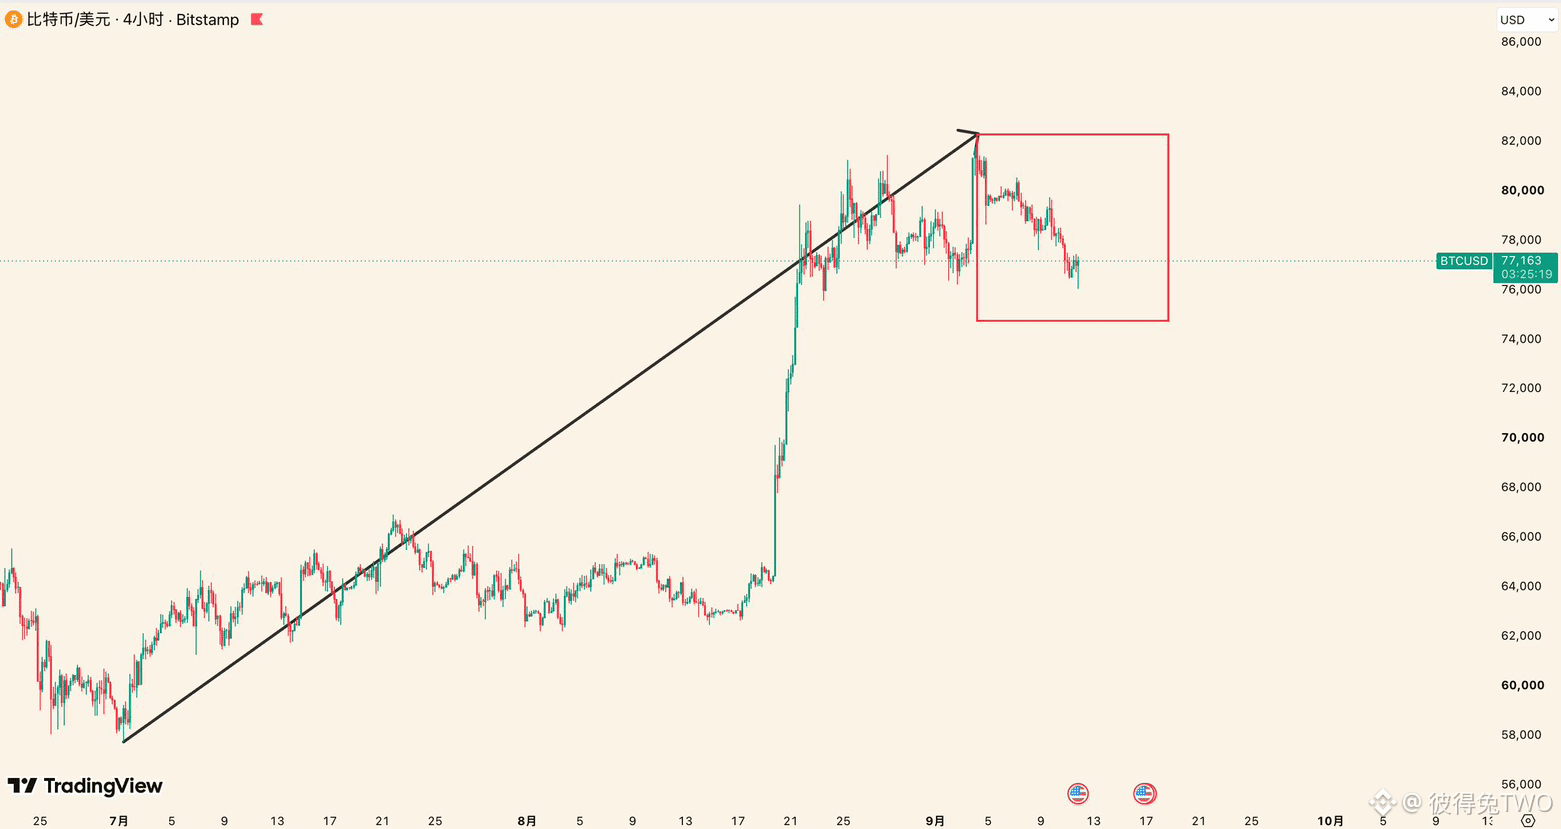
Could I be the first person on the whole internet to tell everyone that 82300 is a *BTC* phase top?
After Bitcoin fell to the Gann low on July 1, I repeatedly said that the next phase high point would appear in late August to early September. I kept saying it from July to August, and then from early August to late August. By late August, I even refined the timing to the week of September 5. In Monday’s video, I emphasized again that 82300 may be the top.
This means that no matter when you see my tweet or video, you won’t miss this leg of the pullback starting from 82300. If you’ve been following early, you can even take profit on your longs at the summit.
Assuming 82300 is the phase top, then what follows from 82300 is operating as a correction against the entire up-move from 57,800 to 82,300. Along this path, the first wave of the decline is about to end—or has already ended (shown in the red box).
If 76,000 no longer breaks down, that confirms the first wave of decline has ended. After that, the next movement is a rebound against the first wave of decline, with the overhead resistance zone roughly at 78,300–78,700.
After the selling pressure eased at 10 p.m. last night, I cleared most of my short positions. It wasn’t exactly at the absolute bottom, but it’s no more than 1% away from the low. Going forward, I’ll look for opportunities to continue trading. As of now, the development of September’s market has been completely in line with our expectations, and both I and the rabbit friends feel very comfortable 🐰$BTC
{future}(BTCUSDT)
#BTC走势分析
Could I be the first person on the whole internet to tell everyone that 82300 is a *BTC* phase top?
After Bitcoin fell to the Gann low on July 1, I repeatedly said that the next phase high point would appear in late August to early September. I kept saying it from July to August, and then from early August to late August. By late August, I even refined the timing to the week of September 5. In Monday’s video, I emphasized again that 82300 may be the top.
This means that no matter when you see my tweet or video, you won’t miss this leg of the pullback starting from 82300. If you’ve been following early, you can even take profit on your longs at the summit.
Assuming 82300 is the phase top, then what follows from 82300 is operating as a correction against the entire up-move from 57,800 to 82,300. Along this path, the first wave of the decline is about to end—or has already ended (shown in the red box).
If 76,000 no longer breaks down, that confirms the first wave of decline has ended. After that, the next movement is a rebound against the first wave of decline, with the overhead resistance zone roughly at 78,300–78,700.
After the selling pressure eased at 10 p.m. last night, I cleared most of my short positions. It wasn’t exactly at the absolute bottom, but it’s no more than 1% away from the low. Going forward, I’ll look for opportunities to continue trading. As of now, the development of September’s market has been completely in line with our expectations, and both I and the rabbit friends feel very comfortable 🐰$BTC
#BTC走势分析
After Bitcoin fell to the Gann low on July 1, I repeatedly said that the next phase high point would appear in late August to early September. I kept saying it from July to August, and then from early August to late August. By late August, I even refined the timing to the week of September 5. In Monday’s video, I emphasized again that 82300 may be the top.
This means that no matter when you see my tweet or video, you won’t miss this leg of the pullback starting from 82300. If you’ve been following early, you can even take profit on your longs at the summit.
Assuming 82300 is the phase top, then what follows from 82300 is operating as a correction against the entire up-move from 57,800 to 82,300. Along this path, the first wave of the decline is about to end—or has already ended (shown in the red box).
If 76,000 no longer breaks down, that confirms the first wave of decline has ended. After that, the next movement is a rebound against the first wave of decline, with the overhead resistance zone roughly at 78,300–78,700.
After the selling pressure eased at 10 p.m. last night, I cleared most of my short positions. It wasn’t exactly at the absolute bottom, but it’s no more than 1% away from the low. Going forward, I’ll look for opportunities to continue trading. As of now, the development of September’s market has been completely in line with our expectations, and both I and the rabbit friends feel very comfortable 🐰$BTC
#BTC走势分析

3
5.3k
·
--
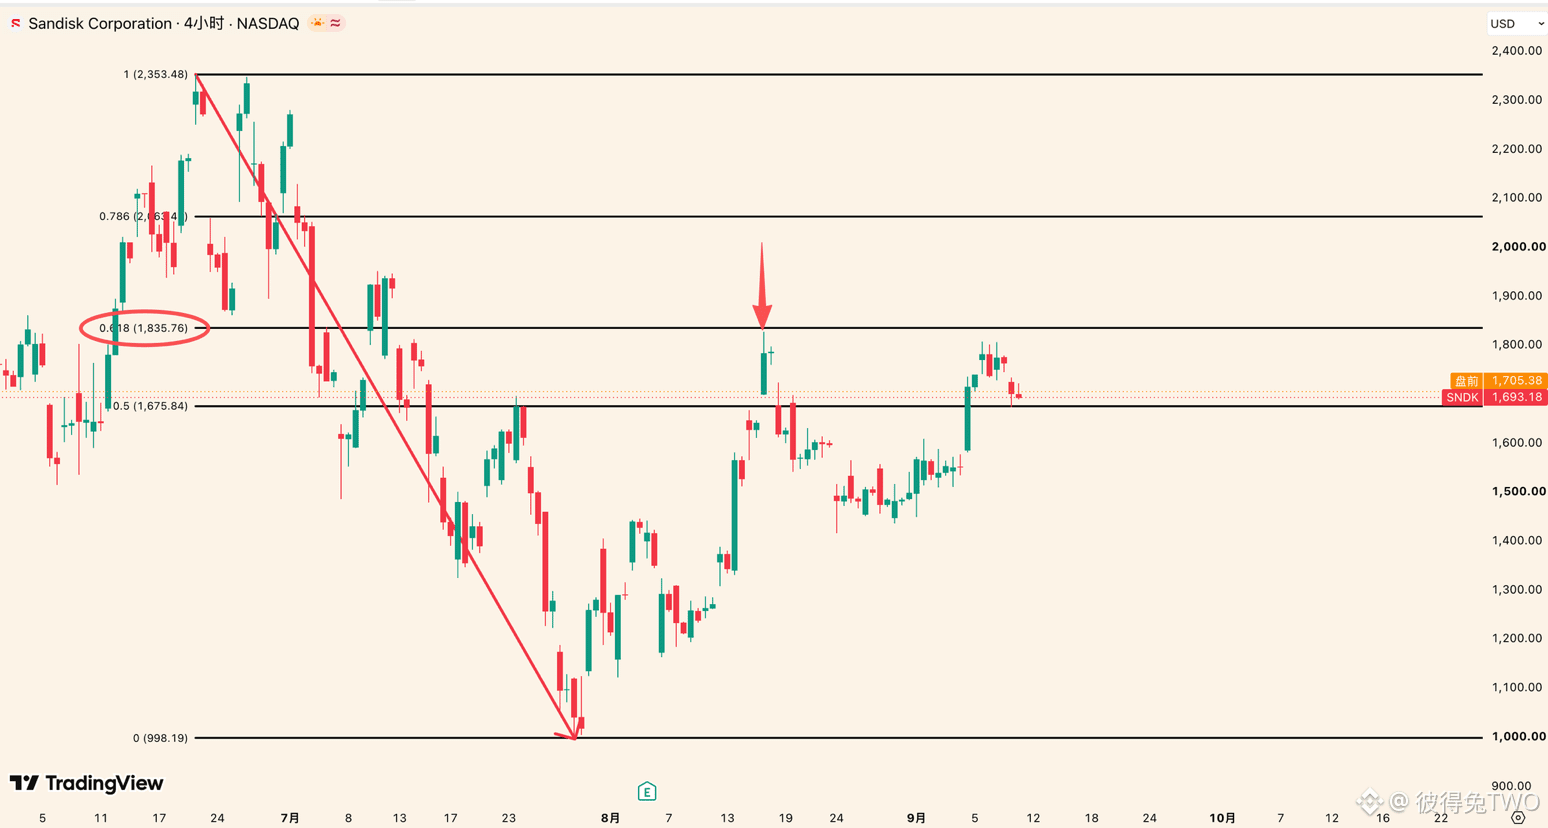
At the end of July, we repeatedly emphasized that $SNDK , running from 998, is a rebound targeting the entire decline from 2353 to 998. The facts proved that our judgment of the trend was correct ✅
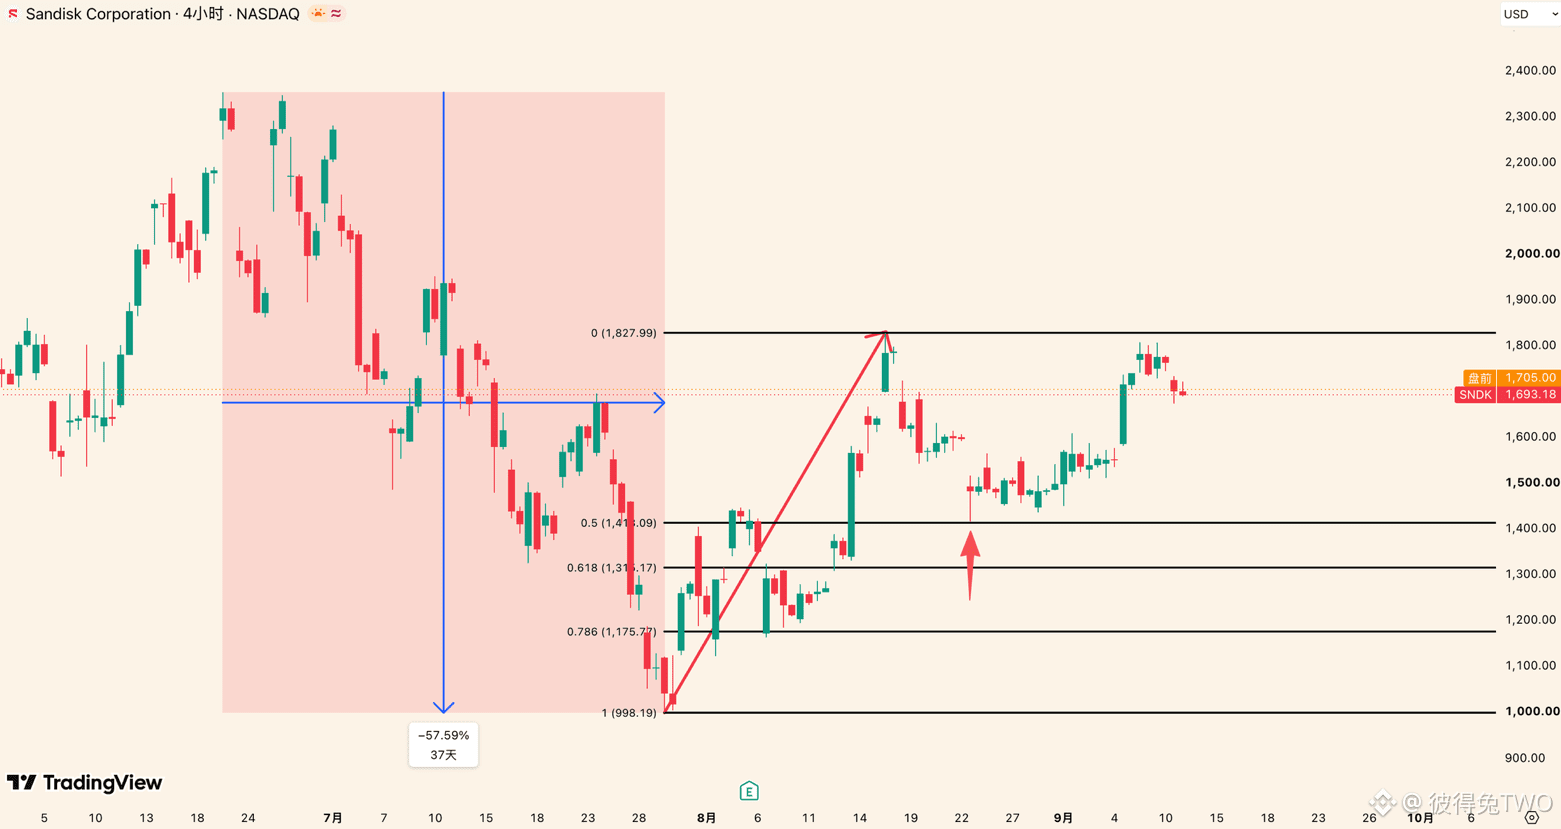
As shown in Figure 1, when price rose to 1828, I advised starting a pullback. This was because after Sandie rose to the 0.618 resistance level of the entire decline, it showed signs of stopping. Through Figure 2, we can clearly see that although the rebound magnitude was decent, its duration was not sufficient. As a rebound of the entire decline, it felt somewhat forced; therefore, we judged that the move from 1828 was a pullback rather than a new leg down.
On August 20th and 24th, we gave the end-point of this round of pullback—around 1400. Then, as expected, Sandie ended the pullback at 1416. In the video from August 29th, we said that there might not be a low below 1416; the pullback would be over, and the rebound would continue. After that, Sandie rose from 1416 to 1807. All of these judgments were based on our accurate structural segmentation of this Sandie market move at the end of July. As I stressed many times, a correct and clear level breakdown guides our subsequent trading.
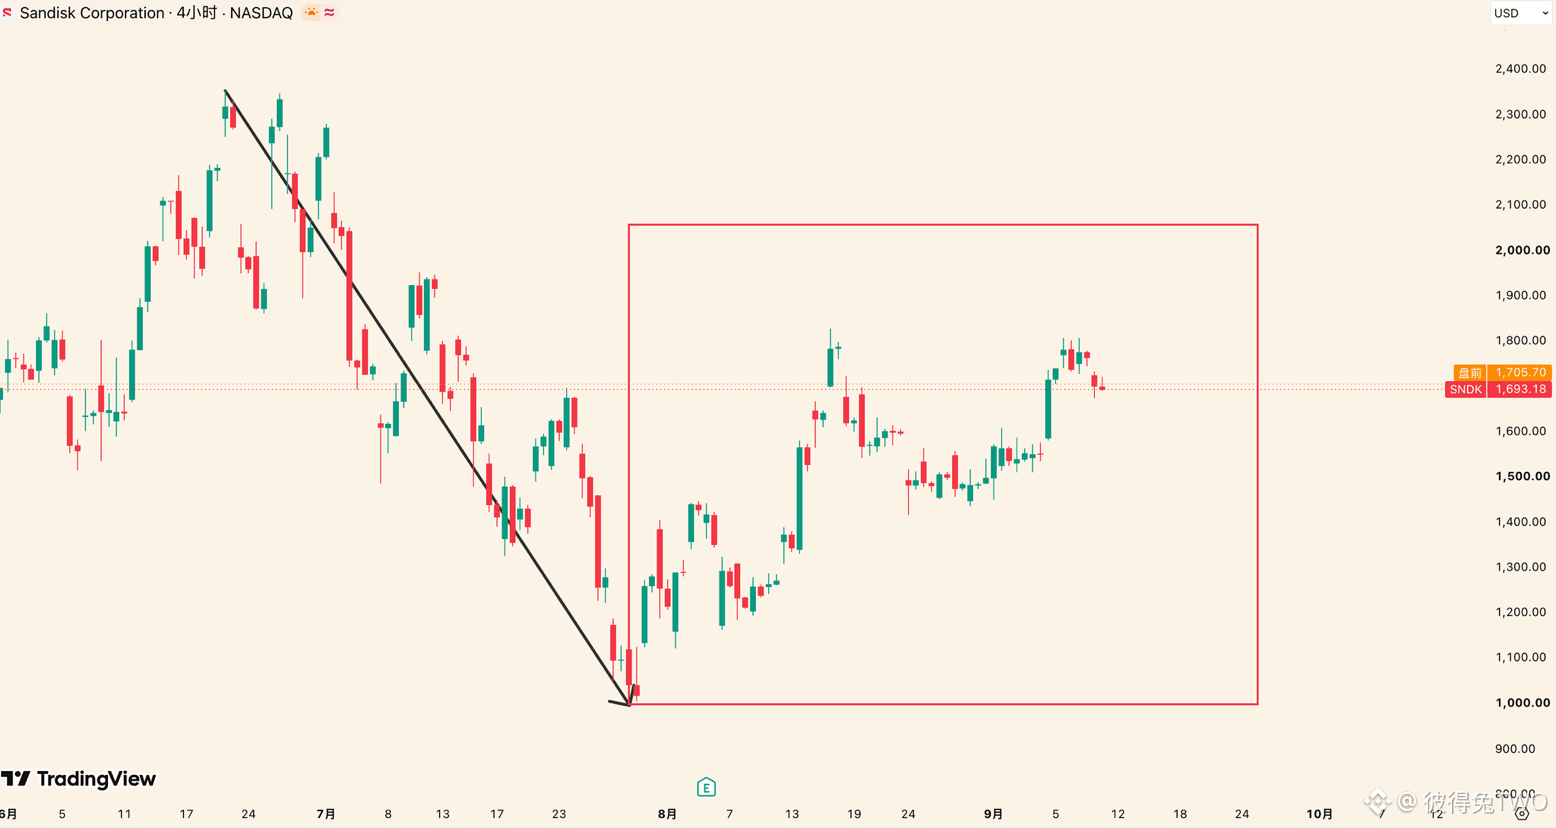
So what to watch next? As shown in Figure 3, the rebound from 998 targets the entire decline from 2353 to 998. The observation point below is at 1608. If it breaks below this level and cannot subsequently reclaim it, be alert that the rebound may have ended. As long as it stays above this level, the rebound still has momentum and there is hope to push higher. $SNDK $SNDKB
At the end of July, we repeatedly emphasized that $SNDK , running from 998, is a rebound targeting the entire decline from 2353 to 998. The facts proved that our judgment of the trend was correct ✅
As shown in Figure 1, when price rose to 1828, I advised starting a pullback. This was because after Sandie rose to the 0.618 resistance level of the entire decline, it showed signs of stopping. Through Figure 2, we can clearly see that although the rebound magnitude was decent, its duration was not sufficient. As a rebound of the entire decline, it felt somewhat forced; therefore, we judged that the move from 1828 was a pullback rather than a new leg down.
On August 20th and 24th, we gave the end-point of this round of pullback—around 1400. Then, as expected, Sandie ended the pullback at 1416. In the video from August 29th, we said that there might not be a low below 1416; the pullback would be over, and the rebound would continue. After that, Sandie rose from 1416 to 1807. All of these judgments were based on our accurate structural segmentation of this Sandie market move at the end of July. As I stressed many times, a correct and clear level breakdown guides our subsequent trading.
So what to watch next? As shown in Figure 3, the rebound from 998 targets the entire decline from 2353 to 998. The observation point below is at 1608. If it breaks below this level and cannot subsequently reclaim it, be alert that the rebound may have ended. As long as it stays above this level, the rebound still has momentum and there is hope to push higher. $SNDK $SNDKB
As shown in Figure 1, when price rose to 1828, I advised starting a pullback. This was because after Sandie rose to the 0.618 resistance level of the entire decline, it showed signs of stopping. Through Figure 2, we can clearly see that although the rebound magnitude was decent, its duration was not sufficient. As a rebound of the entire decline, it felt somewhat forced; therefore, we judged that the move from 1828 was a pullback rather than a new leg down.
On August 20th and 24th, we gave the end-point of this round of pullback—around 1400. Then, as expected, Sandie ended the pullback at 1416. In the video from August 29th, we said that there might not be a low below 1416; the pullback would be over, and the rebound would continue. After that, Sandie rose from 1416 to 1807. All of these judgments were based on our accurate structural segmentation of this Sandie market move at the end of July. As I stressed many times, a correct and clear level breakdown guides our subsequent trading.
So what to watch next? As shown in Figure 3, the rebound from 998 targets the entire decline from 2353 to 998. The observation point below is at 1608. If it breaks below this level and cannot subsequently reclaim it, be alert that the rebound may have ended. As long as it stays above this level, the rebound still has momentum and there is hope to push higher. $SNDK $SNDKB
1.2k
·
--
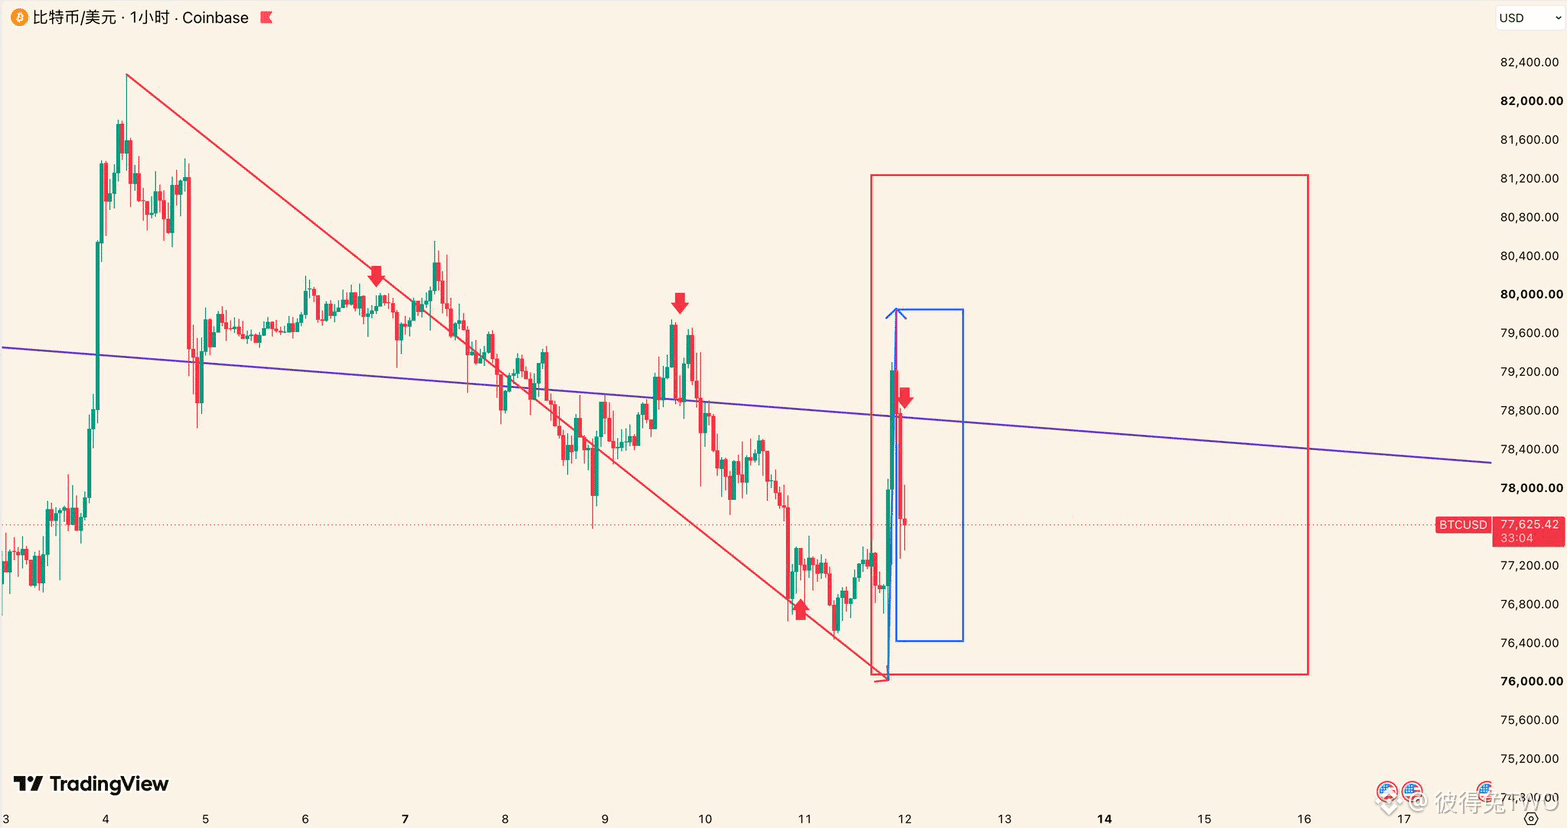
September third entry: $BTC sell order. Once the trend is established, just follow the larger trend and look for entry points on smaller timeframes—tried and tested, it keeps working.
The run from 76046 is for the rebound of the first downswing from 82300 to 76046. 76046–79890 is all of, or part of, the rebound. If it breaks below 76700 and cannot reclaim it, then 76046–79890 may be the entire rebound; under that route, consider holding the short positions.
If it still can’t break below 76700 for a long time, it may be a pullback targeting 76049–79890. Under that route, the rebound can continue; if it can break through and hold above 78700, then there may be another higher rebound peak.
On smaller timeframes there are many possibilities and they change quickly. Real-time market analysis and trading strategies will be synchronized in the Tutu community. Updates on Twitter mainly focus on trend judgment on 4-hour and higher timeframes. $BTC
{future}(BTCUSDT)
September third entry: $BTC sell order. Once the trend is established, just follow the larger trend and look for entry points on smaller timeframes—tried and tested, it keeps working.
The run from 76046 is for the rebound of the first downswing from 82300 to 76046. 76046–79890 is all of, or part of, the rebound. If it breaks below 76700 and cannot reclaim it, then 76046–79890 may be the entire rebound; under that route, consider holding the short positions.
If it still can’t break below 76700 for a long time, it may be a pullback targeting 76049–79890. Under that route, the rebound can continue; if it can break through and hold above 78700, then there may be another higher rebound peak.
On smaller timeframes there are many possibilities and they change quickly. Real-time market analysis and trading strategies will be synchronized in the Tutu community. Updates on Twitter mainly focus on trend judgment on 4-hour and higher timeframes. $BTC
The run from 76046 is for the rebound of the first downswing from 82300 to 76046. 76046–79890 is all of, or part of, the rebound. If it breaks below 76700 and cannot reclaim it, then 76046–79890 may be the entire rebound; under that route, consider holding the short positions.
If it still can’t break below 76700 for a long time, it may be a pullback targeting 76049–79890. Under that route, the rebound can continue; if it can break through and hold above 78700, then there may be another higher rebound peak.
On smaller timeframes there are many possibilities and they change quickly. Real-time market analysis and trading strategies will be synchronized in the Tutu community. Updates on Twitter mainly focus on trend judgment on 4-hour and higher timeframes. $BTC

1.1k
·
--
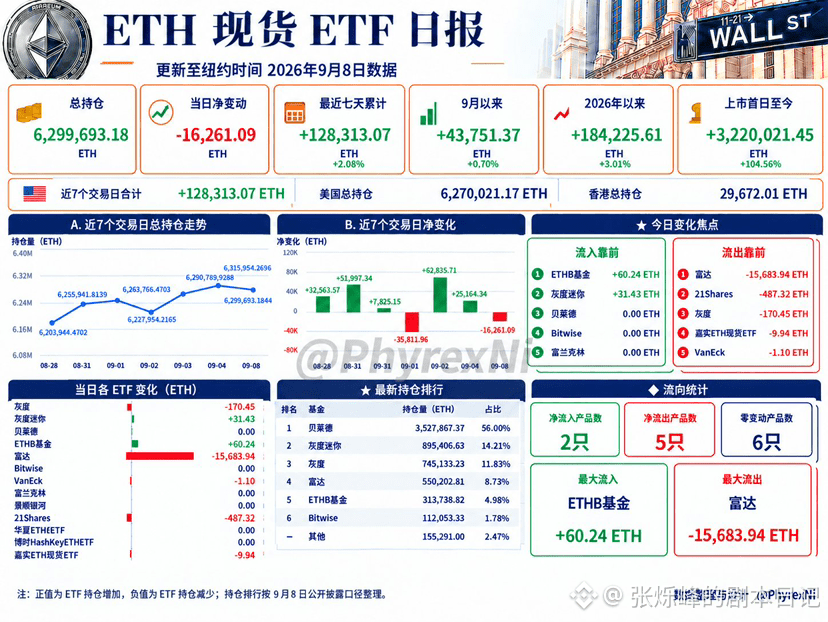
On September 8, ETH spot ETF total holdings fell to 6,299,693.18 ETH, with net sales of 16,261.09 ETH on the day. This is a fairly clear single-day outflow. And unlike BTC, that day ETH didn’t see inflow slow down—instead, it directly turned into a weak day.
However, if you look at a longer period, ETH still hasn’t fully turned bearish from its strong state. Over the past seven days, it has still recorded a net increase of 128,313.07 ETH; since September, the net increase is 43,751.37 ETH; and since 2026 began, the net increase is 184,225.61 ETH. So right now it looks more like a noticeable pullback after a stretch of strong inflows, rather than the entire trend reversing.
Therefore, I interpret ETH’s current status as still relatively strong in the medium term, while short-term capital strength is starting to cool off. If over the next one or two days it can return to net inflows, then this would look more like a normal pullback; but if core products like Fidelity continue to post consecutive outflows, then ETH’s ETF funding advantage in this round will start to be eroded.$ETH #ETH走势分析
{future}(ETHUSDT)
On September 8, ETH spot ETF total holdings fell to 6,299,693.18 ETH, with net sales of 16,261.09 ETH on the day. This is a fairly clear single-day outflow. And unlike BTC, that day ETH didn’t see inflow slow down—instead, it directly turned into a weak day.
However, if you look at a longer period, ETH still hasn’t fully turned bearish from its strong state. Over the past seven days, it has still recorded a net increase of 128,313.07 ETH; since September, the net increase is 43,751.37 ETH; and since 2026 began, the net increase is 184,225.61 ETH. So right now it looks more like a noticeable pullback after a stretch of strong inflows, rather than the entire trend reversing.
Therefore, I interpret ETH’s current status as still relatively strong in the medium term, while short-term capital strength is starting to cool off. If over the next one or two days it can return to net inflows, then this would look more like a normal pullback; but if core products like Fidelity continue to post consecutive outflows, then ETH’s ETF funding advantage in this round will start to be eroded.$ETH #ETH走势分析
However, if you look at a longer period, ETH still hasn’t fully turned bearish from its strong state. Over the past seven days, it has still recorded a net increase of 128,313.07 ETH; since September, the net increase is 43,751.37 ETH; and since 2026 began, the net increase is 184,225.61 ETH. So right now it looks more like a noticeable pullback after a stretch of strong inflows, rather than the entire trend reversing.
Therefore, I interpret ETH’s current status as still relatively strong in the medium term, while short-term capital strength is starting to cool off. If over the next one or two days it can return to net inflows, then this would look more like a normal pullback; but if core products like Fidelity continue to post consecutive outflows, then ETH’s ETF funding advantage in this round will start to be eroded.$ETH #ETH走势分析
147
·
--
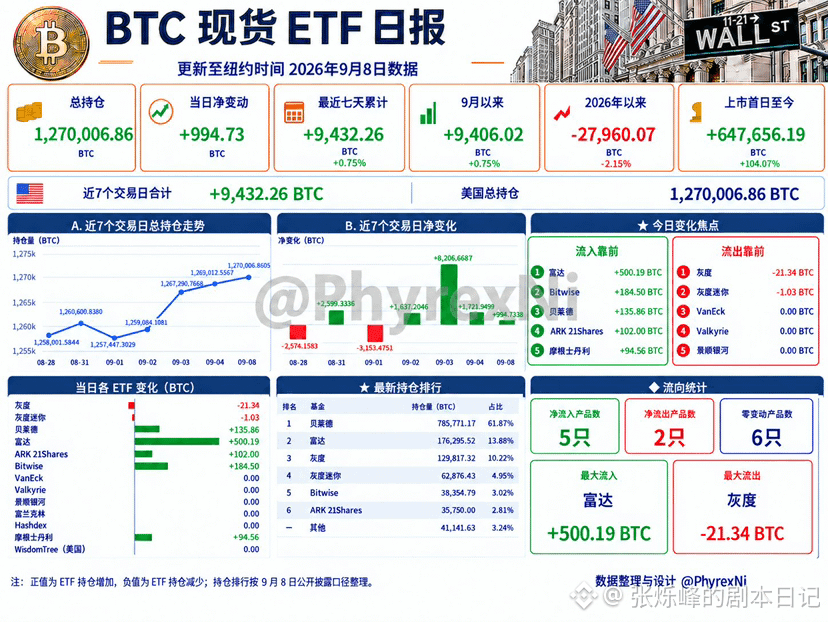
September 8 BTC spot ETF total holdings rise to 1,270,006.86 BTC, with a net increase of 994.73 BTC on the day. Judging by the absolute value alone, it isn’t a very strong inflow, but the good thing is that on September 3, 4, and 8 it has turned positive for three consecutive times, indicating that after the kind of back-and-forth tug-of-war in early September, capital is still slowly making its way back.
Over the past seven days, cumulative net purchases amounted to 9,432.26 BTC, and since the start of September, cumulative net purchases totaled 9,406.02 BTC. This basically shows that although the beginning of September hasn’t seen an explosive inflow, the overall direction is still tilted positive—and total holdings have also continued to set new highs following this round of replenishment.
In terms of structure, the distribution of BTC funds on September 8 was relatively healthy. That day, 5 products saw net inflows, 2 saw net outflows, and 6 had no change. In other words, BTC wasn’t pushed up by just a single product; several products together added to their positions, though none of the individual sizes were particularly large.
So for now, BTC’s situation can be understood as a shift in capital preference in a positive direction, but with not especially strong intensity—more like steady replenishment.$BTC
{future}(BTCUSDT)
#BTC走势分析
September 8 BTC spot ETF total holdings rise to 1,270,006.86 BTC, with a net increase of 994.73 BTC on the day. Judging by the absolute value alone, it isn’t a very strong inflow, but the good thing is that on September 3, 4, and 8 it has turned positive for three consecutive times, indicating that after the kind of back-and-forth tug-of-war in early September, capital is still slowly making its way back.
Over the past seven days, cumulative net purchases amounted to 9,432.26 BTC, and since the start of September, cumulative net purchases totaled 9,406.02 BTC. This basically shows that although the beginning of September hasn’t seen an explosive inflow, the overall direction is still tilted positive—and total holdings have also continued to set new highs following this round of replenishment.
In terms of structure, the distribution of BTC funds on September 8 was relatively healthy. That day, 5 products saw net inflows, 2 saw net outflows, and 6 had no change. In other words, BTC wasn’t pushed up by just a single product; several products together added to their positions, though none of the individual sizes were particularly large.
So for now, BTC’s situation can be understood as a shift in capital preference in a positive direction, but with not especially strong intensity—more like steady replenishment.$BTC
#BTC走势分析
Over the past seven days, cumulative net purchases amounted to 9,432.26 BTC, and since the start of September, cumulative net purchases totaled 9,406.02 BTC. This basically shows that although the beginning of September hasn’t seen an explosive inflow, the overall direction is still tilted positive—and total holdings have also continued to set new highs following this round of replenishment.
In terms of structure, the distribution of BTC funds on September 8 was relatively healthy. That day, 5 products saw net inflows, 2 saw net outflows, and 6 had no change. In other words, BTC wasn’t pushed up by just a single product; several products together added to their positions, though none of the individual sizes were particularly large.
So for now, BTC’s situation can be understood as a shift in capital preference in a positive direction, but with not especially strong intensity—more like steady replenishment.$BTC
#BTC走势分析
121
·
--
Good evening, brothers! The market over these past two days has really been grinding you—moving up and down within a narrow range. For scalping, you can indeed go long and short and profit from both sides, but you really can’t be too patient/overly optimistic. Like the four coins’ aggressive short orders I gave at noon—once you got on the train and took profit, if you didn’t exit, then this evening’s pump would have given your profits right back.
Now the daily chart is hovering in a sideways range, and the top level keeps getting punched but won’t break through. Judging by the current setup, this kind of dragging, back-and-forth market will probably continue until Friday night before it finally shows a clear direction. These two days, we’ll mainly go for low longs: if there are wick spikes, go long aggressively; at resistance, try short positions with light size—leave yourself a plan for adding to the position if needed. If you’re carrying heavy size, add your own stop-loss—don’t just hold on and “fight it out”!
I’ve mapped out the entry levels for you:
$BTC —In the evening, short lightly around 80000. If it breaks upward, add to shorts at 82000–84500. Stop-loss: 85500. If the rebound can’t push up, go long lightly and take it around 78000. If it breaks down, add at 76500–74500. Stop-loss: 73500.
$ETH —Rebound to around 2515: short. If it breaks through, add to shorts at 2540–2565. Stop-loss: 2590. Pull back to around 2485: go long. If it breaks below, add at 2460–2430. Stop-loss: 2415.
$BNB —Rebound to around 757: short. If it breaks through, add to shorts at 770–780. Stop-loss: 790. Pull back to around 735: go long. If it breaks down, add at 723–710. Stop-loss: 700.
SOL—Rebound to around 105: short. If it breaks through, add to shorts at 106.5–108.5. Stop-loss: 109.5. Pull back to around 102: go long. If it breaks down, add at 100–98. Stop-loss: 97.#BTC走势分析 #ETH走势分析
{future}(BNBUSDT)
{future}(ETHUSDT)
{future}(BTCUSDT)
Good evening, brothers! The market over these past two days has really been grinding you—moving up and down within a narrow range. For scalping, you can indeed go long and short and profit from both sides, but you really can’t be too patient/overly optimistic. Like the four coins’ aggressive short orders I gave at noon—once you got on the train and took profit, if you didn’t exit, then this evening’s pump would have given your profits right back.
Now the daily chart is hovering in a sideways range, and the top level keeps getting punched but won’t break through. Judging by the current setup, this kind of dragging, back-and-forth market will probably continue until Friday night before it finally shows a clear direction. These two days, we’ll mainly go for low longs: if there are wick spikes, go long aggressively; at resistance, try short positions with light size—leave yourself a plan for adding to the position if needed. If you’re carrying heavy size, add your own stop-loss—don’t just hold on and “fight it out”!
I’ve mapped out the entry levels for you:
$BTC —In the evening, short lightly around 80000. If it breaks upward, add to shorts at 82000–84500. Stop-loss: 85500. If the rebound can’t push up, go long lightly and take it around 78000. If it breaks down, add at 76500–74500. Stop-loss: 73500.
$ETH —Rebound to around 2515: short. If it breaks through, add to shorts at 2540–2565. Stop-loss: 2590. Pull back to around 2485: go long. If it breaks below, add at 2460–2430. Stop-loss: 2415.
$BNB —Rebound to around 757: short. If it breaks through, add to shorts at 770–780. Stop-loss: 790. Pull back to around 735: go long. If it breaks down, add at 723–710. Stop-loss: 700.
SOL—Rebound to around 105: short. If it breaks through, add to shorts at 106.5–108.5. Stop-loss: 109.5. Pull back to around 102: go long. If it breaks down, add at 100–98. Stop-loss: 97.#BTC走势分析 #ETH走势分析
Now the daily chart is hovering in a sideways range, and the top level keeps getting punched but won’t break through. Judging by the current setup, this kind of dragging, back-and-forth market will probably continue until Friday night before it finally shows a clear direction. These two days, we’ll mainly go for low longs: if there are wick spikes, go long aggressively; at resistance, try short positions with light size—leave yourself a plan for adding to the position if needed. If you’re carrying heavy size, add your own stop-loss—don’t just hold on and “fight it out”!
I’ve mapped out the entry levels for you:
$BTC —In the evening, short lightly around 80000. If it breaks upward, add to shorts at 82000–84500. Stop-loss: 85500. If the rebound can’t push up, go long lightly and take it around 78000. If it breaks down, add at 76500–74500. Stop-loss: 73500.
$ETH —Rebound to around 2515: short. If it breaks through, add to shorts at 2540–2565. Stop-loss: 2590. Pull back to around 2485: go long. If it breaks below, add at 2460–2430. Stop-loss: 2415.
$BNB —Rebound to around 757: short. If it breaks through, add to shorts at 770–780. Stop-loss: 790. Pull back to around 735: go long. If it breaks down, add at 723–710. Stop-loss: 700.
SOL—Rebound to around 105: short. If it breaks through, add to shorts at 106.5–108.5. Stop-loss: 109.5. Pull back to around 102: go long. If it breaks down, add at 100–98. Stop-loss: 97.#BTC走势分析 #ETH走势分析

769
·
--
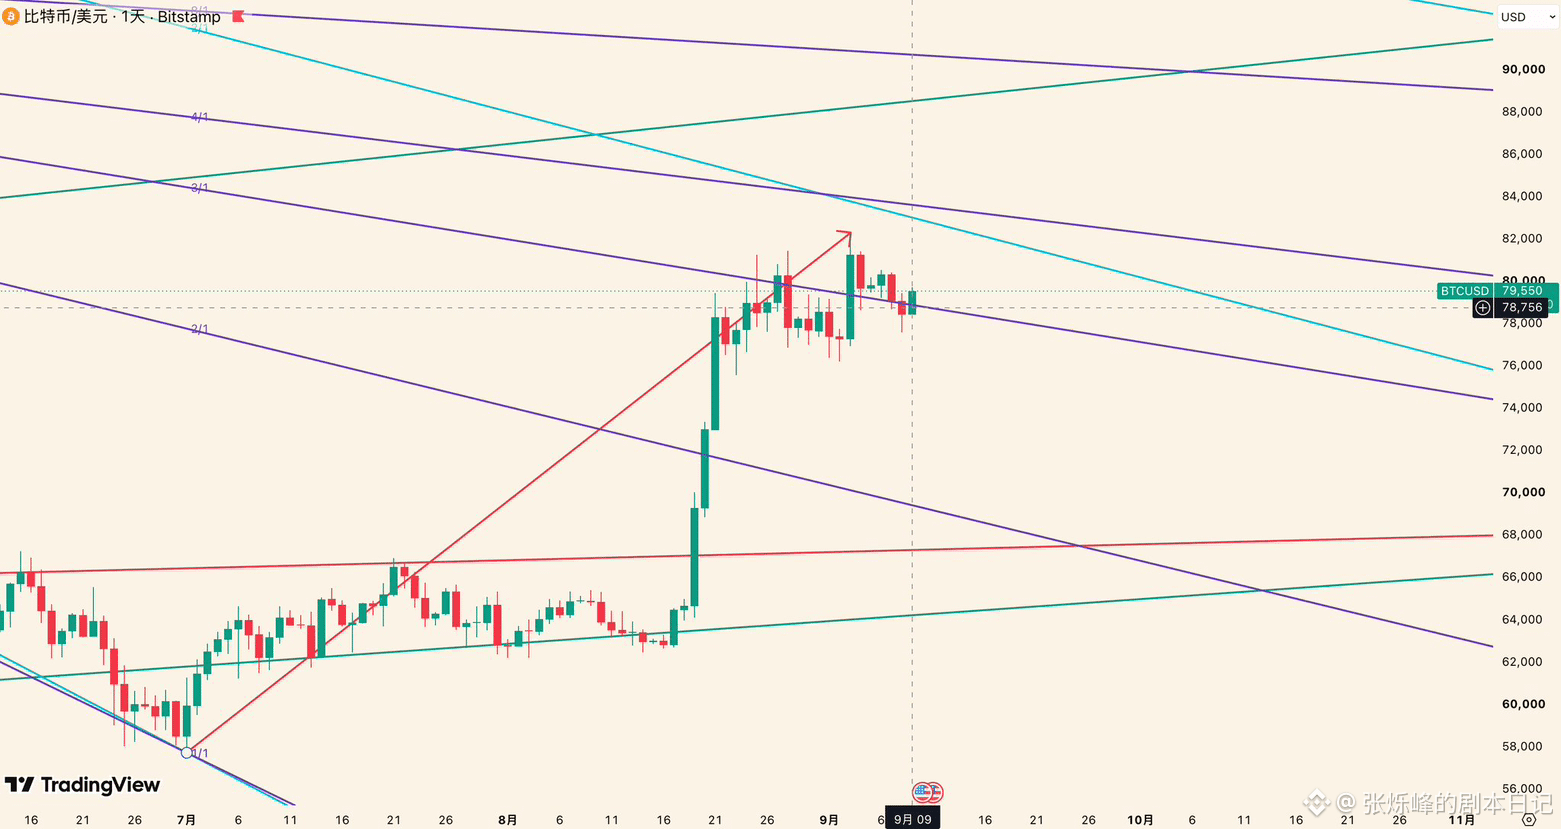
From a weekly-chart perspective, we are at a historical turning point in the BTC bull-bear cycle:
My view remains unchanged—this current bear market at a higher timeframe level has two key buy points:
The first has already appeared at 57,800 on July 1. This time and level were discussed back in June;
The other will be in Q4 of 2026, especially watch the period in late October through early November!
On the short term, as shown by the red line in the chart, the uptrend structure that started from 57,800 is already complete. Yesterday, we said that as long as price holds above the purple Gann angle line at 78,900, it may continue to rise. After a subsequent move below that level and then a reclaim, the 78,900 level is still valid.
If price cannot break above 82,300, then the rise that began from 77,620 is only a retracement (a rebound). It is meant specifically for the decline from 82,300 to 77,620. On the upside, the resistance zone to watch is 82,900–83,600. If that zone cannot be broken, then the rise from 77,620 should be viewed only as a continuation of the upward move shown by the red segment, not as a new trend.
On the downside observation levels, move the key point up to 76,800. If price breaks below it, be cautious that the entire upswing that began from 57,800 may have ended. After that, what follows will be a pullback / a decline at the same level. Once the bottom is found, that is the second—and last—buy point of this bear market, and the final “onboard chicken hotpot.” $BTC
{future}(BTCUSDT)
#BTC走势分析
From a weekly-chart perspective, we are at a historical turning point in the BTC bull-bear cycle:
My view remains unchanged—this current bear market at a higher timeframe level has two key buy points:
The first has already appeared at 57,800 on July 1. This time and level were discussed back in June;
The other will be in Q4 of 2026, especially watch the period in late October through early November!
On the short term, as shown by the red line in the chart, the uptrend structure that started from 57,800 is already complete. Yesterday, we said that as long as price holds above the purple Gann angle line at 78,900, it may continue to rise. After a subsequent move below that level and then a reclaim, the 78,900 level is still valid.
If price cannot break above 82,300, then the rise that began from 77,620 is only a retracement (a rebound). It is meant specifically for the decline from 82,300 to 77,620. On the upside, the resistance zone to watch is 82,900–83,600. If that zone cannot be broken, then the rise from 77,620 should be viewed only as a continuation of the upward move shown by the red segment, not as a new trend.
On the downside observation levels, move the key point up to 76,800. If price breaks below it, be cautious that the entire upswing that began from 57,800 may have ended. After that, what follows will be a pullback / a decline at the same level. Once the bottom is found, that is the second—and last—buy point of this bear market, and the final “onboard chicken hotpot.” $BTC
#BTC走势分析
My view remains unchanged—this current bear market at a higher timeframe level has two key buy points:
The first has already appeared at 57,800 on July 1. This time and level were discussed back in June;
The other will be in Q4 of 2026, especially watch the period in late October through early November!
On the short term, as shown by the red line in the chart, the uptrend structure that started from 57,800 is already complete. Yesterday, we said that as long as price holds above the purple Gann angle line at 78,900, it may continue to rise. After a subsequent move below that level and then a reclaim, the 78,900 level is still valid.
If price cannot break above 82,300, then the rise that began from 77,620 is only a retracement (a rebound). It is meant specifically for the decline from 82,300 to 77,620. On the upside, the resistance zone to watch is 82,900–83,600. If that zone cannot be broken, then the rise from 77,620 should be viewed only as a continuation of the upward move shown by the red segment, not as a new trend.
On the downside observation levels, move the key point up to 76,800. If price breaks below it, be cautious that the entire upswing that began from 57,800 may have ended. After that, what follows will be a pullback / a decline at the same level. Once the bottom is found, that is the second—and last—buy point of this bear market, and the final “onboard chicken hotpot.” $BTC
#BTC走势分析
2
2.7k
·
--
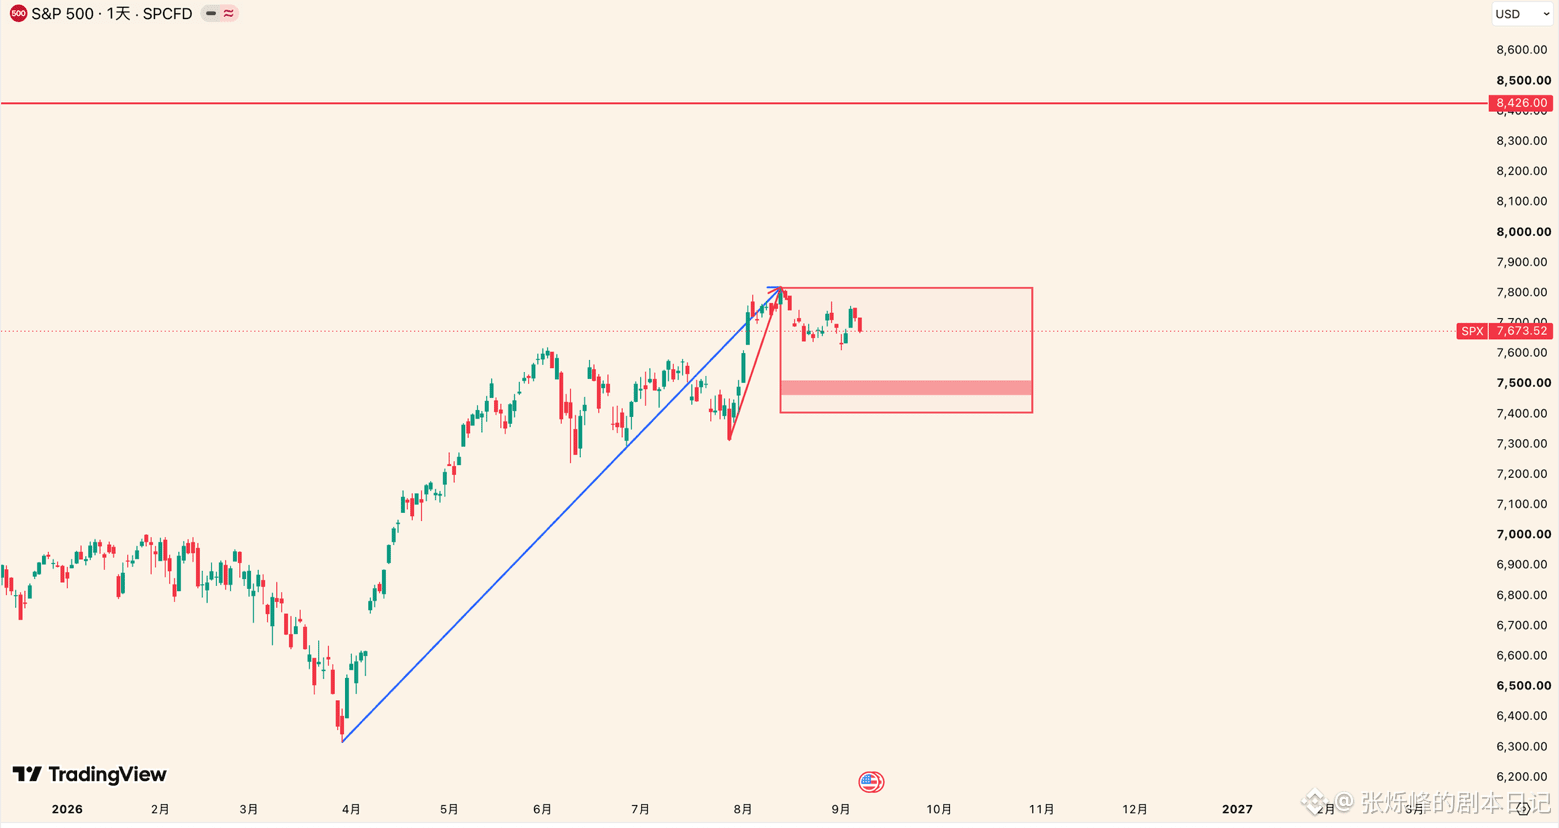
S&P 500 Market Analysis 2026.09.09
After the S&P 500 started falling from 7620.9 on June 2, we indicated on July 1 that the drop from 7620.9 was very likely a pullback rather than a new downtrend. Then on August 4, it broke above the previous high, confirming that our earlier judgment was correct ✅
What next?
Personally, I’m more inclined to believe that the decline that began from 7816.7 is a pullback of the red segment shown in the chart. After finding the end point of the pullback in the range above 7507–7420, the S&P 500 will continue rising. In this scenario, the rise from the start of the red segment is at the daily-chart level, and the first target above is 8426.
If the S&P 500 breaks below 7507–7420 and cannot reclaim it, then according to the blue segment, treat 6316.9–7816.7 as one complete upward move. The decline starting from 7816.7 would then be a pullback against that move. In this scenario, the pullback duration would be noticeably longer than the red path, but it would most likely find a pullback bottom in Q4. After that, it would be followed by an upswing at the same level as the blue segment.
At present, I haven’t seen signs that the pullback starting from 7816.7 has expanded in degree. For now, I’ll treat it as following the red path.
After this S&P 500 correction is completed, many assets in the U.S. stock market are likely to see accelerated gains. #S&P
S&P 500 Market Analysis 2026.09.09
After the S&P 500 started falling from 7620.9 on June 2, we indicated on July 1 that the drop from 7620.9 was very likely a pullback rather than a new downtrend. Then on August 4, it broke above the previous high, confirming that our earlier judgment was correct ✅
What next?
Personally, I’m more inclined to believe that the decline that began from 7816.7 is a pullback of the red segment shown in the chart. After finding the end point of the pullback in the range above 7507–7420, the S&P 500 will continue rising. In this scenario, the rise from the start of the red segment is at the daily-chart level, and the first target above is 8426.
If the S&P 500 breaks below 7507–7420 and cannot reclaim it, then according to the blue segment, treat 6316.9–7816.7 as one complete upward move. The decline starting from 7816.7 would then be a pullback against that move. In this scenario, the pullback duration would be noticeably longer than the red path, but it would most likely find a pullback bottom in Q4. After that, it would be followed by an upswing at the same level as the blue segment.
At present, I haven’t seen signs that the pullback starting from 7816.7 has expanded in degree. For now, I’ll treat it as following the red path.
After this S&P 500 correction is completed, many assets in the U.S. stock market are likely to see accelerated gains. #S&P
After the S&P 500 started falling from 7620.9 on June 2, we indicated on July 1 that the drop from 7620.9 was very likely a pullback rather than a new downtrend. Then on August 4, it broke above the previous high, confirming that our earlier judgment was correct ✅
What next?
Personally, I’m more inclined to believe that the decline that began from 7816.7 is a pullback of the red segment shown in the chart. After finding the end point of the pullback in the range above 7507–7420, the S&P 500 will continue rising. In this scenario, the rise from the start of the red segment is at the daily-chart level, and the first target above is 8426.
If the S&P 500 breaks below 7507–7420 and cannot reclaim it, then according to the blue segment, treat 6316.9–7816.7 as one complete upward move. The decline starting from 7816.7 would then be a pullback against that move. In this scenario, the pullback duration would be noticeably longer than the red path, but it would most likely find a pullback bottom in Q4. After that, it would be followed by an upswing at the same level as the blue segment.
At present, I haven’t seen signs that the pullback starting from 7816.7 has expanded in degree. For now, I’ll treat it as following the red path.
After this S&P 500 correction is completed, many assets in the U.S. stock market are likely to see accelerated gains. #S&P
10.3k
·
--
Good afternoon, brothers! The overall market has been falling from last night and hasn’t been that volatile overall. That little bounce last night—except for the short position on a big BTC with a light position where it didn’t give an entry, the other three coins were all taken, and they all made a bit of profit—if you didn’t exit, the current profits would have been given back quite a lot.
Now the smaller timeframe is starting to bounce again. This rebound up to the overhead resistance zone can still be shorted with a light position. Longs only make sense when there’s a needle-like dip to buy back in. This week is a classic “picking up money” market—both long and short setups can be traded, just keep your stop-loss levels set properly. Don’t be greedy!
Here are the specific levels for you:
#BTC: Today, when it rebounds to around 79,500, short with a light position. If it breaks upward, add to the short around 80,500–82,000. Stop loss: 83,500. If it can’t push higher and then pulls back to around 77,700, go long with a light position. If it breaks downward, add to the long around 76,500–74,500. Stop loss: 73,500. $BTC
#ETH: Short around 2,505 on the rebound with a light position. If it breaks upward, add around 2,535–2,565. Stop loss: 2,590. Buy long around 2,460 on the pullback with a light position. If it breaks downward, add around 2,430–2,395. Stop loss: 2,375. $ETH
#BNB: Short around 757 on the rebound with a light position. If it breaks upward, add around 770–780. Stop loss: 790. Buy long around 745 on the pullback with a light position. If it breaks downward, add around 735–720. Stop loss: 710. $BNB
#SOL: Short around 104.5 on the rebound with a light position. If it breaks upward, add around 106.5–108.5. Stop loss: 109.5. Buy long around 102 on the pullback with a light position. If it breaks downward, add around 100–98. Stop loss: 97.
{future}(BNBUSDT)
{future}(ETHUSDT)
{future}(BTCUSDT)
Good afternoon, brothers! The overall market has been falling from last night and hasn’t been that volatile overall. That little bounce last night—except for the short position on a big BTC with a light position where it didn’t give an entry, the other three coins were all taken, and they all made a bit of profit—if you didn’t exit, the current profits would have been given back quite a lot.
Now the smaller timeframe is starting to bounce again. This rebound up to the overhead resistance zone can still be shorted with a light position. Longs only make sense when there’s a needle-like dip to buy back in. This week is a classic “picking up money” market—both long and short setups can be traded, just keep your stop-loss levels set properly. Don’t be greedy!
Here are the specific levels for you:
#BTC: Today, when it rebounds to around 79,500, short with a light position. If it breaks upward, add to the short around 80,500–82,000. Stop loss: 83,500. If it can’t push higher and then pulls back to around 77,700, go long with a light position. If it breaks downward, add to the long around 76,500–74,500. Stop loss: 73,500. $BTC
#ETH: Short around 2,505 on the rebound with a light position. If it breaks upward, add around 2,535–2,565. Stop loss: 2,590. Buy long around 2,460 on the pullback with a light position. If it breaks downward, add around 2,430–2,395. Stop loss: 2,375. $ETH
#BNB: Short around 757 on the rebound with a light position. If it breaks upward, add around 770–780. Stop loss: 790. Buy long around 745 on the pullback with a light position. If it breaks downward, add around 735–720. Stop loss: 710. $BNB
#SOL: Short around 104.5 on the rebound with a light position. If it breaks upward, add around 106.5–108.5. Stop loss: 109.5. Buy long around 102 on the pullback with a light position. If it breaks downward, add around 100–98. Stop loss: 97.
Now the smaller timeframe is starting to bounce again. This rebound up to the overhead resistance zone can still be shorted with a light position. Longs only make sense when there’s a needle-like dip to buy back in. This week is a classic “picking up money” market—both long and short setups can be traded, just keep your stop-loss levels set properly. Don’t be greedy!
Here are the specific levels for you:
#BTC: Today, when it rebounds to around 79,500, short with a light position. If it breaks upward, add to the short around 80,500–82,000. Stop loss: 83,500. If it can’t push higher and then pulls back to around 77,700, go long with a light position. If it breaks downward, add to the long around 76,500–74,500. Stop loss: 73,500. $BTC
#ETH: Short around 2,505 on the rebound with a light position. If it breaks upward, add around 2,535–2,565. Stop loss: 2,590. Buy long around 2,460 on the pullback with a light position. If it breaks downward, add around 2,430–2,395. Stop loss: 2,375. $ETH
#BNB: Short around 757 on the rebound with a light position. If it breaks upward, add around 770–780. Stop loss: 790. Buy long around 745 on the pullback with a light position. If it breaks downward, add around 735–720. Stop loss: 710. $BNB
#SOL: Short around 104.5 on the rebound with a light position. If it breaks upward, add around 106.5–108.5. Stop loss: 109.5. Buy long around 102 on the pullback with a light position. If it breaks downward, add around 100–98. Stop loss: 97.
157
·
--
The rise that started with SPCX 104 has a high probability of being a rebound. It is targeting the entire downtrend segment from 225.61 to 104.
Why, on August 3, did the market broadly expect SPCX to break below 100—some even talked about seeing 80 or 60? The logic is actually quite simple: the stock price had been selling off sharply from 225. As this turning point approached a period of unlocks and with valuation already on the high side, even though the earnings report showed solid growth, it didn’t meet the extremely high expectations the market had previously priced in. After continuous declines, bearish sentiment began to strengthen, and the market became accustomed to simply projecting the already-realized selloff further into the future.
But I was looking at the other side— the company’s fundamentals have not deteriorated alongside the stock price. Revenue, EBITDA, narrowing losses, and continued improvements in the Starlink business growth are all still moving in the right direction. In other words, what was falling at that time was mainly valuation and expectations—two factors with very large upside “elasticity.” When the price dropped near 104, the risk of further downside had essentially been released. At that point, chasing shorts or betting on hitting 80 or 60 offered no particularly attractive risk-reward. Also, from the order flow, it’s highly likely that a daily-chart-level rebound is about to begin here. That’s why we decisively entered SPCX during this phase.
104–149.8 is the first leg up. 149.8–130.4 is a pullback targeting that first upward leg. From 130.4 to today, what has been running is at least an upswing of the same level as 104–149.8. Together, these three waves form the overall rebound starting from 104— a rebound against the entire down move.
As long as it stays above 145, we believe the rebound still has momentum. The resistance level above was mentioned in the video on Monday. If you haven’t watched it, you can go check— for now, it remains unchanged. #spcx $SPCX
{future}(SPCXUSDT)
$SPCX.US $SPCXB
{spot}(SPCXBUSDT)
The rise that started with SPCX 104 has a high probability of being a rebound. It is targeting the entire downtrend segment from 225.61 to 104.
Why, on August 3, did the market broadly expect SPCX to break below 100—some even talked about seeing 80 or 60? The logic is actually quite simple: the stock price had been selling off sharply from 225. As this turning point approached a period of unlocks and with valuation already on the high side, even though the earnings report showed solid growth, it didn’t meet the extremely high expectations the market had previously priced in. After continuous declines, bearish sentiment began to strengthen, and the market became accustomed to simply projecting the already-realized selloff further into the future.
But I was looking at the other side— the company’s fundamentals have not deteriorated alongside the stock price. Revenue, EBITDA, narrowing losses, and continued improvements in the Starlink business growth are all still moving in the right direction. In other words, what was falling at that time was mainly valuation and expectations—two factors with very large upside “elasticity.” When the price dropped near 104, the risk of further downside had essentially been released. At that point, chasing shorts or betting on hitting 80 or 60 offered no particularly attractive risk-reward. Also, from the order flow, it’s highly likely that a daily-chart-level rebound is about to begin here. That’s why we decisively entered SPCX during this phase.
104–149.8 is the first leg up. 149.8–130.4 is a pullback targeting that first upward leg. From 130.4 to today, what has been running is at least an upswing of the same level as 104–149.8. Together, these three waves form the overall rebound starting from 104— a rebound against the entire down move.
As long as it stays above 145, we believe the rebound still has momentum. The resistance level above was mentioned in the video on Monday. If you haven’t watched it, you can go check— for now, it remains unchanged. #spcx $SPCX
$SPCX.US $SPCXB
Why, on August 3, did the market broadly expect SPCX to break below 100—some even talked about seeing 80 or 60? The logic is actually quite simple: the stock price had been selling off sharply from 225. As this turning point approached a period of unlocks and with valuation already on the high side, even though the earnings report showed solid growth, it didn’t meet the extremely high expectations the market had previously priced in. After continuous declines, bearish sentiment began to strengthen, and the market became accustomed to simply projecting the already-realized selloff further into the future.
But I was looking at the other side— the company’s fundamentals have not deteriorated alongside the stock price. Revenue, EBITDA, narrowing losses, and continued improvements in the Starlink business growth are all still moving in the right direction. In other words, what was falling at that time was mainly valuation and expectations—two factors with very large upside “elasticity.” When the price dropped near 104, the risk of further downside had essentially been released. At that point, chasing shorts or betting on hitting 80 or 60 offered no particularly attractive risk-reward. Also, from the order flow, it’s highly likely that a daily-chart-level rebound is about to begin here. That’s why we decisively entered SPCX during this phase.
104–149.8 is the first leg up. 149.8–130.4 is a pullback targeting that first upward leg. From 130.4 to today, what has been running is at least an upswing of the same level as 104–149.8. Together, these three waves form the overall rebound starting from 104— a rebound against the entire down move.
As long as it stays above 145, we believe the rebound still has momentum. The resistance level above was mentioned in the video on Monday. If you haven’t watched it, you can go check— for now, it remains unchanged. #spcx $SPCX
$SPCX.US $SPCXB

SPCXB+0.00%
SPCXUS+0.05%
665
·
--
I said it earlier at noon: personally, I lean toward moving downward. As it turns out, today really dipped in two waves and even put in a fresh low.
For the brothers who accumulated at the bottom—remember to use a trailing/adjustable stop loss. Lock in the profits first.
My overnight plan is simple:
1. $BTC : If it bounces to around 79,500, you can short with a small position. If it pushes up, then add in batches between 80,500 and 82,000. Set a stop loss at 83,500. If it doesn’t bounce up, then when it pulls back to around 77,500, lightly go long. If it breaks down, then add between 76,000 and 74,500. Set a stop loss at 73,500.
2. $ETH : Short the rebound by 2,500 points, and add at 2,535–2,565 with a stop loss at 2,590. If it pulls back to 2,460, go long, add between 2,430–2,395, and set a stop loss at 2,375.
3. $BNB : Short at 757. Add between 770–780, stop loss at 790. Go long at 745, add between 735–720, stop loss at 710.
4. SOL: Short at 104. Add between 105.8–107, stop loss at 109. Go long at 102, add between 100–98, stop loss at 97.#美加关税战升级 #比特币ETF年内仍缺10亿美元
Remember: if at night it can’t even reach yesterday morning’s high, then you’ll have to probe further downward. Once it reaches the support area, just pick up positions in batches.
{future}(BTCUSDT)
{future}(ETHUSDT)
{future}(BNBUSDT)
I said it earlier at noon: personally, I lean toward moving downward. As it turns out, today really dipped in two waves and even put in a fresh low.
For the brothers who accumulated at the bottom—remember to use a trailing/adjustable stop loss. Lock in the profits first.
My overnight plan is simple:
1. $BTC : If it bounces to around 79,500, you can short with a small position. If it pushes up, then add in batches between 80,500 and 82,000. Set a stop loss at 83,500. If it doesn’t bounce up, then when it pulls back to around 77,500, lightly go long. If it breaks down, then add between 76,000 and 74,500. Set a stop loss at 73,500.
2. $ETH : Short the rebound by 2,500 points, and add at 2,535–2,565 with a stop loss at 2,590. If it pulls back to 2,460, go long, add between 2,430–2,395, and set a stop loss at 2,375.
3. $BNB : Short at 757. Add between 770–780, stop loss at 790. Go long at 745, add between 735–720, stop loss at 710.
4. SOL: Short at 104. Add between 105.8–107, stop loss at 109. Go long at 102, add between 100–98, stop loss at 97.#美加关税战升级 #比特币ETF年内仍缺10亿美元
Remember: if at night it can’t even reach yesterday morning’s high, then you’ll have to probe further downward. Once it reaches the support area, just pick up positions in batches.
For the brothers who accumulated at the bottom—remember to use a trailing/adjustable stop loss. Lock in the profits first.
My overnight plan is simple:
1. $BTC : If it bounces to around 79,500, you can short with a small position. If it pushes up, then add in batches between 80,500 and 82,000. Set a stop loss at 83,500. If it doesn’t bounce up, then when it pulls back to around 77,500, lightly go long. If it breaks down, then add between 76,000 and 74,500. Set a stop loss at 73,500.
2. $ETH : Short the rebound by 2,500 points, and add at 2,535–2,565 with a stop loss at 2,590. If it pulls back to 2,460, go long, add between 2,430–2,395, and set a stop loss at 2,375.
3. $BNB : Short at 757. Add between 770–780, stop loss at 790. Go long at 745, add between 735–720, stop loss at 710.
4. SOL: Short at 104. Add between 105.8–107, stop loss at 109. Go long at 102, add between 100–98, stop loss at 97.#美加关税战升级 #比特币ETF年内仍缺10亿美元
Remember: if at night it can’t even reach yesterday morning’s high, then you’ll have to probe further downward. Once it reaches the support area, just pick up positions in batches.
399
·
--
Has BTC 82,300 topped? This level is crucial:
As shown in Figure 1, if BTC can hold above the purple Gann angle line at 78,900, there is still potential for further upside. The farther it deviates downward from this level and the longer it stays there, the higher the probability that 82,300 is forming a stage top.
Even if new highs occur, if it cannot break through the strong resistance zone of 82,700–83,500, the rally will not have sustainability. Most likely, it will be just a wick on the weekly chart—or even on the daily chart.
If it breaks below 76,200 and cannot reclaim it, the probability that 82,300 is the stage top increases significantly—so the question is: if 82,300 is in fact the top, how low can it fall?
We use 0 and 15,400 as the starting points, and 126,199 as the endpoint, to draw the red and green Gann angle lines.
As shown in Figure 2, since February 2026, by combining Gann time turning points with the red and green Gann angle lines, we have essentially nailed almost all of BTC’s daily-level highs and lows.
Therefore, if a stage top is confirmed, we should pay close attention to the support roles of the red 2/1 and green 3/1 below. By then, they will be located at 67,800 and 65,400, respectively.
Next week has many major events, including a clear bill. News can mislead, and emotions can move people—but the structure and levels will not. #BTC走势分析 $BTC
{future}(BTCUSDT)
Has BTC 82,300 topped? This level is crucial:
As shown in Figure 1, if BTC can hold above the purple Gann angle line at 78,900, there is still potential for further upside. The farther it deviates downward from this level and the longer it stays there, the higher the probability that 82,300 is forming a stage top.
Even if new highs occur, if it cannot break through the strong resistance zone of 82,700–83,500, the rally will not have sustainability. Most likely, it will be just a wick on the weekly chart—or even on the daily chart.
If it breaks below 76,200 and cannot reclaim it, the probability that 82,300 is the stage top increases significantly—so the question is: if 82,300 is in fact the top, how low can it fall?
We use 0 and 15,400 as the starting points, and 126,199 as the endpoint, to draw the red and green Gann angle lines.
As shown in Figure 2, since February 2026, by combining Gann time turning points with the red and green Gann angle lines, we have essentially nailed almost all of BTC’s daily-level highs and lows.
Therefore, if a stage top is confirmed, we should pay close attention to the support roles of the red 2/1 and green 3/1 below. By then, they will be located at 67,800 and 65,400, respectively.
Next week has many major events, including a clear bill. News can mislead, and emotions can move people—but the structure and levels will not. #BTC走势分析 $BTC
As shown in Figure 1, if BTC can hold above the purple Gann angle line at 78,900, there is still potential for further upside. The farther it deviates downward from this level and the longer it stays there, the higher the probability that 82,300 is forming a stage top.
Even if new highs occur, if it cannot break through the strong resistance zone of 82,700–83,500, the rally will not have sustainability. Most likely, it will be just a wick on the weekly chart—or even on the daily chart.
If it breaks below 76,200 and cannot reclaim it, the probability that 82,300 is the stage top increases significantly—so the question is: if 82,300 is in fact the top, how low can it fall?
We use 0 and 15,400 as the starting points, and 126,199 as the endpoint, to draw the red and green Gann angle lines.
As shown in Figure 2, since February 2026, by combining Gann time turning points with the red and green Gann angle lines, we have essentially nailed almost all of BTC’s daily-level highs and lows.
Therefore, if a stage top is confirmed, we should pay close attention to the support roles of the red 2/1 and green 3/1 below. By then, they will be located at 67,800 and 65,400, respectively.
Next week has many major events, including a clear bill. News can mislead, and emotions can move people—but the structure and levels will not. #BTC走势分析 $BTC


3
1.1k
·
--
Good afternoon, old buddies! Last night, besides BNB, the other three brothers all nailed the insertion right near the daily long/short lines—like they’d agreed beforehand. Today we’ll keep our eyes on the bottom of that pin from last night—
Only if there’s a strong breakdown will the daily chart count as a real pullback, dropping down to probe the bottom of the sideways range. If it doesn’t break, then a smaller timeframe will definitely give you some soup to drink—no way a bounce doesn’t come.
This is how I’m thinking: after that wild rally last month, it hasn’t had a proper deep dip yet. Now the price is again stuck in the upper half of the daily sideways range. Subjectively, I lean more toward it dropping down a bit. So if it bounces up today, shorts have to be arranged and held—so it feels solid in my hands. Worst case, I place the stop-loss above the prior high; any loss is basically paying a little fee as “protection money.” What about longs? Put them on lightly in advance at the support below, take a nap, and let it fill on its own—slow is fast.
As for the specific levels—same old rules, remember these:
• BTC: Only counts as a pullback if it breaks below 78700. Longs set at 77200-75600-74300; shorts wait around 79500 to enter lightly. If it breaks out, add more at 80500-82000.
• ETH: Only counts as a pullback if it breaks below 2460. Longs set at 2430-2395-2356; shorts wait around 2510 to enter lightly. If it breaks out, add more at 2530-2565.
• BNB: This one has its own independent play—watch 745 closely. Only when the 4-hour closes back above does this pullback finish. Sell short in batches with light size at 757-770-780. If it dips, go long at 733; if it breaks below, then add/adjust at 720-705.
• SOL: Only counts as a pullback if it breaks below 103. Longs set at 101-99-97; shorts wait for 105 to enter lightly. If it breaks out, add more at 107-108.5.
In short: if the prior low doesn’t break, treat it as ranging. If it breaks, follow the trend to drink some soup. Control your position sizing—let’s move steadily. Don’t rush into going all-in with one shot. This market never lacks opportunities; what’s missing is the old-timers’ ability to survive to the next bull cycle! 😎#BTC走势分析 #ETH走势分析 $BTC
{future}(BTCUSDT)
$ETH
{future}(ETHUSDT)
$BNB
{future}(BNBUSDT)
Good afternoon, old buddies! Last night, besides BNB, the other three brothers all nailed the insertion right near the daily long/short lines—like they’d agreed beforehand. Today we’ll keep our eyes on the bottom of that pin from last night—
Only if there’s a strong breakdown will the daily chart count as a real pullback, dropping down to probe the bottom of the sideways range. If it doesn’t break, then a smaller timeframe will definitely give you some soup to drink—no way a bounce doesn’t come.
This is how I’m thinking: after that wild rally last month, it hasn’t had a proper deep dip yet. Now the price is again stuck in the upper half of the daily sideways range. Subjectively, I lean more toward it dropping down a bit. So if it bounces up today, shorts have to be arranged and held—so it feels solid in my hands. Worst case, I place the stop-loss above the prior high; any loss is basically paying a little fee as “protection money.” What about longs? Put them on lightly in advance at the support below, take a nap, and let it fill on its own—slow is fast.
As for the specific levels—same old rules, remember these:
• BTC: Only counts as a pullback if it breaks below 78700. Longs set at 77200-75600-74300; shorts wait around 79500 to enter lightly. If it breaks out, add more at 80500-82000.
• ETH: Only counts as a pullback if it breaks below 2460. Longs set at 2430-2395-2356; shorts wait around 2510 to enter lightly. If it breaks out, add more at 2530-2565.
• BNB: This one has its own independent play—watch 745 closely. Only when the 4-hour closes back above does this pullback finish. Sell short in batches with light size at 757-770-780. If it dips, go long at 733; if it breaks below, then add/adjust at 720-705.
• SOL: Only counts as a pullback if it breaks below 103. Longs set at 101-99-97; shorts wait for 105 to enter lightly. If it breaks out, add more at 107-108.5.
In short: if the prior low doesn’t break, treat it as ranging. If it breaks, follow the trend to drink some soup. Control your position sizing—let’s move steadily. Don’t rush into going all-in with one shot. This market never lacks opportunities; what’s missing is the old-timers’ ability to survive to the next bull cycle! 😎#BTC走势分析 #ETH走势分析 $BTC
$ETH
$BNB
Only if there’s a strong breakdown will the daily chart count as a real pullback, dropping down to probe the bottom of the sideways range. If it doesn’t break, then a smaller timeframe will definitely give you some soup to drink—no way a bounce doesn’t come.
This is how I’m thinking: after that wild rally last month, it hasn’t had a proper deep dip yet. Now the price is again stuck in the upper half of the daily sideways range. Subjectively, I lean more toward it dropping down a bit. So if it bounces up today, shorts have to be arranged and held—so it feels solid in my hands. Worst case, I place the stop-loss above the prior high; any loss is basically paying a little fee as “protection money.” What about longs? Put them on lightly in advance at the support below, take a nap, and let it fill on its own—slow is fast.
As for the specific levels—same old rules, remember these:
• BTC: Only counts as a pullback if it breaks below 78700. Longs set at 77200-75600-74300; shorts wait around 79500 to enter lightly. If it breaks out, add more at 80500-82000.
• ETH: Only counts as a pullback if it breaks below 2460. Longs set at 2430-2395-2356; shorts wait around 2510 to enter lightly. If it breaks out, add more at 2530-2565.
• BNB: This one has its own independent play—watch 745 closely. Only when the 4-hour closes back above does this pullback finish. Sell short in batches with light size at 757-770-780. If it dips, go long at 733; if it breaks below, then add/adjust at 720-705.
• SOL: Only counts as a pullback if it breaks below 103. Longs set at 101-99-97; shorts wait for 105 to enter lightly. If it breaks out, add more at 107-108.5.
In short: if the prior low doesn’t break, treat it as ranging. If it breaks, follow the trend to drink some soup. Control your position sizing—let’s move steadily. Don’t rush into going all-in with one shot. This market never lacks opportunities; what’s missing is the old-timers’ ability to survive to the next bull cycle! 😎#BTC走势分析 #ETH走势分析 $BTC
$ETH
$BNB
404
·
--
BTC won’t be taken from (or: BTC won’t be looted)—let’s do an EQL. Liquidity in the upper and lower ranges is currently waiting to be taken.
BTC is still ranging.
Ranging creates altcoin opportunities.
If an altcoin retraces back to the right position, you can watch for a buy. Of course, since BTC hasn’t chosen a direction, altcoin perps traders should stop losses more often. #Zcash周涨45%创2016年来新高 #BTC走势分析 $BTC
{future}(BTCUSDT)
BTC won’t be taken from (or: BTC won’t be looted)—let’s do an EQL. Liquidity in the upper and lower ranges is currently waiting to be taken.
BTC is still ranging.
Ranging creates altcoin opportunities.
If an altcoin retraces back to the right position, you can watch for a buy. Of course, since BTC hasn’t chosen a direction, altcoin perps traders should stop losses more often. #Zcash周涨45%创2016年来新高 #BTC走势分析 $BTC
BTC is still ranging.
Ranging creates altcoin opportunities.
If an altcoin retraces back to the right position, you can watch for a buy. Of course, since BTC hasn’t chosen a direction, altcoin perps traders should stop losses more often. #Zcash周涨45%创2016年来新高 #BTC走势分析 $BTC
330
·
--
On September 4, ETH spot ETF total holdings rose to 6,315,954.27 ETH, with a net increase of 25,164.34 ETH on the day. Although this figure is lower than September 3’s 62,835.71 ETH, after a large net outflow on September 2, ETH has returned to net inflows for two consecutive days. And as of this week to date, cumulative net additions have reached 112,010.58 ETH.
Over the last 7 trading days, cumulative net additions totaled 234,162.28 ETH, and since the beginning of September, cumulative gains have reached 60,012.46 ETH. From the broader trend, ETH’s capital position is still clearly stronger than BTC. Since 2026, cumulative net additions have expanded to 200,486.69 ETH, and total holdings continue to hit new highs.
So ETH’s current situation is quite clear: even though the pace of accumulation isn’t as aggressive as the day before, top-tier products are still steadily adding, and there hasn’t been any widespread pullback. If core products like BlackRock can continue to maintain dominance in driving inflows, ETH’s capital strength in the near term will very likely keep outperforming BTC.#ETH走势分析 $ETH
{future}(ETHUSDT)
On September 4, ETH spot ETF total holdings rose to 6,315,954.27 ETH, with a net increase of 25,164.34 ETH on the day. Although this figure is lower than September 3’s 62,835.71 ETH, after a large net outflow on September 2, ETH has returned to net inflows for two consecutive days. And as of this week to date, cumulative net additions have reached 112,010.58 ETH.
Over the last 7 trading days, cumulative net additions totaled 234,162.28 ETH, and since the beginning of September, cumulative gains have reached 60,012.46 ETH. From the broader trend, ETH’s capital position is still clearly stronger than BTC. Since 2026, cumulative net additions have expanded to 200,486.69 ETH, and total holdings continue to hit new highs.
So ETH’s current situation is quite clear: even though the pace of accumulation isn’t as aggressive as the day before, top-tier products are still steadily adding, and there hasn’t been any widespread pullback. If core products like BlackRock can continue to maintain dominance in driving inflows, ETH’s capital strength in the near term will very likely keep outperforming BTC.#ETH走势分析 $ETH
Over the last 7 trading days, cumulative net additions totaled 234,162.28 ETH, and since the beginning of September, cumulative gains have reached 60,012.46 ETH. From the broader trend, ETH’s capital position is still clearly stronger than BTC. Since 2026, cumulative net additions have expanded to 200,486.69 ETH, and total holdings continue to hit new highs.
So ETH’s current situation is quite clear: even though the pace of accumulation isn’t as aggressive as the day before, top-tier products are still steadily adding, and there hasn’t been any widespread pullback. If core products like BlackRock can continue to maintain dominance in driving inflows, ETH’s capital strength in the near term will very likely keep outperforming BTC.#ETH走势分析 $ETH

290
·
--
September 4 BTC spot ETF total holdings rise to 1,269,012.56 BTC. Net additions for the day are 1,721.95 BTC. For the second consecutive trading day, it remains a net inflow; however, compared with the sharp net increase of 8,206.67 BTC on September 3, today’s inflow is clearly much slower.
That means the capital is still continuing to replenish, but the力度 of chasing prices is no longer as strong as the day before. So far this week, cumulative net additions are 11,011.68 BTC. Over the most recent seven trading days, cumulative net additions are 11,533.23 BTC. Since the start of September, cumulative additions are 8,411.72 BTC. This latest round of replenishment has basically repaired the early-September volatility, and the year-to-date cumulative net reduction has narrowed to 28,954.38 BTC—meaning it has been replenished a step further compared with the past few days.
A recent feature of BTC is that although overall it is still seeing inflows, the increase is mainly supported by top-tier products rather than broad-based buying across the board. The positive side is that total holdings have already moved to near the highs of this latest cycle. What still needs to be watched is whether it can continue to sustain daily net inflows at the level of a few thousand units. If it then drops back to around one or two thousand, or even turns negative, the strength of this replenishment cycle would be somewhat weaker.#BTC走势分析 $BTC
{future}(BTCUSDT)
September 4 BTC spot ETF total holdings rise to 1,269,012.56 BTC. Net additions for the day are 1,721.95 BTC. For the second consecutive trading day, it remains a net inflow; however, compared with the sharp net increase of 8,206.67 BTC on September 3, today’s inflow is clearly much slower.
That means the capital is still continuing to replenish, but the力度 of chasing prices is no longer as strong as the day before. So far this week, cumulative net additions are 11,011.68 BTC. Over the most recent seven trading days, cumulative net additions are 11,533.23 BTC. Since the start of September, cumulative additions are 8,411.72 BTC. This latest round of replenishment has basically repaired the early-September volatility, and the year-to-date cumulative net reduction has narrowed to 28,954.38 BTC—meaning it has been replenished a step further compared with the past few days.
A recent feature of BTC is that although overall it is still seeing inflows, the increase is mainly supported by top-tier products rather than broad-based buying across the board. The positive side is that total holdings have already moved to near the highs of this latest cycle. What still needs to be watched is whether it can continue to sustain daily net inflows at the level of a few thousand units. If it then drops back to around one or two thousand, or even turns negative, the strength of this replenishment cycle would be somewhat weaker.#BTC走势分析 $BTC
That means the capital is still continuing to replenish, but the力度 of chasing prices is no longer as strong as the day before. So far this week, cumulative net additions are 11,011.68 BTC. Over the most recent seven trading days, cumulative net additions are 11,533.23 BTC. Since the start of September, cumulative additions are 8,411.72 BTC. This latest round of replenishment has basically repaired the early-September volatility, and the year-to-date cumulative net reduction has narrowed to 28,954.38 BTC—meaning it has been replenished a step further compared with the past few days.
A recent feature of BTC is that although overall it is still seeing inflows, the increase is mainly supported by top-tier products rather than broad-based buying across the board. The positive side is that total holdings have already moved to near the highs of this latest cycle. What still needs to be watched is whether it can continue to sustain daily net inflows at the level of a few thousand units. If it then drops back to around one or two thousand, or even turns negative, the strength of this replenishment cycle would be somewhat weaker.#BTC走势分析 $BTC

3.3k
Log in to explore more content
Join global crypto users on Binance Square
⚡️ Get latest and useful information about crypto.
💬 Trusted by the world’s largest crypto exchange.
👍 Discover real insights from verified creators.
Email / Phone number
Trending Topics
BitcoinReboundsTo$79K
22,650 views
210 Discussing
🚨 $BTC is pushing higher.
Bitcoin is trading around $78,804, up roughly 1.9%, after reclaiming the $78K area. The next level to watch is the intraday high near $78,905.
A clean break above that level could open the way toward $79K–$80K. If BTC gets rejected, support sits around $78,300, then $77,975.
Bulls have momentum, but BTC needs to hold above $78K.
#Bitcoin #BTC #CryptoTrading #CryptoMarket #CryptoAnalysis
PulseON
·18 Likes
·18.3k views
BitcoinSpotETFsNetInflow$160M
671 views
47 Discussing
SouthKoreaCryptoTaxDelayPetitionTops50000
15,696 views
441 Discussing