
ăn rau muống
107 Posts

ăn rau muống
Report
Block User
tôi sẽ cung cấp thông tin mỗi ngày và phân tích cơ bản. Theo dõi tôi để có thể nắm bắt thông tin mỗi ngày
7 Following
13 Followers
16 Liked
Posts
·
--
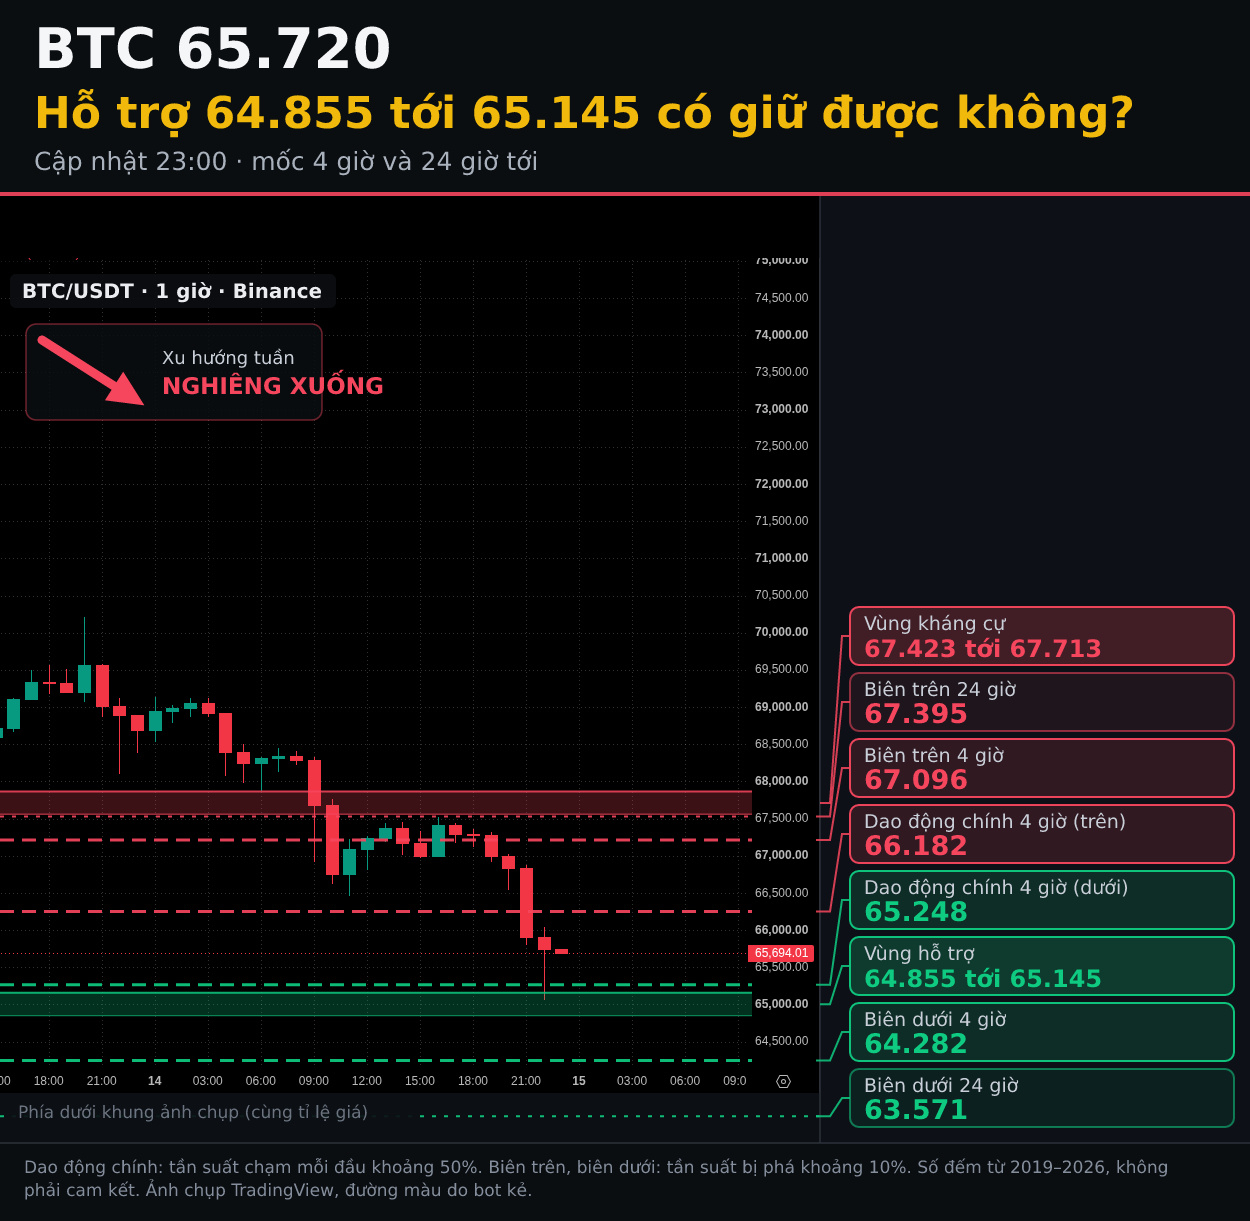
Hey everyone, $BTC down 4.3% in 24 hours, now at 65.720. $ETH down 4.5%. What levels should we watch next?
📉 Weekly trend: LEANING DOWN. Since 2019, there have been 228 days like this; BTC was lower one week later 58% of the time (ETH follows BTC: lower 58% of the time). This signal is weaker than usual.
🧭 The trend-following trade is SHORT: BTC was lower one week later 58% of the time, versus 42% for longs. Going long now means trading against the trend. The difference is small, so the edge is slim.
This section gives ranges, not the direction for the next 4 hours.
🟠 BTC · 65.720 · down 1.9% over the past 4 hours
📍 Expected range for the next 4 hours (until 03:00):
• Main range: 65.248 to 66.182.
• Upper boundary: 67.096, lower boundary: 64.282.
📆 Expected range for the next 24 hours:
• Main range: 65.003 to 66.314.
• Upper boundary: 67.395, lower boundary: 63.571.
🧱 Over the next 7 days, the lower level is more likely to be reached than the upper one, in line with the weekly trend: support at 64.855 to 65.145 has an 86% chance of being reached and a 61% chance of being decisively broken; resistance at 67.423 to 67.713 has a 55% chance of being reached and a 26% chance of being decisively broken.
👉 As long as BTC remains below the resistance zone of 67.423 to 67.713, sellers have the advantage.
🔷 ETH · 1.840 · down 3.1% over the past 4 hours
📍 Expected range for the next 4 hours (until 03:00):
• Main range: 1.821 to 1.859.
• Upper boundary: 1.896, lower boundary: 1.782.
📆 Expected range for the next 24 hours:
• Main range: 1.810 to 1.869.
• Upper boundary: 1.922, lower boundary: 1.743.
🧱 Over the next 7 days, the lower level is more likely to be reached than the upper one, in line with the weekly trend: support at 1.794 to 1.806 has an 80% chance of being reached and a 51% chance of being decisively broken; resistance at 1.890 to 1.906 has a 64% chance of being reached and a 33% chance of being decisively broken.
👉 As long as ETH remains below the resistance zone of 1.890 to 1.906, sellers have the advantage.
🌐 News currently affecting prices:
• Negative news, high impact: Fed's Collins says gradual, steady rate increases are appropriate (14/11).
• Negative news, moderate impact: Ethereum falls more than 5% as ETFs see outflows and many positions are liquidated (14/11).
Levels and percentages are based on historical market statistics from 2019 to 2026: the main range has about a 50% chance of being reached at each end, while the upper and lower boundaries have about a 10% chance of being breached. This is not investment advice. Manage your risk before entering a trade.
#BTC #ETH
Hey everyone, $BTC down 4.3% in 24 hours, now at 65.720. $ETH down 4.5%. What levels should we watch next?
📉 Weekly trend: LEANING DOWN. Since 2019, there have been 228 days like this; BTC was lower one week later 58% of the time (ETH follows BTC: lower 58% of the time). This signal is weaker than usual.
🧭 The trend-following trade is SHORT: BTC was lower one week later 58% of the time, versus 42% for longs. Going long now means trading against the trend. The difference is small, so the edge is slim.
This section gives ranges, not the direction for the next 4 hours.
🟠 BTC · 65.720 · down 1.9% over the past 4 hours
📍 Expected range for the next 4 hours (until 03:00):
• Main range: 65.248 to 66.182.
• Upper boundary: 67.096, lower boundary: 64.282.
📆 Expected range for the next 24 hours:
• Main range: 65.003 to 66.314.
• Upper boundary: 67.395, lower boundary: 63.571.
🧱 Over the next 7 days, the lower level is more likely to be reached than the upper one, in line with the weekly trend: support at 64.855 to 65.145 has an 86% chance of being reached and a 61% chance of being decisively broken; resistance at 67.423 to 67.713 has a 55% chance of being reached and a 26% chance of being decisively broken.
👉 As long as BTC remains below the resistance zone of 67.423 to 67.713, sellers have the advantage.
🔷 ETH · 1.840 · down 3.1% over the past 4 hours
📍 Expected range for the next 4 hours (until 03:00):
• Main range: 1.821 to 1.859.
• Upper boundary: 1.896, lower boundary: 1.782.
📆 Expected range for the next 24 hours:
• Main range: 1.810 to 1.869.
• Upper boundary: 1.922, lower boundary: 1.743.
🧱 Over the next 7 days, the lower level is more likely to be reached than the upper one, in line with the weekly trend: support at 1.794 to 1.806 has an 80% chance of being reached and a 51% chance of being decisively broken; resistance at 1.890 to 1.906 has a 64% chance of being reached and a 33% chance of being decisively broken.
👉 As long as ETH remains below the resistance zone of 1.890 to 1.906, sellers have the advantage.
🌐 News currently affecting prices:
• Negative news, high impact: Fed's Collins says gradual, steady rate increases are appropriate (14/11).
• Negative news, moderate impact: Ethereum falls more than 5% as ETFs see outflows and many positions are liquidated (14/11).
Levels and percentages are based on historical market statistics from 2019 to 2026: the main range has about a 50% chance of being reached at each end, while the upper and lower boundaries have about a 10% chance of being breached. This is not investment advice. Manage your risk before entering a trade.
#BTC #ETH
📉 Weekly trend: LEANING DOWN. Since 2019, there have been 228 days like this; BTC was lower one week later 58% of the time (ETH follows BTC: lower 58% of the time). This signal is weaker than usual.
🧭 The trend-following trade is SHORT: BTC was lower one week later 58% of the time, versus 42% for longs. Going long now means trading against the trend. The difference is small, so the edge is slim.
This section gives ranges, not the direction for the next 4 hours.
🟠 BTC · 65.720 · down 1.9% over the past 4 hours
📍 Expected range for the next 4 hours (until 03:00):
• Main range: 65.248 to 66.182.
• Upper boundary: 67.096, lower boundary: 64.282.
📆 Expected range for the next 24 hours:
• Main range: 65.003 to 66.314.
• Upper boundary: 67.395, lower boundary: 63.571.
🧱 Over the next 7 days, the lower level is more likely to be reached than the upper one, in line with the weekly trend: support at 64.855 to 65.145 has an 86% chance of being reached and a 61% chance of being decisively broken; resistance at 67.423 to 67.713 has a 55% chance of being reached and a 26% chance of being decisively broken.
👉 As long as BTC remains below the resistance zone of 67.423 to 67.713, sellers have the advantage.
🔷 ETH · 1.840 · down 3.1% over the past 4 hours
📍 Expected range for the next 4 hours (until 03:00):
• Main range: 1.821 to 1.859.
• Upper boundary: 1.896, lower boundary: 1.782.
📆 Expected range for the next 24 hours:
• Main range: 1.810 to 1.869.
• Upper boundary: 1.922, lower boundary: 1.743.
🧱 Over the next 7 days, the lower level is more likely to be reached than the upper one, in line with the weekly trend: support at 1.794 to 1.806 has an 80% chance of being reached and a 51% chance of being decisively broken; resistance at 1.890 to 1.906 has a 64% chance of being reached and a 33% chance of being decisively broken.
👉 As long as ETH remains below the resistance zone of 1.890 to 1.906, sellers have the advantage.
🌐 News currently affecting prices:
• Negative news, high impact: Fed's Collins says gradual, steady rate increases are appropriate (14/11).
• Negative news, moderate impact: Ethereum falls more than 5% as ETFs see outflows and many positions are liquidated (14/11).
Levels and percentages are based on historical market statistics from 2019 to 2026: the main range has about a 50% chance of being reached at each end, while the upper and lower boundaries have about a 10% chance of being breached. This is not investment advice. Manage your risk before entering a trade.
#BTC #ETH
33
·
--
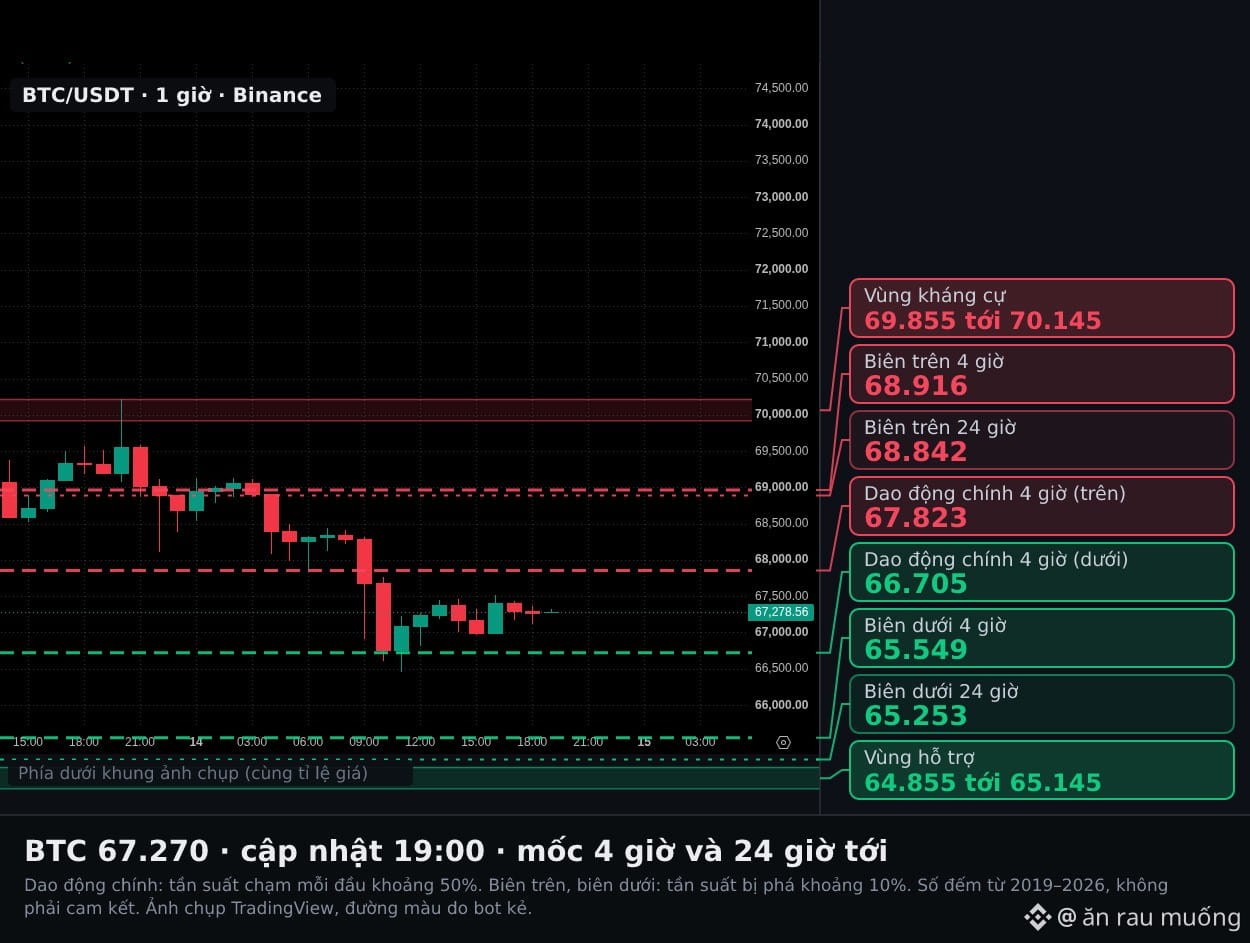
$BTC 67.270: can the support zone from 64.855 to 65.145 hold? $ETH is at 1.912.
📉 Weekly trend: BEARISH. Since 2019, there have been 228 similar days; 58% of the time BTC was lower a week later (ETH follows BTC: lower 58% of the time). This signal is weaker than usual.
🧭 The trend-following trade is SHORT: BTC was lower a week later 58% of the time, while the long side was right only 42% of the time. Going long now means trading against the trend. The difference isn't large, so the edge is slim.
🟠 BTC · 67.270 · +0,4% over the past 4 hours
📍 Next 4 hours (until 23:00):
• Upper bound 68.916
• Main trading range 66.705 to 67.823
• Lower bound 65.549
📆 Next 24 hours:
• Upper bound 68.842
• Main trading range 66.597 to 67.828
• Lower bound 65.253
🧱 Over the next 7 days, the lower side is more likely to be reached than the upper side, in line with the weekly trend: support at 64.855 to 65.145 has a 63% chance of being reached and a 41% chance of being decisively broken; resistance at 69.855 to 70.145 has a 44% chance of being reached and a 23% chance of being decisively broken.
🎯 As long as BTC stays below the resistance zone from 69.855 to 70.145, sellers retain the advantage.
🔷 ETH · 1.912 · +0,9% over the past 4 hours
📍 Next 4 hours (until 23:00):
• Upper bound 1.960
• Main trading range 1.895 to 1.928
• Lower bound 1.861
📆 Next 24 hours:
• Upper bound 1.973
• Main trading range 1.889 to 1.934
• Lower bound 1.838
🧱 Over the next 7 days, the lower side is more likely to be reached than the upper side, in line with the weekly trend: support at 1.794 to 1.806 has a 57% chance of being reached and a 37% chance of being decisively broken; resistance at 1.994 to 2.027 has a 44% chance of being reached and a 26% chance of being decisively broken.
🎯 As long as ETH stays below the resistance zone from 1.994 to 2.027, sellers retain the advantage.
🌐 News currently affecting prices:
• Negative news, high impact: US inflation accelerates again, and Fed officials send further hawkish signals (14/11).
• Negative news, moderate impact: US spot bitcoin ETFs see $185 million in net outflows, marking the seventh consecutive day of net outflows (14/11).
Levels and percentages are based on historical market statistics from 2019 to 2026: the main trading range has about a 50% chance of being reached at either end, while the upper and lower bounds each have about a 10% chance of being breached. This is not investment advice. Manage your capital before entering a trade.
#BTC #ETH
$BTC 67.270: can the support zone from 64.855 to 65.145 hold? $ETH is at 1.912.
📉 Weekly trend: BEARISH. Since 2019, there have been 228 similar days; 58% of the time BTC was lower a week later (ETH follows BTC: lower 58% of the time). This signal is weaker than usual.
🧭 The trend-following trade is SHORT: BTC was lower a week later 58% of the time, while the long side was right only 42% of the time. Going long now means trading against the trend. The difference isn't large, so the edge is slim.
🟠 BTC · 67.270 · +0,4% over the past 4 hours
📍 Next 4 hours (until 23:00):
• Upper bound 68.916
• Main trading range 66.705 to 67.823
• Lower bound 65.549
📆 Next 24 hours:
• Upper bound 68.842
• Main trading range 66.597 to 67.828
• Lower bound 65.253
🧱 Over the next 7 days, the lower side is more likely to be reached than the upper side, in line with the weekly trend: support at 64.855 to 65.145 has a 63% chance of being reached and a 41% chance of being decisively broken; resistance at 69.855 to 70.145 has a 44% chance of being reached and a 23% chance of being decisively broken.
🎯 As long as BTC stays below the resistance zone from 69.855 to 70.145, sellers retain the advantage.
🔷 ETH · 1.912 · +0,9% over the past 4 hours
📍 Next 4 hours (until 23:00):
• Upper bound 1.960
• Main trading range 1.895 to 1.928
• Lower bound 1.861
📆 Next 24 hours:
• Upper bound 1.973
• Main trading range 1.889 to 1.934
• Lower bound 1.838
🧱 Over the next 7 days, the lower side is more likely to be reached than the upper side, in line with the weekly trend: support at 1.794 to 1.806 has a 57% chance of being reached and a 37% chance of being decisively broken; resistance at 1.994 to 2.027 has a 44% chance of being reached and a 26% chance of being decisively broken.
🎯 As long as ETH stays below the resistance zone from 1.994 to 2.027, sellers retain the advantage.
🌐 News currently affecting prices:
• Negative news, high impact: US inflation accelerates again, and Fed officials send further hawkish signals (14/11).
• Negative news, moderate impact: US spot bitcoin ETFs see $185 million in net outflows, marking the seventh consecutive day of net outflows (14/11).
Levels and percentages are based on historical market statistics from 2019 to 2026: the main trading range has about a 50% chance of being reached at either end, while the upper and lower bounds each have about a 10% chance of being breached. This is not investment advice. Manage your capital before entering a trade.
#BTC #ETH
📉 Weekly trend: BEARISH. Since 2019, there have been 228 similar days; 58% of the time BTC was lower a week later (ETH follows BTC: lower 58% of the time). This signal is weaker than usual.
🧭 The trend-following trade is SHORT: BTC was lower a week later 58% of the time, while the long side was right only 42% of the time. Going long now means trading against the trend. The difference isn't large, so the edge is slim.
🟠 BTC · 67.270 · +0,4% over the past 4 hours
📍 Next 4 hours (until 23:00):
• Upper bound 68.916
• Main trading range 66.705 to 67.823
• Lower bound 65.549
📆 Next 24 hours:
• Upper bound 68.842
• Main trading range 66.597 to 67.828
• Lower bound 65.253
🧱 Over the next 7 days, the lower side is more likely to be reached than the upper side, in line with the weekly trend: support at 64.855 to 65.145 has a 63% chance of being reached and a 41% chance of being decisively broken; resistance at 69.855 to 70.145 has a 44% chance of being reached and a 23% chance of being decisively broken.
🎯 As long as BTC stays below the resistance zone from 69.855 to 70.145, sellers retain the advantage.
🔷 ETH · 1.912 · +0,9% over the past 4 hours
📍 Next 4 hours (until 23:00):
• Upper bound 1.960
• Main trading range 1.895 to 1.928
• Lower bound 1.861
📆 Next 24 hours:
• Upper bound 1.973
• Main trading range 1.889 to 1.934
• Lower bound 1.838
🧱 Over the next 7 days, the lower side is more likely to be reached than the upper side, in line with the weekly trend: support at 1.794 to 1.806 has a 57% chance of being reached and a 37% chance of being decisively broken; resistance at 1.994 to 2.027 has a 44% chance of being reached and a 26% chance of being decisively broken.
🎯 As long as ETH stays below the resistance zone from 1.994 to 2.027, sellers retain the advantage.
🌐 News currently affecting prices:
• Negative news, high impact: US inflation accelerates again, and Fed officials send further hawkish signals (14/11).
• Negative news, moderate impact: US spot bitcoin ETFs see $185 million in net outflows, marking the seventh consecutive day of net outflows (14/11).
Levels and percentages are based on historical market statistics from 2019 to 2026: the main trading range has about a 50% chance of being reached at either end, while the upper and lower bounds each have about a 10% chance of being breached. This is not investment advice. Manage your capital before entering a trade.
#BTC #ETH
54
·
--
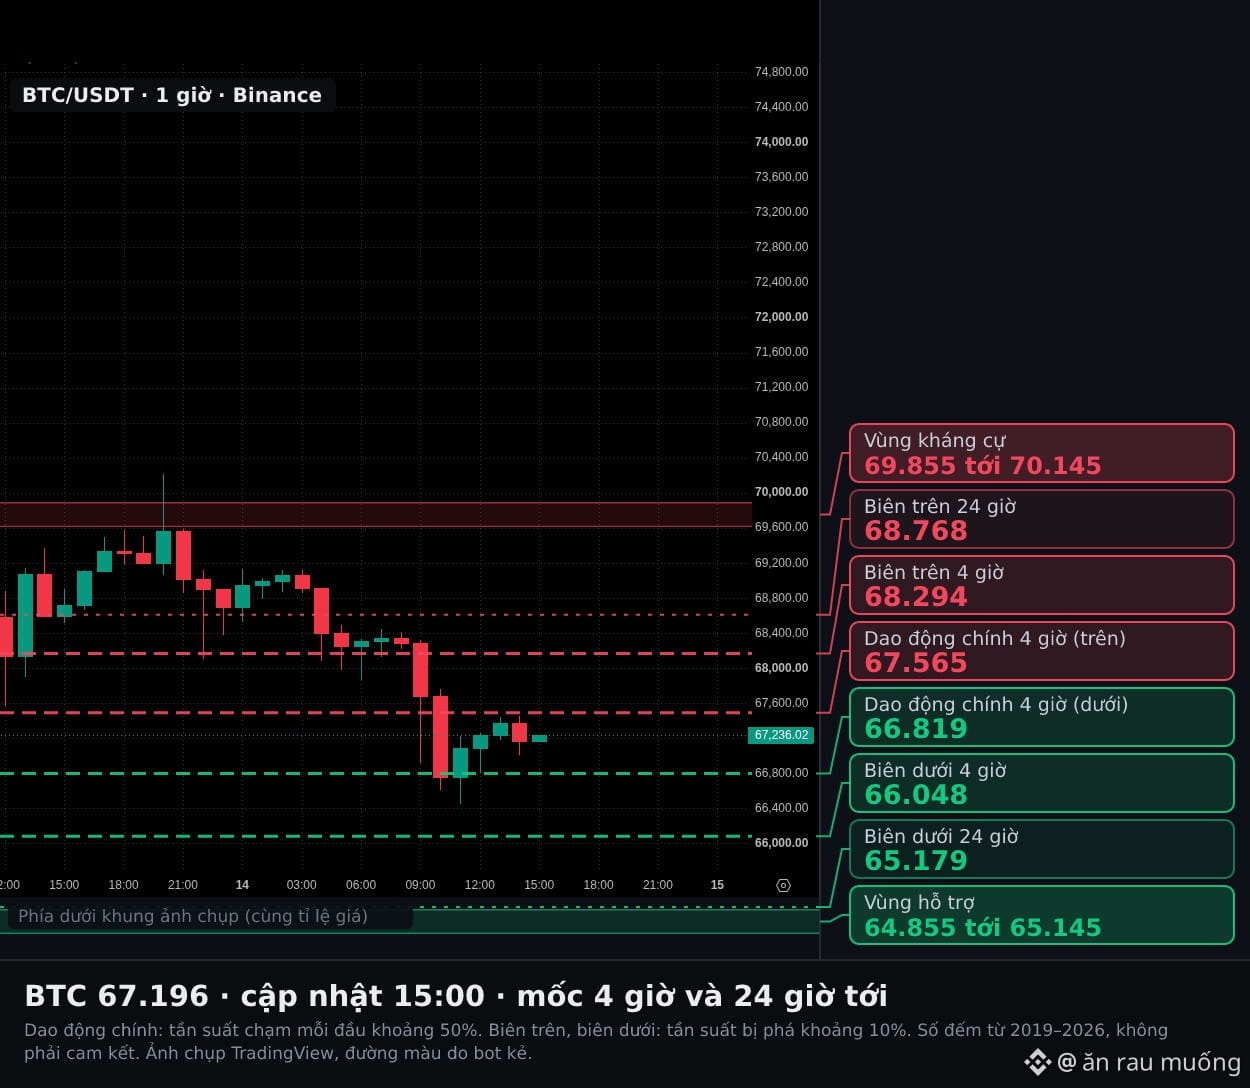
$BTC 67.196 · $ETH 1.900: the weekly trend is tilted downward—who has the advantage, and at what levels does it end?
📉 Weekly trend: TILTED DOWNWARD. Since 2019, there have been 228 days like this; BTC was lower one week later 58% of the time (ETH follows BTC: lower 58% of the time). This signal is weaker than usual.
🧭 The trend-following trade is SHORT: BTC was lower one week later 58% of the time, while the long side was right only 42% of the time. Going long now means trading against the trend. The difference is not large, so the advantage is slim.
🟠 BTC · 67.196 · +0,2% over the past 4 hours
🧱 Over the next 7 days, the lower levels are more likely to be touched than the upper ones, in line with the weekly trend: support at 64.855 to 65.145 has a 63% chance of being touched and a 41% chance of being decisively broken; resistance at 69.855 to 70.145 has a 44% chance of being touched and a 23% chance of being decisively broken.
👉 As long as BTC remains below the resistance zone of 69.855 to 70.145, sellers retain the advantage.
📍 4-hour timeframe (through 19:00): main trading range 66.819 to 67.565; upper bound 68.294, lower bound 66.048.
📆 24-hour timeframe: main trading range 66.523 to 67.754; upper bound 68.768, lower bound 65.179.
🔷 ETH · 1.900 · 0,0% over the past 4 hours
🧱 Over the next 7 days, the lower levels are more likely to be touched than the upper ones, in line with the weekly trend: support at 1.794 to 1.806 has a 57% chance of being touched and a 37% chance of being decisively broken; resistance at 1.994 to 2.027 has a 44% chance of being touched and a 23% chance of being decisively broken.
👉 As long as ETH remains below the resistance zone of 1.994 to 2.027, sellers retain the advantage.
📍 4-hour timeframe (through 19:00): main trading range 1.885 to 1.915; upper bound 1.945, lower bound 1.852.
📆 24-hour timeframe: main trading range 1.873 to 1.926; upper bound 1.973, lower bound 1.812.
🌐 News currently affecting prices:
• Negative news, high impact: U.S. stocks fell as Nvidia shares came under heavier selling pressure and U.S. inflation reached its highest level in four years (14/11).
• Negative news, moderate impact: U.S. Bitcoin ETFs saw net outflows of 1.07 billion USD in one week, bringing the two-week total to 2.35 billion USD (14/11).
Levels and percentages are based on historical market statistics from 2019 to 2026: the main trading range has about a 50% chance of each end being touched, while the upper and lower bounds have about a 10% chance of being broken. This is not investment advice. Manage your capital before entering a trade.
#BTC #ETH
$BTC 67.196 · $ETH 1.900: the weekly trend is tilted downward—who has the advantage, and at what levels does it end?
📉 Weekly trend: TILTED DOWNWARD. Since 2019, there have been 228 days like this; BTC was lower one week later 58% of the time (ETH follows BTC: lower 58% of the time). This signal is weaker than usual.
🧭 The trend-following trade is SHORT: BTC was lower one week later 58% of the time, while the long side was right only 42% of the time. Going long now means trading against the trend. The difference is not large, so the advantage is slim.
🟠 BTC · 67.196 · +0,2% over the past 4 hours
🧱 Over the next 7 days, the lower levels are more likely to be touched than the upper ones, in line with the weekly trend: support at 64.855 to 65.145 has a 63% chance of being touched and a 41% chance of being decisively broken; resistance at 69.855 to 70.145 has a 44% chance of being touched and a 23% chance of being decisively broken.
👉 As long as BTC remains below the resistance zone of 69.855 to 70.145, sellers retain the advantage.
📍 4-hour timeframe (through 19:00): main trading range 66.819 to 67.565; upper bound 68.294, lower bound 66.048.
📆 24-hour timeframe: main trading range 66.523 to 67.754; upper bound 68.768, lower bound 65.179.
🔷 ETH · 1.900 · 0,0% over the past 4 hours
🧱 Over the next 7 days, the lower levels are more likely to be touched than the upper ones, in line with the weekly trend: support at 1.794 to 1.806 has a 57% chance of being touched and a 37% chance of being decisively broken; resistance at 1.994 to 2.027 has a 44% chance of being touched and a 23% chance of being decisively broken.
👉 As long as ETH remains below the resistance zone of 1.994 to 2.027, sellers retain the advantage.
📍 4-hour timeframe (through 19:00): main trading range 1.885 to 1.915; upper bound 1.945, lower bound 1.852.
📆 24-hour timeframe: main trading range 1.873 to 1.926; upper bound 1.973, lower bound 1.812.
🌐 News currently affecting prices:
• Negative news, high impact: U.S. stocks fell as Nvidia shares came under heavier selling pressure and U.S. inflation reached its highest level in four years (14/11).
• Negative news, moderate impact: U.S. Bitcoin ETFs saw net outflows of 1.07 billion USD in one week, bringing the two-week total to 2.35 billion USD (14/11).
Levels and percentages are based on historical market statistics from 2019 to 2026: the main trading range has about a 50% chance of each end being touched, while the upper and lower bounds have about a 10% chance of being broken. This is not investment advice. Manage your capital before entering a trade.
#BTC #ETH
📉 Weekly trend: TILTED DOWNWARD. Since 2019, there have been 228 days like this; BTC was lower one week later 58% of the time (ETH follows BTC: lower 58% of the time). This signal is weaker than usual.
🧭 The trend-following trade is SHORT: BTC was lower one week later 58% of the time, while the long side was right only 42% of the time. Going long now means trading against the trend. The difference is not large, so the advantage is slim.
🟠 BTC · 67.196 · +0,2% over the past 4 hours
🧱 Over the next 7 days, the lower levels are more likely to be touched than the upper ones, in line with the weekly trend: support at 64.855 to 65.145 has a 63% chance of being touched and a 41% chance of being decisively broken; resistance at 69.855 to 70.145 has a 44% chance of being touched and a 23% chance of being decisively broken.
👉 As long as BTC remains below the resistance zone of 69.855 to 70.145, sellers retain the advantage.
📍 4-hour timeframe (through 19:00): main trading range 66.819 to 67.565; upper bound 68.294, lower bound 66.048.
📆 24-hour timeframe: main trading range 66.523 to 67.754; upper bound 68.768, lower bound 65.179.
🔷 ETH · 1.900 · 0,0% over the past 4 hours
🧱 Over the next 7 days, the lower levels are more likely to be touched than the upper ones, in line with the weekly trend: support at 1.794 to 1.806 has a 57% chance of being touched and a 37% chance of being decisively broken; resistance at 1.994 to 2.027 has a 44% chance of being touched and a 23% chance of being decisively broken.
👉 As long as ETH remains below the resistance zone of 1.994 to 2.027, sellers retain the advantage.
📍 4-hour timeframe (through 19:00): main trading range 1.885 to 1.915; upper bound 1.945, lower bound 1.852.
📆 24-hour timeframe: main trading range 1.873 to 1.926; upper bound 1.973, lower bound 1.812.
🌐 News currently affecting prices:
• Negative news, high impact: U.S. stocks fell as Nvidia shares came under heavier selling pressure and U.S. inflation reached its highest level in four years (14/11).
• Negative news, moderate impact: U.S. Bitcoin ETFs saw net outflows of 1.07 billion USD in one week, bringing the two-week total to 2.35 billion USD (14/11).
Levels and percentages are based on historical market statistics from 2019 to 2026: the main trading range has about a 50% chance of each end being touched, while the upper and lower bounds have about a 10% chance of being broken. This is not investment advice. Manage your capital before entering a trade.
#BTC #ETH
55
·
--
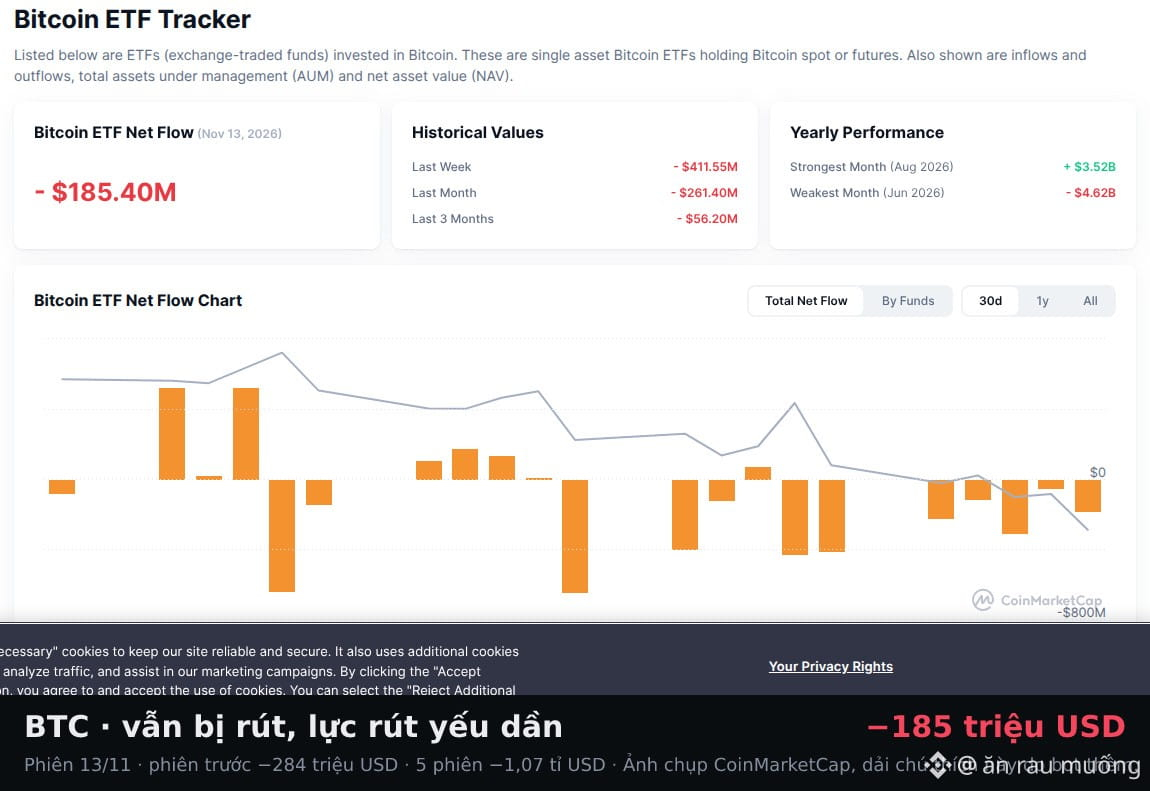
ETF session on 13/11: $BTC 67.220 saw outflows of USD 185 million (the 7th consecutive outflow session), $ETH was nearly flat (+USD 2.3 million), $SOL saw outflows of USD 3.1 million, and HYPE had no flows. Has institutional money returned?
🟠 BTC · STILL SEEING OUTFLOWS, BUT THEY ARE EASING
• Session on 13/11: USD 185 million in outflows (previous session: USD 284 million in outflows). Over the last 5 sessions: USD 1.07 billion in outflows.
• Has money returned? NO.
• Streak: 7 consecutive sessions of net outflows, totaling USD 1.91 billion. Previous extended outflow periods typically lasted 7 sessions; the longest lasted 13 sessions.
• Historical data: There have been 9 previous 7-session outflow periods like this one; one week later, BTC's price rose in 7 periods and fell in 2 (9 periods is a small sample, for reference only).
• Next session: Today's outflows were smaller than the previous session's. In 64 such cases in the past, the next session switched to net inflows 27 times (42%), while outflows continued 37 times.
• Sign that money is returning: a session with net inflows of at least USD 30 million, and no further outflows from the IBIT fund.
🔷 ETH · OUTFLOW STREAK PAUSED: this session saw net inflows of USD 2.3 million (previous session: USD 71 million in outflows); over 5 sessions: USD 399 million in outflows.
🟣 SOL · MIXED, NOT YET A TREND: this session saw USD 3.1 million in outflows (previous session: USD 1.7 million in net inflows); over 5 sessions: USD 26 million in outflows.
🟢 HYPE · OUTFLOW STREAK PAUSED: this session had no flows (previous session: no flows); over 5 sessions: USD 4.4 million in outflows.
🔎 Statistics: since 2/2024, whenever ETFs saw outflows of at least USD 1 billion over 5 sessions (as they have now), BTC's price one week later ROSE 39% of the time and FELL 61% of the time (under normal conditions, it rises 52% of the time).
These two statistics point in opposite directions (extended outflow periods like this one tend to favor gains, while heavy 5-session outflows tend to favor declines), so ETF flows are NOT YET enough to determine the price direction.
Data: Farside, CoinMarketCap. Past statistics, not investment advice. Manage your capital before placing a trade.
#ETF #BTC #ETH #SOL
ETF session on 13/11: $BTC 67.220 saw outflows of USD 185 million (the 7th consecutive outflow session), $ETH was nearly flat (+USD 2.3 million), $SOL saw outflows of USD 3.1 million, and HYPE had no flows. Has institutional money returned?
🟠 BTC · STILL SEEING OUTFLOWS, BUT THEY ARE EASING
• Session on 13/11: USD 185 million in outflows (previous session: USD 284 million in outflows). Over the last 5 sessions: USD 1.07 billion in outflows.
• Has money returned? NO.
• Streak: 7 consecutive sessions of net outflows, totaling USD 1.91 billion. Previous extended outflow periods typically lasted 7 sessions; the longest lasted 13 sessions.
• Historical data: There have been 9 previous 7-session outflow periods like this one; one week later, BTC's price rose in 7 periods and fell in 2 (9 periods is a small sample, for reference only).
• Next session: Today's outflows were smaller than the previous session's. In 64 such cases in the past, the next session switched to net inflows 27 times (42%), while outflows continued 37 times.
• Sign that money is returning: a session with net inflows of at least USD 30 million, and no further outflows from the IBIT fund.
🔷 ETH · OUTFLOW STREAK PAUSED: this session saw net inflows of USD 2.3 million (previous session: USD 71 million in outflows); over 5 sessions: USD 399 million in outflows.
🟣 SOL · MIXED, NOT YET A TREND: this session saw USD 3.1 million in outflows (previous session: USD 1.7 million in net inflows); over 5 sessions: USD 26 million in outflows.
🟢 HYPE · OUTFLOW STREAK PAUSED: this session had no flows (previous session: no flows); over 5 sessions: USD 4.4 million in outflows.
🔎 Statistics: since 2/2024, whenever ETFs saw outflows of at least USD 1 billion over 5 sessions (as they have now), BTC's price one week later ROSE 39% of the time and FELL 61% of the time (under normal conditions, it rises 52% of the time).
These two statistics point in opposite directions (extended outflow periods like this one tend to favor gains, while heavy 5-session outflows tend to favor declines), so ETF flows are NOT YET enough to determine the price direction.
Data: Farside, CoinMarketCap. Past statistics, not investment advice. Manage your capital before placing a trade.
#ETF #BTC #ETH #SOL
🟠 BTC · STILL SEEING OUTFLOWS, BUT THEY ARE EASING
• Session on 13/11: USD 185 million in outflows (previous session: USD 284 million in outflows). Over the last 5 sessions: USD 1.07 billion in outflows.
• Has money returned? NO.
• Streak: 7 consecutive sessions of net outflows, totaling USD 1.91 billion. Previous extended outflow periods typically lasted 7 sessions; the longest lasted 13 sessions.
• Historical data: There have been 9 previous 7-session outflow periods like this one; one week later, BTC's price rose in 7 periods and fell in 2 (9 periods is a small sample, for reference only).
• Next session: Today's outflows were smaller than the previous session's. In 64 such cases in the past, the next session switched to net inflows 27 times (42%), while outflows continued 37 times.
• Sign that money is returning: a session with net inflows of at least USD 30 million, and no further outflows from the IBIT fund.
🔷 ETH · OUTFLOW STREAK PAUSED: this session saw net inflows of USD 2.3 million (previous session: USD 71 million in outflows); over 5 sessions: USD 399 million in outflows.
🟣 SOL · MIXED, NOT YET A TREND: this session saw USD 3.1 million in outflows (previous session: USD 1.7 million in net inflows); over 5 sessions: USD 26 million in outflows.
🟢 HYPE · OUTFLOW STREAK PAUSED: this session had no flows (previous session: no flows); over 5 sessions: USD 4.4 million in outflows.
🔎 Statistics: since 2/2024, whenever ETFs saw outflows of at least USD 1 billion over 5 sessions (as they have now), BTC's price one week later ROSE 39% of the time and FELL 61% of the time (under normal conditions, it rises 52% of the time).
These two statistics point in opposite directions (extended outflow periods like this one tend to favor gains, while heavy 5-session outflows tend to favor declines), so ETF flows are NOT YET enough to determine the price direction.
Data: Farside, CoinMarketCap. Past statistics, not investment advice. Manage your capital before placing a trade.
#ETF #BTC #ETH #SOL
685
·
--
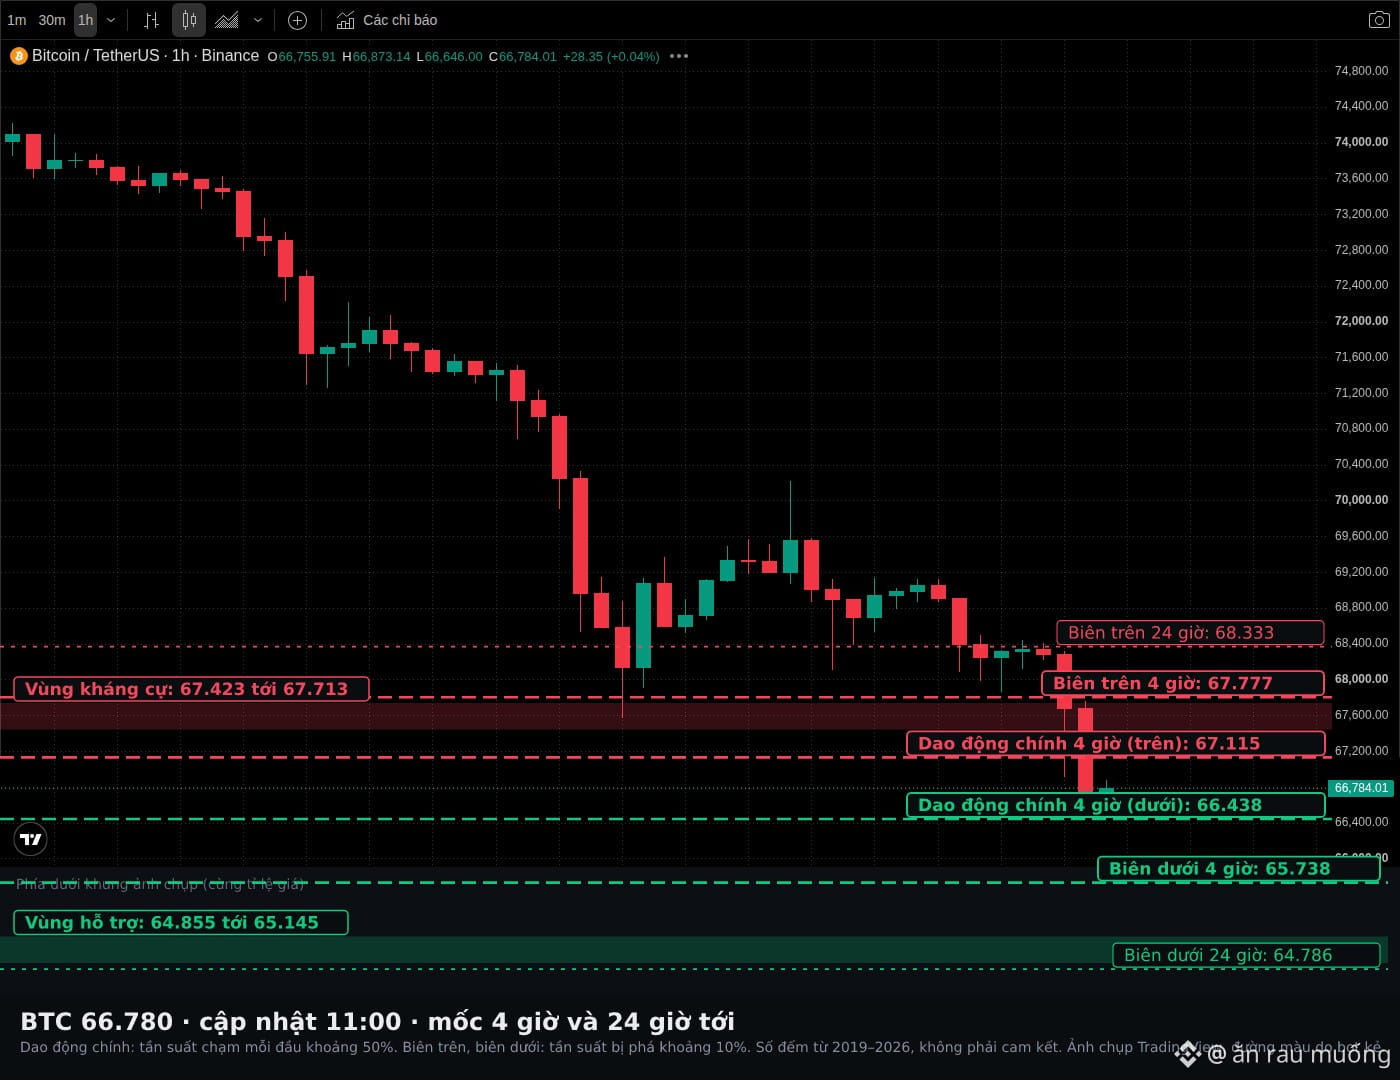
$BTC 66.780 (−2,3% 4 hours) | $ETH 1.889 (−2,2% 4 hours)
📉 Weekly trend: BEARISH. Since 2019, there have been 228 days like this; BTC was lower one week later 58% of the time (ETH follows BTC: lower 58% of the time). This signal is weaker than usual.
🧭 The trend-following trade is SHORT: BTC was lower one week later 58% of the time, while the long side was right only 42% of the time. Going long now means trading against the trend. The gap is not large, so the edge is slim.
A quick mid-session update; levels for each coin are below.
BTC
👉 As long as BTC remains below the 67.423 to 67.713 resistance zone, sellers have the advantage.
📍 Expected range from now until 15:00:
• Main trading range: 66.438 to 67.115.
• Upper boundary: 67.777. Lower boundary: 65.738.
📆 Over the next 24 hours:
• Main trading range: 66.115 to 67.331.
• Upper boundary: 68.333. Lower boundary: 64.786.
🧱 Over the next 7 days, the two sides are nearly even: resistance at 67.423 to 67.713 has an 81% chance of being touched and a 44% chance of being decisively broken; support at 64.855 to 65.145 has a 73% chance of being touched and a 45% chance of being decisively broken.
ETH
👉 As long as ETH remains below the 1.994 to 2.027 resistance zone, sellers have the advantage.
📍 Expected range from now until 15:00:
• Main trading range: 1.875 to 1.903.
• Upper boundary: 1.929. Lower boundary: 1.847.
📆 Over the next 24 hours:
• Main trading range: 1.862 to 1.916.
• Upper boundary: 1.963. Lower boundary: 1.800.
🧱 Over the next 7 days, the lower side is more likely to be touched than the upper side, in line with the weekly trend: support at 1.794 to 1.806 has a 63% chance of being touched and a 41% chance of being decisively broken; resistance at 1.994 to 2.027 has a 44% chance of being touched and a 23% chance of being decisively broken.
🌐 News currently affecting prices:
• Negative, moderate impact: Bitcoin ETFs saw net outflows for the sixth consecutive day as BTC fell nearly 5% (14/11).
• Neutral, moderate impact: Fed's Jefferson says inflation will determine interest rate moves (14/11).
Levels and percentages are based on historical market statistics from 2019 to 2026: the main trading range has about a 50% chance of being touched at each end, while the upper and lower boundaries have about a 10% chance of being breached. This is not investment advice. Manage your risk before entering a trade.
#BTC #ETH
$BTC 66.780 (−2,3% 4 hours) | $ETH 1.889 (−2,2% 4 hours)
📉 Weekly trend: BEARISH. Since 2019, there have been 228 days like this; BTC was lower one week later 58% of the time (ETH follows BTC: lower 58% of the time). This signal is weaker than usual.
🧭 The trend-following trade is SHORT: BTC was lower one week later 58% of the time, while the long side was right only 42% of the time. Going long now means trading against the trend. The gap is not large, so the edge is slim.
A quick mid-session update; levels for each coin are below.
BTC
👉 As long as BTC remains below the 67.423 to 67.713 resistance zone, sellers have the advantage.
📍 Expected range from now until 15:00:
• Main trading range: 66.438 to 67.115.
• Upper boundary: 67.777. Lower boundary: 65.738.
📆 Over the next 24 hours:
• Main trading range: 66.115 to 67.331.
• Upper boundary: 68.333. Lower boundary: 64.786.
🧱 Over the next 7 days, the two sides are nearly even: resistance at 67.423 to 67.713 has an 81% chance of being touched and a 44% chance of being decisively broken; support at 64.855 to 65.145 has a 73% chance of being touched and a 45% chance of being decisively broken.
ETH
👉 As long as ETH remains below the 1.994 to 2.027 resistance zone, sellers have the advantage.
📍 Expected range from now until 15:00:
• Main trading range: 1.875 to 1.903.
• Upper boundary: 1.929. Lower boundary: 1.847.
📆 Over the next 24 hours:
• Main trading range: 1.862 to 1.916.
• Upper boundary: 1.963. Lower boundary: 1.800.
🧱 Over the next 7 days, the lower side is more likely to be touched than the upper side, in line with the weekly trend: support at 1.794 to 1.806 has a 63% chance of being touched and a 41% chance of being decisively broken; resistance at 1.994 to 2.027 has a 44% chance of being touched and a 23% chance of being decisively broken.
🌐 News currently affecting prices:
• Negative, moderate impact: Bitcoin ETFs saw net outflows for the sixth consecutive day as BTC fell nearly 5% (14/11).
• Neutral, moderate impact: Fed's Jefferson says inflation will determine interest rate moves (14/11).
Levels and percentages are based on historical market statistics from 2019 to 2026: the main trading range has about a 50% chance of being touched at each end, while the upper and lower boundaries have about a 10% chance of being breached. This is not investment advice. Manage your risk before entering a trade.
#BTC #ETH
📉 Weekly trend: BEARISH. Since 2019, there have been 228 days like this; BTC was lower one week later 58% of the time (ETH follows BTC: lower 58% of the time). This signal is weaker than usual.
🧭 The trend-following trade is SHORT: BTC was lower one week later 58% of the time, while the long side was right only 42% of the time. Going long now means trading against the trend. The gap is not large, so the edge is slim.
A quick mid-session update; levels for each coin are below.
BTC
👉 As long as BTC remains below the 67.423 to 67.713 resistance zone, sellers have the advantage.
📍 Expected range from now until 15:00:
• Main trading range: 66.438 to 67.115.
• Upper boundary: 67.777. Lower boundary: 65.738.
📆 Over the next 24 hours:
• Main trading range: 66.115 to 67.331.
• Upper boundary: 68.333. Lower boundary: 64.786.
🧱 Over the next 7 days, the two sides are nearly even: resistance at 67.423 to 67.713 has an 81% chance of being touched and a 44% chance of being decisively broken; support at 64.855 to 65.145 has a 73% chance of being touched and a 45% chance of being decisively broken.
ETH
👉 As long as ETH remains below the 1.994 to 2.027 resistance zone, sellers have the advantage.
📍 Expected range from now until 15:00:
• Main trading range: 1.875 to 1.903.
• Upper boundary: 1.929. Lower boundary: 1.847.
📆 Over the next 24 hours:
• Main trading range: 1.862 to 1.916.
• Upper boundary: 1.963. Lower boundary: 1.800.
🧱 Over the next 7 days, the lower side is more likely to be touched than the upper side, in line with the weekly trend: support at 1.794 to 1.806 has a 63% chance of being touched and a 41% chance of being decisively broken; resistance at 1.994 to 2.027 has a 44% chance of being touched and a 23% chance of being decisively broken.
🌐 News currently affecting prices:
• Negative, moderate impact: Bitcoin ETFs saw net outflows for the sixth consecutive day as BTC fell nearly 5% (14/11).
• Neutral, moderate impact: Fed's Jefferson says inflation will determine interest rate moves (14/11).
Levels and percentages are based on historical market statistics from 2019 to 2026: the main trading range has about a 50% chance of being touched at each end, while the upper and lower boundaries have about a 10% chance of being breached. This is not investment advice. Manage your risk before entering a trade.
#BTC #ETH
333
·
--
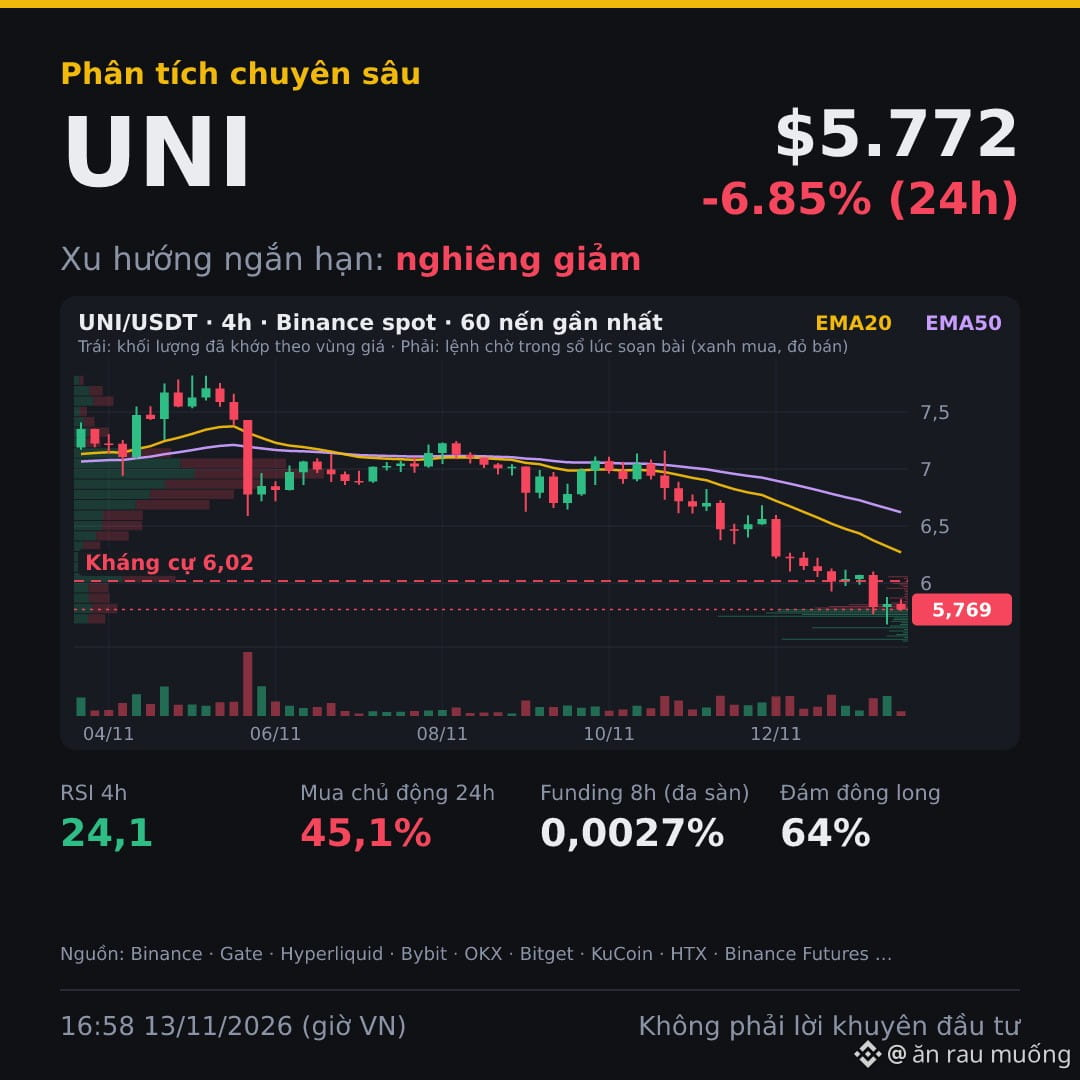
📉 BEARISH | $UNI down 6.85% in 24 hours despite positive news, the price has fallen 12.7% since just before the news. Short-term outlook is bearish because all three timeframes are down and sellers are in control on Binance spot.
🕰 CONTEXT: Since the news broke (01:40 on 12/11), the price has fallen 13%. After the news, buyers accounted for 44% of volume (44% before the news), with net selling of 12.4 million USDT: sellers are still in control. Open interest (OI) has fallen 14% since the news broke: traders are closing positions and reducing leverage.
📰 POSITIVE NEWS, moderate impact (12/11, Coinfomania): Uniswap launched v2, v3, and v4 on the Elysium network. After the news, the price hit a low of -14.8% compared with before the news and is now still down 12.7%.
📊 TECHNICALS: The price is below the EMA20 and EMA50 on the daily, 4h, and 1h timeframes, so the short-term trend is consistently bearish. The 4h RSI has fallen to 24.1, in oversold territory, meaning a technical rebound is possible but not enough to reverse the trend.
💰 FLOW: Aggressive buying on Binance spot was only 45.1% over the past 24 hours, meaning sellers have been more aggressive. The counterpoint: top Binance traders hold 69.8% of positions long, but that is not enough to change the direction because aggressive buying over the past hour is still only 42.2%.
₿ VS. BTC: Over the past 24 hours, during hours when BTC rose, for a combined +2.69%, UNI gained +1.18%; during hours when BTC fell, for a combined -8.81%, UNI fell -8.07%. UNI is weaker than BTC: it rises less and falls more.
🎯 LEVELS TO WATCH FOR $UNI: support at 4.414 USDT · resistance at 6.02 USDT
Scenario: Short sellers have the advantage while the price is below 6.02, with 4.414 as the next test zone; this view is invalidated if a 4-hour UNI/USDT candle on Binance spot closes above 6.02 (the current candle closes at 19:00). Long traders should wait for that candle to close above 6.02.
⚠️ The biggest risk is a 4-hour candle closing above 6.02 USDT, in which case the bearish outlook is no longer valid.
Data as of 16:58 on 13/11 (Vietnam time).
At 6.02 USDT, do you lean long or short, and why?
Manage your capital before entering a trade: each trade should risk only about one percent of your capital.
Not investment advice. DYOR.
#BinanceSquare #UNI #Uniswap
📉 BEARISH | $UNI down 6.85% in 24 hours despite positive news, the price has fallen 12.7% since just before the news. Short-term outlook is bearish because all three timeframes are down and sellers are in control on Binance spot.
🕰 CONTEXT: Since the news broke (01:40 on 12/11), the price has fallen 13%. After the news, buyers accounted for 44% of volume (44% before the news), with net selling of 12.4 million USDT: sellers are still in control. Open interest (OI) has fallen 14% since the news broke: traders are closing positions and reducing leverage.
📰 POSITIVE NEWS, moderate impact (12/11, Coinfomania): Uniswap launched v2, v3, and v4 on the Elysium network. After the news, the price hit a low of -14.8% compared with before the news and is now still down 12.7%.
📊 TECHNICALS: The price is below the EMA20 and EMA50 on the daily, 4h, and 1h timeframes, so the short-term trend is consistently bearish. The 4h RSI has fallen to 24.1, in oversold territory, meaning a technical rebound is possible but not enough to reverse the trend.
💰 FLOW: Aggressive buying on Binance spot was only 45.1% over the past 24 hours, meaning sellers have been more aggressive. The counterpoint: top Binance traders hold 69.8% of positions long, but that is not enough to change the direction because aggressive buying over the past hour is still only 42.2%.
₿ VS. BTC: Over the past 24 hours, during hours when BTC rose, for a combined +2.69%, UNI gained +1.18%; during hours when BTC fell, for a combined -8.81%, UNI fell -8.07%. UNI is weaker than BTC: it rises less and falls more.
🎯 LEVELS TO WATCH FOR $UNI : support at 4.414 USDT · resistance at 6.02 USDT
Scenario: Short sellers have the advantage while the price is below 6.02, with 4.414 as the next test zone; this view is invalidated if a 4-hour UNI/USDT candle on Binance spot closes above 6.02 (the current candle closes at 19:00). Long traders should wait for that candle to close above 6.02.
⚠️ The biggest risk is a 4-hour candle closing above 6.02 USDT, in which case the bearish outlook is no longer valid.
Data as of 16:58 on 13/11 (Vietnam time).
At 6.02 USDT, do you lean long or short, and why?
Manage your capital before entering a trade: each trade should risk only about one percent of your capital.
Not investment advice. DYOR.
#BinanceSquare #UNI #Uniswap
🕰 CONTEXT: Since the news broke (01:40 on 12/11), the price has fallen 13%. After the news, buyers accounted for 44% of volume (44% before the news), with net selling of 12.4 million USDT: sellers are still in control. Open interest (OI) has fallen 14% since the news broke: traders are closing positions and reducing leverage.
📰 POSITIVE NEWS, moderate impact (12/11, Coinfomania): Uniswap launched v2, v3, and v4 on the Elysium network. After the news, the price hit a low of -14.8% compared with before the news and is now still down 12.7%.
📊 TECHNICALS: The price is below the EMA20 and EMA50 on the daily, 4h, and 1h timeframes, so the short-term trend is consistently bearish. The 4h RSI has fallen to 24.1, in oversold territory, meaning a technical rebound is possible but not enough to reverse the trend.
💰 FLOW: Aggressive buying on Binance spot was only 45.1% over the past 24 hours, meaning sellers have been more aggressive. The counterpoint: top Binance traders hold 69.8% of positions long, but that is not enough to change the direction because aggressive buying over the past hour is still only 42.2%.
₿ VS. BTC: Over the past 24 hours, during hours when BTC rose, for a combined +2.69%, UNI gained +1.18%; during hours when BTC fell, for a combined -8.81%, UNI fell -8.07%. UNI is weaker than BTC: it rises less and falls more.
🎯 LEVELS TO WATCH FOR $UNI : support at 4.414 USDT · resistance at 6.02 USDT
Scenario: Short sellers have the advantage while the price is below 6.02, with 4.414 as the next test zone; this view is invalidated if a 4-hour UNI/USDT candle on Binance spot closes above 6.02 (the current candle closes at 19:00). Long traders should wait for that candle to close above 6.02.
⚠️ The biggest risk is a 4-hour candle closing above 6.02 USDT, in which case the bearish outlook is no longer valid.
Data as of 16:58 on 13/11 (Vietnam time).
At 6.02 USDT, do you lean long or short, and why?
Manage your capital before entering a trade: each trade should risk only about one percent of your capital.
Not investment advice. DYOR.
#BinanceSquare #UNI #Uniswap
252
·
--
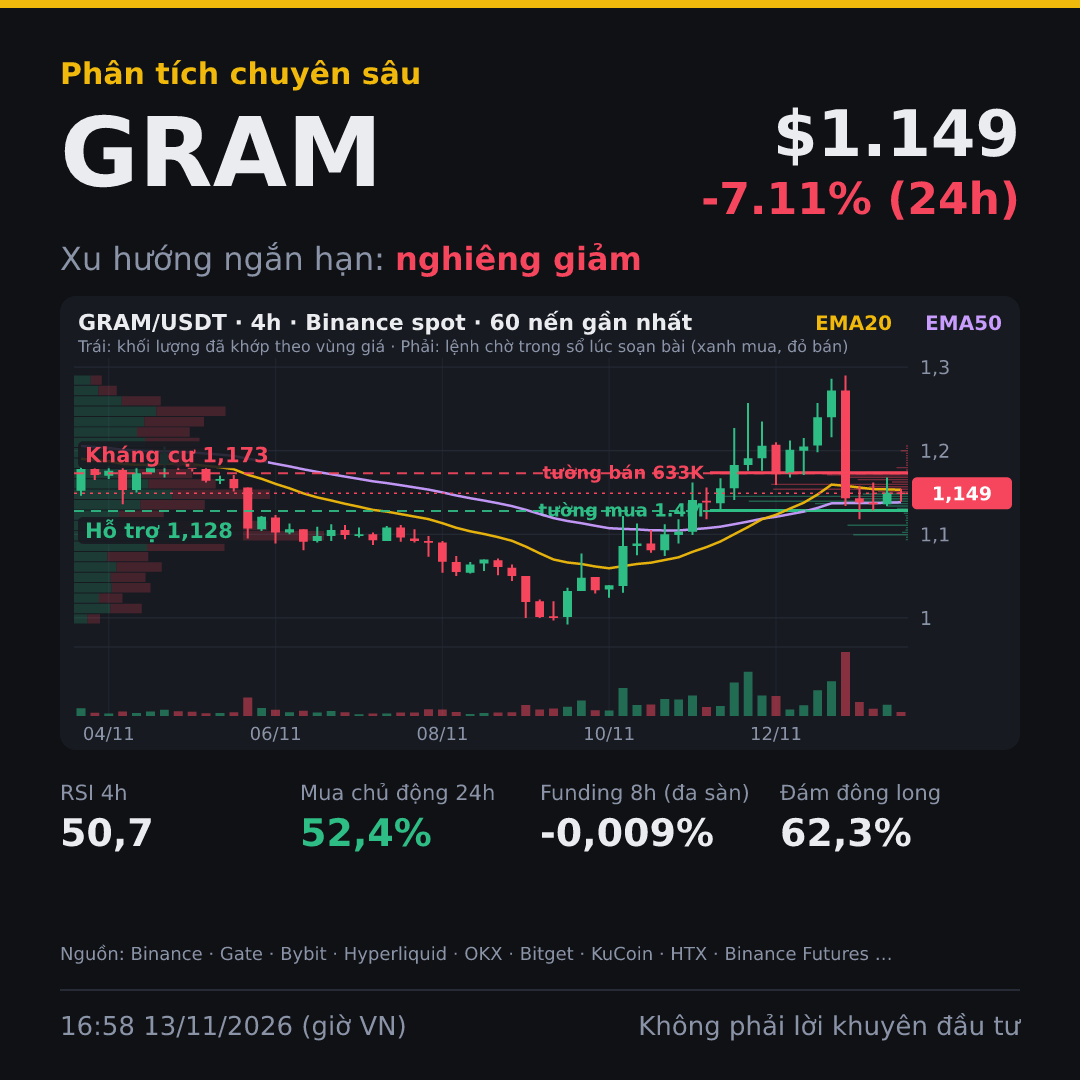
📉 BEARISH BIAS | $GRAM Bearish bias: price at 1.149 USDT, down 7.1% in 24 hours. After positive news, the price once surged 8.5%, but has now retreated to -3.4%.
🕰 CONTEXT: Since the news broke (13:50 on 12/11), the price has fallen 3.4%. Since the news, buyers accounted for 53% of volume (56% before the news), with net buying of 2.1 million USDT: money is coming in to buy the dip. Total open interest (OI) is down 19% since the news broke: traders are closing positions and reducing leverage.
📰 NEWS: Crypto News (12/11) said GRAM rose because Telegram wallets are being used more, with the positive news having a moderate impact. Since the news, OI on Binance Futures has fallen 18.7%, meaning positions are being closed.
📊 TECHNICALS: Both the daily and 1-hour charts are down, with price below the daily EMA50 at 1.2644, suggesting a bearish bias. The daily MACD has just crossed upward, which goes against the trend, but that is not enough to change direction while the price remains stuck below the daily EMA50.
💰 MONEY FLOW: On Binance spot, sellers have dominated over the past hour (buying at 35%), so short-term buying pressure is weak. Active buying over 24 hours is 52.4%, which goes against the trend, but is not enough to change direction.
₿ VS. BTC: Over the past 24 hours, during hours when BTC rose, its cumulative gain was +2.69% while GRAM was -0.68%; during hours when BTC fell, its cumulative decline was -8.81% while GRAM was -6.24%. GRAM is barely tracking BTC; its price is moving for its own reasons.
🎯 LEVELS TO WATCH FOR $GRAM: support at 1.128 USDT · resistance at 1.173 USDT
Scenario: Shorts have the advantage while the price is below 1.173, with 1.128 as the next test level. Longs should wait for the price to break above 1.173 and hold there; at that point, the short thesis is invalidated.
⚠️ The bearish thesis is invalidated if the 4-hour GRAM/USDT candle on Binance spot closes above 1.173 at 19:00 on 13/11.
Data as of 16:58 on 13/11 (Vietnam time).
Between 1.128 and 1.173, do you favor longs or shorts, and why?
Manage your capital before entering a trade: each trade should risk only about one percent of your capital.
Not investment advice. DYOR.
#BinanceSquare #GRAM
📉 BEARISH BIAS | $GRAM Bearish bias: price at 1.149 USDT, down 7.1% in 24 hours. After positive news, the price once surged 8.5%, but has now retreated to -3.4%.
🕰 CONTEXT: Since the news broke (13:50 on 12/11), the price has fallen 3.4%. Since the news, buyers accounted for 53% of volume (56% before the news), with net buying of 2.1 million USDT: money is coming in to buy the dip. Total open interest (OI) is down 19% since the news broke: traders are closing positions and reducing leverage.
📰 NEWS: Crypto News (12/11) said GRAM rose because Telegram wallets are being used more, with the positive news having a moderate impact. Since the news, OI on Binance Futures has fallen 18.7%, meaning positions are being closed.
📊 TECHNICALS: Both the daily and 1-hour charts are down, with price below the daily EMA50 at 1.2644, suggesting a bearish bias. The daily MACD has just crossed upward, which goes against the trend, but that is not enough to change direction while the price remains stuck below the daily EMA50.
💰 MONEY FLOW: On Binance spot, sellers have dominated over the past hour (buying at 35%), so short-term buying pressure is weak. Active buying over 24 hours is 52.4%, which goes against the trend, but is not enough to change direction.
₿ VS. BTC: Over the past 24 hours, during hours when BTC rose, its cumulative gain was +2.69% while GRAM was -0.68%; during hours when BTC fell, its cumulative decline was -8.81% while GRAM was -6.24%. GRAM is barely tracking BTC; its price is moving for its own reasons.
🎯 LEVELS TO WATCH FOR $GRAM : support at 1.128 USDT · resistance at 1.173 USDT
Scenario: Shorts have the advantage while the price is below 1.173, with 1.128 as the next test level. Longs should wait for the price to break above 1.173 and hold there; at that point, the short thesis is invalidated.
⚠️ The bearish thesis is invalidated if the 4-hour GRAM/USDT candle on Binance spot closes above 1.173 at 19:00 on 13/11.
Data as of 16:58 on 13/11 (Vietnam time).
Between 1.128 and 1.173, do you favor longs or shorts, and why?
Manage your capital before entering a trade: each trade should risk only about one percent of your capital.
Not investment advice. DYOR.
#BinanceSquare #GRAM
🕰 CONTEXT: Since the news broke (13:50 on 12/11), the price has fallen 3.4%. Since the news, buyers accounted for 53% of volume (56% before the news), with net buying of 2.1 million USDT: money is coming in to buy the dip. Total open interest (OI) is down 19% since the news broke: traders are closing positions and reducing leverage.
📰 NEWS: Crypto News (12/11) said GRAM rose because Telegram wallets are being used more, with the positive news having a moderate impact. Since the news, OI on Binance Futures has fallen 18.7%, meaning positions are being closed.
📊 TECHNICALS: Both the daily and 1-hour charts are down, with price below the daily EMA50 at 1.2644, suggesting a bearish bias. The daily MACD has just crossed upward, which goes against the trend, but that is not enough to change direction while the price remains stuck below the daily EMA50.
💰 MONEY FLOW: On Binance spot, sellers have dominated over the past hour (buying at 35%), so short-term buying pressure is weak. Active buying over 24 hours is 52.4%, which goes against the trend, but is not enough to change direction.
₿ VS. BTC: Over the past 24 hours, during hours when BTC rose, its cumulative gain was +2.69% while GRAM was -0.68%; during hours when BTC fell, its cumulative decline was -8.81% while GRAM was -6.24%. GRAM is barely tracking BTC; its price is moving for its own reasons.
🎯 LEVELS TO WATCH FOR $GRAM : support at 1.128 USDT · resistance at 1.173 USDT
Scenario: Shorts have the advantage while the price is below 1.173, with 1.128 as the next test level. Longs should wait for the price to break above 1.173 and hold there; at that point, the short thesis is invalidated.
⚠️ The bearish thesis is invalidated if the 4-hour GRAM/USDT candle on Binance spot closes above 1.173 at 19:00 on 13/11.
Data as of 16:58 on 13/11 (Vietnam time).
Between 1.128 and 1.173, do you favor longs or shorts, and why?
Manage your capital before entering a trade: each trade should risk only about one percent of your capital.
Not investment advice. DYOR.
#BinanceSquare #GRAM
1
606
·
--
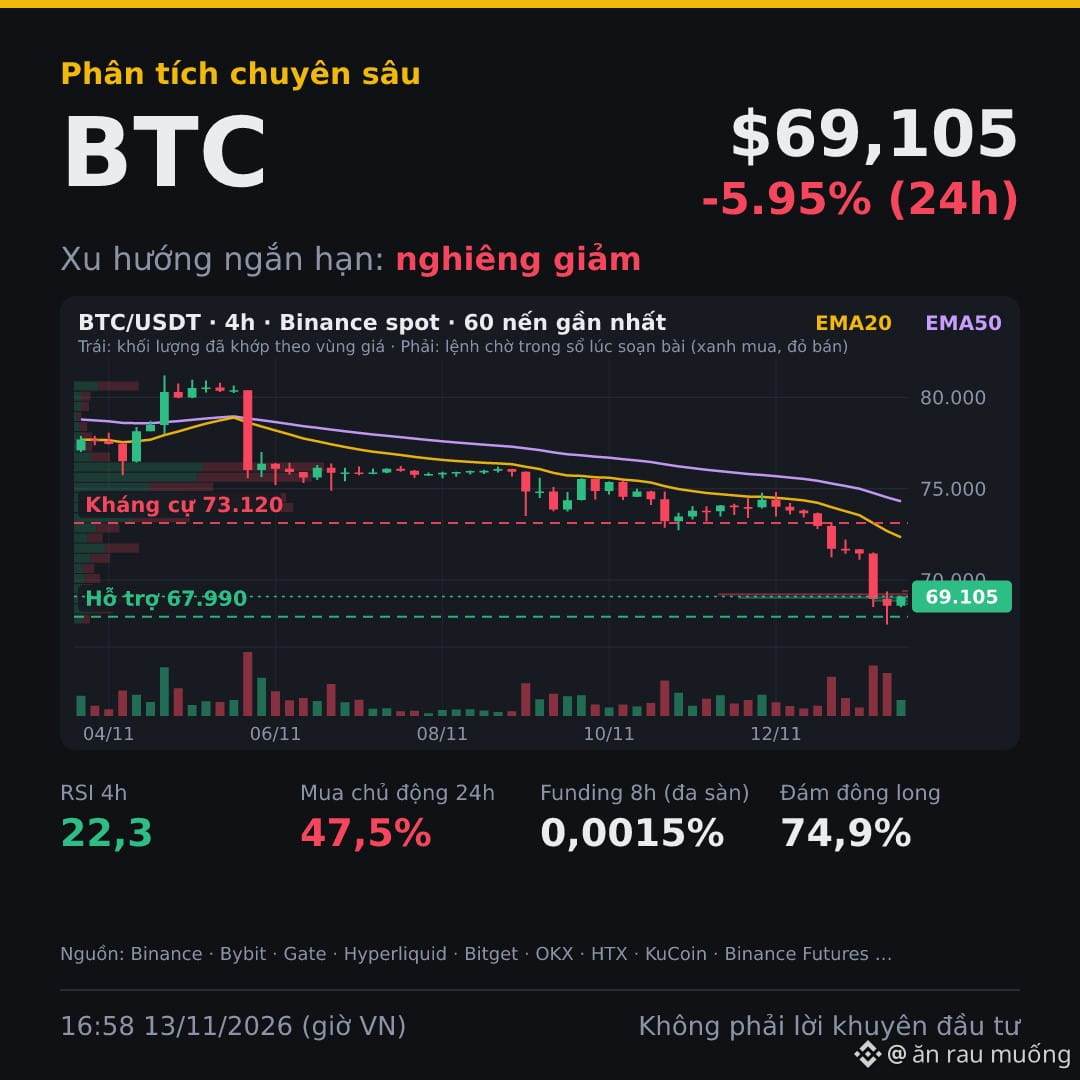
📉 BEARISH | $BTC Bearish: Both the 4-hour and daily charts are below EMA20/EMA50, while sellers accounted for 52.5% of Binance spot trading over the past 24 hours (buyers only 47.5%).
🕰 CONTEXT: Since the news broke (11:55 on 13/11), the price has risen 0.2%. After the news, buyers accounted for 50% of volume (up from 44% before the news), with net buying of 4.7 million USDT: both sides are evenly matched.
📰 NEWS: Negative news, with a moderate impact on volatility: Bitcoin Foundation (13/11) said ETF outflows are weighing on BTC prices below $70,000.
📊 TECHNICALS: All three timeframes—1h, 4h, and daily—are bearish because the price is below EMA20 and EMA50, so sellers still have the advantage. The 4-hour RSI is just 22.3, indicating oversold conditions, so there could be a short-term bounce, but the trend has not changed.
💰 MONEY FLOW: Over the past 24 hours on Binance spot, aggressive sellers outpaced buyers by about 106 million USDT, meaning selling pressure remains dominant. Binance Futures: top traders have 68.3% of positions long, while the crowd has 77.2% of accounts long, so if the price breaks support, the large number of longs could face further liquidations.
🎯 BTC LEVELS TO WATCH: support at 67,990 USDT · resistance at 73,120 USDT
Scenario: Shorts retain the advantage while the price is below 73,120; the next level to test is 67,990. Longs need a 4-hour BTC/USDT candle on Binance spot (closing at 19:00) to close above 73,120; if it does, the short thesis is invalidated.
⚠️ The price is only about 1.6% away from support at 67,990, so if this level gives way, selling pressure could accelerate.
Data as of 16:58 on 13/11 (UTC+7).
Between 67,990 and 73,120, do you lean long or short, and why?
Manage your risk before entering a trade: risk only about one percent of your capital per trade.
Not investment advice. DYOR.
#BTC #BinanceSquare
📉 BEARISH | $BTC Bearish: Both the 4-hour and daily charts are below EMA20/EMA50, while sellers accounted for 52.5% of Binance spot trading over the past 24 hours (buyers only 47.5%).
🕰 CONTEXT: Since the news broke (11:55 on 13/11), the price has risen 0.2%. After the news, buyers accounted for 50% of volume (up from 44% before the news), with net buying of 4.7 million USDT: both sides are evenly matched.
📰 NEWS: Negative news, with a moderate impact on volatility: Bitcoin Foundation (13/11) said ETF outflows are weighing on BTC prices below $70,000.
📊 TECHNICALS: All three timeframes—1h, 4h, and daily—are bearish because the price is below EMA20 and EMA50, so sellers still have the advantage. The 4-hour RSI is just 22.3, indicating oversold conditions, so there could be a short-term bounce, but the trend has not changed.
💰 MONEY FLOW: Over the past 24 hours on Binance spot, aggressive sellers outpaced buyers by about 106 million USDT, meaning selling pressure remains dominant. Binance Futures: top traders have 68.3% of positions long, while the crowd has 77.2% of accounts long, so if the price breaks support, the large number of longs could face further liquidations.
🎯 BTC LEVELS TO WATCH: support at 67,990 USDT · resistance at 73,120 USDT
Scenario: Shorts retain the advantage while the price is below 73,120; the next level to test is 67,990. Longs need a 4-hour BTC/USDT candle on Binance spot (closing at 19:00) to close above 73,120; if it does, the short thesis is invalidated.
⚠️ The price is only about 1.6% away from support at 67,990, so if this level gives way, selling pressure could accelerate.
Data as of 16:58 on 13/11 (UTC+7).
Between 67,990 and 73,120, do you lean long or short, and why?
Manage your risk before entering a trade: risk only about one percent of your capital per trade.
Not investment advice. DYOR.
#BTC #BinanceSquare
🕰 CONTEXT: Since the news broke (11:55 on 13/11), the price has risen 0.2%. After the news, buyers accounted for 50% of volume (up from 44% before the news), with net buying of 4.7 million USDT: both sides are evenly matched.
📰 NEWS: Negative news, with a moderate impact on volatility: Bitcoin Foundation (13/11) said ETF outflows are weighing on BTC prices below $70,000.
📊 TECHNICALS: All three timeframes—1h, 4h, and daily—are bearish because the price is below EMA20 and EMA50, so sellers still have the advantage. The 4-hour RSI is just 22.3, indicating oversold conditions, so there could be a short-term bounce, but the trend has not changed.
💰 MONEY FLOW: Over the past 24 hours on Binance spot, aggressive sellers outpaced buyers by about 106 million USDT, meaning selling pressure remains dominant. Binance Futures: top traders have 68.3% of positions long, while the crowd has 77.2% of accounts long, so if the price breaks support, the large number of longs could face further liquidations.
🎯 BTC LEVELS TO WATCH: support at 67,990 USDT · resistance at 73,120 USDT
Scenario: Shorts retain the advantage while the price is below 73,120; the next level to test is 67,990. Longs need a 4-hour BTC/USDT candle on Binance spot (closing at 19:00) to close above 73,120; if it does, the short thesis is invalidated.
⚠️ The price is only about 1.6% away from support at 67,990, so if this level gives way, selling pressure could accelerate.
Data as of 16:58 on 13/11 (UTC+7).
Between 67,990 and 73,120, do you lean long or short, and why?
Manage your risk before entering a trade: risk only about one percent of your capital per trade.
Not investment advice. DYOR.
#BTC #BinanceSquare
251
·
--
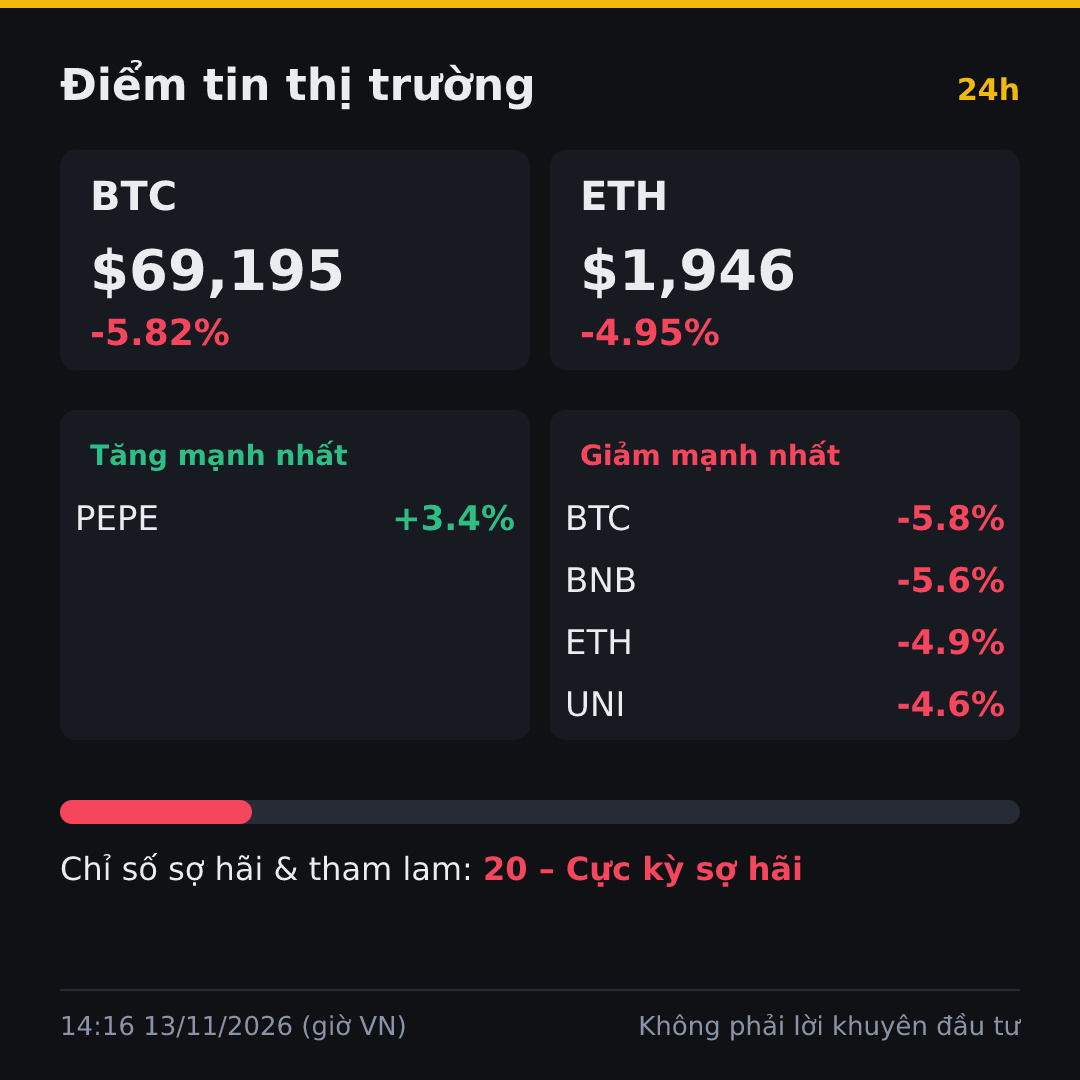
BTC fell 5.8% in 24h to 69,195 USDT, ETH lost 4.9%, and the Fear & Greed Index is at 20 (extreme fear).
Here’s how I read it: this is a broad sell-off, not one coin breaking down on its own. Both major coins hit their intraday lows at 67,568 (BTC) and 1,895.95 (ETH), so the market is retesting these levels.
$BTC: If it holds above 67,568, there may be a bounce toward 73,700 (the 24h high), but I haven’t seen confirmation of a reversal yet. If the 4h candle closes below 67,568, the outlook leans bearish, with the possibility of a further drop.
$ETH: Similarly, holding 1,896 is necessary to maintain the scenario of a bounce toward 2,053 (the 24h high). If it loses 1,896, the bounce scenario is invalidated; wait for more data.
Another point worth noting: BNB is down 5.6%, with no clear reason yet. PEPE is one of the few coins in the green, up 3.4%, with 24h volume of around 84.6 million USDT. There are currently no RSI, EMA, or 4h trend figures, so the scenarios above are based only on the 24h price range.
Data as of 14:16 on 13/11 (UTC+7).
With fear at this level, do you see 67,500 as a bottom or just a temporary pause?
Manage your capital before entering a trade: risk only around one percent of your capital per trade.
Not investment advice. DYOR.
#BinanceSquare #BTC #ETH
BTC fell 5.8% in 24h to 69,195 USDT, ETH lost 4.9%, and the Fear & Greed Index is at 20 (extreme fear).
Here’s how I read it: this is a broad sell-off, not one coin breaking down on its own. Both major coins hit their intraday lows at 67,568 (BTC) and 1,895.95 (ETH), so the market is retesting these levels.
$BTC : If it holds above 67,568, there may be a bounce toward 73,700 (the 24h high), but I haven’t seen confirmation of a reversal yet. If the 4h candle closes below 67,568, the outlook leans bearish, with the possibility of a further drop.
$ETH : Similarly, holding 1,896 is necessary to maintain the scenario of a bounce toward 2,053 (the 24h high). If it loses 1,896, the bounce scenario is invalidated; wait for more data.
Another point worth noting: BNB is down 5.6%, with no clear reason yet. PEPE is one of the few coins in the green, up 3.4%, with 24h volume of around 84.6 million USDT. There are currently no RSI, EMA, or 4h trend figures, so the scenarios above are based only on the 24h price range.
Data as of 14:16 on 13/11 (UTC+7).
With fear at this level, do you see 67,500 as a bottom or just a temporary pause?
Manage your capital before entering a trade: risk only around one percent of your capital per trade.
Not investment advice. DYOR.
#BinanceSquare #BTC #ETH
Here’s how I read it: this is a broad sell-off, not one coin breaking down on its own. Both major coins hit their intraday lows at 67,568 (BTC) and 1,895.95 (ETH), so the market is retesting these levels.
$BTC : If it holds above 67,568, there may be a bounce toward 73,700 (the 24h high), but I haven’t seen confirmation of a reversal yet. If the 4h candle closes below 67,568, the outlook leans bearish, with the possibility of a further drop.
$ETH : Similarly, holding 1,896 is necessary to maintain the scenario of a bounce toward 2,053 (the 24h high). If it loses 1,896, the bounce scenario is invalidated; wait for more data.
Another point worth noting: BNB is down 5.6%, with no clear reason yet. PEPE is one of the few coins in the green, up 3.4%, with 24h volume of around 84.6 million USDT. There are currently no RSI, EMA, or 4h trend figures, so the scenarios above are based only on the 24h price range.
Data as of 14:16 on 13/11 (UTC+7).
With fear at this level, do you see 67,500 as a bottom or just a temporary pause?
Manage your capital before entering a trade: risk only around one percent of your capital per trade.
Not investment advice. DYOR.
#BinanceSquare #BTC #ETH
420
·
--
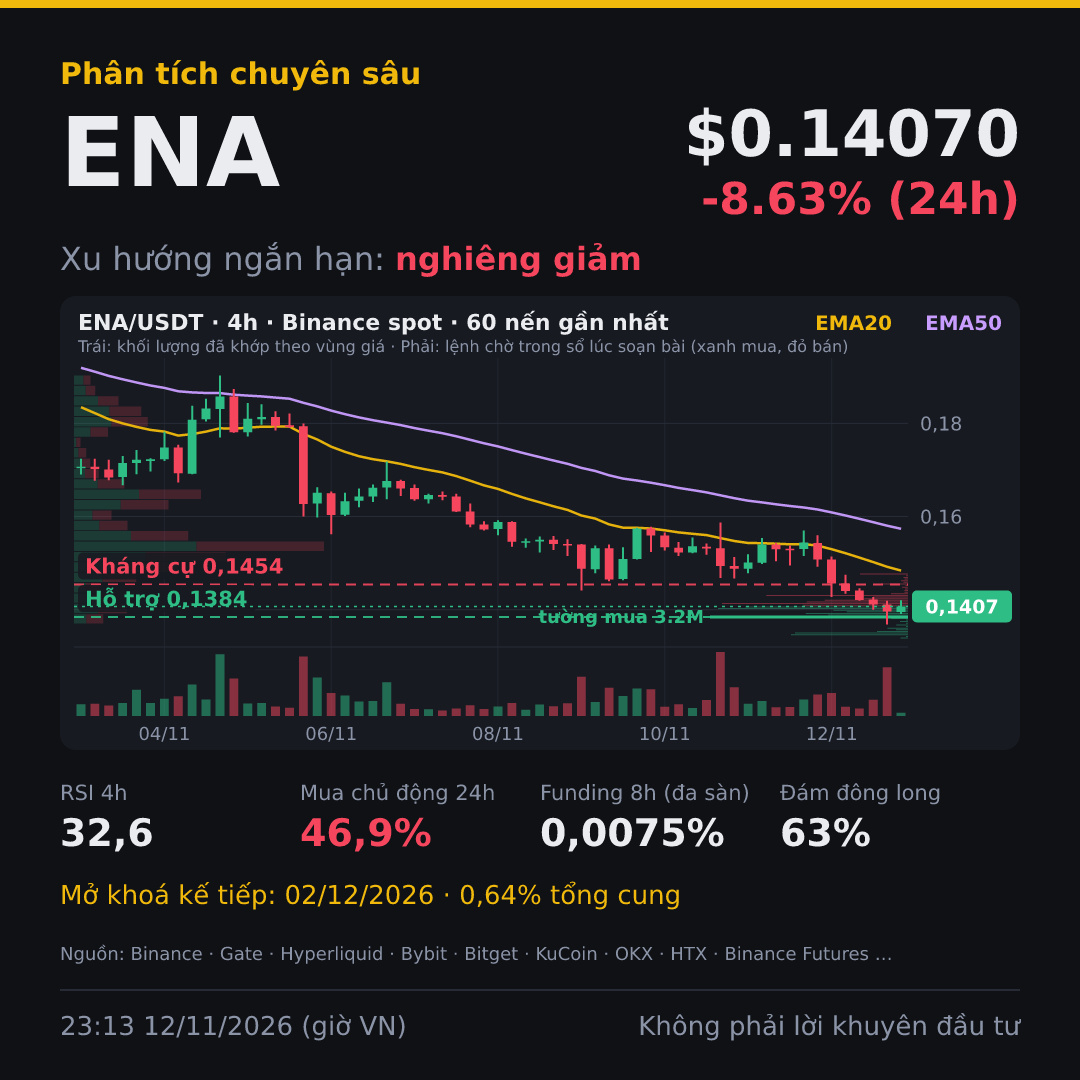
📉 BEARISH | $ENA Bearish: price is below EMA20 and EMA50 on all three timeframes—1h, 4h, and 1d—while buyers accounted for only 46.9% of 24-hour volume on Binance spot.
🕰 CONTEXT: Since the news broke (10:56 on 11/11), the price has fallen 8.2%. After the news, buyers accounted for 47% of volume (48% before the news), while net selling totaled 2.5 million USDT: sellers remain in control. Total open interest (OI) has fallen 7.8% since the news, suggesting traders are closing positions and reducing leverage.
📰 Positive news, moderate impact (Coinfomania, 11/11): Ethena opens a market for discounted notes worth $50 million. After the news, the price briefly rose +2.5%, then fell to -10.7%; it is now -8.2% compared with before the news.
📊 TECHNICALS: All three timeframes agree on a bearish trend, with the price at 0.1407 USDT stuck below the 4h EMA20 at 0.14839 USDT. The 4h MACD histogram is negative but narrowing, so downward momentum is weakening, though there is no reversal yet.
💰 FLOWS: 24-hour aggressive buys minus sells on Binance spot is -1.72 million USDT, meaning net outflows. Binance top traders hold 57.9% of positions long, but the average across three exchanges is only 52.3%, so this signal is not strong enough to change the outlook.
₿ VS. BTC: Over the past 24 hours, during the hours when BTC rose, its cumulative gain was +1.92% while ENA was -0.74%; during the hours when BTC fell, its cumulative loss was -4.81% while ENA was -8.68%. ENA is weaker than BTC: it rises less and falls more.
🎯 LEVELS TO WATCH FOR $ENA: support 0.1384 USDT · resistance 0.1454 USDT
🔎 CONCLUSION: Spot flows and all three timeframes point downward, giving short sellers an advantage while the price remains below 0.1454. Long traders should wait for the price to break above 0.1454 for confirmation.
⚠️ This outlook is invalidated if the 4-hour ENA/USDT candle on Binance spot closes above 0.1454 (the current candle closes at 03:00 on 13/11).
Data as of 23:13 on 12/11 (Vietnam time).
At this price level of 0.1407, are you leaning long or short, and why?
Manage your capital before entering a trade: each trade should risk only about one percent of your capital.
Not investment advice. DYOR.
#BinanceSquare #ENA
📉 BEARISH | $ENA Bearish: price is below EMA20 and EMA50 on all three timeframes—1h, 4h, and 1d—while buyers accounted for only 46.9% of 24-hour volume on Binance spot.
🕰 CONTEXT: Since the news broke (10:56 on 11/11), the price has fallen 8.2%. After the news, buyers accounted for 47% of volume (48% before the news), while net selling totaled 2.5 million USDT: sellers remain in control. Total open interest (OI) has fallen 7.8% since the news, suggesting traders are closing positions and reducing leverage.
📰 Positive news, moderate impact (Coinfomania, 11/11): Ethena opens a market for discounted notes worth $50 million. After the news, the price briefly rose +2.5%, then fell to -10.7%; it is now -8.2% compared with before the news.
📊 TECHNICALS: All three timeframes agree on a bearish trend, with the price at 0.1407 USDT stuck below the 4h EMA20 at 0.14839 USDT. The 4h MACD histogram is negative but narrowing, so downward momentum is weakening, though there is no reversal yet.
💰 FLOWS: 24-hour aggressive buys minus sells on Binance spot is -1.72 million USDT, meaning net outflows. Binance top traders hold 57.9% of positions long, but the average across three exchanges is only 52.3%, so this signal is not strong enough to change the outlook.
₿ VS. BTC: Over the past 24 hours, during the hours when BTC rose, its cumulative gain was +1.92% while ENA was -0.74%; during the hours when BTC fell, its cumulative loss was -4.81% while ENA was -8.68%. ENA is weaker than BTC: it rises less and falls more.
🎯 LEVELS TO WATCH FOR $ENA : support 0.1384 USDT · resistance 0.1454 USDT
🔎 CONCLUSION: Spot flows and all three timeframes point downward, giving short sellers an advantage while the price remains below 0.1454. Long traders should wait for the price to break above 0.1454 for confirmation.
⚠️ This outlook is invalidated if the 4-hour ENA/USDT candle on Binance spot closes above 0.1454 (the current candle closes at 03:00 on 13/11).
Data as of 23:13 on 12/11 (Vietnam time).
At this price level of 0.1407, are you leaning long or short, and why?
Manage your capital before entering a trade: each trade should risk only about one percent of your capital.
Not investment advice. DYOR.
#BinanceSquare #ENA
🕰 CONTEXT: Since the news broke (10:56 on 11/11), the price has fallen 8.2%. After the news, buyers accounted for 47% of volume (48% before the news), while net selling totaled 2.5 million USDT: sellers remain in control. Total open interest (OI) has fallen 7.8% since the news, suggesting traders are closing positions and reducing leverage.
📰 Positive news, moderate impact (Coinfomania, 11/11): Ethena opens a market for discounted notes worth $50 million. After the news, the price briefly rose +2.5%, then fell to -10.7%; it is now -8.2% compared with before the news.
📊 TECHNICALS: All three timeframes agree on a bearish trend, with the price at 0.1407 USDT stuck below the 4h EMA20 at 0.14839 USDT. The 4h MACD histogram is negative but narrowing, so downward momentum is weakening, though there is no reversal yet.
💰 FLOWS: 24-hour aggressive buys minus sells on Binance spot is -1.72 million USDT, meaning net outflows. Binance top traders hold 57.9% of positions long, but the average across three exchanges is only 52.3%, so this signal is not strong enough to change the outlook.
₿ VS. BTC: Over the past 24 hours, during the hours when BTC rose, its cumulative gain was +1.92% while ENA was -0.74%; during the hours when BTC fell, its cumulative loss was -4.81% while ENA was -8.68%. ENA is weaker than BTC: it rises less and falls more.
🎯 LEVELS TO WATCH FOR $ENA : support 0.1384 USDT · resistance 0.1454 USDT
🔎 CONCLUSION: Spot flows and all three timeframes point downward, giving short sellers an advantage while the price remains below 0.1454. Long traders should wait for the price to break above 0.1454 for confirmation.
⚠️ This outlook is invalidated if the 4-hour ENA/USDT candle on Binance spot closes above 0.1454 (the current candle closes at 03:00 on 13/11).
Data as of 23:13 on 12/11 (Vietnam time).
At this price level of 0.1407, are you leaning long or short, and why?
Manage your capital before entering a trade: each trade should risk only about one percent of your capital.
Not investment advice. DYOR.
#BinanceSquare #ENA
301
·
--
Partly True
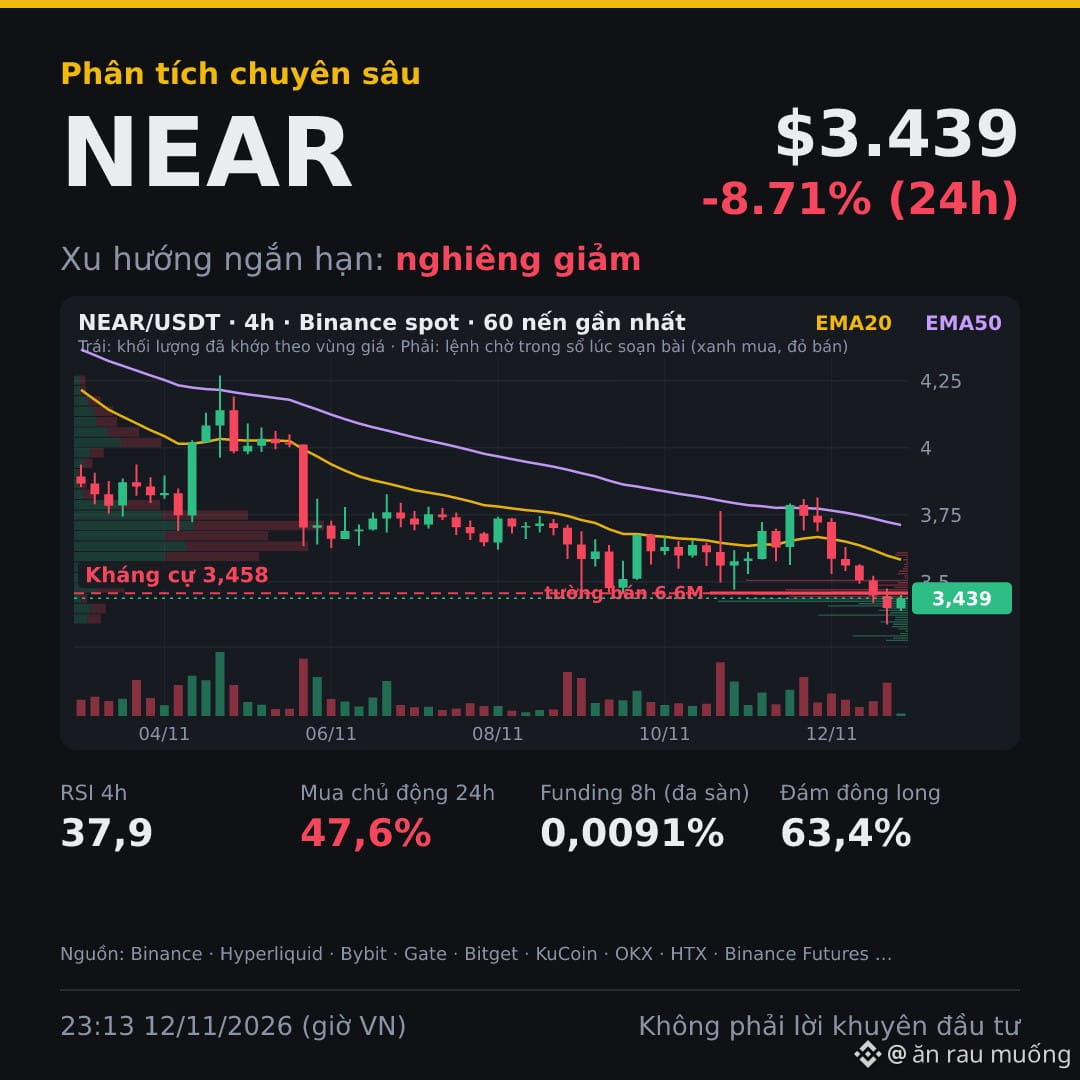
📉 BEARISH | $NEAR down 8.7% in 24 hours following the security incident reported on 11/11. Bearish bias because all three timeframes—daily, 4h, and 1h—are below EMA50. Volatility is higher than usual because of this news.
🕰 CONTEXT: Since the news broke (03:26 on 10/11), the price has fallen 4.9%. Since then, buyers have accounted for 50% of volume (49% before the news), with net selling of 2.2 million USDT: the two sides are locked in a struggle. The last time this coin faced similar bad news (28/10), its price was 14% lower a week later. It has only happened three times, so this is not yet a pattern.
📰 BAD NEWS, high impact (AMBCrypto, 11/11): $430,000 from the Binance hack was traced through 6 NEAR memecoins. Since the news broke (03:26 on 10/11), the price first rose +5.5%, then fell to -7.6%; it is currently at -4.9%. It has not been confirmed that the issue has been fully resolved.
📊 TECHNICALS: The price is 3.439 USDT, below EMA50 on all three timeframes: 4h (3.7143), 1h (3.5698), and daily (4.0908), so the downtrend remains intact. In the opposite direction: the 1h MACD is negative but narrowing, not enough to signal a reversal.
💰 FLOWS: On Binance spot over 24 hours, aggressive sellers have dominated: aggressive buying was 47.6%, with net selling of 3.23 million USDT, so sellers have the edge in executed orders. On Binance Futures alone, 71.4% of top traders' positions are long, while 58.5% of retail accounts are long; however, top traders on OKX and Gate are only close to 50% long.
₿ VS. BTC: Over the past 24 hours, during the hours when BTC rose, its cumulative gain was +1.92% while NEAR fell 0.94%; during the hours when BTC fell, its cumulative loss was -4.81% while NEAR fell 8.61%. NEAR is weaker than BTC: it rises less and falls more.
🎯 LEVELS TO WATCH FOR $NEAR: support 2.931 USDT · resistance 3.458 USDT
Scenario: Short sellers have the edge while the price remains below 3.458 USDT, with 2.931 USDT as the next level to test. The short thesis is invalidated if a 4-hour NEAR/USDT candle on Binance spot closes above 3.458 USDT (the current candle closes at 03:00 on 13/11). Long traders are waiting for exactly that condition.
⚠️ A 4-hour NEAR/USDT candle on Binance spot closing above 3.458 USDT would invalidate the bearish outlook.
Data as of 23:13 on 12/11 (UTC+7).
At 3.458 USDT, do you lean long or short, and why?
Manage your capital before entering a trade: risk only about one percent of your capital per trade.
Not investment advice. DYOR.
#BinanceSquare #NEAR #Crypto
📉 BEARISH | $NEAR down 8.7% in 24 hours following the security incident reported on 11/11. Bearish bias because all three timeframes—daily, 4h, and 1h—are below EMA50. Volatility is higher than usual because of this news.
🕰 CONTEXT: Since the news broke (03:26 on 10/11), the price has fallen 4.9%. Since then, buyers have accounted for 50% of volume (49% before the news), with net selling of 2.2 million USDT: the two sides are locked in a struggle. The last time this coin faced similar bad news (28/10), its price was 14% lower a week later. It has only happened three times, so this is not yet a pattern.
📰 BAD NEWS, high impact (AMBCrypto, 11/11): $430,000 from the Binance hack was traced through 6 NEAR memecoins. Since the news broke (03:26 on 10/11), the price first rose +5.5%, then fell to -7.6%; it is currently at -4.9%. It has not been confirmed that the issue has been fully resolved.
📊 TECHNICALS: The price is 3.439 USDT, below EMA50 on all three timeframes: 4h (3.7143), 1h (3.5698), and daily (4.0908), so the downtrend remains intact. In the opposite direction: the 1h MACD is negative but narrowing, not enough to signal a reversal.
💰 FLOWS: On Binance spot over 24 hours, aggressive sellers have dominated: aggressive buying was 47.6%, with net selling of 3.23 million USDT, so sellers have the edge in executed orders. On Binance Futures alone, 71.4% of top traders' positions are long, while 58.5% of retail accounts are long; however, top traders on OKX and Gate are only close to 50% long.
₿ VS. BTC: Over the past 24 hours, during the hours when BTC rose, its cumulative gain was +1.92% while NEAR fell 0.94%; during the hours when BTC fell, its cumulative loss was -4.81% while NEAR fell 8.61%. NEAR is weaker than BTC: it rises less and falls more.
🎯 LEVELS TO WATCH FOR $NEAR : support 2.931 USDT · resistance 3.458 USDT
Scenario: Short sellers have the edge while the price remains below 3.458 USDT, with 2.931 USDT as the next level to test. The short thesis is invalidated if a 4-hour NEAR/USDT candle on Binance spot closes above 3.458 USDT (the current candle closes at 03:00 on 13/11). Long traders are waiting for exactly that condition.
⚠️ A 4-hour NEAR/USDT candle on Binance spot closing above 3.458 USDT would invalidate the bearish outlook.
Data as of 23:13 on 12/11 (UTC+7).
At 3.458 USDT, do you lean long or short, and why?
Manage your capital before entering a trade: risk only about one percent of your capital per trade.
Not investment advice. DYOR.
#BinanceSquare #NEAR #Crypto
🕰 CONTEXT: Since the news broke (03:26 on 10/11), the price has fallen 4.9%. Since then, buyers have accounted for 50% of volume (49% before the news), with net selling of 2.2 million USDT: the two sides are locked in a struggle. The last time this coin faced similar bad news (28/10), its price was 14% lower a week later. It has only happened three times, so this is not yet a pattern.
📰 BAD NEWS, high impact (AMBCrypto, 11/11): $430,000 from the Binance hack was traced through 6 NEAR memecoins. Since the news broke (03:26 on 10/11), the price first rose +5.5%, then fell to -7.6%; it is currently at -4.9%. It has not been confirmed that the issue has been fully resolved.
📊 TECHNICALS: The price is 3.439 USDT, below EMA50 on all three timeframes: 4h (3.7143), 1h (3.5698), and daily (4.0908), so the downtrend remains intact. In the opposite direction: the 1h MACD is negative but narrowing, not enough to signal a reversal.
💰 FLOWS: On Binance spot over 24 hours, aggressive sellers have dominated: aggressive buying was 47.6%, with net selling of 3.23 million USDT, so sellers have the edge in executed orders. On Binance Futures alone, 71.4% of top traders' positions are long, while 58.5% of retail accounts are long; however, top traders on OKX and Gate are only close to 50% long.
₿ VS. BTC: Over the past 24 hours, during the hours when BTC rose, its cumulative gain was +1.92% while NEAR fell 0.94%; during the hours when BTC fell, its cumulative loss was -4.81% while NEAR fell 8.61%. NEAR is weaker than BTC: it rises less and falls more.
🎯 LEVELS TO WATCH FOR $NEAR : support 2.931 USDT · resistance 3.458 USDT
Scenario: Short sellers have the edge while the price remains below 3.458 USDT, with 2.931 USDT as the next level to test. The short thesis is invalidated if a 4-hour NEAR/USDT candle on Binance spot closes above 3.458 USDT (the current candle closes at 03:00 on 13/11). Long traders are waiting for exactly that condition.
⚠️ A 4-hour NEAR/USDT candle on Binance spot closing above 3.458 USDT would invalidate the bearish outlook.
Data as of 23:13 on 12/11 (UTC+7).
At 3.458 USDT, do you lean long or short, and why?
Manage your capital before entering a trade: risk only about one percent of your capital per trade.
Not investment advice. DYOR.
#BinanceSquare #NEAR #Crypto
542
·
--
📉 NEUTRAL | $INIT Down 21.4% in the 24 hours after the Nov 11 security incident, so volatility is higher than usual. Active selling over the past hour and position closures are the main factors, but selling pressure is not yet strong enough to call it sustained selling.
🕰 CONTEXT: Since the news broke (14:59 on Nov 10), the price rose as much as 75% before falling back; it is now 47% below its pre-news level. Since the news, buyers accounted for 52% of volume (49% before the news), with net buying of 2.9 million USDT: the two sides are evenly matched. Total open interest (OI) is down 45% since the news: traders are closing positions and reducing leverage. The last time this coin faced similar bad news (Oct 23), its price was 45% higher a week later. That’s only one instance, so it’s not a pattern. Short sellers are very crowded (funding -0.31%/8h), so the price could rebound sharply.
📰 BAD NEWS, high impact: Initia IBC Exploit, $3.27 million drained through spoofing and L1 temporarily halted (Coin Gabbar, 21:45 on Nov 11).
💰 SPOT (Binance): Active buying over 24 hours was 49.7%, nearly balanced; in the most recent hour it was just 37.5%, giving sellers the short-term advantage.
🐋 WHALES AND THE CROWD: top traders are long 53.4% of positions, and the crowd is 53% long. Both lean long while the price is still falling, making the long side more vulnerable to losses.
💸 FUNDING AND OI: funding is -0.309%/8h, so shorts are paying fees and are crowded. OI fell 13.5% along with the price: positions are being closed, not added to.
💧 LIQUIDITY: the order book within ±2% has only 28,900 USDT, making it very thin, so a few orders could move the price; the largest sell wall is about 653 thousand USDT around 0.1214.
🚨 PUMP-AND-DUMP RISK: high. 24-hour volume is 77.3% of market cap (heavy speculation), and the thin order book makes the price easy to push in either direction.
🎯 $INIT LEVELS TO WATCH: support 0.1152 USDT · resistance 0.1214 USDT
🔎 CONCLUSION: One-hour selling and falling OI tilt the short-term outlook toward shorts; neither side has won in the middle range. Longs need a 4-hour INIT/USDT Binance spot candle to close above 0.1214; shorts need it to close below 0.1152 (candle closes at 03:00 on Nov 13).
Data as of 23:13 on Nov 12 (Vietnam time).
In the 0.1152 to 0.1214 range, do you lean long or short, and why?
Manage your capital before entering a trade: each trade should risk only about one percent of your capital.
Not investment advice. DYOR.
#BinanceSquare #INIT #Initia
📉 NEUTRAL | $INIT Down 21.4% in the 24 hours after the Nov 11 security incident, so volatility is higher than usual. Active selling over the past hour and position closures are the main factors, but selling pressure is not yet strong enough to call it sustained selling.
🕰 CONTEXT: Since the news broke (14:59 on Nov 10), the price rose as much as 75% before falling back; it is now 47% below its pre-news level. Since the news, buyers accounted for 52% of volume (49% before the news), with net buying of 2.9 million USDT: the two sides are evenly matched. Total open interest (OI) is down 45% since the news: traders are closing positions and reducing leverage. The last time this coin faced similar bad news (Oct 23), its price was 45% higher a week later. That’s only one instance, so it’s not a pattern. Short sellers are very crowded (funding -0.31%/8h), so the price could rebound sharply.
📰 BAD NEWS, high impact: Initia IBC Exploit, $3.27 million drained through spoofing and L1 temporarily halted (Coin Gabbar, 21:45 on Nov 11).
💰 SPOT (Binance): Active buying over 24 hours was 49.7%, nearly balanced; in the most recent hour it was just 37.5%, giving sellers the short-term advantage.
🐋 WHALES AND THE CROWD: top traders are long 53.4% of positions, and the crowd is 53% long. Both lean long while the price is still falling, making the long side more vulnerable to losses.
💸 FUNDING AND OI: funding is -0.309%/8h, so shorts are paying fees and are crowded. OI fell 13.5% along with the price: positions are being closed, not added to.
💧 LIQUIDITY: the order book within ±2% has only 28,900 USDT, making it very thin, so a few orders could move the price; the largest sell wall is about 653 thousand USDT around 0.1214.
🚨 PUMP-AND-DUMP RISK: high. 24-hour volume is 77.3% of market cap (heavy speculation), and the thin order book makes the price easy to push in either direction.
🎯 $INIT LEVELS TO WATCH: support 0.1152 USDT · resistance 0.1214 USDT
🔎 CONCLUSION: One-hour selling and falling OI tilt the short-term outlook toward shorts; neither side has won in the middle range. Longs need a 4-hour INIT/USDT Binance spot candle to close above 0.1214; shorts need it to close below 0.1152 (candle closes at 03:00 on Nov 13).
Data as of 23:13 on Nov 12 (Vietnam time).
In the 0.1152 to 0.1214 range, do you lean long or short, and why?
Manage your capital before entering a trade: each trade should risk only about one percent of your capital.
Not investment advice. DYOR.
#BinanceSquare #INIT #Initia
🕰 CONTEXT: Since the news broke (14:59 on Nov 10), the price rose as much as 75% before falling back; it is now 47% below its pre-news level. Since the news, buyers accounted for 52% of volume (49% before the news), with net buying of 2.9 million USDT: the two sides are evenly matched. Total open interest (OI) is down 45% since the news: traders are closing positions and reducing leverage. The last time this coin faced similar bad news (Oct 23), its price was 45% higher a week later. That’s only one instance, so it’s not a pattern. Short sellers are very crowded (funding -0.31%/8h), so the price could rebound sharply.
📰 BAD NEWS, high impact: Initia IBC Exploit, $3.27 million drained through spoofing and L1 temporarily halted (Coin Gabbar, 21:45 on Nov 11).
💰 SPOT (Binance): Active buying over 24 hours was 49.7%, nearly balanced; in the most recent hour it was just 37.5%, giving sellers the short-term advantage.
🐋 WHALES AND THE CROWD: top traders are long 53.4% of positions, and the crowd is 53% long. Both lean long while the price is still falling, making the long side more vulnerable to losses.
💸 FUNDING AND OI: funding is -0.309%/8h, so shorts are paying fees and are crowded. OI fell 13.5% along with the price: positions are being closed, not added to.
💧 LIQUIDITY: the order book within ±2% has only 28,900 USDT, making it very thin, so a few orders could move the price; the largest sell wall is about 653 thousand USDT around 0.1214.
🚨 PUMP-AND-DUMP RISK: high. 24-hour volume is 77.3% of market cap (heavy speculation), and the thin order book makes the price easy to push in either direction.
🎯 $INIT LEVELS TO WATCH: support 0.1152 USDT · resistance 0.1214 USDT
🔎 CONCLUSION: One-hour selling and falling OI tilt the short-term outlook toward shorts; neither side has won in the middle range. Longs need a 4-hour INIT/USDT Binance spot candle to close above 0.1214; shorts need it to close below 0.1152 (candle closes at 03:00 on Nov 13).
Data as of 23:13 on Nov 12 (Vietnam time).
In the 0.1152 to 0.1214 range, do you lean long or short, and why?
Manage your capital before entering a trade: each trade should risk only about one percent of your capital.
Not investment advice. DYOR.
#BinanceSquare #INIT #Initia
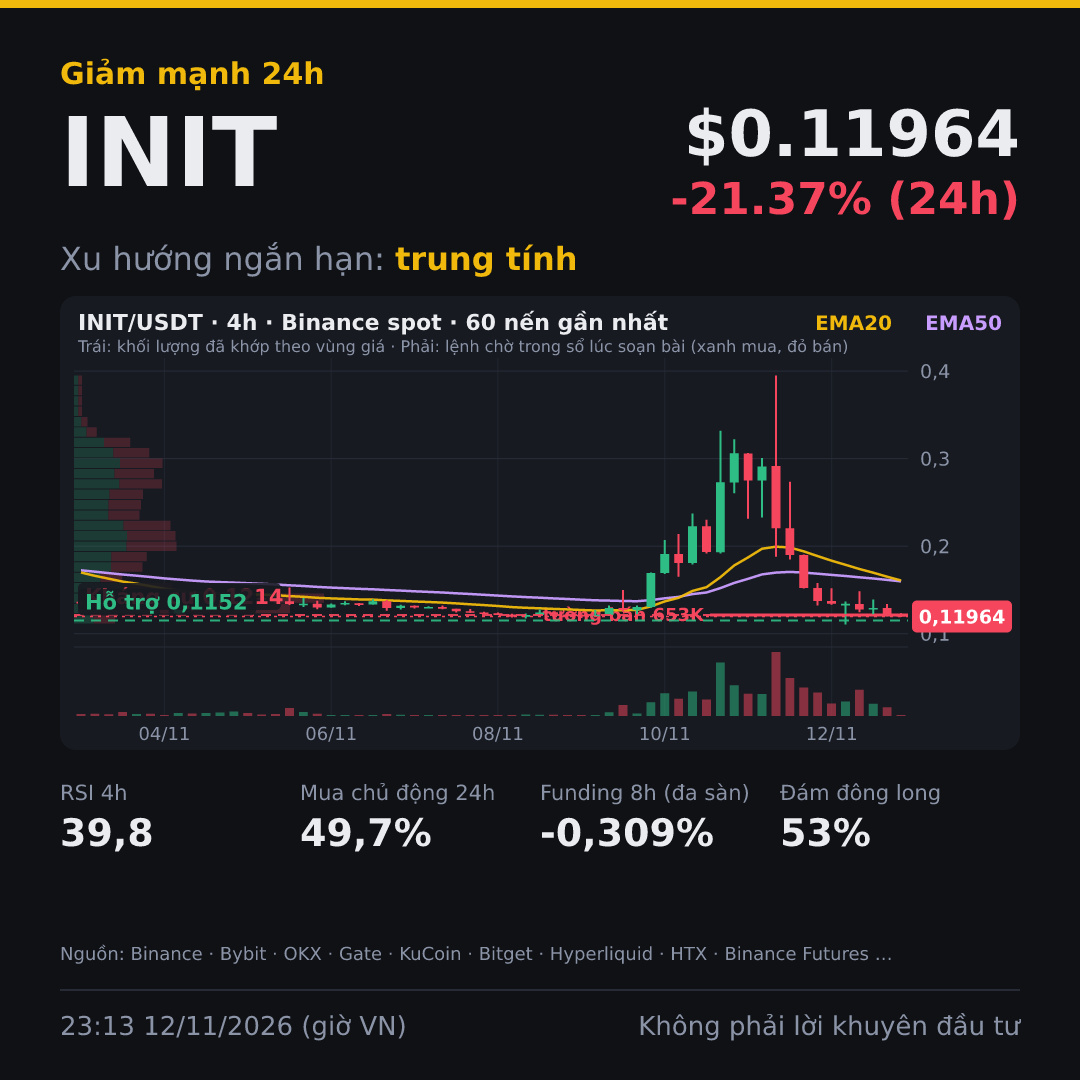
497
·
--
↔️ NEUTRAL | $NVDAB neutral, but the price is below the EMA on all three timeframes and down 9.34% in 24 hours, so the short-term trend is leaning bearish. Aggressive buying over the past 24 hours is slightly higher, which is worth watching.
📊 TECHNICALS: The daily, 4h, and 1h timeframes are all bearish because the price is below the EMA20 and EMA50, so sellers are in control. The daily RSI at 20.3 is oversold, so selling pressure may be easing, but technical signals are only partly reliable for a small-cap coin.
💰 MONEY FLOW: 24-hour volume on Binance spot is 156 million USDT, equal to 102% of market cap, indicating heavy speculation. Aggressive buyers account for 54.1%, with a net difference of 12.6 million USDT, but the price is still falling, so buying has not been enough to push it higher.
₿ VS. BTC: Over the past 24 hours, during the hours when BTC rose, its gains totaled +2.17%, while NVDAB gained +1.06%; during the hours when BTC fell, its losses totaled -3.74%, while NVDAB fell -9.9%. NVDAB is weaker than BTC: it rises less and falls more.
🎯 LEVELS TO WATCH FOR $NVDAB: support 155.1 USDT · resistance 168.5 USDT
Scenario: Between 155.1 and 168.5 USDT, neither side has an advantage. Longs are waiting for a 4-hour NVDAB/USDT candle on Binance spot to close above 168.5 USDT (the current candle closes at 23:00 on 12/11); shorts are waiting for a close below 155.1 USDT.
⚠️ If the price breaks below 155.1 USDT, the current view is invalidated, and the small-cap coin could fall faster than usual.
Data as of 20:43 on 12/11 (Vietnam time).
Between 155.1 and 168.5 USDT, are you leaning long or short, and why?
Manage your risk before entering a trade: risk only about one percent of your capital on each trade.
Not investment advice. DYOR.
#BinanceSquare #NVDAB #Tokenized
↔️ NEUTRAL | $NVDAB neutral, but the price is below the EMA on all three timeframes and down 9.34% in 24 hours, so the short-term trend is leaning bearish. Aggressive buying over the past 24 hours is slightly higher, which is worth watching.
📊 TECHNICALS: The daily, 4h, and 1h timeframes are all bearish because the price is below the EMA20 and EMA50, so sellers are in control. The daily RSI at 20.3 is oversold, so selling pressure may be easing, but technical signals are only partly reliable for a small-cap coin.
💰 MONEY FLOW: 24-hour volume on Binance spot is 156 million USDT, equal to 102% of market cap, indicating heavy speculation. Aggressive buyers account for 54.1%, with a net difference of 12.6 million USDT, but the price is still falling, so buying has not been enough to push it higher.
₿ VS. BTC: Over the past 24 hours, during the hours when BTC rose, its gains totaled +2.17%, while NVDAB gained +1.06%; during the hours when BTC fell, its losses totaled -3.74%, while NVDAB fell -9.9%. NVDAB is weaker than BTC: it rises less and falls more.
🎯 LEVELS TO WATCH FOR $NVDAB : support 155.1 USDT · resistance 168.5 USDT
Scenario: Between 155.1 and 168.5 USDT, neither side has an advantage. Longs are waiting for a 4-hour NVDAB/USDT candle on Binance spot to close above 168.5 USDT (the current candle closes at 23:00 on 12/11); shorts are waiting for a close below 155.1 USDT.
⚠️ If the price breaks below 155.1 USDT, the current view is invalidated, and the small-cap coin could fall faster than usual.
Data as of 20:43 on 12/11 (Vietnam time).
Between 155.1 and 168.5 USDT, are you leaning long or short, and why?
Manage your risk before entering a trade: risk only about one percent of your capital on each trade.
Not investment advice. DYOR.
#BinanceSquare #NVDAB #Tokenized
📊 TECHNICALS: The daily, 4h, and 1h timeframes are all bearish because the price is below the EMA20 and EMA50, so sellers are in control. The daily RSI at 20.3 is oversold, so selling pressure may be easing, but technical signals are only partly reliable for a small-cap coin.
💰 MONEY FLOW: 24-hour volume on Binance spot is 156 million USDT, equal to 102% of market cap, indicating heavy speculation. Aggressive buyers account for 54.1%, with a net difference of 12.6 million USDT, but the price is still falling, so buying has not been enough to push it higher.
₿ VS. BTC: Over the past 24 hours, during the hours when BTC rose, its gains totaled +2.17%, while NVDAB gained +1.06%; during the hours when BTC fell, its losses totaled -3.74%, while NVDAB fell -9.9%. NVDAB is weaker than BTC: it rises less and falls more.
🎯 LEVELS TO WATCH FOR $NVDAB : support 155.1 USDT · resistance 168.5 USDT
Scenario: Between 155.1 and 168.5 USDT, neither side has an advantage. Longs are waiting for a 4-hour NVDAB/USDT candle on Binance spot to close above 168.5 USDT (the current candle closes at 23:00 on 12/11); shorts are waiting for a close below 155.1 USDT.
⚠️ If the price breaks below 155.1 USDT, the current view is invalidated, and the small-cap coin could fall faster than usual.
Data as of 20:43 on 12/11 (Vietnam time).
Between 155.1 and 168.5 USDT, are you leaning long or short, and why?
Manage your risk before entering a trade: risk only about one percent of your capital on each trade.
Not investment advice. DYOR.
#BinanceSquare #NVDAB #Tokenized
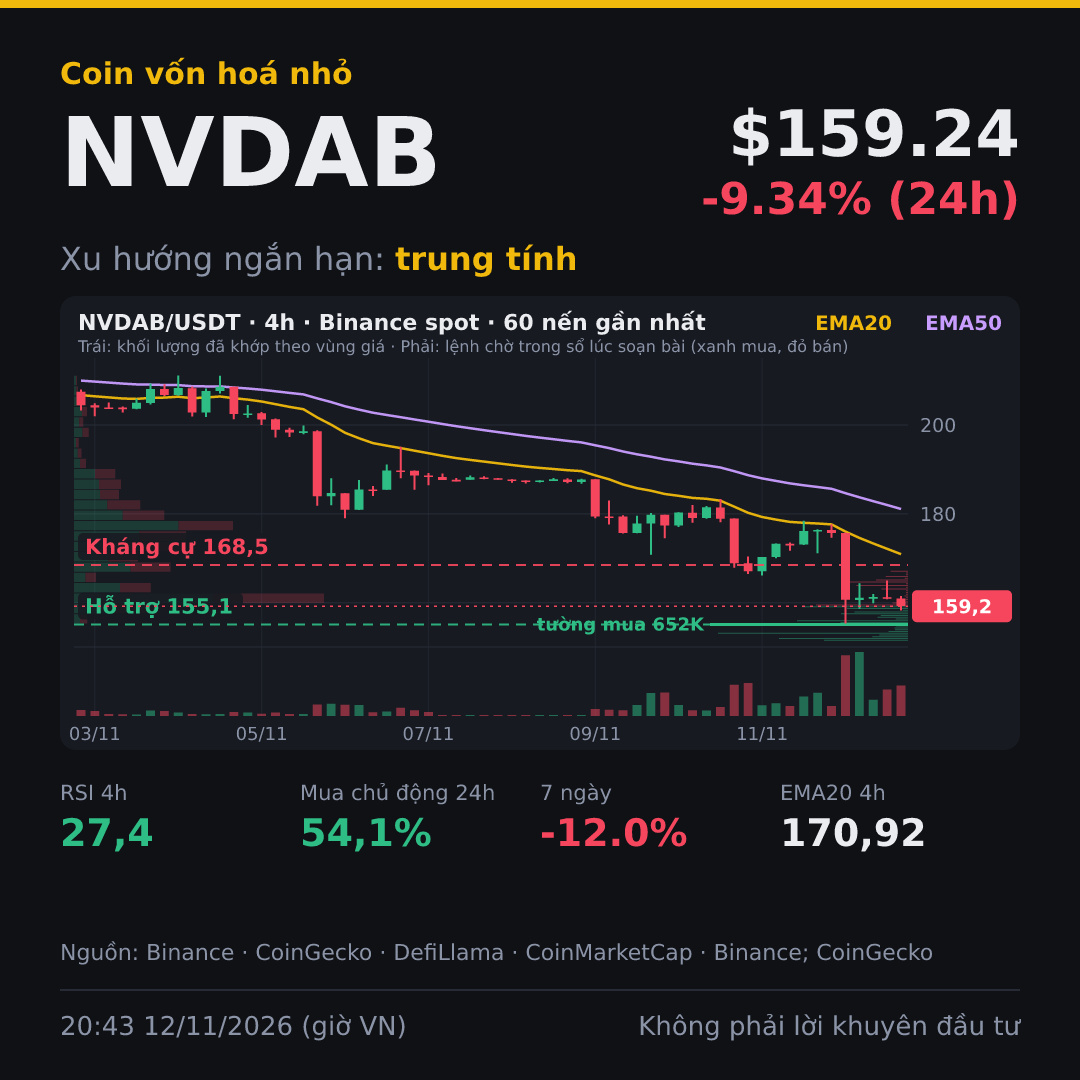
321
·
--
📉 BEARISH | $UNI bearish: price at 6.187 USDT, down 3.52% over 24 hours, and below both EMA20 and EMA50 on all three timeframes: 1h, 4h, and daily.
🕰 CONTEXT: Since the news broke (01:43 on 12/11), the price has fallen 6.4%. After the news, buyers accounted for 41% of volume (43% before the news), with net selling of 6.6 million USDT: sellers are still in control. Total open interest (OI) has declined 6.6% since the news broke: traders are closing positions and reducing leverage.
📰 NEWS: Coinfomania (12/11) reported that Uniswap launched v2, v3, and v4 on Hyperliquid’s Elysium network—a moderately positive development. This news has widened the trading range rather than determining the price direction.
📊 TECHNICALS: The daily, 4h, and 1h timeframes are all bearish, while the 4h RSI at 30.8 is close to oversold territory. But the 4h EMA20 at 6.5817 USDT is still above the price, so sellers remain in control of any rebound.
💰 MONEY FLOW: On Binance spot, aggressive buying accounted for only 43.4% over the past 24 hours, with net selling of 7.02 million USDT, meaning sellers are dominant. Binance Futures top traders hold 72.2% of positions long, but the figures are only 46.1% and 44.4% on OKX and Gate, so this long signal is not enough to reverse the trend.
₿ VS. BTC: Over the past 24 hours, during hours when BTC rose, its gains added up to +2.18%, while UNI gained +2.3%; during hours when BTC fell, its losses added up to -2.92%, while UNI fell -6.55%. UNI is weaker than BTC: it rises less and falls more.
🎯 LEVELS TO WATCH FOR $UNI: support 6.02 USDT · resistance 6.593 USDT
Scenario: Short sellers have the advantage while the price remains below 6.593 USDT, with 6.02 USDT as the next level to test. Long traders are waiting for a 4-hour UNI/USDT candle on Binance spot to close above 6.593 USDT; the current candle closes at 19:00 on 12/11.
⚠️ This analysis is invalidated if a 4-hour UNI/USDT candle on Binance spot closes above 6.593 USDT.
Data as of 17:17 on 12/11 (Vietnam time).
At 6.593 USDT, do you lean long or short, and why?
Manage your capital before entering a trade: risk only about one percent of your capital per trade.
Not investment advice. DYOR.
#BinanceSquare #UNI #Uniswap
📉 BEARISH | $UNI bearish: price at 6.187 USDT, down 3.52% over 24 hours, and below both EMA20 and EMA50 on all three timeframes: 1h, 4h, and daily.
🕰 CONTEXT: Since the news broke (01:43 on 12/11), the price has fallen 6.4%. After the news, buyers accounted for 41% of volume (43% before the news), with net selling of 6.6 million USDT: sellers are still in control. Total open interest (OI) has declined 6.6% since the news broke: traders are closing positions and reducing leverage.
📰 NEWS: Coinfomania (12/11) reported that Uniswap launched v2, v3, and v4 on Hyperliquid’s Elysium network—a moderately positive development. This news has widened the trading range rather than determining the price direction.
📊 TECHNICALS: The daily, 4h, and 1h timeframes are all bearish, while the 4h RSI at 30.8 is close to oversold territory. But the 4h EMA20 at 6.5817 USDT is still above the price, so sellers remain in control of any rebound.
💰 MONEY FLOW: On Binance spot, aggressive buying accounted for only 43.4% over the past 24 hours, with net selling of 7.02 million USDT, meaning sellers are dominant. Binance Futures top traders hold 72.2% of positions long, but the figures are only 46.1% and 44.4% on OKX and Gate, so this long signal is not enough to reverse the trend.
₿ VS. BTC: Over the past 24 hours, during hours when BTC rose, its gains added up to +2.18%, while UNI gained +2.3%; during hours when BTC fell, its losses added up to -2.92%, while UNI fell -6.55%. UNI is weaker than BTC: it rises less and falls more.
🎯 LEVELS TO WATCH FOR $UNI : support 6.02 USDT · resistance 6.593 USDT
Scenario: Short sellers have the advantage while the price remains below 6.593 USDT, with 6.02 USDT as the next level to test. Long traders are waiting for a 4-hour UNI/USDT candle on Binance spot to close above 6.593 USDT; the current candle closes at 19:00 on 12/11.
⚠️ This analysis is invalidated if a 4-hour UNI/USDT candle on Binance spot closes above 6.593 USDT.
Data as of 17:17 on 12/11 (Vietnam time).
At 6.593 USDT, do you lean long or short, and why?
Manage your capital before entering a trade: risk only about one percent of your capital per trade.
Not investment advice. DYOR.
#BinanceSquare #UNI #Uniswap
🕰 CONTEXT: Since the news broke (01:43 on 12/11), the price has fallen 6.4%. After the news, buyers accounted for 41% of volume (43% before the news), with net selling of 6.6 million USDT: sellers are still in control. Total open interest (OI) has declined 6.6% since the news broke: traders are closing positions and reducing leverage.
📰 NEWS: Coinfomania (12/11) reported that Uniswap launched v2, v3, and v4 on Hyperliquid’s Elysium network—a moderately positive development. This news has widened the trading range rather than determining the price direction.
📊 TECHNICALS: The daily, 4h, and 1h timeframes are all bearish, while the 4h RSI at 30.8 is close to oversold territory. But the 4h EMA20 at 6.5817 USDT is still above the price, so sellers remain in control of any rebound.
💰 MONEY FLOW: On Binance spot, aggressive buying accounted for only 43.4% over the past 24 hours, with net selling of 7.02 million USDT, meaning sellers are dominant. Binance Futures top traders hold 72.2% of positions long, but the figures are only 46.1% and 44.4% on OKX and Gate, so this long signal is not enough to reverse the trend.
₿ VS. BTC: Over the past 24 hours, during hours when BTC rose, its gains added up to +2.18%, while UNI gained +2.3%; during hours when BTC fell, its losses added up to -2.92%, while UNI fell -6.55%. UNI is weaker than BTC: it rises less and falls more.
🎯 LEVELS TO WATCH FOR $UNI : support 6.02 USDT · resistance 6.593 USDT
Scenario: Short sellers have the advantage while the price remains below 6.593 USDT, with 6.02 USDT as the next level to test. Long traders are waiting for a 4-hour UNI/USDT candle on Binance spot to close above 6.593 USDT; the current candle closes at 19:00 on 12/11.
⚠️ This analysis is invalidated if a 4-hour UNI/USDT candle on Binance spot closes above 6.593 USDT.
Data as of 17:17 on 12/11 (Vietnam time).
At 6.593 USDT, do you lean long or short, and why?
Manage your capital before entering a trade: risk only about one percent of your capital per trade.
Not investment advice. DYOR.
#BinanceSquare #UNI #Uniswap
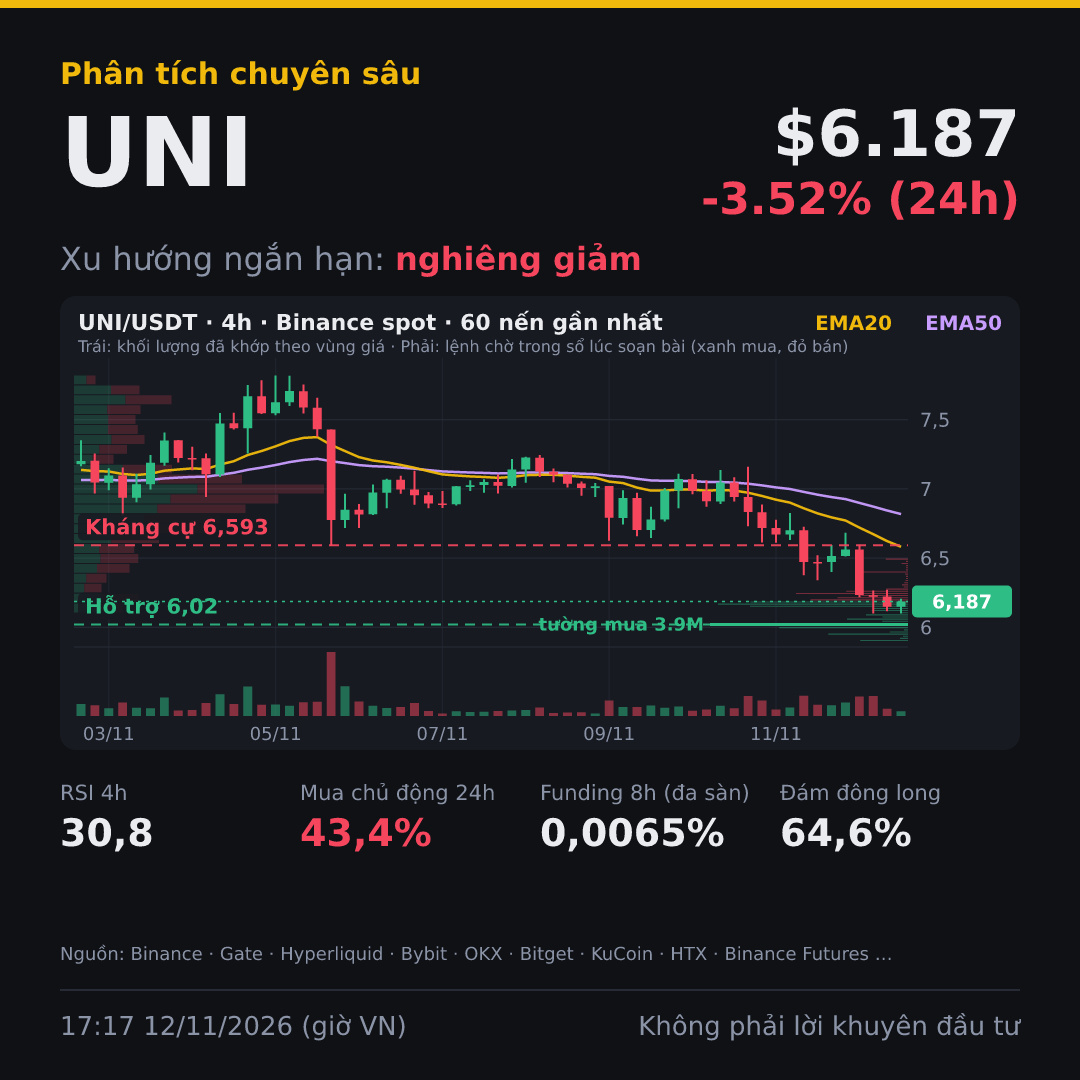
158
·
--
📉 BEARISH | $PEPE bearish despite listing news: price 0.00000443 USDT, -11.5% in 24 hours, active buying on Binance spot only 46.4%.
🕰 CONTEXT: Since the news broke (11:48 on 12/11), the price has fallen 3.3%. After the news, buyers accounted for 42% of volume (47% before the news), with net selling of 2.4 million USDT: sellers are still in control.
📰 NEWS: Coin Gabbar (17:10 on 12/11) reported a listing, positive news with high impact. Since the first report (openPR, 11:48 on 12/11), the highest price was +0.2%, the lowest -3.9%, and it is currently -3.3%.
📊 TECHNICALS: The three timeframes are not aligned: daily is sideways, while 4h and 1h are bearish. The 4h MACD is negative and widening, so downward momentum remains. The 1h RSI at 21.3 is oversold and could bounce briefly.
💰 MONEY FLOW: Binance spot 24-hour active buying is 46.4%, with net selling of 5.02 million USDT; sellers are dominant. OKX-Gate top traders are 45% long, while the crowd is 70.9% long: they are moving in opposite directions.
₿ VS. BTC: Over the past 24 hours, during the hours BTC rose, gains totaled +2.18% while PEPE was -2.09%; during the hours BTC fell, losses totaled -2.92% while PEPE was -10.28%. PEPE is weaker than BTC: it rises less and falls more.
🎯 LEVELS TO WATCH FOR $PEPE: support 0.000004423 USDT · resistance 0.00000463 USDT
🔎 CONCLUSION: With weak active buying and the 4h trend bearish, shorts have the advantage below 0.00000463, with 0.000004423 as a potential test level; longs should wait for the price to break above 0.00000463.
⚠️ The bearish thesis is invalidated if a PEPE/USDT 4-hour candle on Binance spot closes above 0.00000463 (the current candle closes at 19:00 on 12/11).
Data as of 17:17 on 12/11 (UTC+7).
At 0.00000463, are you leaning long or short, and why?
Manage your capital before entering a trade: each trade should risk only about one percent of your capital.
Not investment advice. DYOR.
#BinanceSquare #PEPE #Memecoin
📉 BEARISH | $PEPE bearish despite listing news: price 0.00000443 USDT, -11.5% in 24 hours, active buying on Binance spot only 46.4%.
🕰 CONTEXT: Since the news broke (11:48 on 12/11), the price has fallen 3.3%. After the news, buyers accounted for 42% of volume (47% before the news), with net selling of 2.4 million USDT: sellers are still in control.
📰 NEWS: Coin Gabbar (17:10 on 12/11) reported a listing, positive news with high impact. Since the first report (openPR, 11:48 on 12/11), the highest price was +0.2%, the lowest -3.9%, and it is currently -3.3%.
📊 TECHNICALS: The three timeframes are not aligned: daily is sideways, while 4h and 1h are bearish. The 4h MACD is negative and widening, so downward momentum remains. The 1h RSI at 21.3 is oversold and could bounce briefly.
💰 MONEY FLOW: Binance spot 24-hour active buying is 46.4%, with net selling of 5.02 million USDT; sellers are dominant. OKX-Gate top traders are 45% long, while the crowd is 70.9% long: they are moving in opposite directions.
₿ VS. BTC: Over the past 24 hours, during the hours BTC rose, gains totaled +2.18% while PEPE was -2.09%; during the hours BTC fell, losses totaled -2.92% while PEPE was -10.28%. PEPE is weaker than BTC: it rises less and falls more.
🎯 LEVELS TO WATCH FOR $PEPE : support 0.000004423 USDT · resistance 0.00000463 USDT
🔎 CONCLUSION: With weak active buying and the 4h trend bearish, shorts have the advantage below 0.00000463, with 0.000004423 as a potential test level; longs should wait for the price to break above 0.00000463.
⚠️ The bearish thesis is invalidated if a PEPE/USDT 4-hour candle on Binance spot closes above 0.00000463 (the current candle closes at 19:00 on 12/11).
Data as of 17:17 on 12/11 (UTC+7).
At 0.00000463, are you leaning long or short, and why?
Manage your capital before entering a trade: each trade should risk only about one percent of your capital.
Not investment advice. DYOR.
#BinanceSquare #PEPE #Memecoin
🕰 CONTEXT: Since the news broke (11:48 on 12/11), the price has fallen 3.3%. After the news, buyers accounted for 42% of volume (47% before the news), with net selling of 2.4 million USDT: sellers are still in control.
📰 NEWS: Coin Gabbar (17:10 on 12/11) reported a listing, positive news with high impact. Since the first report (openPR, 11:48 on 12/11), the highest price was +0.2%, the lowest -3.9%, and it is currently -3.3%.
📊 TECHNICALS: The three timeframes are not aligned: daily is sideways, while 4h and 1h are bearish. The 4h MACD is negative and widening, so downward momentum remains. The 1h RSI at 21.3 is oversold and could bounce briefly.
💰 MONEY FLOW: Binance spot 24-hour active buying is 46.4%, with net selling of 5.02 million USDT; sellers are dominant. OKX-Gate top traders are 45% long, while the crowd is 70.9% long: they are moving in opposite directions.
₿ VS. BTC: Over the past 24 hours, during the hours BTC rose, gains totaled +2.18% while PEPE was -2.09%; during the hours BTC fell, losses totaled -2.92% while PEPE was -10.28%. PEPE is weaker than BTC: it rises less and falls more.
🎯 LEVELS TO WATCH FOR $PEPE : support 0.000004423 USDT · resistance 0.00000463 USDT
🔎 CONCLUSION: With weak active buying and the 4h trend bearish, shorts have the advantage below 0.00000463, with 0.000004423 as a potential test level; longs should wait for the price to break above 0.00000463.
⚠️ The bearish thesis is invalidated if a PEPE/USDT 4-hour candle on Binance spot closes above 0.00000463 (the current candle closes at 19:00 on 12/11).
Data as of 17:17 on 12/11 (UTC+7).
At 0.00000463, are you leaning long or short, and why?
Manage your capital before entering a trade: each trade should risk only about one percent of your capital.
Not investment advice. DYOR.
#BinanceSquare #PEPE #Memecoin
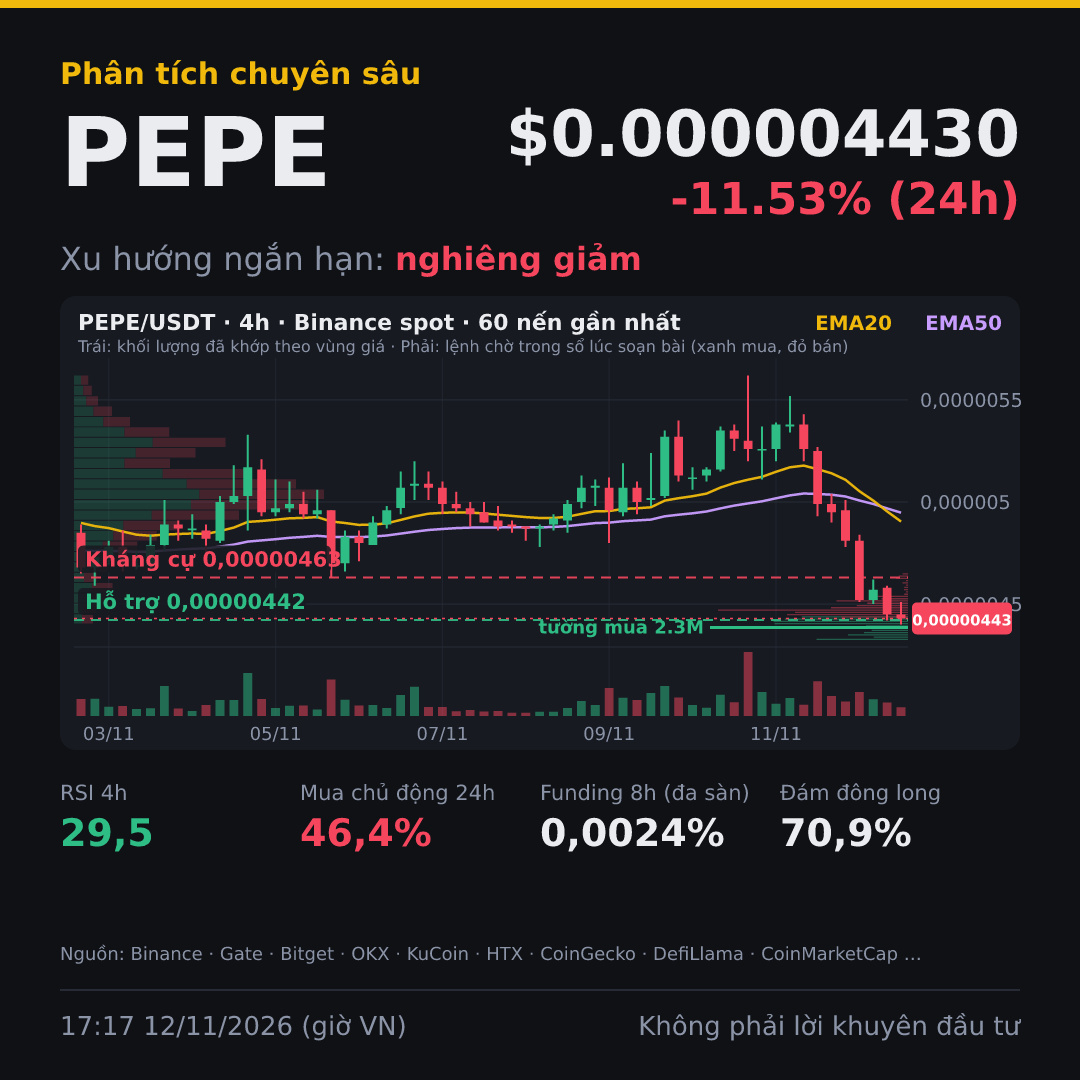
373
·
--
📉 BEARISH BIAS | $BTC bearish: price at 73.483 USDT is below the daily EMA50 (78.692) and the 4h EMA50 (75.438); all three timeframes are bearish. Buyers lack the strength to push the price above 75.120.
🕰 CONTEXT: Since the news broke (17:28 on 11/11), the price has fallen 0,4%. After the news, buyers accounted for 51% of volume (51% before the news), with net buying of 23,9 million USDT: the two sides are struggling for control.
📰 NEGATIVE NEWS, moderate impact: US Bitcoin ETFs saw net outflows of 299,9 million USD on 11/11, their fifth consecutive session (crypto.news, 12/11). Since 17:28 on 11/11, the price has ranged from -0,7% to +1,4% and is currently at -0,4%; no major reaction is evident yet.
📊 TECHNICALS: The daily, 4h, and 1h timeframes are all bearish. The 4h RSI at 37,9 indicates sellers are still in control. The 4h MACD histogram is positive but narrowing, meaning the recovery is losing momentum and is not yet enough to reverse the trend.
💰 FLOWS: Active buying on Binance spot over the past 24 hours is only 51,3%; buyers are not dominant. Binance derivatives: the crowd is 74,1% long and paying funding of 0,0043%/8h, meaning the majority is being charged fees, giving shorts the greater advantage.
🎯 LEVELS TO WATCH $BTC: support 73.120 USDT · resistance 75.120 USDT
🔎 CONCLUSION: Below 75.120, shorts have the advantage, with 73.120 as a test area, because all three timeframes are bearish and the price is below the 4h EMA50.
⚠️ If the current 4-hour BTC/USDT candle on Binance spot closes above 75.120, the bearish outlook is no longer valid, and only then will longs have the advantage.
Data as of 17:17 on 12/11 (UTC+7). The current 4-hour BTC/USDT candle on Binance spot closes at 19:00.
In the 73.120 to 75.120 range, do you favor longs or shorts, and why?
Manage your capital before entering a trade: risk only about one percent of your capital per trade.
Not investment advice. DYOR.
#BinanceSquare #BTC
📉 BEARISH BIAS | $BTC bearish: price at 73.483 USDT is below the daily EMA50 (78.692) and the 4h EMA50 (75.438); all three timeframes are bearish. Buyers lack the strength to push the price above 75.120.
🕰 CONTEXT: Since the news broke (17:28 on 11/11), the price has fallen 0,4%. After the news, buyers accounted for 51% of volume (51% before the news), with net buying of 23,9 million USDT: the two sides are struggling for control.
📰 NEGATIVE NEWS, moderate impact: US Bitcoin ETFs saw net outflows of 299,9 million USD on 11/11, their fifth consecutive session (crypto.news, 12/11). Since 17:28 on 11/11, the price has ranged from -0,7% to +1,4% and is currently at -0,4%; no major reaction is evident yet.
📊 TECHNICALS: The daily, 4h, and 1h timeframes are all bearish. The 4h RSI at 37,9 indicates sellers are still in control. The 4h MACD histogram is positive but narrowing, meaning the recovery is losing momentum and is not yet enough to reverse the trend.
💰 FLOWS: Active buying on Binance spot over the past 24 hours is only 51,3%; buyers are not dominant. Binance derivatives: the crowd is 74,1% long and paying funding of 0,0043%/8h, meaning the majority is being charged fees, giving shorts the greater advantage.
🎯 LEVELS TO WATCH $BTC : support 73.120 USDT · resistance 75.120 USDT
🔎 CONCLUSION: Below 75.120, shorts have the advantage, with 73.120 as a test area, because all three timeframes are bearish and the price is below the 4h EMA50.
⚠️ If the current 4-hour BTC/USDT candle on Binance spot closes above 75.120, the bearish outlook is no longer valid, and only then will longs have the advantage.
Data as of 17:17 on 12/11 (UTC+7). The current 4-hour BTC/USDT candle on Binance spot closes at 19:00.
In the 73.120 to 75.120 range, do you favor longs or shorts, and why?
Manage your capital before entering a trade: risk only about one percent of your capital per trade.
Not investment advice. DYOR.
#BinanceSquare #BTC
🕰 CONTEXT: Since the news broke (17:28 on 11/11), the price has fallen 0,4%. After the news, buyers accounted for 51% of volume (51% before the news), with net buying of 23,9 million USDT: the two sides are struggling for control.
📰 NEGATIVE NEWS, moderate impact: US Bitcoin ETFs saw net outflows of 299,9 million USD on 11/11, their fifth consecutive session (crypto.news, 12/11). Since 17:28 on 11/11, the price has ranged from -0,7% to +1,4% and is currently at -0,4%; no major reaction is evident yet.
📊 TECHNICALS: The daily, 4h, and 1h timeframes are all bearish. The 4h RSI at 37,9 indicates sellers are still in control. The 4h MACD histogram is positive but narrowing, meaning the recovery is losing momentum and is not yet enough to reverse the trend.
💰 FLOWS: Active buying on Binance spot over the past 24 hours is only 51,3%; buyers are not dominant. Binance derivatives: the crowd is 74,1% long and paying funding of 0,0043%/8h, meaning the majority is being charged fees, giving shorts the greater advantage.
🎯 LEVELS TO WATCH $BTC : support 73.120 USDT · resistance 75.120 USDT
🔎 CONCLUSION: Below 75.120, shorts have the advantage, with 73.120 as a test area, because all three timeframes are bearish and the price is below the 4h EMA50.
⚠️ If the current 4-hour BTC/USDT candle on Binance spot closes above 75.120, the bearish outlook is no longer valid, and only then will longs have the advantage.
Data as of 17:17 on 12/11 (UTC+7). The current 4-hour BTC/USDT candle on Binance spot closes at 19:00.
In the 73.120 to 75.120 range, do you favor longs or shorts, and why?
Manage your capital before entering a trade: risk only about one percent of your capital per trade.
Not investment advice. DYOR.
#BinanceSquare #BTC
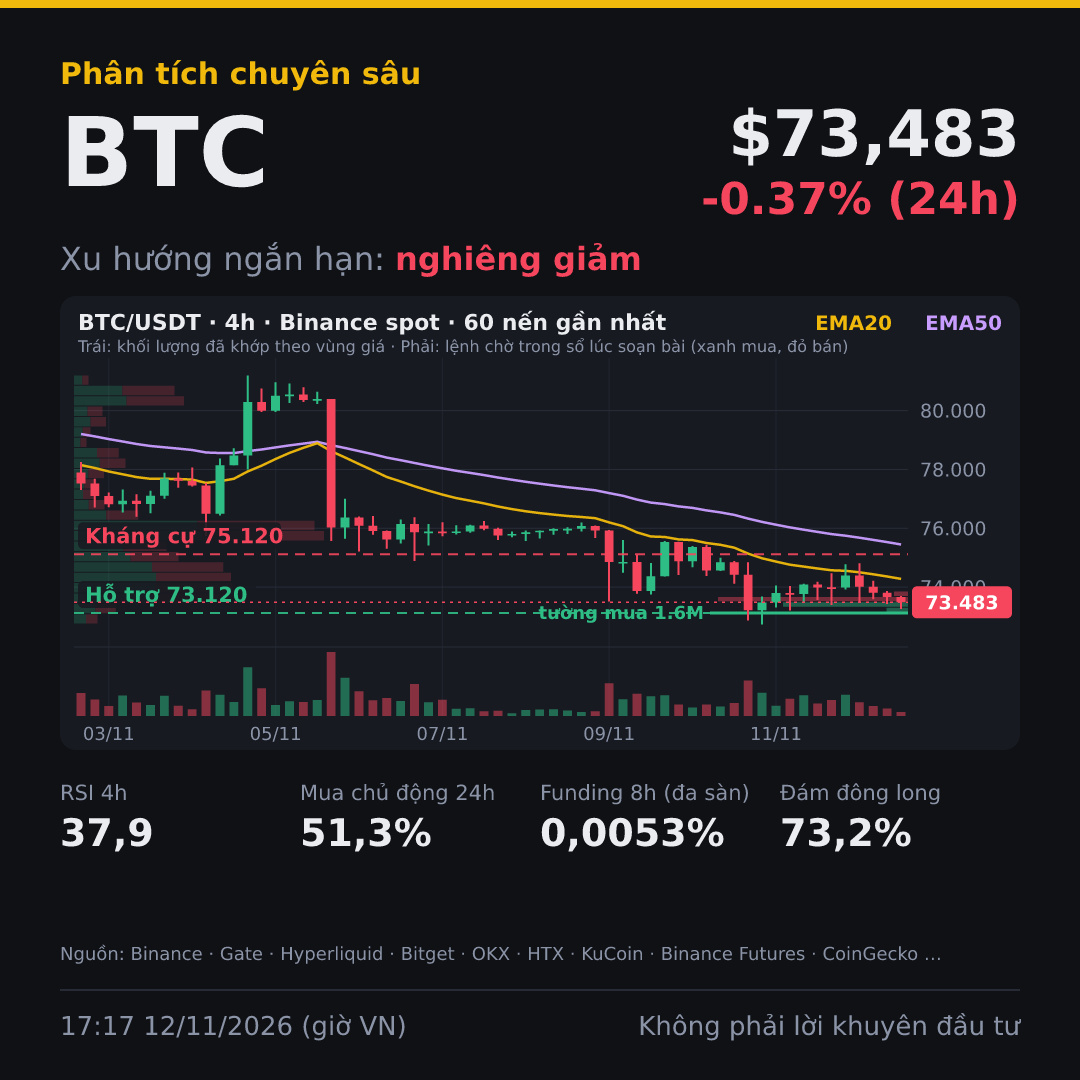
226
·
--
BTC is trading around 73,577 USDT, while the Fear & Greed Index is at 28 (Fear).
Data as of 14:42 12/11 (UTC+7). $BTC edged down 0.4% over 24 hours, trading between 73,390 and 74,811. 24-hour volume was around 965 million USDT. There are no signals yet that BTC is about to reverse.
$ETH was slightly weaker, down 0.7% to around 2,048 USDT, within a range of 2,036 to 2,104. Volume was around 359 million USDT.
The biggest move worth noting is $INIT: down 35% in 24 hours, from a high of 0.27356 to 0.128, and touching a low of 0.110. Volume was around 31 million USDT. The data doesn't indicate the reason, so I'm not ready to draw any conclusions. PEPE also fell 15.2%, with volume of around 81 million USDT, while UNI dropped 4.4%. On the other hand, GRAM rose 3.5% and MUB gained 3.3%.
BTC scenario: if it holds the 73,400 area, there's still a chance of a rebound toward 74,800. If it loses 73,390 (the 24-hour low), the outlook leans toward further weakness; this view would no longer hold if the price closes below that level.
ETH scenario: if it holds 2,036, it could still rebound to 2,104. If it loses 2,036, more confirmation is needed before discussing lower levels.
RSI, EMA, and funding data are not currently available, so this post is based only on 24-hour price and volume.
Do you see INIT as a dip-buying opportunity, or are you waiting for more confirmation?
Manage your capital before entering a trade: risk only around one percent of your capital on each trade.
Not investment advice. DYOR.
#BinanceSquare #Crypto #TraderVietNam
BTC is trading around 73,577 USDT, while the Fear & Greed Index is at 28 (Fear).
Data as of 14:42 12/11 (UTC+7). $BTC edged down 0.4% over 24 hours, trading between 73,390 and 74,811. 24-hour volume was around 965 million USDT. There are no signals yet that BTC is about to reverse.
$ETH was slightly weaker, down 0.7% to around 2,048 USDT, within a range of 2,036 to 2,104. Volume was around 359 million USDT.
The biggest move worth noting is $INIT : down 35% in 24 hours, from a high of 0.27356 to 0.128, and touching a low of 0.110. Volume was around 31 million USDT. The data doesn't indicate the reason, so I'm not ready to draw any conclusions. PEPE also fell 15.2%, with volume of around 81 million USDT, while UNI dropped 4.4%. On the other hand, GRAM rose 3.5% and MUB gained 3.3%.
BTC scenario: if it holds the 73,400 area, there's still a chance of a rebound toward 74,800. If it loses 73,390 (the 24-hour low), the outlook leans toward further weakness; this view would no longer hold if the price closes below that level.
ETH scenario: if it holds 2,036, it could still rebound to 2,104. If it loses 2,036, more confirmation is needed before discussing lower levels.
RSI, EMA, and funding data are not currently available, so this post is based only on 24-hour price and volume.
Do you see INIT as a dip-buying opportunity, or are you waiting for more confirmation?
Manage your capital before entering a trade: risk only around one percent of your capital on each trade.
Not investment advice. DYOR.
#BinanceSquare #Crypto #TraderVietNam
Data as of 14:42 12/11 (UTC+7). $BTC edged down 0.4% over 24 hours, trading between 73,390 and 74,811. 24-hour volume was around 965 million USDT. There are no signals yet that BTC is about to reverse.
$ETH was slightly weaker, down 0.7% to around 2,048 USDT, within a range of 2,036 to 2,104. Volume was around 359 million USDT.
The biggest move worth noting is $INIT : down 35% in 24 hours, from a high of 0.27356 to 0.128, and touching a low of 0.110. Volume was around 31 million USDT. The data doesn't indicate the reason, so I'm not ready to draw any conclusions. PEPE also fell 15.2%, with volume of around 81 million USDT, while UNI dropped 4.4%. On the other hand, GRAM rose 3.5% and MUB gained 3.3%.
BTC scenario: if it holds the 73,400 area, there's still a chance of a rebound toward 74,800. If it loses 73,390 (the 24-hour low), the outlook leans toward further weakness; this view would no longer hold if the price closes below that level.
ETH scenario: if it holds 2,036, it could still rebound to 2,104. If it loses 2,036, more confirmation is needed before discussing lower levels.
RSI, EMA, and funding data are not currently available, so this post is based only on 24-hour price and volume.
Do you see INIT as a dip-buying opportunity, or are you waiting for more confirmation?
Manage your capital before entering a trade: risk only around one percent of your capital on each trade.
Not investment advice. DYOR.
#BinanceSquare #Crypto #TraderVietNam
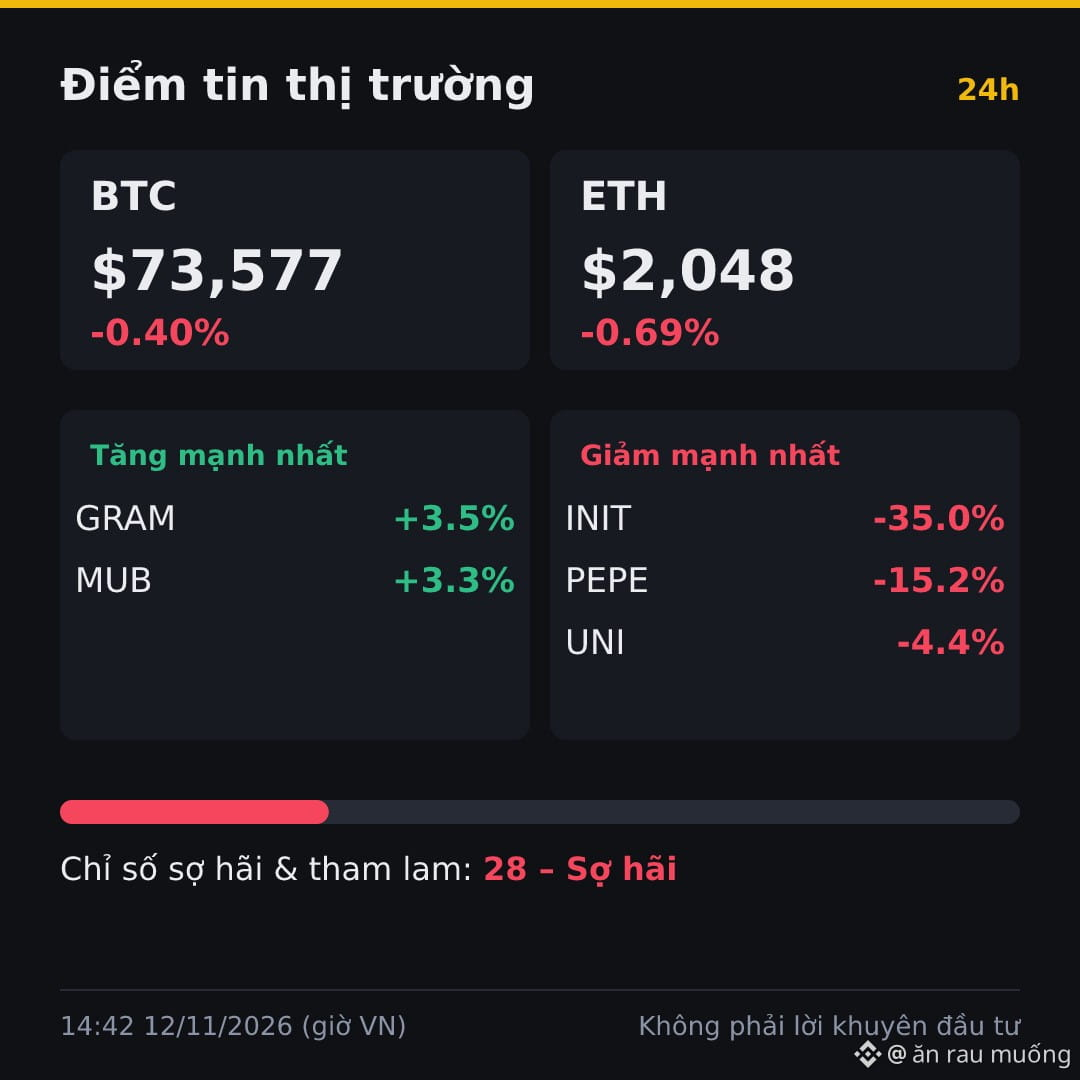
793
·
--
📉 NEUTRAL | $INIT fell 45.6% in 24 hours, but the money flow doesn’t confirm it. This drop looks more like a thin order book than a wave of selling.
💰 SPOT: Buyers accounted for 53.5% over 24 hours, but only 48.8% in the most recent hour, so sellers have the edge. 24-hour volume is 136% of market cap, meaning speculation is very hot.
🐋 WHALES AND THE CROWD: On Binance, top traders are 54.9% long and the crowd is 56.4% long, both leaning long. Across 3 exchanges, top traders are only 52% long.
💸 FUNDING AND OI: Binance funding is -0.93%/8h, meaning shorts are paying longs. Aggregate OI fell 23.8% as the price declined, meaning positions are being closed.
💧 LIQUIDITY: Total pending orders are only 28,400 USDT around the price. The largest buy wall is 2,030 USDT at 0.13553, and the sell wall is 6,410 USDT at 0.14019.
🚨 PUMP-AND-DUMP RISK: high, because the 24-hour range is 199% and the order book is thin. News: Initia confirms its second exploit in 3 weeks (Cointelegraph, 11/11).
🎯 $INIT LEVELS TO WATCH: support 0.122 USDT · resistance 0.1613 USDT
Scenario: The 4-hour INIT/USDT candle on Binance spot closes at 07:00 on 12/11. Longs are waiting for a close above 0.1613 USDT, while shorts are waiting for a close below 0.122 USDT; between these levels, neither side has an advantage.
Data as of 05:38 on 12/11 (Vietnam time).
Between 0.122 and 0.1613 USDT, do you lean long or short, and why?
Manage your capital before entering a trade: each trade should risk only about one percent of your capital.
Not investment advice. DYOR.
#BinanceSquare #INIT
📉 NEUTRAL | $INIT fell 45.6% in 24 hours, but the money flow doesn’t confirm it. This drop looks more like a thin order book than a wave of selling.
💰 SPOT: Buyers accounted for 53.5% over 24 hours, but only 48.8% in the most recent hour, so sellers have the edge. 24-hour volume is 136% of market cap, meaning speculation is very hot.
🐋 WHALES AND THE CROWD: On Binance, top traders are 54.9% long and the crowd is 56.4% long, both leaning long. Across 3 exchanges, top traders are only 52% long.
💸 FUNDING AND OI: Binance funding is -0.93%/8h, meaning shorts are paying longs. Aggregate OI fell 23.8% as the price declined, meaning positions are being closed.
💧 LIQUIDITY: Total pending orders are only 28,400 USDT around the price. The largest buy wall is 2,030 USDT at 0.13553, and the sell wall is 6,410 USDT at 0.14019.
🚨 PUMP-AND-DUMP RISK: high, because the 24-hour range is 199% and the order book is thin. News: Initia confirms its second exploit in 3 weeks (Cointelegraph, 11/11).
🎯 $INIT LEVELS TO WATCH: support 0.122 USDT · resistance 0.1613 USDT
Scenario: The 4-hour INIT/USDT candle on Binance spot closes at 07:00 on 12/11. Longs are waiting for a close above 0.1613 USDT, while shorts are waiting for a close below 0.122 USDT; between these levels, neither side has an advantage.
Data as of 05:38 on 12/11 (Vietnam time).
Between 0.122 and 0.1613 USDT, do you lean long or short, and why?
Manage your capital before entering a trade: each trade should risk only about one percent of your capital.
Not investment advice. DYOR.
#BinanceSquare #INIT
💰 SPOT: Buyers accounted for 53.5% over 24 hours, but only 48.8% in the most recent hour, so sellers have the edge. 24-hour volume is 136% of market cap, meaning speculation is very hot.
🐋 WHALES AND THE CROWD: On Binance, top traders are 54.9% long and the crowd is 56.4% long, both leaning long. Across 3 exchanges, top traders are only 52% long.
💸 FUNDING AND OI: Binance funding is -0.93%/8h, meaning shorts are paying longs. Aggregate OI fell 23.8% as the price declined, meaning positions are being closed.
💧 LIQUIDITY: Total pending orders are only 28,400 USDT around the price. The largest buy wall is 2,030 USDT at 0.13553, and the sell wall is 6,410 USDT at 0.14019.
🚨 PUMP-AND-DUMP RISK: high, because the 24-hour range is 199% and the order book is thin. News: Initia confirms its second exploit in 3 weeks (Cointelegraph, 11/11).
🎯 $INIT LEVELS TO WATCH: support 0.122 USDT · resistance 0.1613 USDT
Scenario: The 4-hour INIT/USDT candle on Binance spot closes at 07:00 on 12/11. Longs are waiting for a close above 0.1613 USDT, while shorts are waiting for a close below 0.122 USDT; between these levels, neither side has an advantage.
Data as of 05:38 on 12/11 (Vietnam time).
Between 0.122 and 0.1613 USDT, do you lean long or short, and why?
Manage your capital before entering a trade: each trade should risk only about one percent of your capital.
Not investment advice. DYOR.
#BinanceSquare #INIT
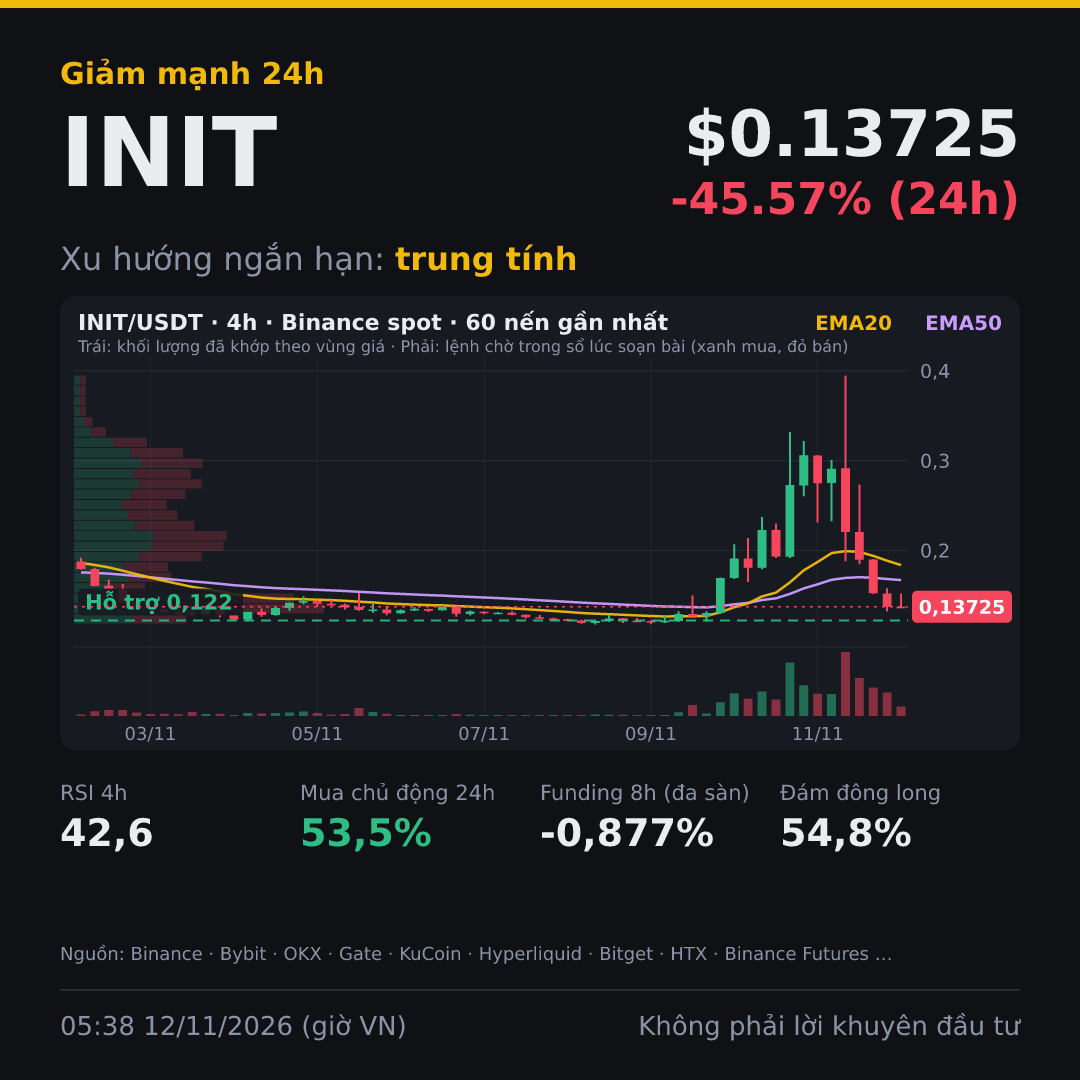
1
959
·
--
🟢 LONG $ERA · R:R 1:1, stop loss just 4.3%
▪️ Buy zone: 0.08334 – 0.0848
▪️ Stop loss: 0.08119 (-4.3%)
▪️ Target 1: 0.0885 (+4.4%)
▪️ Target 2: 0.0927 (+9.3%)
▪️ Target 3: 0.1009 (+19%)
▪️ R:R 1:1 · score 8/10
$ERA bullish bias: the price is up 8.73% over the past 24 hours, and the daily, 4h, and 1h trends are all rising.
Why: Binance Futures funding is negative at -0.2449%/8h, meaning shorts are paying fees, which could trigger a short squeeze. Active buying is also moving in the same direction, giving longs the advantage.
Updated 02:16 12/11 (Vietnam time).
Manage your capital before entering a trade: each trade should risk only around one percent of your capital.
Personal opinion, not investment advice.
#BinanceSquare #ERA #Altcoin
🟢 LONG $ERA · R:R 1:1, stop loss just 4.3%
▪️ Buy zone: 0.08334 – 0.0848
▪️ Stop loss: 0.08119 (-4.3%)
▪️ Target 1: 0.0885 (+4.4%)
▪️ Target 2: 0.0927 (+9.3%)
▪️ Target 3: 0.1009 (+19%)
▪️ R:R 1:1 · score 8/10
$ERA bullish bias: the price is up 8.73% over the past 24 hours, and the daily, 4h, and 1h trends are all rising.
Why: Binance Futures funding is negative at -0.2449%/8h, meaning shorts are paying fees, which could trigger a short squeeze. Active buying is also moving in the same direction, giving longs the advantage.
Updated 02:16 12/11 (Vietnam time).
Manage your capital before entering a trade: each trade should risk only around one percent of your capital.
Personal opinion, not investment advice.
#BinanceSquare #ERA #Altcoin
▪️ Buy zone: 0.08334 – 0.0848
▪️ Stop loss: 0.08119 (-4.3%)
▪️ Target 1: 0.0885 (+4.4%)
▪️ Target 2: 0.0927 (+9.3%)
▪️ Target 3: 0.1009 (+19%)
▪️ R:R 1:1 · score 8/10
$ERA bullish bias: the price is up 8.73% over the past 24 hours, and the daily, 4h, and 1h trends are all rising.
Why: Binance Futures funding is negative at -0.2449%/8h, meaning shorts are paying fees, which could trigger a short squeeze. Active buying is also moving in the same direction, giving longs the advantage.
Updated 02:16 12/11 (Vietnam time).
Manage your capital before entering a trade: each trade should risk only around one percent of your capital.
Personal opinion, not investment advice.
#BinanceSquare #ERA #Altcoin
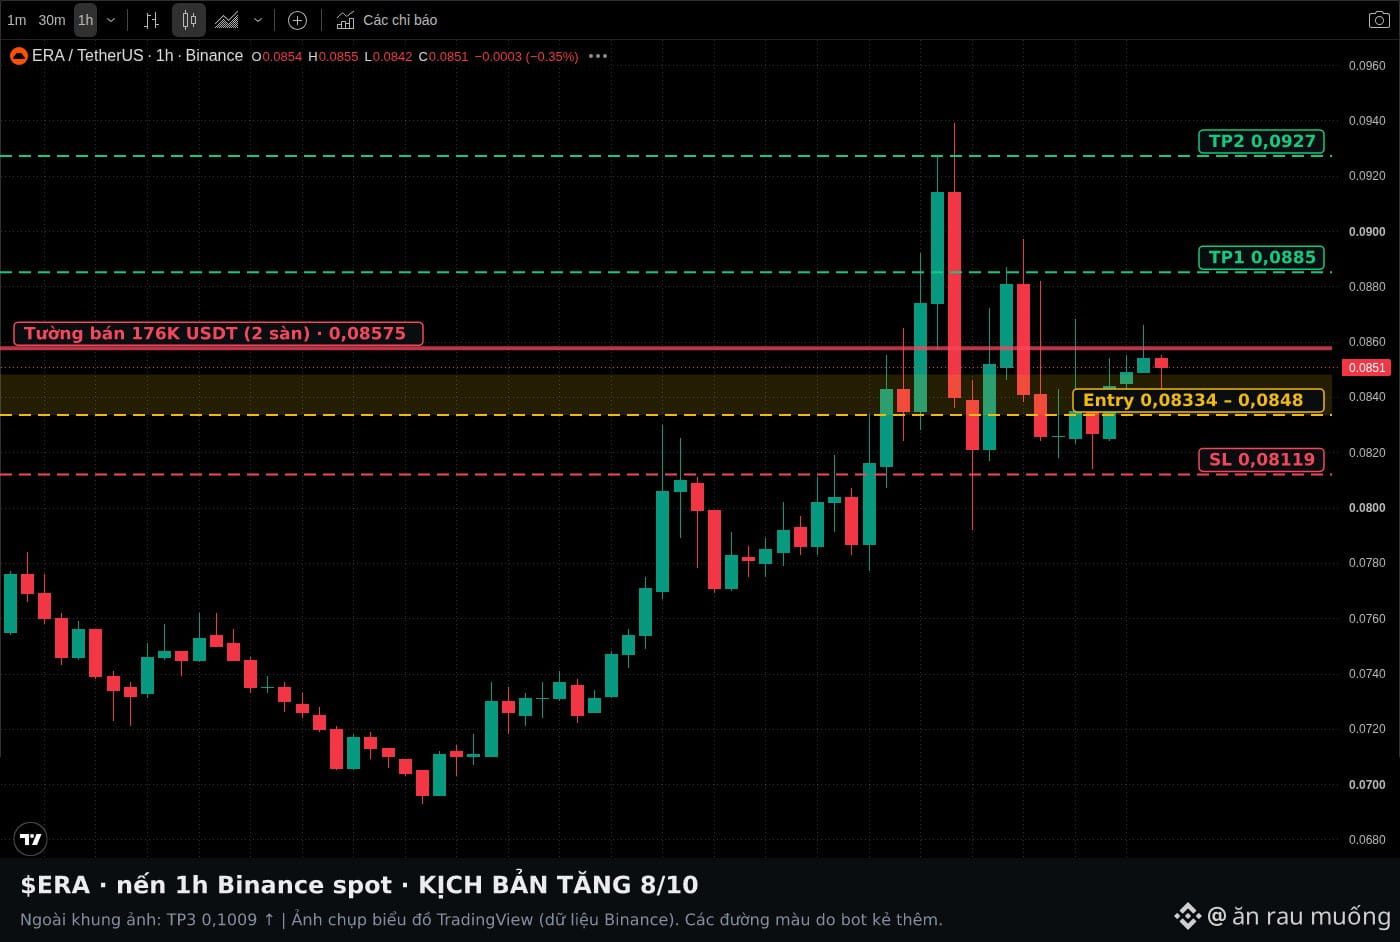
171
·
--
📈 NEUTRAL | $SNDKB up 19.8% in 24 hours, but spot flows have yet to confirm the move: aggressive sellers outnumbered aggressive buyers by 20.3 million USDT over 24 hours.
💰 SPOT: On Binance spot, aggressive buying accounted for only 36.7% of 24-hour volume, so sellers are dominating. This means spot buyers aren't driving the price higher. Volume of 76.7 million USDT equals 62.7% of market cap—a very high level of speculation.
🐋 WHALES AND THE CROWD: Cannot be verified, as SNDKB has no derivatives contract on any exchange, so we don't know which side top traders are on.
💧 LIQUIDITY: The ±2% order book has only 523,000 USDT, making it thin enough for a few large orders to move the price; the largest buy wall is at 985 USDT, and the sell wall is at 1,050 USDT.
₿ VS. BTC: Over the past 24 hours, during the hours when BTC was up, its cumulative gain was +3.93%, while SNDKB gained +12.52%; during the hours when BTC was down, its cumulative loss was -2.18%, while SNDKB gained +5.1%. SNDKB is stronger than BTC: it rises more and falls less.
🚨 PUMP-AND-DUMP RISK: Medium. 24-hour volume is 62.7% of market cap (very strong speculative activity), and the price is rising even though aggressive spot selling exceeds buying.
🎯 $SNDKB LEVELS TO WATCH: support at 971.5 USDT · resistance at 1,136 USDT
Scenario: Between 971.5 and 1,136, neither side has an advantage. Longs are waiting for a 4-hour SNDKB/USDT candle on Binance spot to close above 1,136; the current candle closes at 03:00 on 12/11. Shorts are waiting for a candle to close below 971.5.
Data as of 00:52 on 12/11 (Vietnam time).
At 1,136 USDT, are you leaning long or short, and why?
Manage your risk before entering a trade: risk only around one percent of your capital per trade.
Not investment advice. DYOR.
#BinanceSquare #SNDKB #Crypto
📈 NEUTRAL | $SNDKB up 19.8% in 24 hours, but spot flows have yet to confirm the move: aggressive sellers outnumbered aggressive buyers by 20.3 million USDT over 24 hours.
💰 SPOT: On Binance spot, aggressive buying accounted for only 36.7% of 24-hour volume, so sellers are dominating. This means spot buyers aren't driving the price higher. Volume of 76.7 million USDT equals 62.7% of market cap—a very high level of speculation.
🐋 WHALES AND THE CROWD: Cannot be verified, as SNDKB has no derivatives contract on any exchange, so we don't know which side top traders are on.
💧 LIQUIDITY: The ±2% order book has only 523,000 USDT, making it thin enough for a few large orders to move the price; the largest buy wall is at 985 USDT, and the sell wall is at 1,050 USDT.
₿ VS. BTC: Over the past 24 hours, during the hours when BTC was up, its cumulative gain was +3.93%, while SNDKB gained +12.52%; during the hours when BTC was down, its cumulative loss was -2.18%, while SNDKB gained +5.1%. SNDKB is stronger than BTC: it rises more and falls less.
🚨 PUMP-AND-DUMP RISK: Medium. 24-hour volume is 62.7% of market cap (very strong speculative activity), and the price is rising even though aggressive spot selling exceeds buying.
🎯 $SNDKB LEVELS TO WATCH: support at 971.5 USDT · resistance at 1,136 USDT
Scenario: Between 971.5 and 1,136, neither side has an advantage. Longs are waiting for a 4-hour SNDKB/USDT candle on Binance spot to close above 1,136; the current candle closes at 03:00 on 12/11. Shorts are waiting for a candle to close below 971.5.
Data as of 00:52 on 12/11 (Vietnam time).
At 1,136 USDT, are you leaning long or short, and why?
Manage your risk before entering a trade: risk only around one percent of your capital per trade.
Not investment advice. DYOR.
#BinanceSquare #SNDKB #Crypto
💰 SPOT: On Binance spot, aggressive buying accounted for only 36.7% of 24-hour volume, so sellers are dominating. This means spot buyers aren't driving the price higher. Volume of 76.7 million USDT equals 62.7% of market cap—a very high level of speculation.
🐋 WHALES AND THE CROWD: Cannot be verified, as SNDKB has no derivatives contract on any exchange, so we don't know which side top traders are on.
💧 LIQUIDITY: The ±2% order book has only 523,000 USDT, making it thin enough for a few large orders to move the price; the largest buy wall is at 985 USDT, and the sell wall is at 1,050 USDT.
₿ VS. BTC: Over the past 24 hours, during the hours when BTC was up, its cumulative gain was +3.93%, while SNDKB gained +12.52%; during the hours when BTC was down, its cumulative loss was -2.18%, while SNDKB gained +5.1%. SNDKB is stronger than BTC: it rises more and falls less.
🚨 PUMP-AND-DUMP RISK: Medium. 24-hour volume is 62.7% of market cap (very strong speculative activity), and the price is rising even though aggressive spot selling exceeds buying.
🎯 $SNDKB LEVELS TO WATCH: support at 971.5 USDT · resistance at 1,136 USDT
Scenario: Between 971.5 and 1,136, neither side has an advantage. Longs are waiting for a 4-hour SNDKB/USDT candle on Binance spot to close above 1,136; the current candle closes at 03:00 on 12/11. Shorts are waiting for a candle to close below 971.5.
Data as of 00:52 on 12/11 (Vietnam time).
At 1,136 USDT, are you leaning long or short, and why?
Manage your risk before entering a trade: risk only around one percent of your capital per trade.
Not investment advice. DYOR.
#BinanceSquare #SNDKB #Crypto
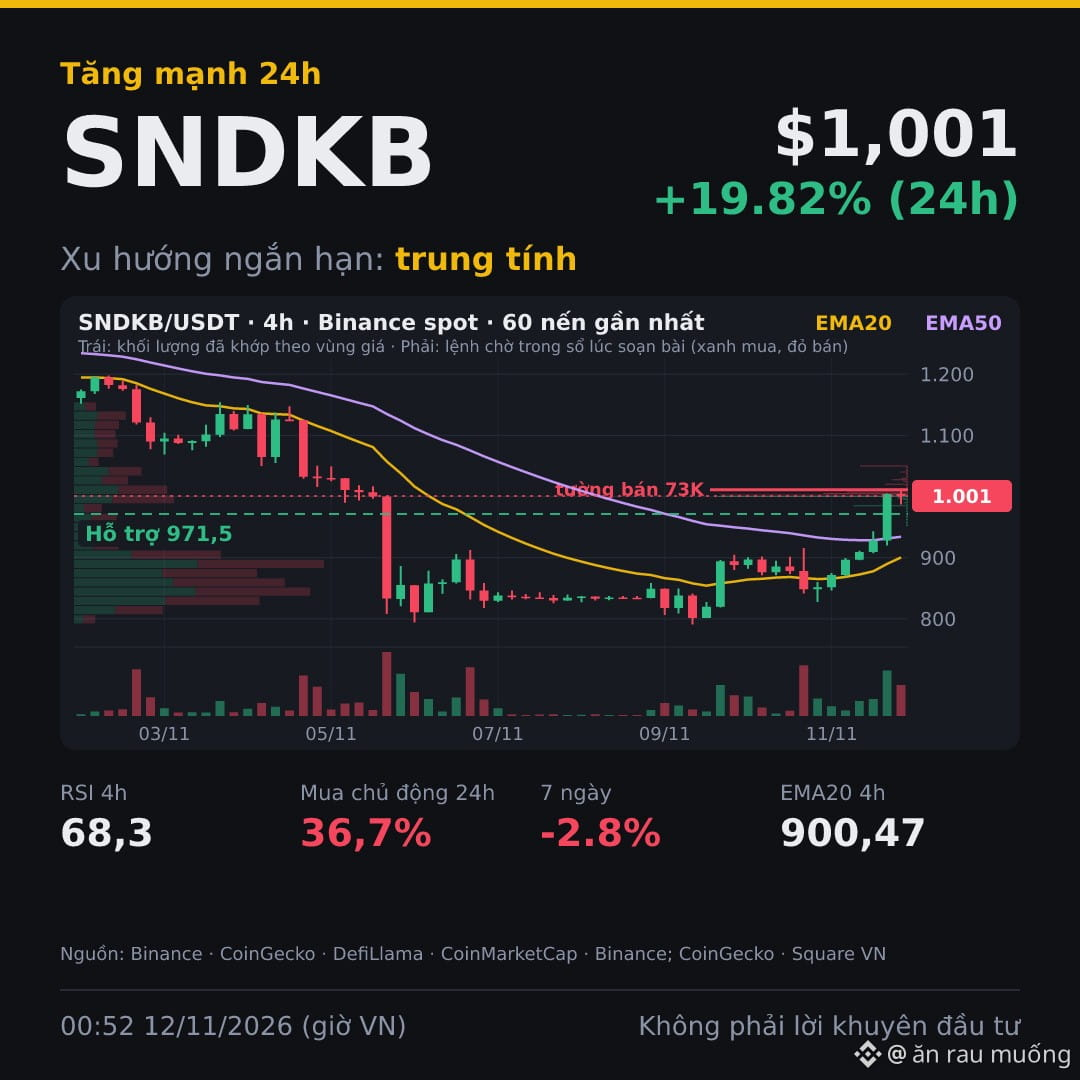
300
Log in to explore more content
Join global crypto users on Binance Square
⚡️ Get latest and useful information about crypto.
💬 Trusted by the world’s largest crypto exchange.
👍 Discover real insights from verified creators.
Email / Phone number
Trending Topics
WhoWillSucceedJensenHuangatNvidia?
137,548 views
1,510 Discussing
Nvidia Says No CEO Talks Underway as "Stand With Jensen" Petition Tops 77,900 Signatures
Binance News
·32 Likes
·53.9k views
WhatWillDriveCryptoandStocks’NextRebound?
529,223 views
3,362 Discussing
BitcoinActiveSupplyInProfitDropsBelow45%
59,115 views
629 Discussing