
桀-1688
3.8k Posts

桀-1688
 Square Verified
Report
Block User
盯盘不追高,数据说人话。关注我,用数据拆行情,用白话讲市场。
High-Frequency Trader
9.1 Years
106 Following
11.3K+ Followers
2.4K+ Liked
Posts
·
--
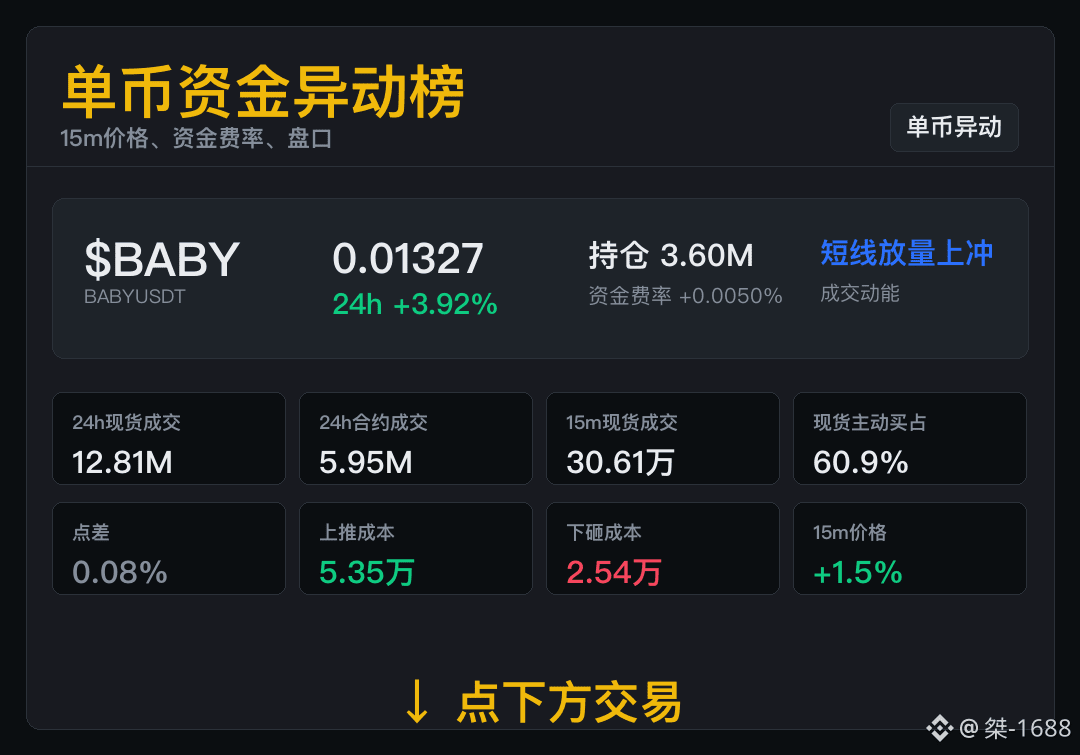
$BABY There is trading heat in this segment. Please confirm the allocation to settlement afterwards.
Current price is 0.01327. Spot成交 is 12.81M, and contract成交 is 5.95M.
The contract payment is close to neutral; the price and volume are the main things to watch currently.
In the next round, first verify the volume/energy, then see whether the spread has widened.
$BABY There is trading heat in this segment. Please confirm the allocation to settlement afterwards.
Current price is 0.01327. Spot成交 is 12.81M, and contract成交 is 5.95M.
The contract payment is close to neutral; the price and volume are the main things to watch currently.
In the next round, first verify the volume/energy, then see whether the spread has widened.
Current price is 0.01327. Spot成交 is 12.81M, and contract成交 is 5.95M.
The contract payment is close to neutral; the price and volume are the main things to watch currently.
In the next round, first verify the volume/energy, then see whether the spread has widened.
64
·
--
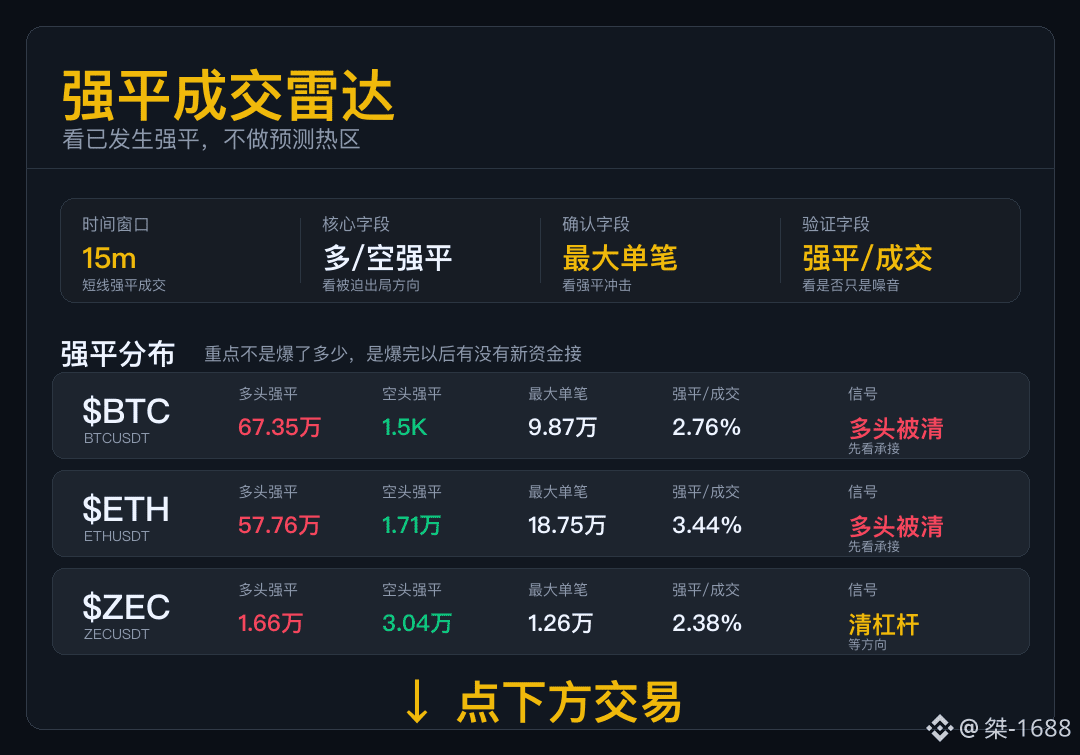
Strong liquidation turnover radar
For data like this, first see who is being forced out.
$BTC long positions are cleared more obviously on the side; the rebound is not impossible to look at, but first check whether, after the forced liquidation, there is a new bid that steps in.
$ETH 15m The long forced liquidation is clearly higher than the short side; leveraged long positions are being forced to exit.
$ZEC This kind of forced liquidation doesn’t directly give direction; it mainly serves as a reminder that the upcoming volatility will be more selective about follow-through.
Overall, it leans toward long-side deleveraging, but each individual has different order replenishment; later, watch which one repairs the trades first.
Strong liquidation turnover radar
For data like this, first see who is being forced out.
$BTC long positions are cleared more obviously on the side; the rebound is not impossible to look at, but first check whether, after the forced liquidation, there is a new bid that steps in.
$ETH 15m The long forced liquidation is clearly higher than the short side; leveraged long positions are being forced to exit.
$ZEC This kind of forced liquidation doesn’t directly give direction; it mainly serves as a reminder that the upcoming volatility will be more selective about follow-through.
Overall, it leans toward long-side deleveraging, but each individual has different order replenishment; later, watch which one repairs the trades first.
For data like this, first see who is being forced out.
$BTC long positions are cleared more obviously on the side; the rebound is not impossible to look at, but first check whether, after the forced liquidation, there is a new bid that steps in.
$ETH 15m The long forced liquidation is clearly higher than the short side; leveraged long positions are being forced to exit.
$ZEC This kind of forced liquidation doesn’t directly give direction; it mainly serves as a reminder that the upcoming volatility will be more selective about follow-through.
Overall, it leans toward long-side deleveraging, but each individual has different order replenishment; later, watch which one repairs the trades first.
361
·
--
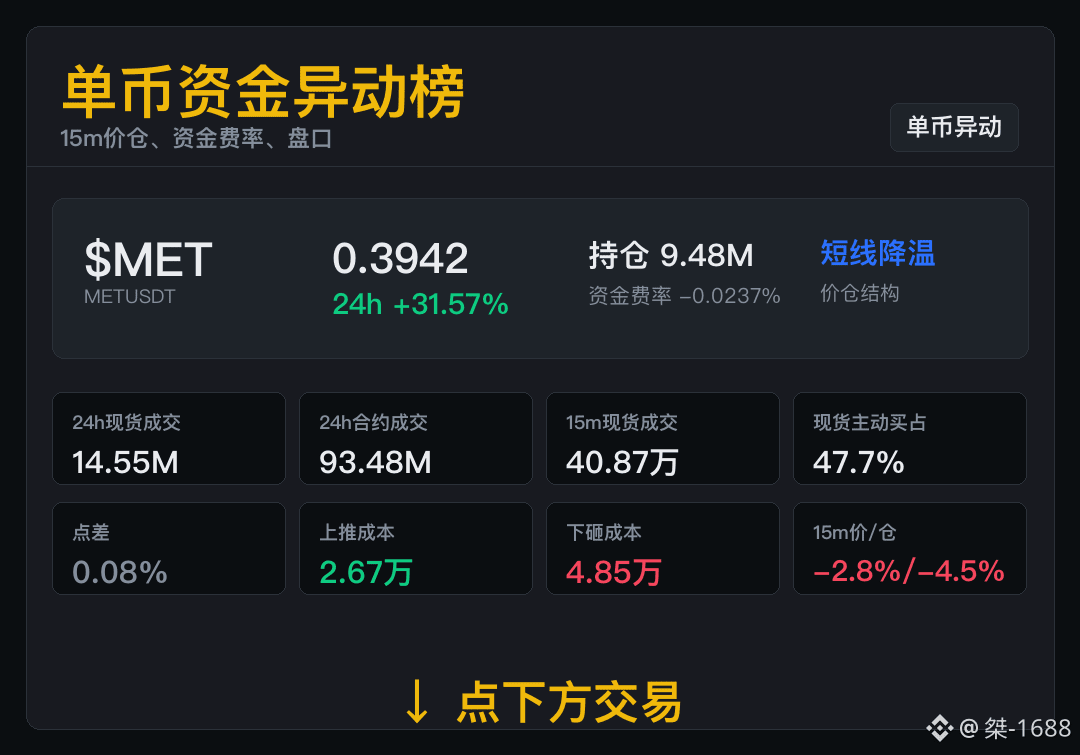
$MET positions are reducing amid a pullback; for now, track according to the cooling structure.
Current price 0.3942, 15m price -2.76%, 15m positions -4.47%.
Price and positions are both declining in sync; the next move needs fresh trading to recover.
When both price and positions continue to fall, maintain a relatively low level of attention.
$MET positions are reducing amid a pullback; for now, track according to the cooling structure.
Current price 0.3942, 15m price -2.76%, 15m positions -4.47%.
Price and positions are both declining in sync; the next move needs fresh trading to recover.
When both price and positions continue to fall, maintain a relatively low level of attention.
Current price 0.3942, 15m price -2.76%, 15m positions -4.47%.
Price and positions are both declining in sync; the next move needs fresh trading to recover.
When both price and positions continue to fall, maintain a relatively low level of attention.
126
·
--
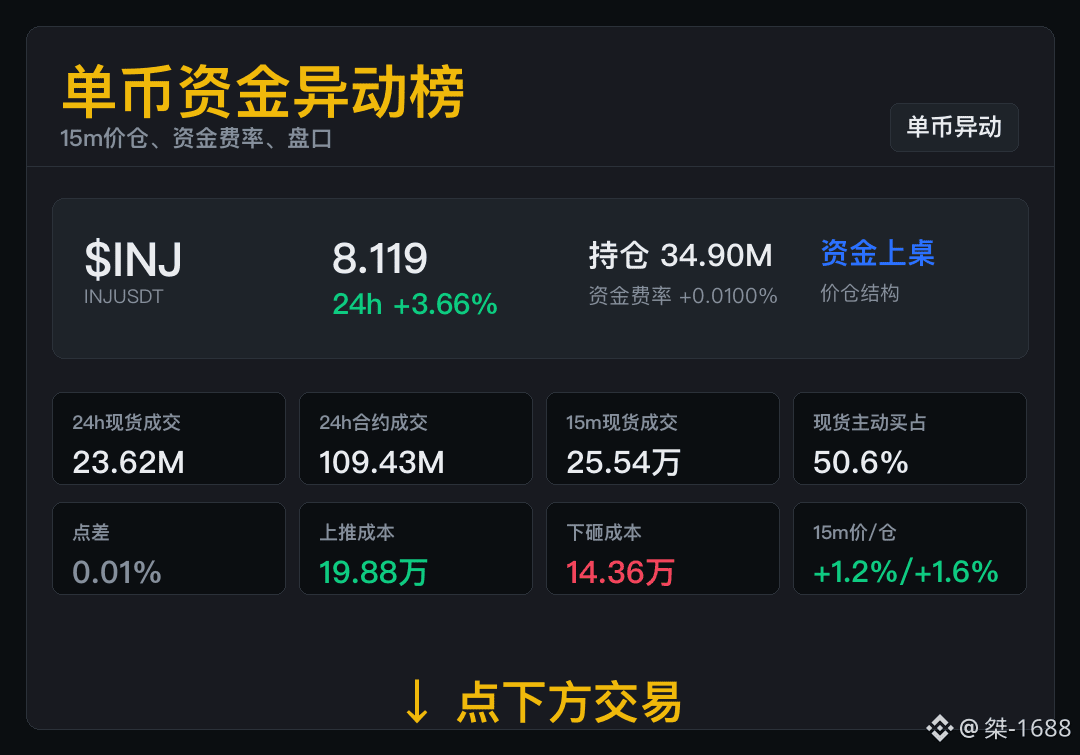
$INJ price and open interest both rising, short-term participation is increasing.
15m spot trading volume 255,400, 15m price +1.17%, 15m open interest +1.62%.
As price moves higher, open interest expands, and short-term participation is strengthening.
In the next stage, compare the price positions and volume; if the readings are out of sync, slow down tracking.
$INJ price and open interest both rising, short-term participation is increasing.
15m spot trading volume 255,400, 15m price +1.17%, 15m open interest +1.62%.
As price moves higher, open interest expands, and short-term participation is strengthening.
In the next stage, compare the price positions and volume; if the readings are out of sync, slow down tracking.
15m spot trading volume 255,400, 15m price +1.17%, 15m open interest +1.62%.
As price moves higher, open interest expands, and short-term participation is strengthening.
In the next stage, compare the price positions and volume; if the readings are out of sync, slow down tracking.
40
·
--
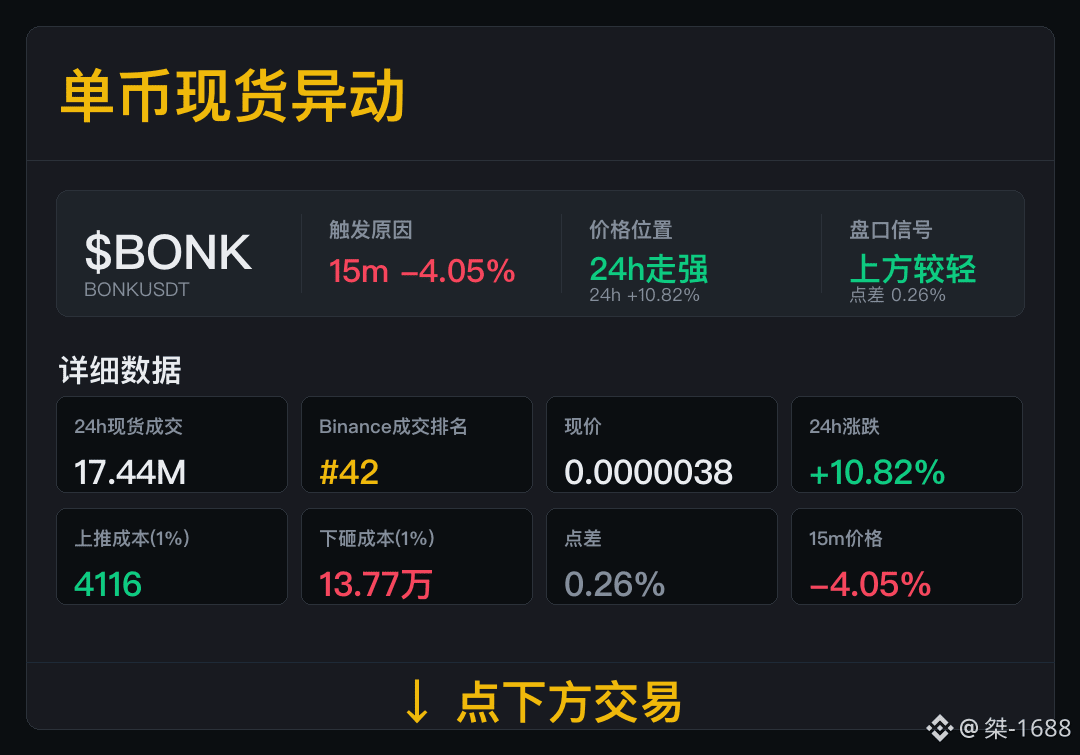
$BONK First, look at the execution costs for this segment.
Spot trades: 17.44M, Binance trade ranking #42. Note the trade size for now; in the next section, see whether turnover can be maintained.
Now, over the last 24h: price change +10.82%; bid-ask spread 0.26%. Upward pushing cost: 4116; downward dumping cost: 137,700. For now, continue tracking to confirm whether you still want to look at the next round of trades.
Next, focus on the spread and trading activity. Once the spread holds steady and trading continues, we’ll discuss the next section.
$BONK First, look at the execution costs for this segment.
Spot trades: 17.44M, Binance trade ranking #42. Note the trade size for now; in the next section, see whether turnover can be maintained.
Now, over the last 24h: price change +10.82%; bid-ask spread 0.26%. Upward pushing cost: 4116; downward dumping cost: 137,700. For now, continue tracking to confirm whether you still want to look at the next round of trades.
Next, focus on the spread and trading activity. Once the spread holds steady and trading continues, we’ll discuss the next section.
Spot trades: 17.44M, Binance trade ranking #42. Note the trade size for now; in the next section, see whether turnover can be maintained.
Now, over the last 24h: price change +10.82%; bid-ask spread 0.26%. Upward pushing cost: 4116; downward dumping cost: 137,700. For now, continue tracking to confirm whether you still want to look at the next round of trades.
Next, focus on the spread and trading activity. Once the spread holds steady and trading continues, we’ll discuss the next section.
106
·
--
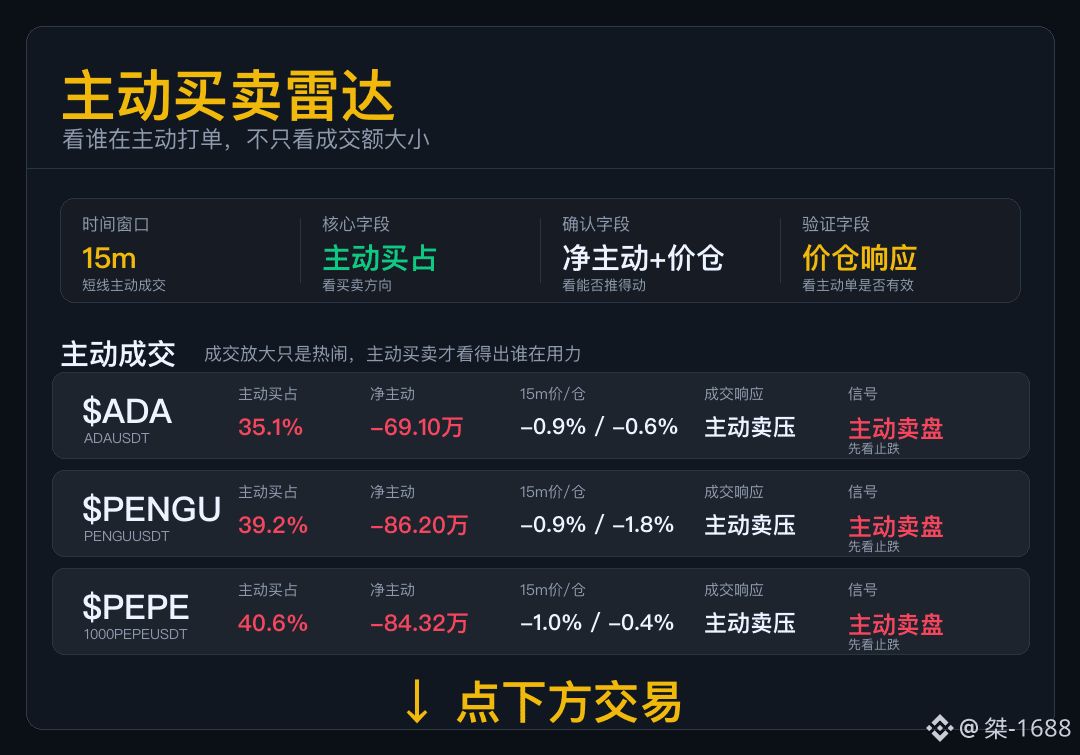
Active buy/sell radar
Don’t just look at the trading volume. Today, focus on whether the active orders can push the price action.
$ADA — The sell-side aggressiveness is stronger, and the price is moving down accordingly. Don’t assume a rebound is happening yet; wait until it stabilizes first.
$PENGU — The selling pressure and price feedback are in the same direction, indicating that short-term bears are exerting force. To see a renewed strength, wait for the buying side to re-join and regain the rhythm.
$PEPE — After the aggressive sell orders were executed, the price came under pressure. In the short term, pay attention to whether the sell pressure is slowing down.
When aggressive sell orders strengthen on the tape, and before the buy orders come back, be cautious in viewing any rebound as meaningful for now.
Active buy/sell radar
Don’t just look at the trading volume. Today, focus on whether the active orders can push the price action.
$ADA — The sell-side aggressiveness is stronger, and the price is moving down accordingly. Don’t assume a rebound is happening yet; wait until it stabilizes first.
$PENGU — The selling pressure and price feedback are in the same direction, indicating that short-term bears are exerting force. To see a renewed strength, wait for the buying side to re-join and regain the rhythm.
$PEPE — After the aggressive sell orders were executed, the price came under pressure. In the short term, pay attention to whether the sell pressure is slowing down.
When aggressive sell orders strengthen on the tape, and before the buy orders come back, be cautious in viewing any rebound as meaningful for now.
Don’t just look at the trading volume. Today, focus on whether the active orders can push the price action.
$ADA — The sell-side aggressiveness is stronger, and the price is moving down accordingly. Don’t assume a rebound is happening yet; wait until it stabilizes first.
$PENGU — The selling pressure and price feedback are in the same direction, indicating that short-term bears are exerting force. To see a renewed strength, wait for the buying side to re-join and regain the rhythm.
$PEPE — After the aggressive sell orders were executed, the price came under pressure. In the short term, pay attention to whether the sell pressure is slowing down.
When aggressive sell orders strengthen on the tape, and before the buy orders come back, be cautious in viewing any rebound as meaningful for now.
439
·
--
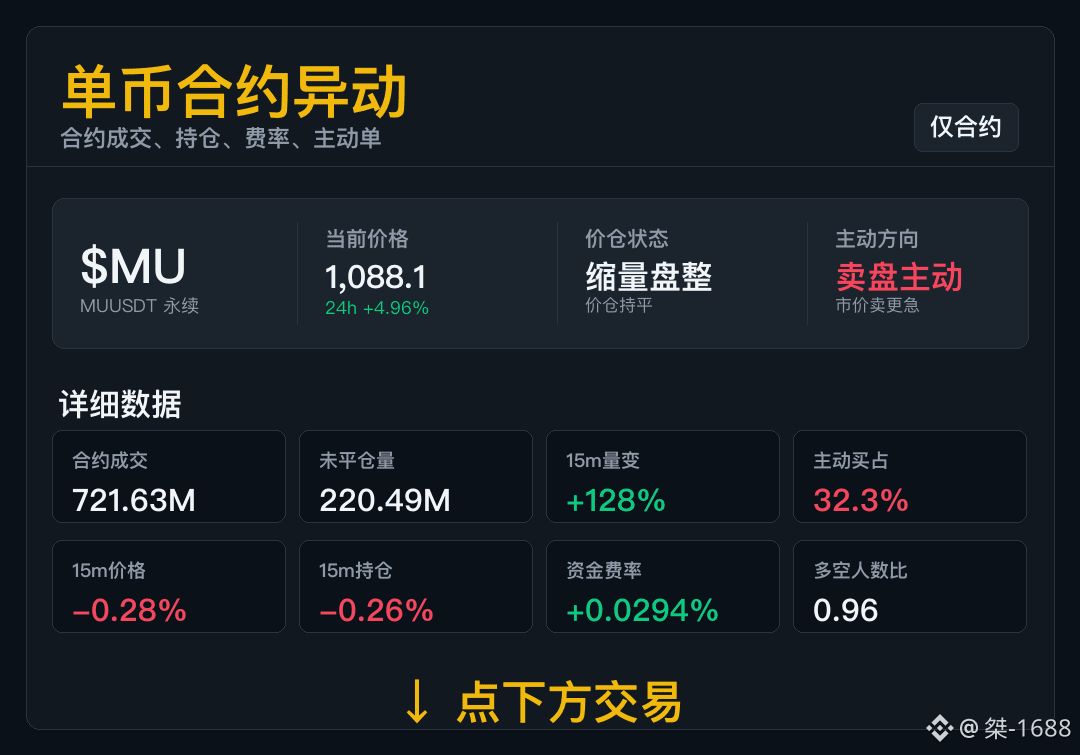
$MU First set aside the gains and losses—look clearly at who is adding to positions and who is withdrawing.
On the 15m timeframe, the price is -0.28%, holdings are -0.26%. This currently looks more like “tight consolidation on declining volume”: neither price nor holdings are making any clear statement, and the tape is still grinding.
Aggressive buys make up 32.3%, and sell orders at market price are more active on the sell side. The long/short participant ratio is 0.96—sentiment leans somewhat, but it hasn’t reached an extreme yet.
While the market is still grinding, don’t focus too much on gains and losses—wait for one more time for a real breakout with volume.
$MU First set aside the gains and losses—look clearly at who is adding to positions and who is withdrawing.
On the 15m timeframe, the price is -0.28%, holdings are -0.26%. This currently looks more like “tight consolidation on declining volume”: neither price nor holdings are making any clear statement, and the tape is still grinding.
Aggressive buys make up 32.3%, and sell orders at market price are more active on the sell side. The long/short participant ratio is 0.96—sentiment leans somewhat, but it hasn’t reached an extreme yet.
While the market is still grinding, don’t focus too much on gains and losses—wait for one more time for a real breakout with volume.
On the 15m timeframe, the price is -0.28%, holdings are -0.26%. This currently looks more like “tight consolidation on declining volume”: neither price nor holdings are making any clear statement, and the tape is still grinding.
Aggressive buys make up 32.3%, and sell orders at market price are more active on the sell side. The long/short participant ratio is 0.96—sentiment leans somewhat, but it hasn’t reached an extreme yet.
While the market is still grinding, don’t focus too much on gains and losses—wait for one more time for a real breakout with volume.
139
·
--
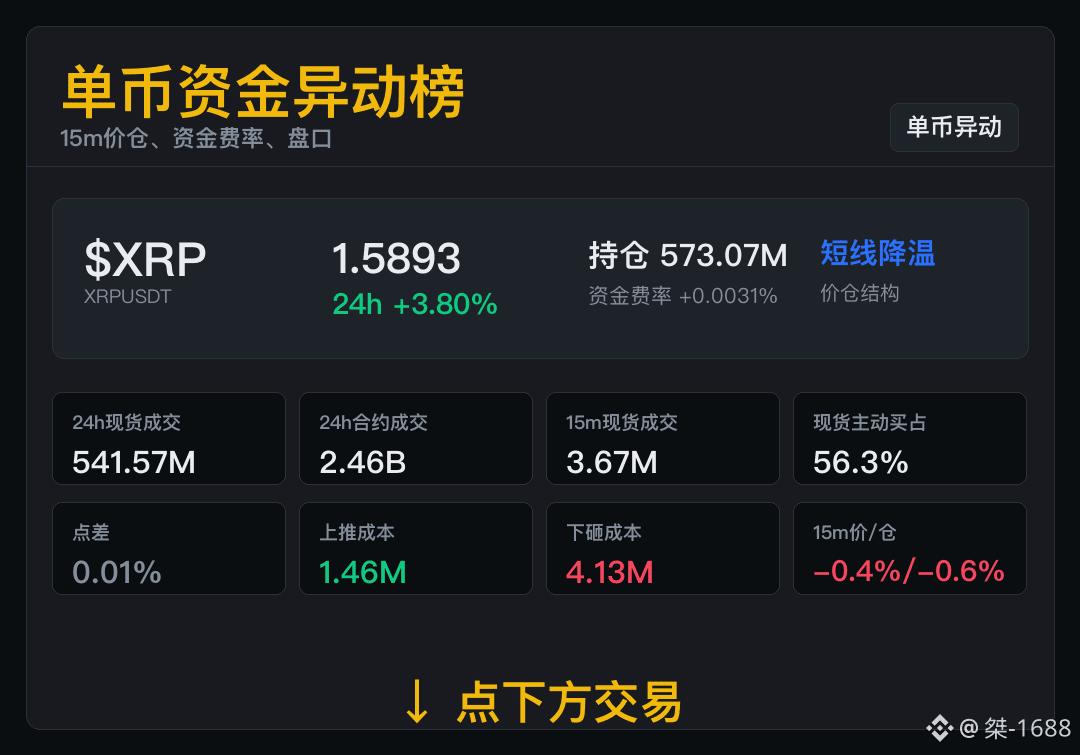
$XRP warehouse sync slows down, next round first check whether trading volume has recovered.
24h change +3.80%, 15m price/volume -0.41% / -0.61%, funding rate +0.0031%.
Position contraction hasn’t stopped the price decline; the current structure is still cooling down.
Until trading recovers, both price/volume drops will still be treated as cooling.
$XRP warehouse sync slows down, next round first check whether trading volume has recovered.
24h change +3.80%, 15m price/volume -0.41% / -0.61%, funding rate +0.0031%.
Position contraction hasn’t stopped the price decline; the current structure is still cooling down.
Until trading recovers, both price/volume drops will still be treated as cooling.
24h change +3.80%, 15m price/volume -0.41% / -0.61%, funding rate +0.0031%.
Position contraction hasn’t stopped the price decline; the current structure is still cooling down.
Until trading recovers, both price/volume drops will still be treated as cooling.
239
·
--
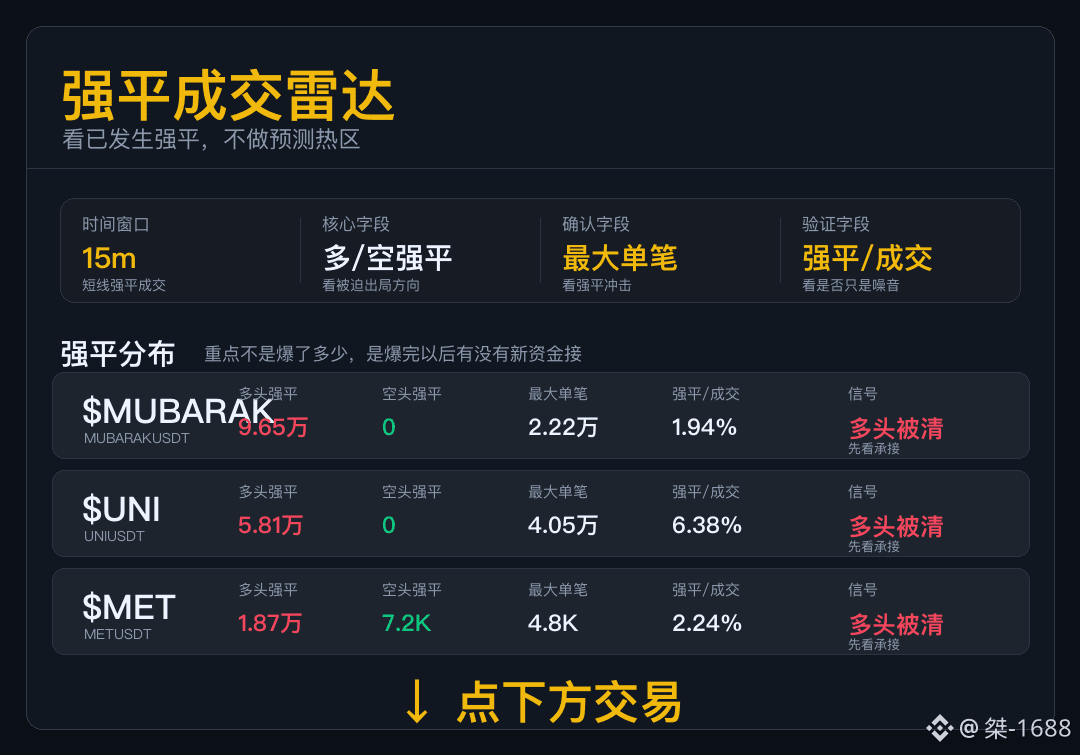
Strong-Peak Cross-Trader Radar
For data like “strong flat,” first see who is forced out of the game.
$MUBARAK long positions concentratedly get forced out. The current data only indicates that liquidation has occurred; it cannot be used to announce that the market has bottomed.
$UNI long positions’ leverage is knocked out first. Whether the rebound can succeed depends on whether trading volume/turnover can keep up.
$MET long-position forced liquidations dominate. First check whether, after the declines are cleared, there is buy-side demand that takes over. Don’t rush to treat the first rebound candle as “repair.”
After the longs are liquidated, whether the rebound can hold depends on whether new buyers step in to take over.
Strong-Peak Cross-Trader Radar
For data like “strong flat,” first see who is forced out of the game.
$MUBARAK long positions concentratedly get forced out. The current data only indicates that liquidation has occurred; it cannot be used to announce that the market has bottomed.
$UNI long positions’ leverage is knocked out first. Whether the rebound can succeed depends on whether trading volume/turnover can keep up.
$MET long-position forced liquidations dominate. First check whether, after the declines are cleared, there is buy-side demand that takes over. Don’t rush to treat the first rebound candle as “repair.”
After the longs are liquidated, whether the rebound can hold depends on whether new buyers step in to take over.
For data like “strong flat,” first see who is forced out of the game.
$MUBARAK long positions concentratedly get forced out. The current data only indicates that liquidation has occurred; it cannot be used to announce that the market has bottomed.
$UNI long positions’ leverage is knocked out first. Whether the rebound can succeed depends on whether trading volume/turnover can keep up.
$MET long-position forced liquidations dominate. First check whether, after the declines are cleared, there is buy-side demand that takes over. Don’t rush to treat the first rebound candle as “repair.”
After the longs are liquidated, whether the rebound can hold depends on whether new buyers step in to take over.
546
·
--
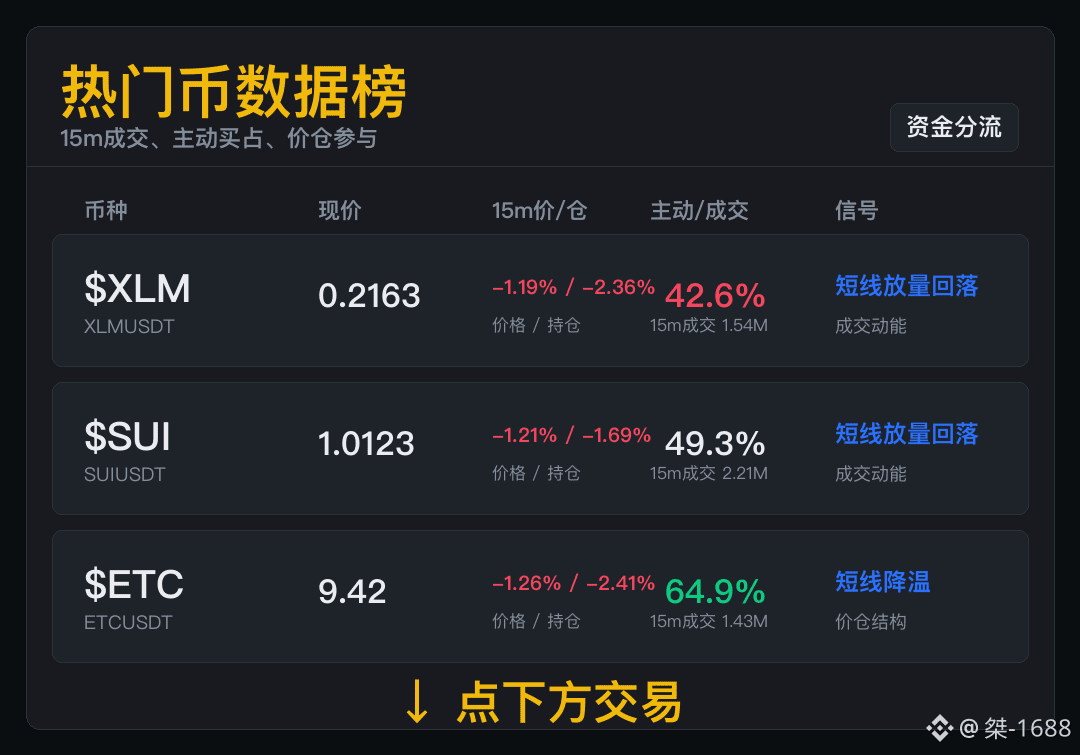
Increase percentage is the storefront; it’s the trading volume and positioning that are the real substance.
$XLM For short-term, first look at the成交 (trading volume) of 1.54M, with主动买 (aggressive buying) at 42.6%. Then look at the price-position (价仓) of -1.19% / -2.36%. Hot coins are the easiest to give you opportunities—and also the easiest to teach you lessons. Popularity is just the ticket; whether you can keep going depends on the next segment.
$SUI This round’s focus is on 15m participation:成交 2.21M, with主动买占 49.3%, and价仓 -1.21% / -1.69%. Don’t assume you should jump in just because everyone else is watching. There’s momentum, but it’s not permission for you to blindly rush.
$ETC 15m成交 1.43M, with价仓 -1.26% / -2.41%. For short-term, participation level matters more than simply looking at up/down moves. People who just chased in—don’t rush to find reasons for yourself. If volume doesn’t come back, take a step slower for now. Once the hype cools down, don’t use the emotion from the previous segment to chase the next one.
Increase percentage is the storefront; it’s the trading volume and positioning that are the real substance.
$XLM For short-term, first look at the成交 (trading volume) of 1.54M, with主动买 (aggressive buying) at 42.6%. Then look at the price-position (价仓) of -1.19% / -2.36%. Hot coins are the easiest to give you opportunities—and also the easiest to teach you lessons. Popularity is just the ticket; whether you can keep going depends on the next segment.
$SUI This round’s focus is on 15m participation:成交 2.21M, with主动买占 49.3%, and价仓 -1.21% / -1.69%. Don’t assume you should jump in just because everyone else is watching. There’s momentum, but it’s not permission for you to blindly rush.
$ETC 15m成交 1.43M, with价仓 -1.26% / -2.41%. For short-term, participation level matters more than simply looking at up/down moves. People who just chased in—don’t rush to find reasons for yourself. If volume doesn’t come back, take a step slower for now. Once the hype cools down, don’t use the emotion from the previous segment to chase the next one.
$XLM For short-term, first look at the成交 (trading volume) of 1.54M, with主动买 (aggressive buying) at 42.6%. Then look at the price-position (价仓) of -1.19% / -2.36%. Hot coins are the easiest to give you opportunities—and also the easiest to teach you lessons. Popularity is just the ticket; whether you can keep going depends on the next segment.
$SUI This round’s focus is on 15m participation:成交 2.21M, with主动买占 49.3%, and价仓 -1.21% / -1.69%. Don’t assume you should jump in just because everyone else is watching. There’s momentum, but it’s not permission for you to blindly rush.
$ETC 15m成交 1.43M, with价仓 -1.26% / -2.41%. For short-term, participation level matters more than simply looking at up/down moves. People who just chased in—don’t rush to find reasons for yourself. If volume doesn’t come back, take a step slower for now. Once the hype cools down, don’t use the emotion from the previous segment to chase the next one.
221
·
--
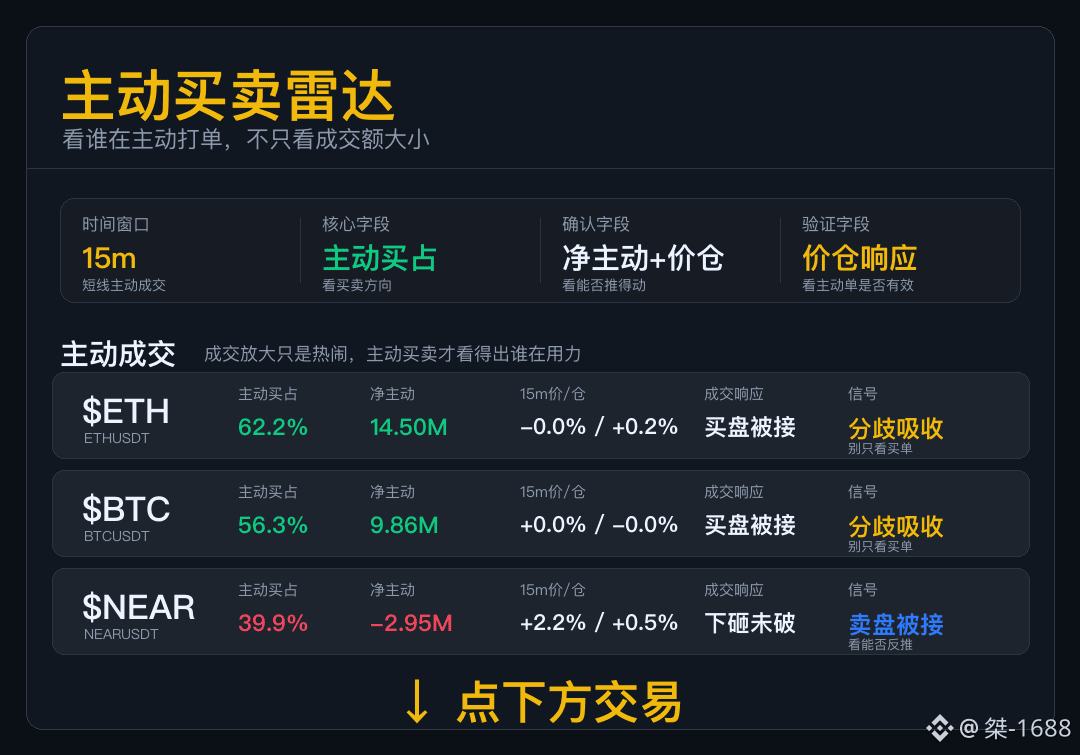
Active Buy/Sell Radar
Don’t just look at trading volume—today’s focus is whether aggressive orders can push the market.
$ETH has buyer-side aggression, but the price-pushing efficiency is average. Later, wait until the price truly breaks upward before increasing weight.
$BTC shows aggressive buying and is working hard, but the order book hasn’t expanded upward—this suggests the opposing side is also strong. Next, watch who withdraws first.
$NEAR (sell-side) put in effort but didn’t break the price through. For the short term, first look for consolidation and absorption—don’t rush to treat it as a breakdown.
Both sides are taking action. Don’t combine the conclusions—check one by one whether price gives feedback.
Active Buy/Sell Radar
Don’t just look at trading volume—today’s focus is whether aggressive orders can push the market.
$ETH has buyer-side aggression, but the price-pushing efficiency is average. Later, wait until the price truly breaks upward before increasing weight.
$BTC shows aggressive buying and is working hard, but the order book hasn’t expanded upward—this suggests the opposing side is also strong. Next, watch who withdraws first.
$NEAR (sell-side) put in effort but didn’t break the price through. For the short term, first look for consolidation and absorption—don’t rush to treat it as a breakdown.
Both sides are taking action. Don’t combine the conclusions—check one by one whether price gives feedback.
Don’t just look at trading volume—today’s focus is whether aggressive orders can push the market.
$ETH has buyer-side aggression, but the price-pushing efficiency is average. Later, wait until the price truly breaks upward before increasing weight.
$BTC shows aggressive buying and is working hard, but the order book hasn’t expanded upward—this suggests the opposing side is also strong. Next, watch who withdraws first.
$NEAR (sell-side) put in effort but didn’t break the price through. For the short term, first look for consolidation and absorption—don’t rush to treat it as a breakdown.
Both sides are taking action. Don’t combine the conclusions—check one by one whether price gives feedback.
64
·
--
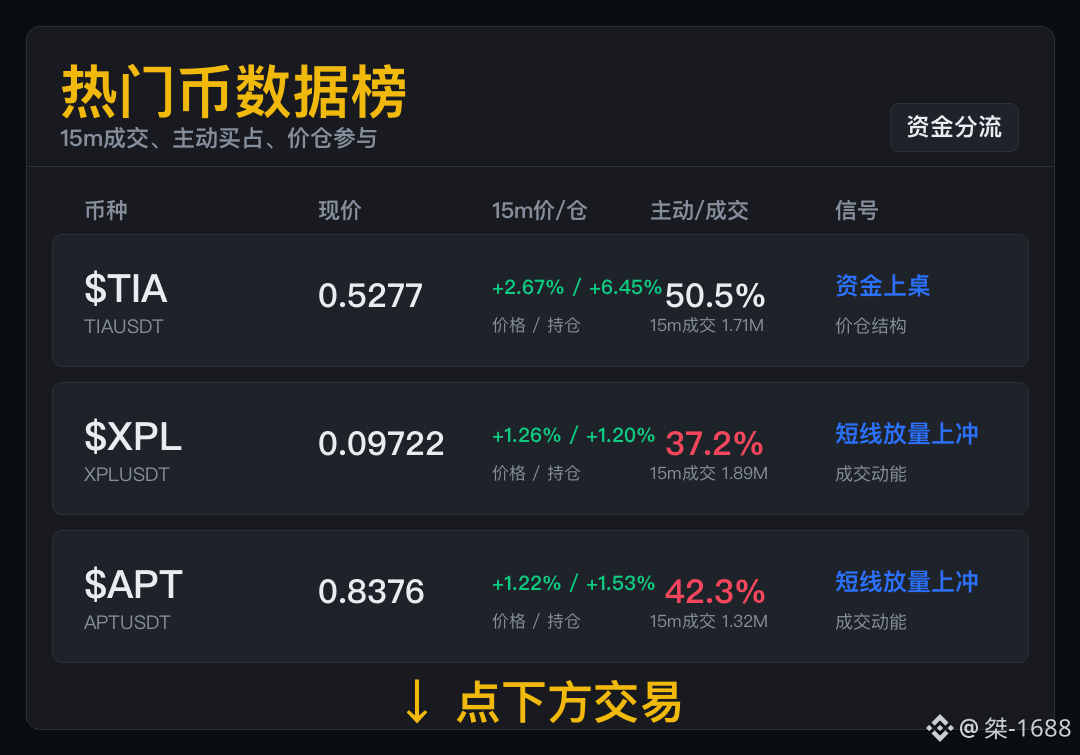
First look at capital participation, not how good the story is.
$TIA m成交 1.71M, value position +2.67% / +6.45%, for short-term participation, whether capital is engaged matters more than simply looking at up or down. If you already have a position, don’t rush to add; it’s more important to wait for a pullback and catch it than to keep charging ahead. Prices can be misleading—only positions moving with them feel like there’s really money behind the trade.
$XPL m成交 1.89M, aggressive buying accounts for 37.2%, value position +1.26% / +1.20%. Sentiment is the light; trading volume is the electricity. If the electricity cuts off, the light goes out. It has people watching now, but a lot of people doesn’t necessarily mean the road is definitely smooth.
$APT m成交 1.32M, aggressive buying accounts for 42.3%, value position +1.22% / +1.53%. You can watch popular names, but don’t let the crowd’s mood at the plaza make decisions for you. Popularity is just the entry; it’s worth continuing to watch only if the trading volume can hold.
First look at capital participation, not how good the story is.
$TIA m成交 1.71M, value position +2.67% / +6.45%, for short-term participation, whether capital is engaged matters more than simply looking at up or down. If you already have a position, don’t rush to add; it’s more important to wait for a pullback and catch it than to keep charging ahead. Prices can be misleading—only positions moving with them feel like there’s really money behind the trade.
$XPL m成交 1.89M, aggressive buying accounts for 37.2%, value position +1.26% / +1.20%. Sentiment is the light; trading volume is the electricity. If the electricity cuts off, the light goes out. It has people watching now, but a lot of people doesn’t necessarily mean the road is definitely smooth.
$APT m成交 1.32M, aggressive buying accounts for 42.3%, value position +1.22% / +1.53%. You can watch popular names, but don’t let the crowd’s mood at the plaza make decisions for you. Popularity is just the entry; it’s worth continuing to watch only if the trading volume can hold.
$TIA m成交 1.71M, value position +2.67% / +6.45%, for short-term participation, whether capital is engaged matters more than simply looking at up or down. If you already have a position, don’t rush to add; it’s more important to wait for a pullback and catch it than to keep charging ahead. Prices can be misleading—only positions moving with them feel like there’s really money behind the trade.
$XPL m成交 1.89M, aggressive buying accounts for 37.2%, value position +1.26% / +1.20%. Sentiment is the light; trading volume is the electricity. If the electricity cuts off, the light goes out. It has people watching now, but a lot of people doesn’t necessarily mean the road is definitely smooth.
$APT m成交 1.32M, aggressive buying accounts for 42.3%, value position +1.22% / +1.53%. You can watch popular names, but don’t let the crowd’s mood at the plaza make decisions for you. Popularity is just the entry; it’s worth continuing to watch only if the trading volume can hold.
311
·
--
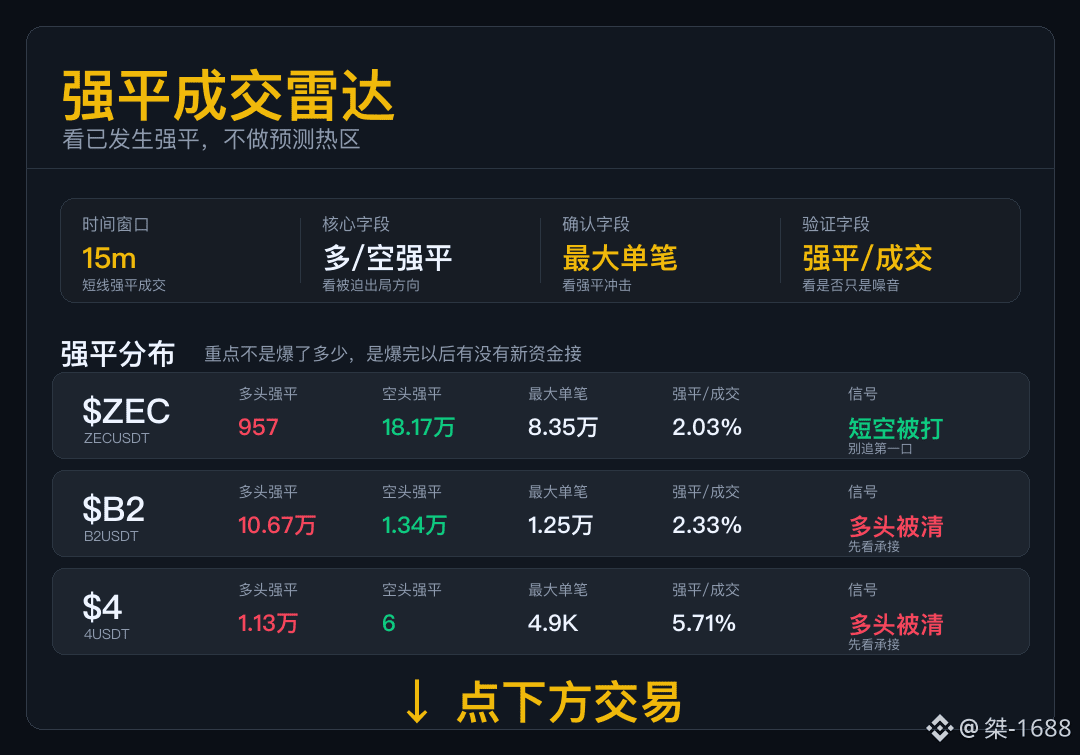
Strong Dealer Liquidation Radar
For data like this, first see who is forced out.
$ZEC The short side’s liquidation amount is dominant; covering shorts has become part of the trading volume in this segment.
$B2 This batch was cleared first on the long side. If buy orders can’t be matched later, rebounds are likely to turn into weak repairs.
$4 The long side’s liquidation indicates the leverage was washed out for a round first. Whether it can hold depends on the follow-through after liquidation.
This set of liquidations is not uniform in direction. After checking each coin clearly, determine who can provide the next relay.
Strong Dealer Liquidation Radar
For data like this, first see who is forced out.
$ZEC The short side’s liquidation amount is dominant; covering shorts has become part of the trading volume in this segment.
$B2 This batch was cleared first on the long side. If buy orders can’t be matched later, rebounds are likely to turn into weak repairs.
$4 The long side’s liquidation indicates the leverage was washed out for a round first. Whether it can hold depends on the follow-through after liquidation.
This set of liquidations is not uniform in direction. After checking each coin clearly, determine who can provide the next relay.
For data like this, first see who is forced out.
$ZEC The short side’s liquidation amount is dominant; covering shorts has become part of the trading volume in this segment.
$B2 This batch was cleared first on the long side. If buy orders can’t be matched later, rebounds are likely to turn into weak repairs.
$4 The long side’s liquidation indicates the leverage was washed out for a round first. Whether it can hold depends on the follow-through after liquidation.
This set of liquidations is not uniform in direction. After checking each coin clearly, determine who can provide the next relay.
594
·
--
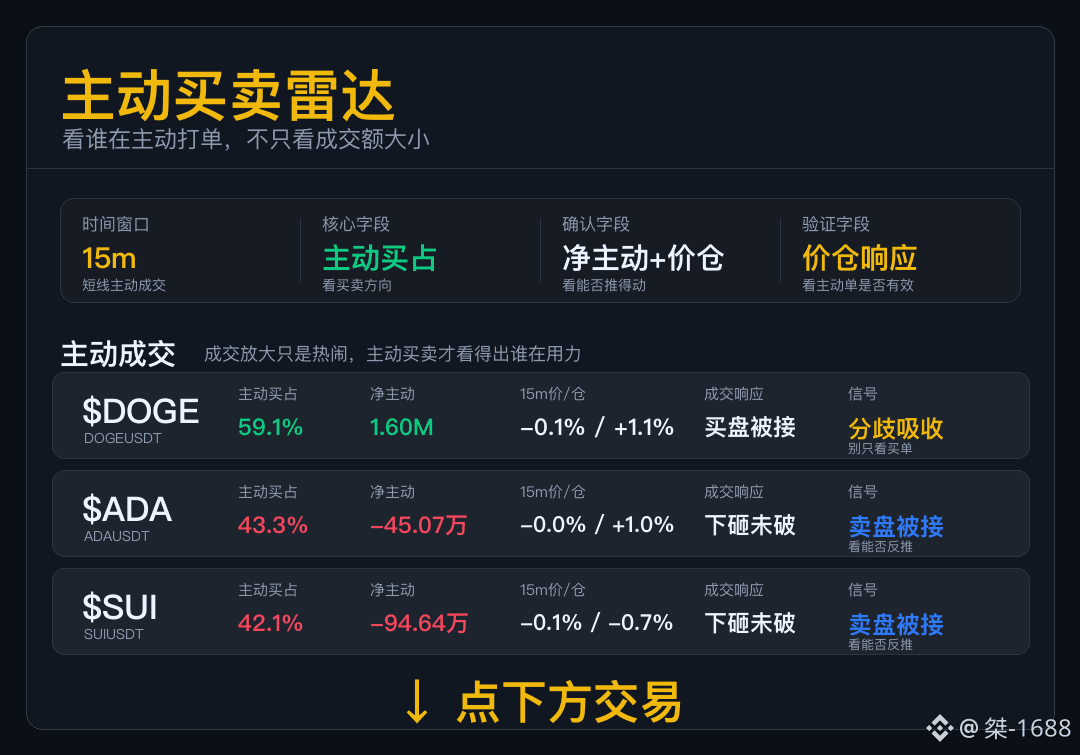
Active buy/sell radar
Don’t just look at the trading volume. Today, this set mainly checks whether the aggressive orders can push the price action.
$DOGE : The aggressive buy looks strong, but the price-pushing efficiency is average. Treat it as a probing position first.
$ADA : The aggressive sell orders are dominant, yet the price isn’t being smashed down. Passive buy support below is absorbing the sell pressure.
$SUI : The aggressive sells are not small, but the price isn’t being pushed down. Someone is taking orders below; later we’ll see if it can be used to reverse push.
This set isn’t the same script. Track coin by coin to see who can push and who gets caught.
Active buy/sell radar
Don’t just look at the trading volume. Today, this set mainly checks whether the aggressive orders can push the price action.
$DOGE : The aggressive buy looks strong, but the price-pushing efficiency is average. Treat it as a probing position first.
$ADA : The aggressive sell orders are dominant, yet the price isn’t being smashed down. Passive buy support below is absorbing the sell pressure.
$SUI : The aggressive sells are not small, but the price isn’t being pushed down. Someone is taking orders below; later we’ll see if it can be used to reverse push.
This set isn’t the same script. Track coin by coin to see who can push and who gets caught.
Don’t just look at the trading volume. Today, this set mainly checks whether the aggressive orders can push the price action.
$DOGE : The aggressive buy looks strong, but the price-pushing efficiency is average. Treat it as a probing position first.
$ADA : The aggressive sell orders are dominant, yet the price isn’t being smashed down. Passive buy support below is absorbing the sell pressure.
$SUI : The aggressive sells are not small, but the price isn’t being pushed down. Someone is taking orders below; later we’ll see if it can be used to reverse push.
This set isn’t the same script. Track coin by coin to see who can push and who gets caught.
320
·
--
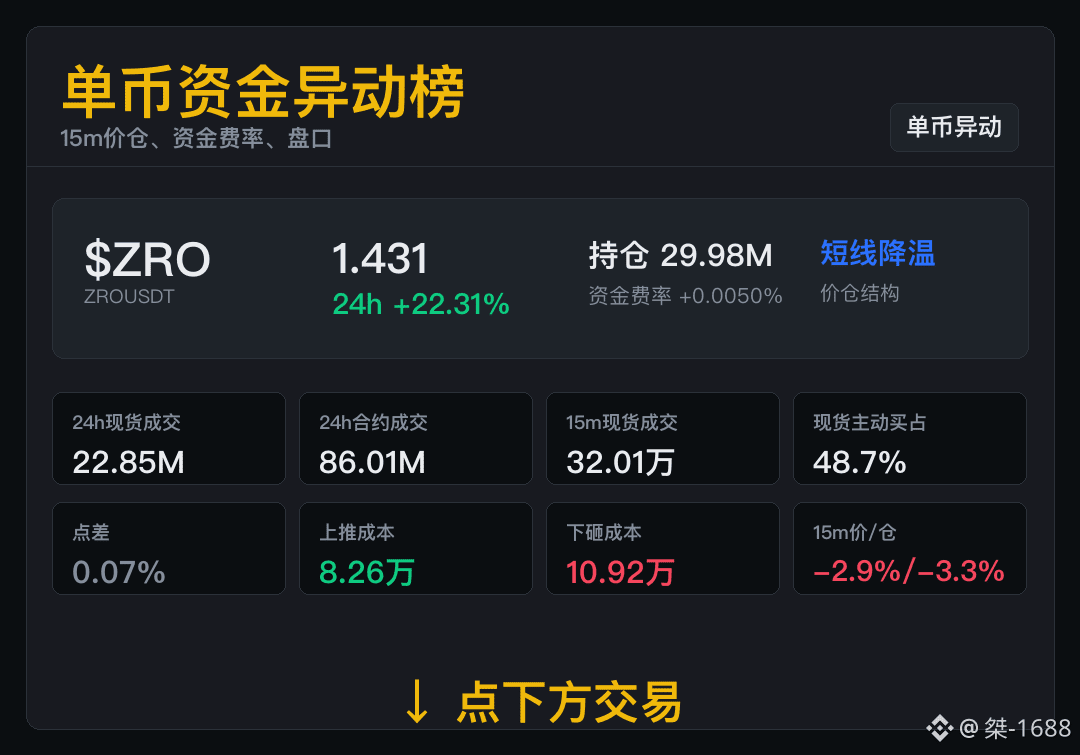
$ZRO This round of price and warehouse (order book) shows a double decline; next, we need to confirm whether trading activity continues to improve.
Current price 1.431, 24h change +22.31%; 15m price/warehouse -2.85% / -3.26%.
Price is falling in line with the positions; short-term participation is contracting.
Next, watch whether trading can recover. Once the price/warehouse stops declining, then raise the attention level again.
$ZRO This round of price and warehouse (order book) shows a double decline; next, we need to confirm whether trading activity continues to improve.
Current price 1.431, 24h change +22.31%; 15m price/warehouse -2.85% / -3.26%.
Price is falling in line with the positions; short-term participation is contracting.
Next, watch whether trading can recover. Once the price/warehouse stops declining, then raise the attention level again.
Current price 1.431, 24h change +22.31%; 15m price/warehouse -2.85% / -3.26%.
Price is falling in line with the positions; short-term participation is contracting.
Next, watch whether trading can recover. Once the price/warehouse stops declining, then raise the attention level again.
65
·
--
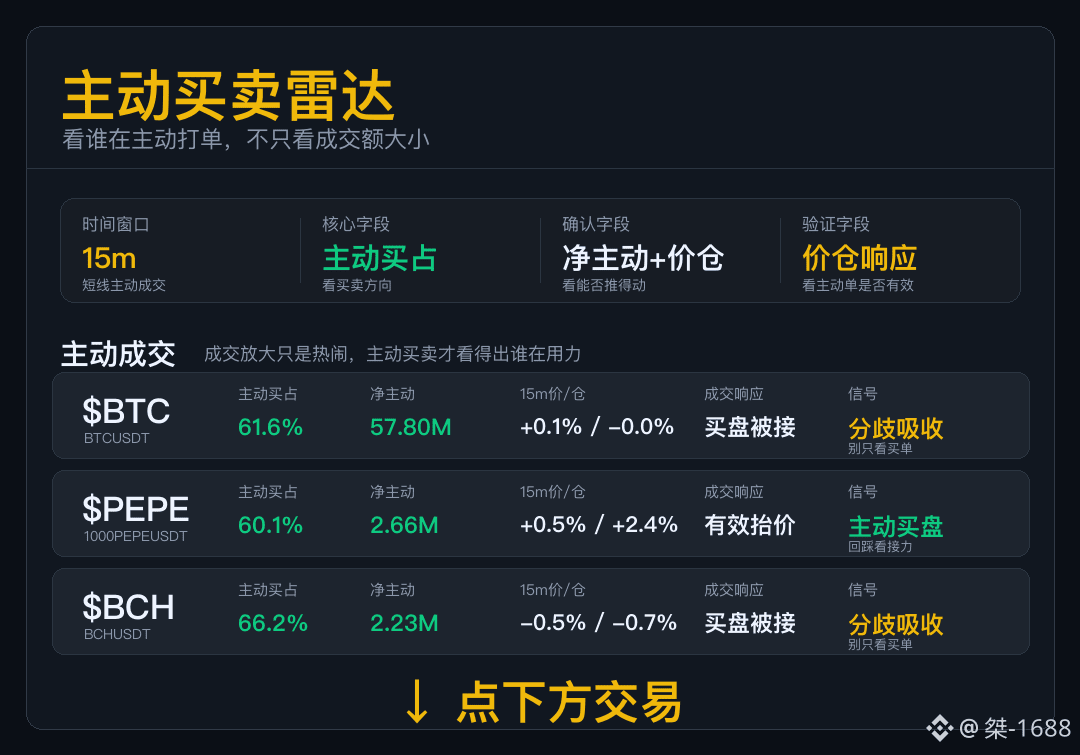
Active Trading Radar
Don’t just look at the trading volume. Today, we mainly want to see whether aggressive orders can push the order book.
$BTC : The buyer used buy-side volume but didn’t get any distance (price movement). The cost-effectiveness of continuing to chase higher is decreasing.
$PEPE : The active buy orders can push the price up, and the supply (price levels) also responds; next, we’ll watch whether the buy-side holds up when there’s a pullback.
$BCH : Buy order size is dominant, but the price is still moving sideways. The sell-side willingness to offer is more worth paying attention to.
The buy-side direction isn’t weak, but each coin has a different response. It’s cleaner to check order acceptance (liquidity/continuation) coin by coin.
Active Trading Radar
Don’t just look at the trading volume. Today, we mainly want to see whether aggressive orders can push the order book.
$BTC : The buyer used buy-side volume but didn’t get any distance (price movement). The cost-effectiveness of continuing to chase higher is decreasing.
$PEPE : The active buy orders can push the price up, and the supply (price levels) also responds; next, we’ll watch whether the buy-side holds up when there’s a pullback.
$BCH : Buy order size is dominant, but the price is still moving sideways. The sell-side willingness to offer is more worth paying attention to.
The buy-side direction isn’t weak, but each coin has a different response. It’s cleaner to check order acceptance (liquidity/continuation) coin by coin.
Don’t just look at the trading volume. Today, we mainly want to see whether aggressive orders can push the order book.
$BTC : The buyer used buy-side volume but didn’t get any distance (price movement). The cost-effectiveness of continuing to chase higher is decreasing.
$PEPE : The active buy orders can push the price up, and the supply (price levels) also responds; next, we’ll watch whether the buy-side holds up when there’s a pullback.
$BCH : Buy order size is dominant, but the price is still moving sideways. The sell-side willingness to offer is more worth paying attention to.
The buy-side direction isn’t weak, but each coin has a different response. It’s cleaner to check order acceptance (liquidity/continuation) coin by coin.
321
·
--
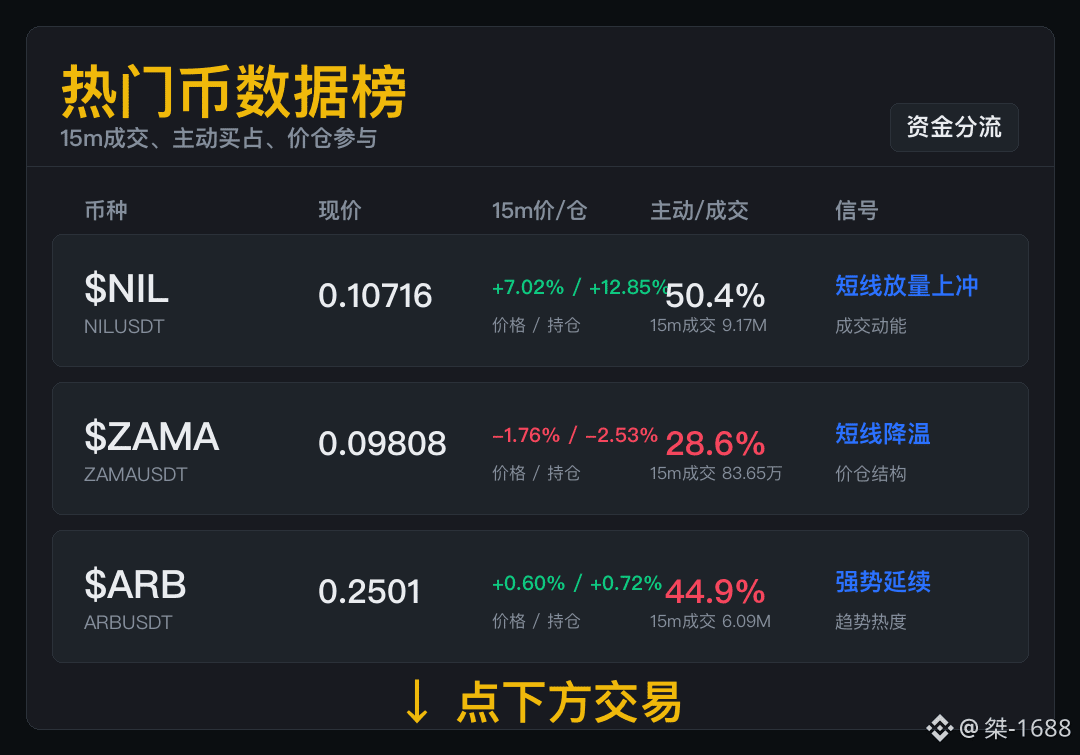
This isn’t a top-gainers leaderboard; it’s about pulling out the money trail first.
$NIL 15m成交 9.17M, price positioning +7.02% / +12.85%, and for the short term the level of participation matters more than simply looking at whether price is up or down. The crowd likes the drama—traders first check whether there are real trades behind the buzz. Being popular isn’t the answer, but popularity brings attention, and there may also be trading opportunities.
$ZAMA 15m成交 83.65万, price positioning -1.76% / -2.53%, and for the short term the level of participation matters more than simply looking at whether price is up or down. Don’t rush if you missed the move; once the heat cools down, you usually get a clearer position. What this market setup fears most is when you see it strong over the last 24h, then you chase—only to end up at the short-term pullback as momentum fades.
$ARB 15m成交 6.09M, price positioning +0.60% / +0.72%, and for the short term the level of participation matters more than simply looking at whether price is up or down. When it dips, there are people willing to take it; that’s healthier than continuously forcing a hard push. This kind of setup is driven by real participants—not some obscure coin randomly jumping on its own.
This isn’t a top-gainers leaderboard; it’s about pulling out the money trail first.
$NIL 15m成交 9.17M, price positioning +7.02% / +12.85%, and for the short term the level of participation matters more than simply looking at whether price is up or down. The crowd likes the drama—traders first check whether there are real trades behind the buzz. Being popular isn’t the answer, but popularity brings attention, and there may also be trading opportunities.
$ZAMA 15m成交 83.65万, price positioning -1.76% / -2.53%, and for the short term the level of participation matters more than simply looking at whether price is up or down. Don’t rush if you missed the move; once the heat cools down, you usually get a clearer position. What this market setup fears most is when you see it strong over the last 24h, then you chase—only to end up at the short-term pullback as momentum fades.
$ARB 15m成交 6.09M, price positioning +0.60% / +0.72%, and for the short term the level of participation matters more than simply looking at whether price is up or down. When it dips, there are people willing to take it; that’s healthier than continuously forcing a hard push. This kind of setup is driven by real participants—not some obscure coin randomly jumping on its own.
$NIL 15m成交 9.17M, price positioning +7.02% / +12.85%, and for the short term the level of participation matters more than simply looking at whether price is up or down. The crowd likes the drama—traders first check whether there are real trades behind the buzz. Being popular isn’t the answer, but popularity brings attention, and there may also be trading opportunities.
$ZAMA 15m成交 83.65万, price positioning -1.76% / -2.53%, and for the short term the level of participation matters more than simply looking at whether price is up or down. Don’t rush if you missed the move; once the heat cools down, you usually get a clearer position. What this market setup fears most is when you see it strong over the last 24h, then you chase—only to end up at the short-term pullback as momentum fades.
$ARB 15m成交 6.09M, price positioning +0.60% / +0.72%, and for the short term the level of participation matters more than simply looking at whether price is up or down. When it dips, there are people willing to take it; that’s healthier than continuously forcing a hard push. This kind of setup is driven by real participants—not some obscure coin randomly jumping on its own.
710
·
--
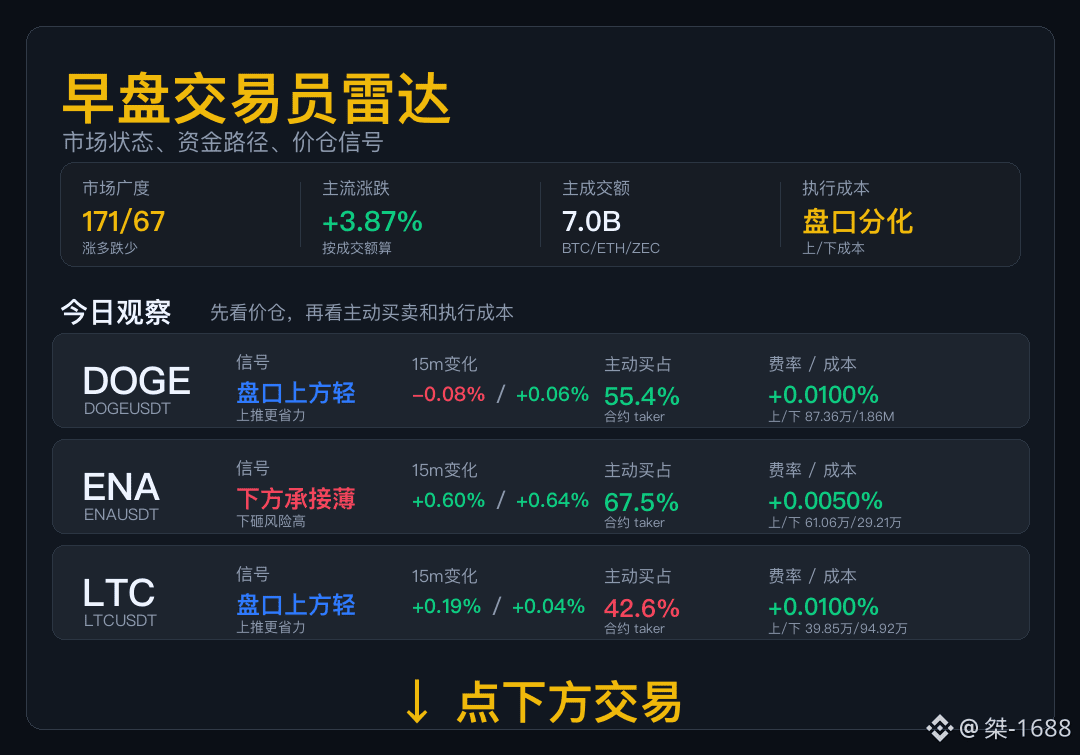
Morning Session Trader Radar
In the early hours, don’t chase the excitement—see whether the money is clustering in a few specific lines.
Market status: Binance USDT spot 171 up / 67 down. The majors are +3.87% overall, with total turnover around 7.0B. Market breadth is leaning strong—more gainers than losers. The major volume-weighted gain/loss is also above the zero line.
Capital path: This set isn’t about who looks hottest, but about who pushes up with the least effort and dumps with lower risk.
$DOGE The structural signal still isn’t firm enough—first see whether volume can keep following through. Don’t judge based on heat alone.
$ENA The follow-through below isn’t thick, and the 15m price/position is +0.60%/+0.64%. If it continues to weaken, don’t catch it just because it’s already down a lot.
$LTC The order book shows upside room, but what’s truly useful is continuous buy orders. If active buying—which is 42.6%—goes down, then downgrade it first.
Morning Session Trader Radar
In the early hours, don’t chase the excitement—see whether the money is clustering in a few specific lines.
Market status: Binance USDT spot 171 up / 67 down. The majors are +3.87% overall, with total turnover around 7.0B. Market breadth is leaning strong—more gainers than losers. The major volume-weighted gain/loss is also above the zero line.
Capital path: This set isn’t about who looks hottest, but about who pushes up with the least effort and dumps with lower risk.
$DOGE The structural signal still isn’t firm enough—first see whether volume can keep following through. Don’t judge based on heat alone.
$ENA The follow-through below isn’t thick, and the 15m price/position is +0.60%/+0.64%. If it continues to weaken, don’t catch it just because it’s already down a lot.
$LTC The order book shows upside room, but what’s truly useful is continuous buy orders. If active buying—which is 42.6%—goes down, then downgrade it first.
In the early hours, don’t chase the excitement—see whether the money is clustering in a few specific lines.
Market status: Binance USDT spot 171 up / 67 down. The majors are +3.87% overall, with total turnover around 7.0B. Market breadth is leaning strong—more gainers than losers. The major volume-weighted gain/loss is also above the zero line.
Capital path: This set isn’t about who looks hottest, but about who pushes up with the least effort and dumps with lower risk.
$DOGE The structural signal still isn’t firm enough—first see whether volume can keep following through. Don’t judge based on heat alone.
$ENA The follow-through below isn’t thick, and the 15m price/position is +0.60%/+0.64%. If it continues to weaken, don’t catch it just because it’s already down a lot.
$LTC The order book shows upside room, but what’s truly useful is continuous buy orders. If active buying—which is 42.6%—goes down, then downgrade it first.
76
·
--
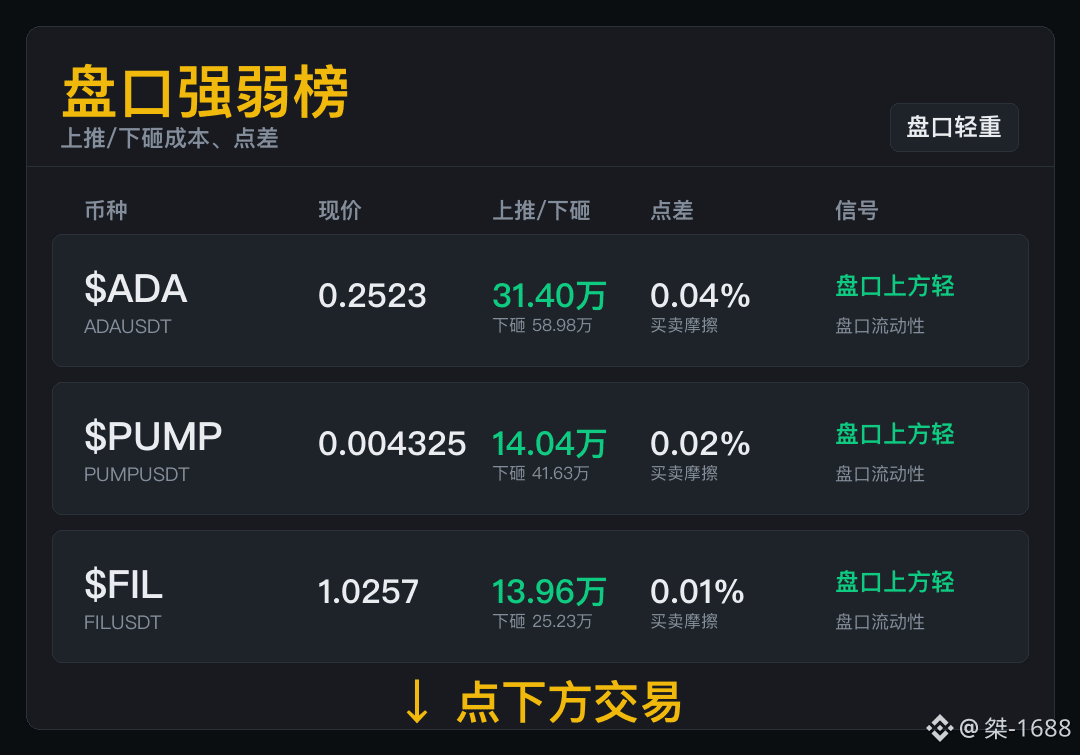
No need to tell a story about the order book—thin and thick liquidity already have the risk written into it.
On <$ADA >, prices push up 0.3140 million and get slammed down 0.5898 million, with a spread of 0.04%. The thinness above is just the road conditions; whether you can drive through depends on whether the buy side follows through. If you want to participate, first look at the aggressive buy orders. If the book is thin but there’s no buy pressure, it’s easy to make a wasted trip.
For <$PUMP >, the order-book conditions to check are three items: push up 0.1404 million, slam down 0.4163 million, and a spread of 0.02%. Those who are already in position should look for a pullback and get “caught” there—only then does the advantage of that order-book level become real. If the spread doesn’t widen and the trades keep coming continuously, that’s when you know people are truly walking this path.
For <$FIL >, the order-book conditions to check are three items: push up 0.1396 million, slam down 0.2523 million, and a spread of 0.01%. Missing the first move doesn’t matter—what matters more is the trading during the second leg. Light pressure overhead is just a condition; aggressive trading is the result.
No need to tell a story about the order book—thin and thick liquidity already have the risk written into it.
On <$ADA >, prices push up 0.3140 million and get slammed down 0.5898 million, with a spread of 0.04%. The thinness above is just the road conditions; whether you can drive through depends on whether the buy side follows through. If you want to participate, first look at the aggressive buy orders. If the book is thin but there’s no buy pressure, it’s easy to make a wasted trip.
For <$PUMP >, the order-book conditions to check are three items: push up 0.1404 million, slam down 0.4163 million, and a spread of 0.02%. Those who are already in position should look for a pullback and get “caught” there—only then does the advantage of that order-book level become real. If the spread doesn’t widen and the trades keep coming continuously, that’s when you know people are truly walking this path.
For <$FIL >, the order-book conditions to check are three items: push up 0.1396 million, slam down 0.2523 million, and a spread of 0.01%. Missing the first move doesn’t matter—what matters more is the trading during the second leg. Light pressure overhead is just a condition; aggressive trading is the result.
On <$ADA >, prices push up 0.3140 million and get slammed down 0.5898 million, with a spread of 0.04%. The thinness above is just the road conditions; whether you can drive through depends on whether the buy side follows through. If you want to participate, first look at the aggressive buy orders. If the book is thin but there’s no buy pressure, it’s easy to make a wasted trip.
For <$PUMP >, the order-book conditions to check are three items: push up 0.1404 million, slam down 0.4163 million, and a spread of 0.02%. Those who are already in position should look for a pullback and get “caught” there—only then does the advantage of that order-book level become real. If the spread doesn’t widen and the trades keep coming continuously, that’s when you know people are truly walking this path.
For <$FIL >, the order-book conditions to check are three items: push up 0.1396 million, slam down 0.2523 million, and a spread of 0.01%. Missing the first move doesn’t matter—what matters more is the trading during the second leg. Light pressure overhead is just a condition; aggressive trading is the result.
837
·
--
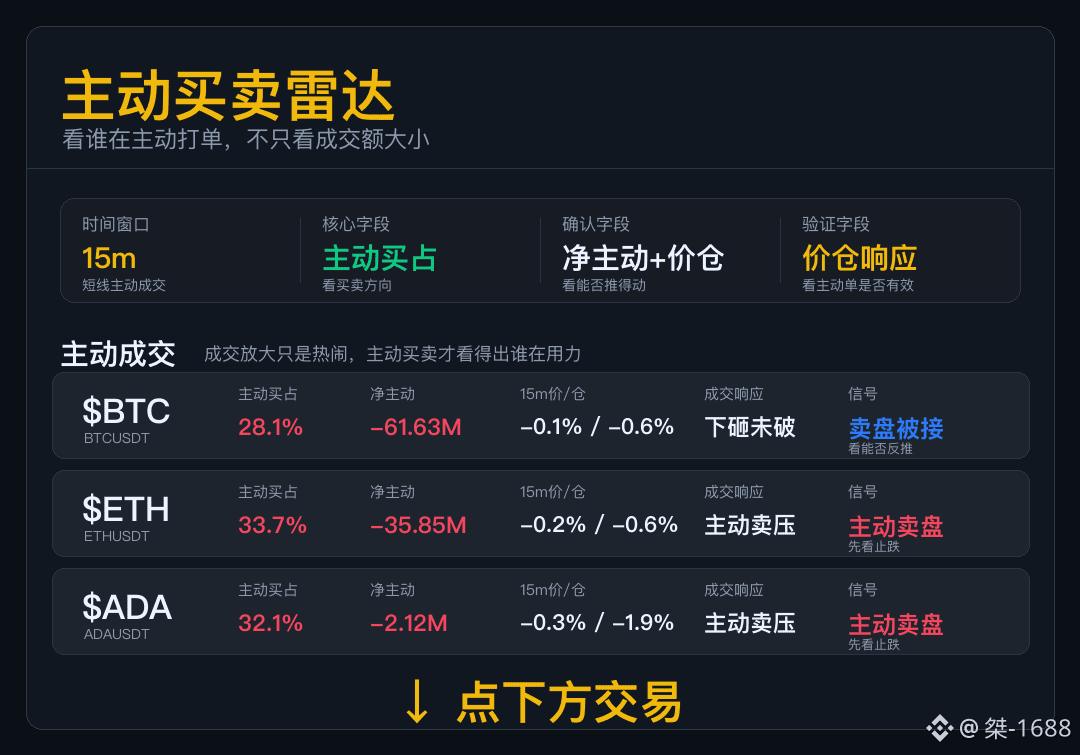
Active Buy/Sell Radar
Don’t just look at the trading volume—today, this set mainly checks whether the active orders can push the market.
$BTC has an advantage in active sell orders, yet the price hasn’t been pushed down; passive buy orders below are absorbing the sell pressure.
$ETH ’s sell orders aren’t just sitting there to scare people—they’ve already been executed into the trades. First, watch when the buy side comes back.
$ADA ’s active sell pressure has already been打出. If you want a rebound, you’ll first need to see the buy side retake the momentum.
The sellers are putting in effort, but the support varies from coin to coin—don’t read one table as only one direction.
Active Buy/Sell Radar
Don’t just look at the trading volume—today, this set mainly checks whether the active orders can push the market.
$BTC has an advantage in active sell orders, yet the price hasn’t been pushed down; passive buy orders below are absorbing the sell pressure.
$ETH ’s sell orders aren’t just sitting there to scare people—they’ve already been executed into the trades. First, watch when the buy side comes back.
$ADA ’s active sell pressure has already been打出. If you want a rebound, you’ll first need to see the buy side retake the momentum.
The sellers are putting in effort, but the support varies from coin to coin—don’t read one table as only one direction.
Don’t just look at the trading volume—today, this set mainly checks whether the active orders can push the market.
$BTC has an advantage in active sell orders, yet the price hasn’t been pushed down; passive buy orders below are absorbing the sell pressure.
$ETH ’s sell orders aren’t just sitting there to scare people—they’ve already been executed into the trades. First, watch when the buy side comes back.
$ADA ’s active sell pressure has already been打出. If you want a rebound, you’ll first need to see the buy side retake the momentum.
The sellers are putting in effort, but the support varies from coin to coin—don’t read one table as only one direction.
113
Log in to explore more content
Join global crypto users on Binance Square
⚡️ Get latest and useful information about crypto.
💬 Trusted by the world’s largest crypto exchange.
👍 Discover real insights from verified creators.
Email / Phone number
Trending Topics
AIStocksWhatNext
690,498 views
5,134 Discussing
Share & Win Traffic Reward in our Trending Hashtag Campaign
✨Topic: What Other Investment Opportunities Remain as AI Stocks Keep Rising?
👉How to Join:
Publish a short post or article with hashtag #AIStocksWhatNext
Share whether you’re bullish or bearish, and post your AI stock holdings or trade — using the trade widget may improve your eligibility.
You can also strengthen your post by sharing data or charts, and avoiding AI-generated images.
✍️Create content based on the below angles:
- Nvidia says chip sales will double next year, and top AI companies keep hitting record revenue, the compute spend behind it is just as staggering. Is AI demand really taking off? And how long can it last? AI stocks are up across the board. Is this a real breakout, or just a short-term bounce?
- Industry leaders are calling to slow down AI development, while Trump plans to build an “AI Force”, claiming AI could account for 25% of U.S. GDP in the future. Whose side are you on? Will state-level backing be a long-term win for AI stocks?
- Are you buying AI stocks? Share your AI-related trade/holdings with our trade sharing widget.
⏰Campaign Period:
- 2026-09-22 7:00 - 2026-09-24 4:00 UTC
🎁Reward:
- Qualified posts that comply with the above guidelines and contain more than 100 words will be reviewed and may receive a random traffic boost of 500 to 3,000 views. You will receive a notification from your feed secretary if your post is selected.
- Get a chance to have your article featured on Binance Square Official
Need ideas for your post? Visit the topic page #AIStocksWhatNext or the Square Guide on How to Post for Better Reach.
Binance Square Official
·504 Likes
·1.4M views
21SharesLaunchesEuropesFirstZcashETP
16,856 views
576 Discussing
CardanoJoinsX402PaymentStandard
12,322 views
435 Discussing