
Dvago
95 Posts

Dvago
Report
Block User
Noob Crypto
Open Trade
High-Frequency Trader
4.6 Years
2 Following
97 Followers
100 Liked
Posts
Portfolio
All
Quotes
Videos
PINNED
·
--

Article
Bearish Strategy for BTC on 2-Hour and 4-Hour TimeframesIn the current cryptocurrency market analysis, we observe a significant bearish trend for Bitcoin (BTC). Using Binance charts and focusing on the 2-hour and 4-hour timeframes, we can outline an effective strategy to capitalize on this market scenario.
Technical Analysis
1. Current Price and EMAs:
- In the 2-hour timeframe, the current BTC price is $56,736.6.
- In the 4-hour timeframe, the current price is $56,716.0.
- The exponential moving averages (EMAs) of 7, 25, and 99 periods show a bearish alignment, indicating a possible continuation of the downward trend.
2. Momentum Indicators:
- RSI (Relative Strength Index): In both timeframes, the RSI is below 50, suggesting that bearish momentum is still strong.
- Stochastic RSI: Shows an oversold reading, which might anticipate a small rebound before continuing the decline.
- MACD (Moving Average Convergence Divergence): The MACD lines are below the signal line, reinforcing the bearish outlook.
3. Key Supports and Resistances:
- 4-hour Support: $48,547.7
- 4-hour Resistance: $64,212.0
- 2-hour Support: $47,401.5
- 2-hour Resistance: $72,617.2
Trading Strategy
To take advantage of the bearish trend in these timeframes, consider the following actions:
1. Entries:
- Make a short entry (sell) near the resistance level in the 2-hour timeframe ($72,617.2), expecting a correction towards the support levels.
- Alternatively, open short positions after additional technical indicator confirmations, such as a bearish crossover in the MACD or a drop in the RSI below 30.
2. Exits:
- Set take-profit levels around the 4-hour support ($48,547.7) and 2-hour support ($47,401.5), securing a gain if the price continues to drop.
- Use a tight stop loss above the resistance level in the 4-hour timeframe ($64,212.0) to limit potential losses in case of an unexpected trend reversal.
Conclusion
The bearish strategy for BTC in the 2-hour and 4-hour timeframes is based on detailed technical analysis indicating a continuation of the downward trend. By utilizing key tools and levels, traders can take advantage of this market movement for profit.
#MarketDownturn #BTC #Ethereum #Binance #ETH
If you loved the strategy, give it a like and follow me for more similar content. Thanks for your support!$BTC
{spot}(BTCUSDT)
Bearish Strategy for BTC on 2-Hour and 4-Hour Timeframes
In the current cryptocurrency market analysis, we observe a significant bearish trend for Bitcoin (BTC). Using Binance charts and focusing on the 2-hour and 4-hour timeframes, we can outline an effective strategy to capitalize on this market scenario.
Technical Analysis
1. Current Price and EMAs:
- In the 2-hour timeframe, the current BTC price is $56,736.6.
- In the 4-hour timeframe, the current price is $56,716.0.
- The exponential moving averages (EMAs) of 7, 25, and 99 periods show a bearish alignment, indicating a possible continuation of the downward trend.
2. Momentum Indicators:
- RSI (Relative Strength Index): In both timeframes, the RSI is below 50, suggesting that bearish momentum is still strong.
- Stochastic RSI: Shows an oversold reading, which might anticipate a small rebound before continuing the decline.
- MACD (Moving Average Convergence Divergence): The MACD lines are below the signal line, reinforcing the bearish outlook.
3. Key Supports and Resistances:
- 4-hour Support: $48,547.7
- 4-hour Resistance: $64,212.0
- 2-hour Support: $47,401.5
- 2-hour Resistance: $72,617.2
Trading Strategy
To take advantage of the bearish trend in these timeframes, consider the following actions:
1. Entries:
- Make a short entry (sell) near the resistance level in the 2-hour timeframe ($72,617.2), expecting a correction towards the support levels.
- Alternatively, open short positions after additional technical indicator confirmations, such as a bearish crossover in the MACD or a drop in the RSI below 30.
2. Exits:
- Set take-profit levels around the 4-hour support ($48,547.7) and 2-hour support ($47,401.5), securing a gain if the price continues to drop.
- Use a tight stop loss above the resistance level in the 4-hour timeframe ($64,212.0) to limit potential losses in case of an unexpected trend reversal.
Conclusion
The bearish strategy for BTC in the 2-hour and 4-hour timeframes is based on detailed technical analysis indicating a continuation of the downward trend. By utilizing key tools and levels, traders can take advantage of this market movement for profit.
#MarketDownturn #BTC #Ethereum #Binance #ETH
If you loved the strategy, give it a like and follow me for more similar content. Thanks for your support!$BTC
Technical Analysis
1. Current Price and EMAs:
- In the 2-hour timeframe, the current BTC price is $56,736.6.
- In the 4-hour timeframe, the current price is $56,716.0.
- The exponential moving averages (EMAs) of 7, 25, and 99 periods show a bearish alignment, indicating a possible continuation of the downward trend.
2. Momentum Indicators:
- RSI (Relative Strength Index): In both timeframes, the RSI is below 50, suggesting that bearish momentum is still strong.
- Stochastic RSI: Shows an oversold reading, which might anticipate a small rebound before continuing the decline.
- MACD (Moving Average Convergence Divergence): The MACD lines are below the signal line, reinforcing the bearish outlook.
3. Key Supports and Resistances:
- 4-hour Support: $48,547.7
- 4-hour Resistance: $64,212.0
- 2-hour Support: $47,401.5
- 2-hour Resistance: $72,617.2
Trading Strategy
To take advantage of the bearish trend in these timeframes, consider the following actions:
1. Entries:
- Make a short entry (sell) near the resistance level in the 2-hour timeframe ($72,617.2), expecting a correction towards the support levels.
- Alternatively, open short positions after additional technical indicator confirmations, such as a bearish crossover in the MACD or a drop in the RSI below 30.
2. Exits:
- Set take-profit levels around the 4-hour support ($48,547.7) and 2-hour support ($47,401.5), securing a gain if the price continues to drop.
- Use a tight stop loss above the resistance level in the 4-hour timeframe ($64,212.0) to limit potential losses in case of an unexpected trend reversal.
Conclusion
The bearish strategy for BTC in the 2-hour and 4-hour timeframes is based on detailed technical analysis indicating a continuation of the downward trend. By utilizing key tools and levels, traders can take advantage of this market movement for profit.
#MarketDownturn #BTC #Ethereum #Binance #ETH
If you loved the strategy, give it a like and follow me for more similar content. Thanks for your support!$BTC
272
·
--
Article
Bitcoin stays below $74,000 after hot CPI as markets price in another Fed rate hikeWednesday, November 11, 2026, morning Mexico time
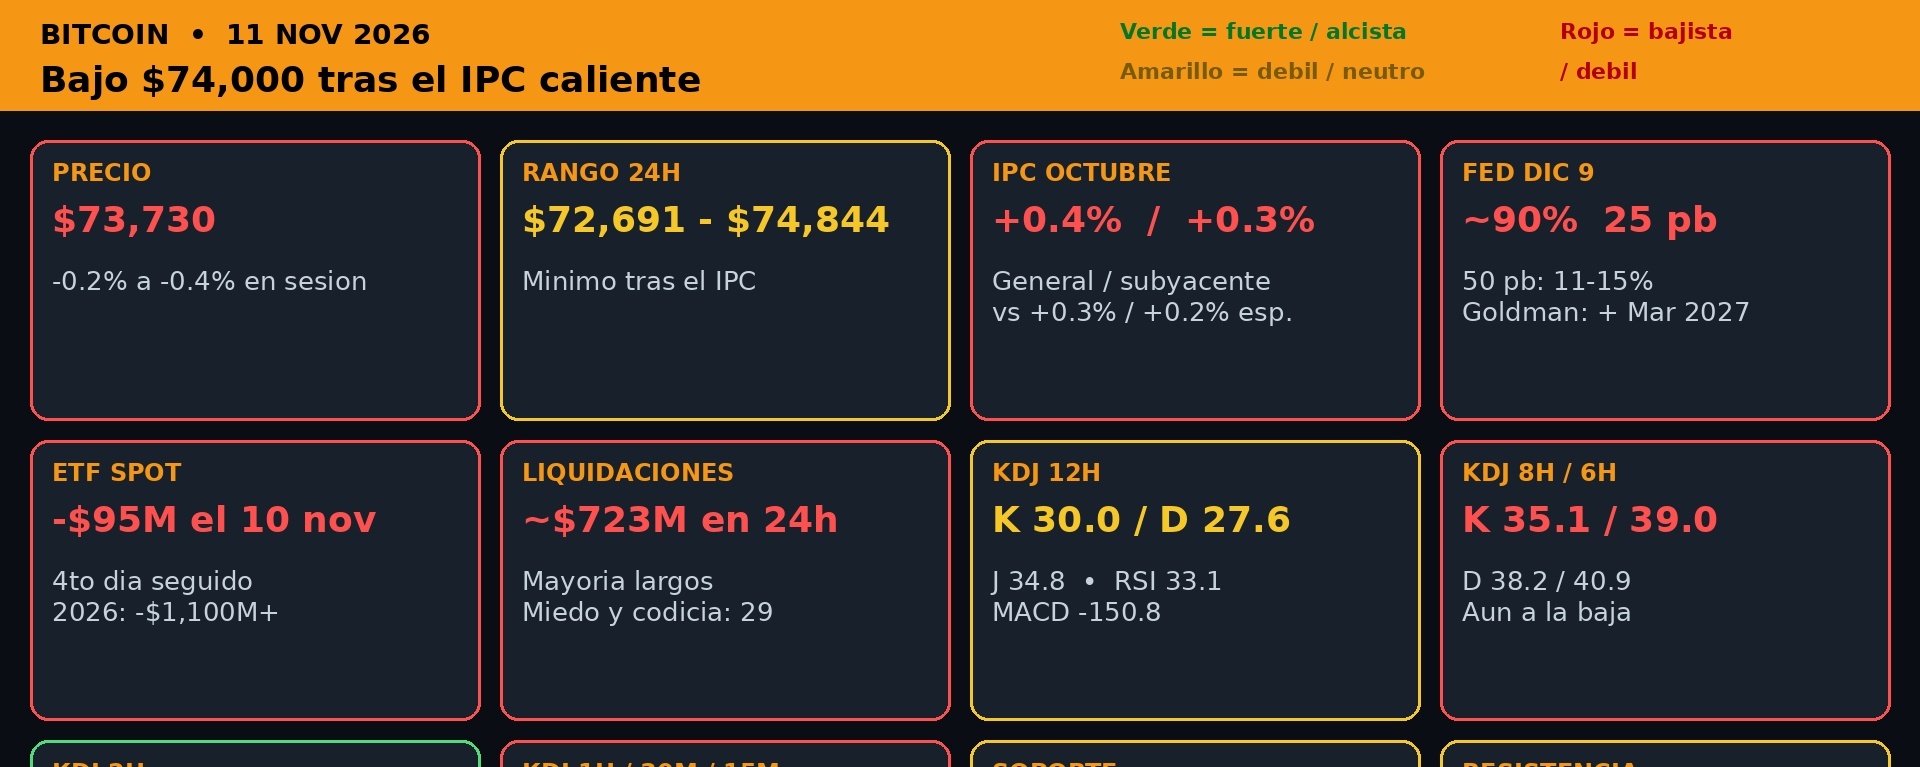
Bitcoin is trading around $73,730, down between 0.2% and 0.4% in the session, and remains below $74,000. The 24-hour low is $72,691, the same level it touched after Tuesday’s inflation data, while the high is $74,843.82.
The market is still digesting the hotter-than-expected U.S. October CPI: headline inflation rose 0.4% month over month versus 0.3% expected, while core inflation rose 0.3% versus 0.2% expected. It was the third consecutive monthly reading to come in above expectations.
Bitcoin stays below $74,000 after hot CPI as markets price in another Fed rate hike
Wednesday, November 11, 2026, morning Mexico time
Bitcoin is trading around $73,730, down between 0.2% and 0.4% in the session, and remains below $74,000. The 24-hour low is $72,691, the same level it touched after Tuesday’s inflation data, while the high is $74,843.82.
The market is still digesting the hotter-than-expected U.S. October CPI: headline inflation rose 0.4% month over month versus 0.3% expected, while core inflation rose 0.3% versus 0.2% expected. It was the third consecutive monthly reading to come in above expectations.
Bitcoin is trading around $73,730, down between 0.2% and 0.4% in the session, and remains below $74,000. The 24-hour low is $72,691, the same level it touched after Tuesday’s inflation data, while the high is $74,843.82.
The market is still digesting the hotter-than-expected U.S. October CPI: headline inflation rose 0.4% month over month versus 0.3% expected, while core inflation rose 0.3% versus 0.2% expected. It was the third consecutive monthly reading to come in above expectations.
327
·
--
Partly True
Article
Bitcoin falls below $74,810 as it awaits CPI, with the Fed almost certain to raise ratesTuesday, November 10, 2026
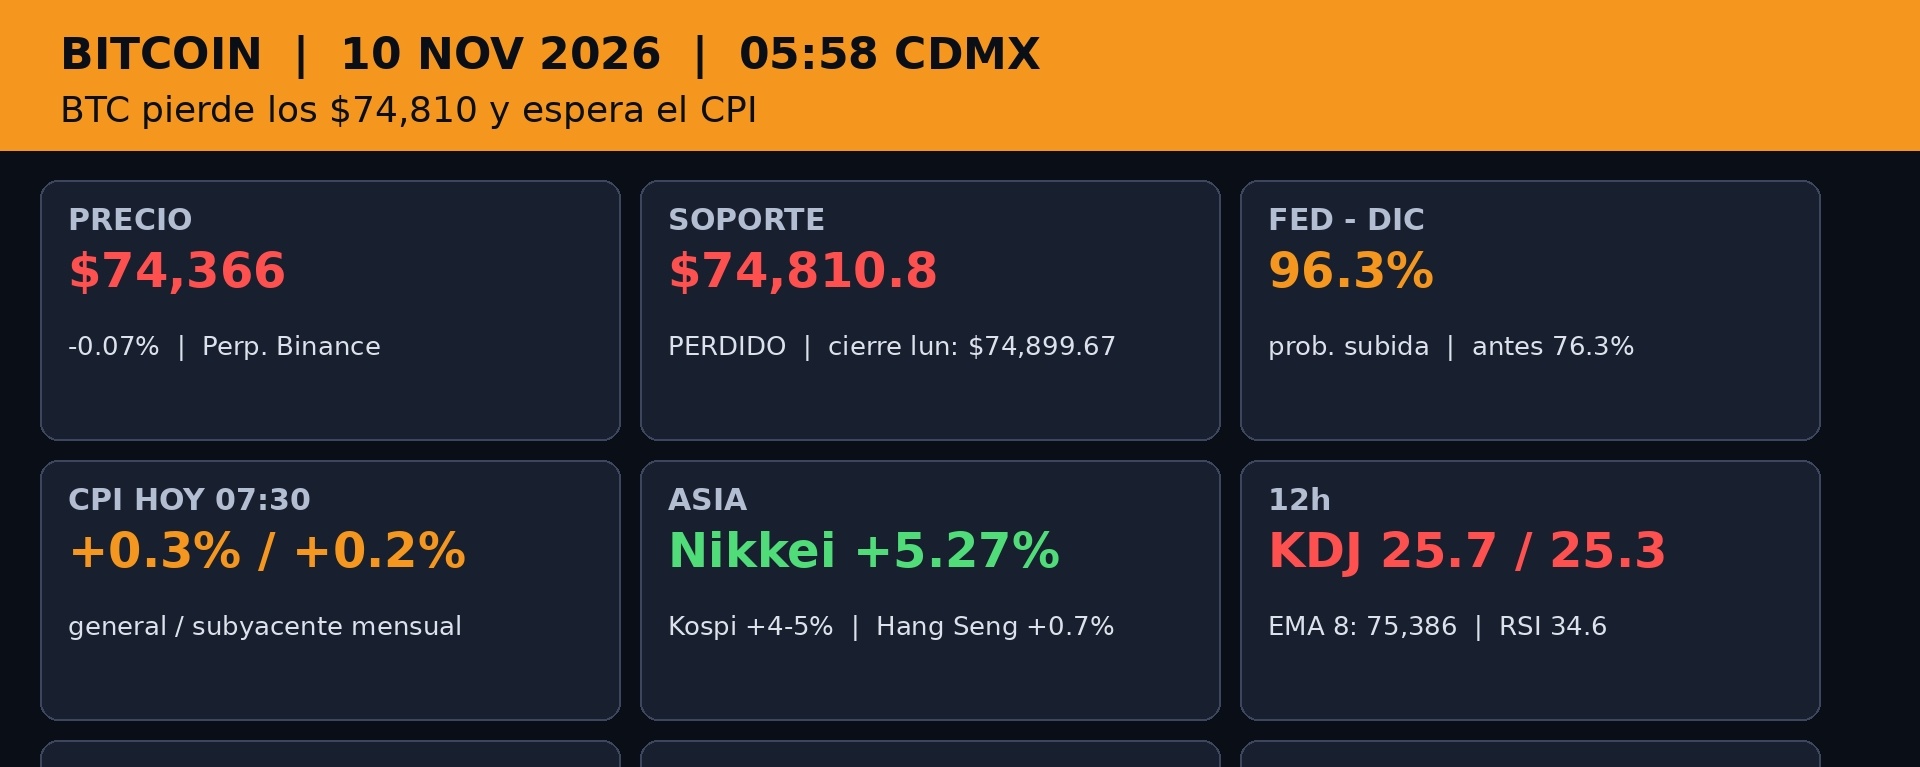
Bitcoin opened Tuesday trading around $74,366-$74,374, already below the $74,810.8 support level, the low recorded on November 6. Monday's close was $74,899.67, just $89 above that level. The recovery was short-lived, and the early morning erased it.
Asia is up, Bitcoin isn't
Asian markets opened in the green. The Nikkei rose **+5.27%** to 60,460; the Kospi, between **+4% and +5%**; Taiwan, **+2.6%**; the Hang Seng, **+0.4% to +0.7%**; and Shanghai, **+0.32% to +0.6%**.
Bitcoin falls below $74,810 as it awaits CPI, with the Fed almost certain to raise rates
Tuesday, November 10, 2026
Bitcoin opened Tuesday trading around $74,366-$74,374, already below the $74,810.8 support level, the low recorded on November 6. Monday's close was $74,899.67, just $89 above that level. The recovery was short-lived, and the early morning erased it.
Asia is up, Bitcoin isn't
Asian markets opened in the green. The Nikkei rose **+5.27%** to 60,460; the Kospi, between **+4% and +5%**; Taiwan, **+2.6%**; the Hang Seng, **+0.4% to +0.7%**; and Shanghai, **+0.32% to +0.6%**.
Bitcoin opened Tuesday trading around $74,366-$74,374, already below the $74,810.8 support level, the low recorded on November 6. Monday's close was $74,899.67, just $89 above that level. The recovery was short-lived, and the early morning erased it.
Asia is up, Bitcoin isn't
Asian markets opened in the green. The Nikkei rose **+5.27%** to 60,460; the Kospi, between **+4% and +5%**; Taiwan, **+2.6%**; the Hang Seng, **+0.4% to +0.7%**; and Shanghai, **+0.32% to +0.6%**.
1
1.2k
·
--
Partly True

Article
Bitcoin falls below $75,000, setting off alarm bellsSunday, November 8, 2026
Bitcoin fell below $75,000 during the Asian session and touched nearly $74,500, below the November 6 low of $74,810.8. It then recovered some of its losses and returned to trading around $75,256.
There was no crypto market-specific catalyst. The move came amid risk aversion ahead of Nvidia’s opening, following an admission by its CEO, Jensen Huang, and an independent investigation by the board of directors. The move was compounded by a drone attack on the Khor Mor gas field in Iraq, which halted production.
Bitcoin falls below $75,000, setting off alarm bells
Sunday, November 8, 2026
Bitcoin fell below $75,000 during the Asian session and touched nearly $74,500, below the November 6 low of $74,810.8. It then recovered some of its losses and returned to trading around $75,256.
There was no crypto market-specific catalyst. The move came amid risk aversion ahead of Nvidia’s opening, following an admission by its CEO, Jensen Huang, and an independent investigation by the board of directors. The move was compounded by a drone attack on the Khor Mor gas field in Iraq, which halted production.
Bitcoin fell below $75,000 during the Asian session and touched nearly $74,500, below the November 6 low of $74,810.8. It then recovered some of its losses and returned to trading around $75,256.
There was no crypto market-specific catalyst. The move came amid risk aversion ahead of Nvidia’s opening, following an admission by its CEO, Jensen Huang, and an independent investigation by the board of directors. The move was compounded by a drone attack on the Khor Mor gas field in Iraq, which halted production.
3
2.2k
·
--
Bearish

449
·
--
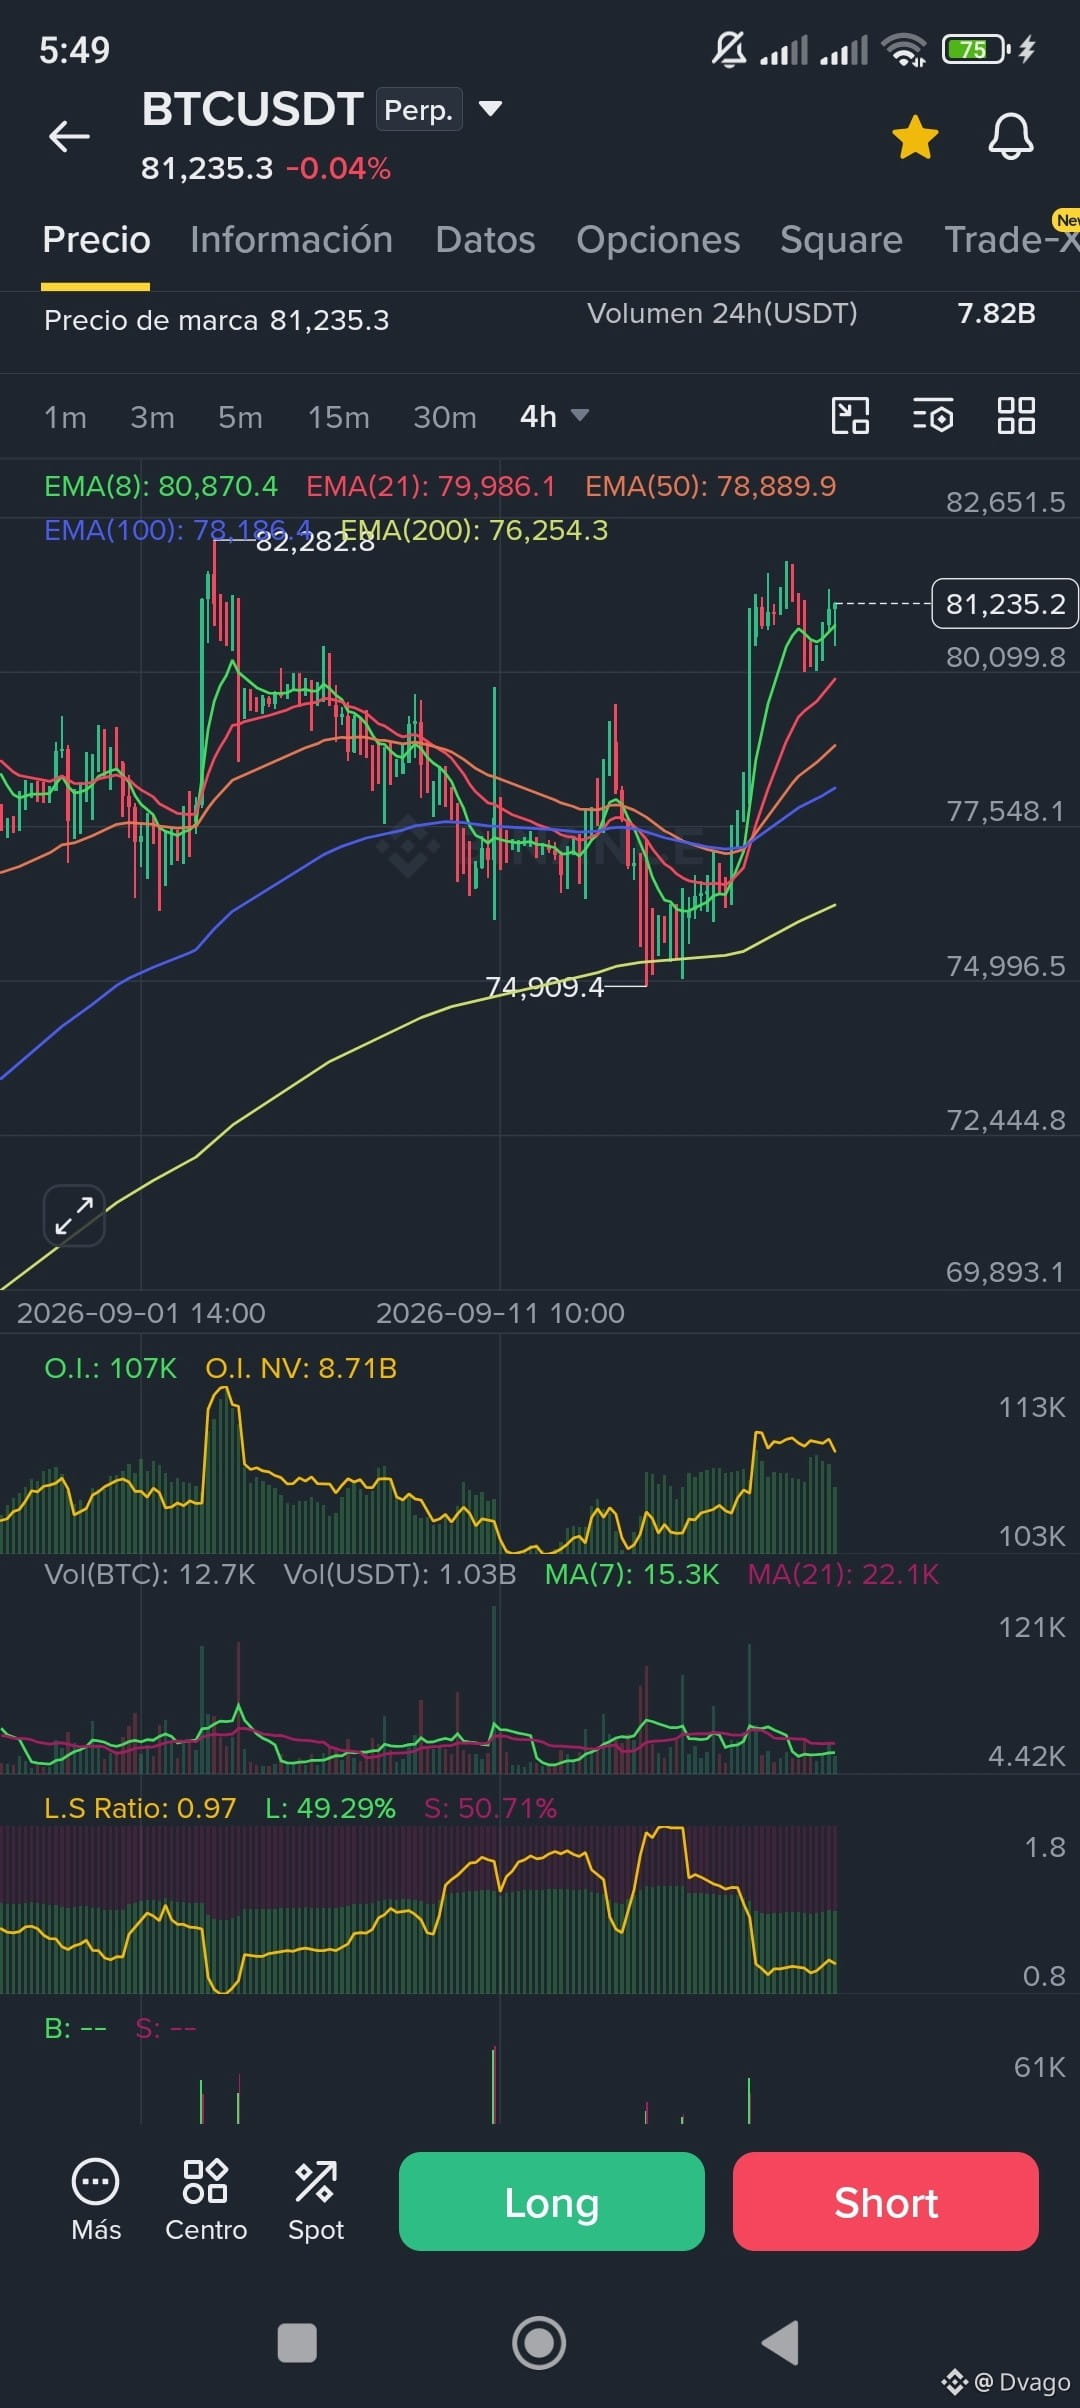
$BTC we will achieve and surpass 87 250 🚀🚀🚀🚀
$BTC we will achieve and surpass 87 250 🚀🚀🚀🚀
Si 🚀🚀🚀🚀
29%
No creo mejor vende 🐻🐻🐻😞
71%
mejor invierto en cts 🤔🤔🤔
0%
7 votes • Voting closed
115

·
--
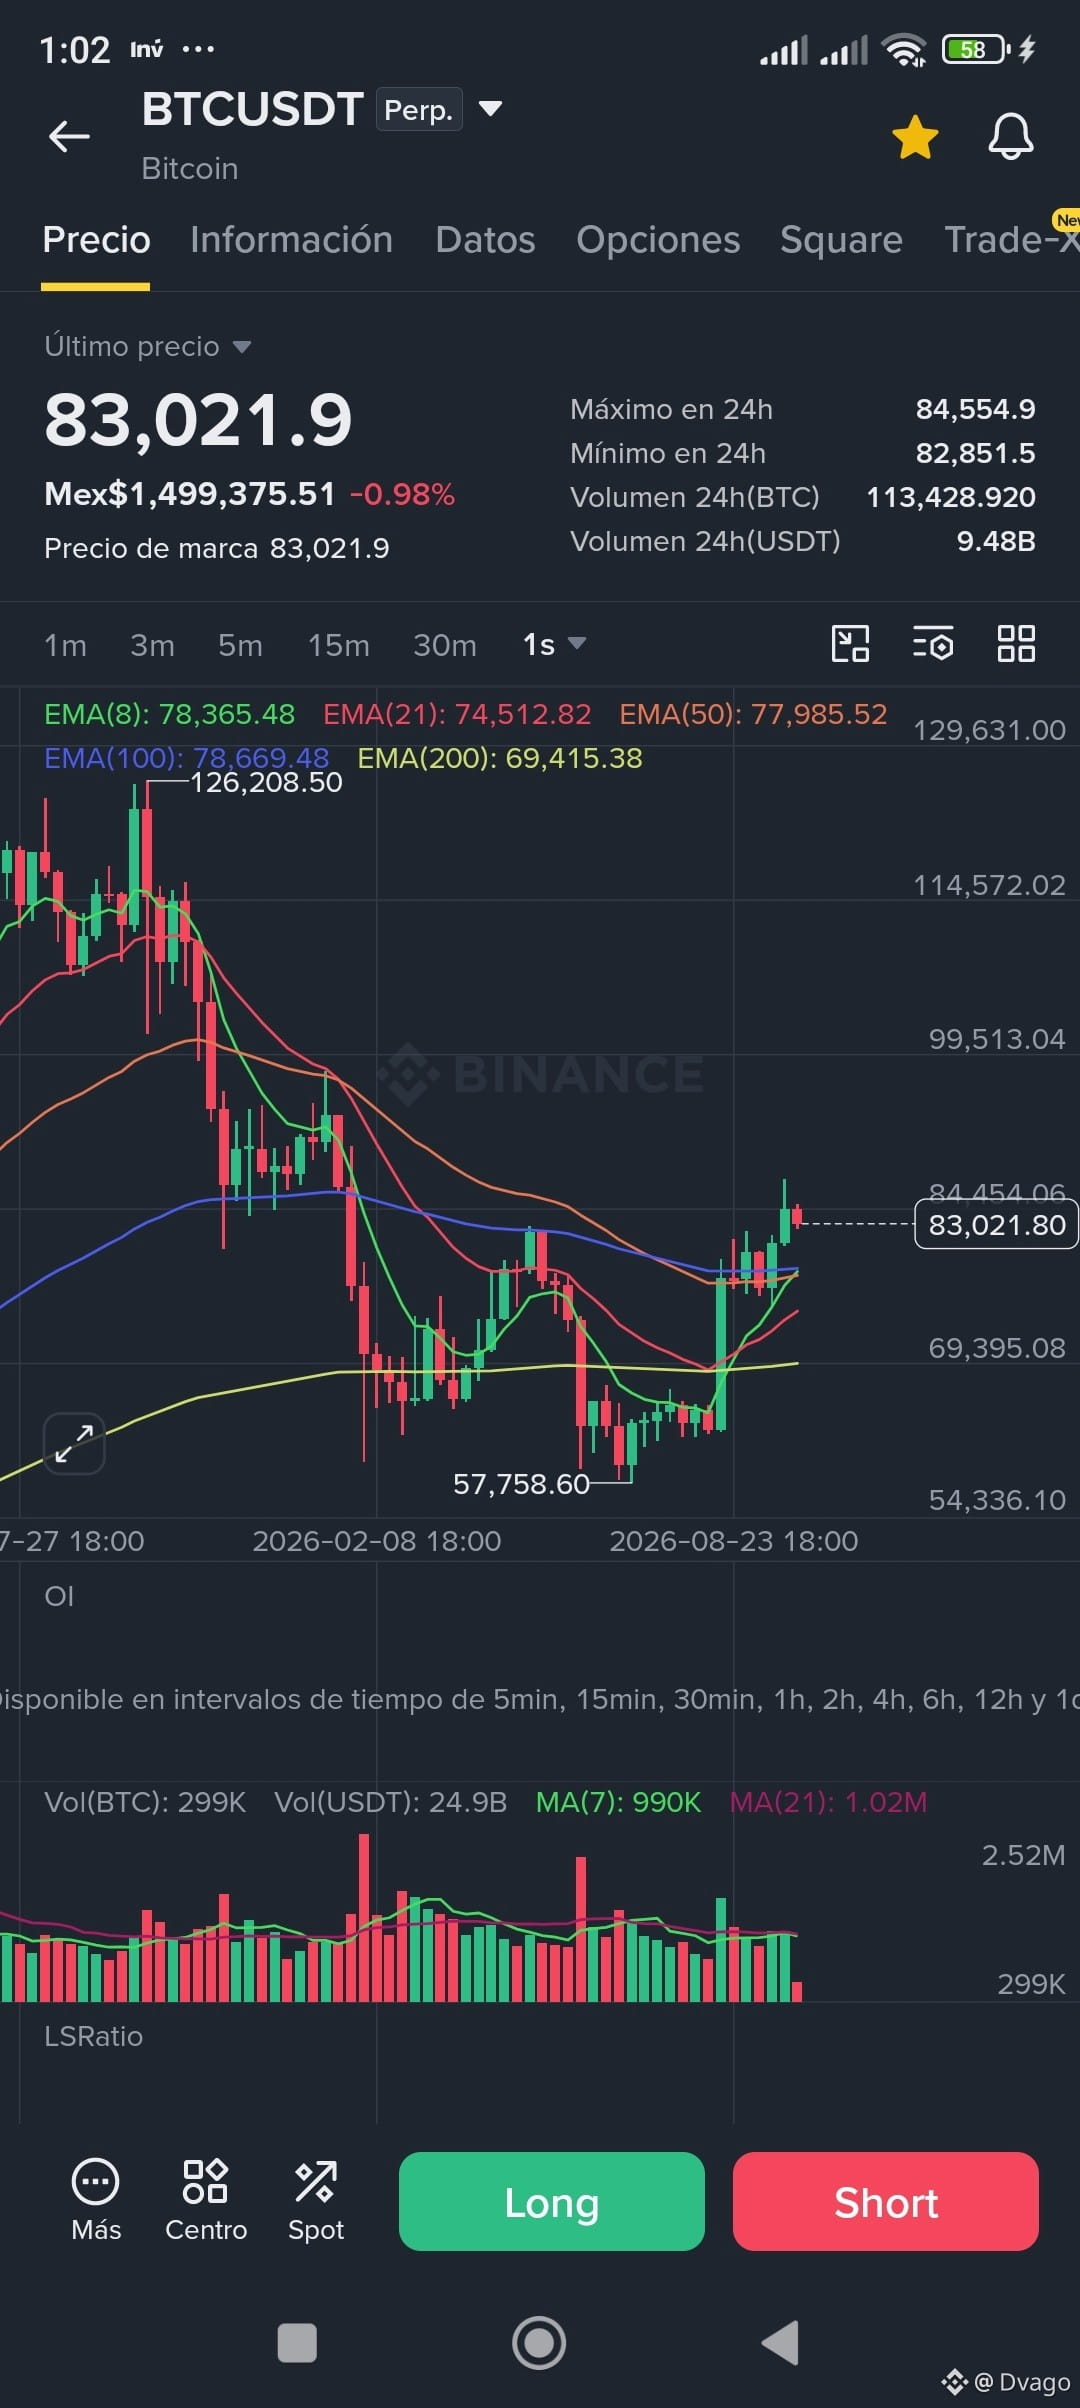
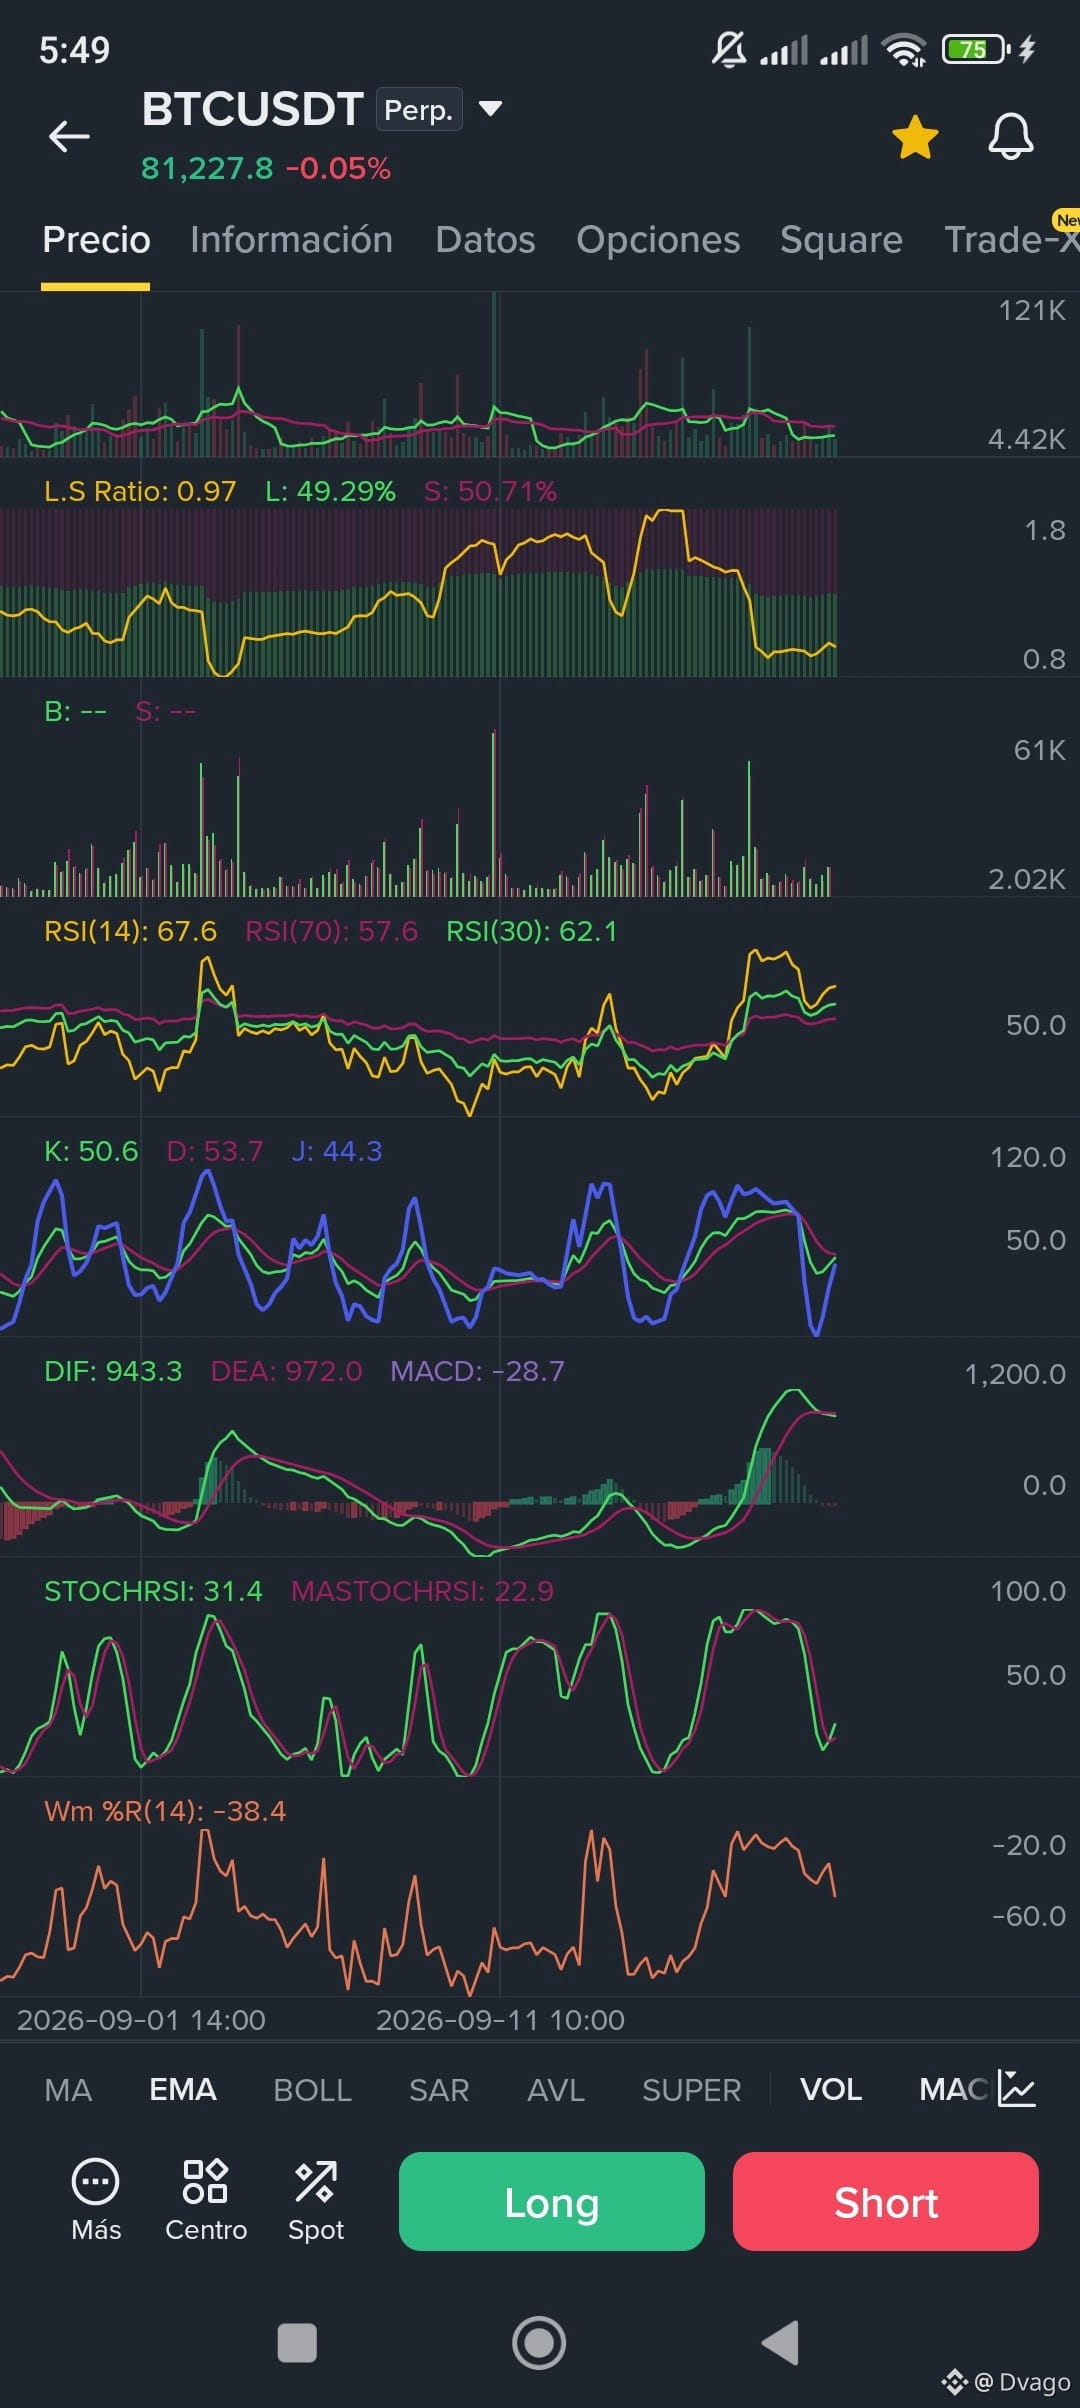
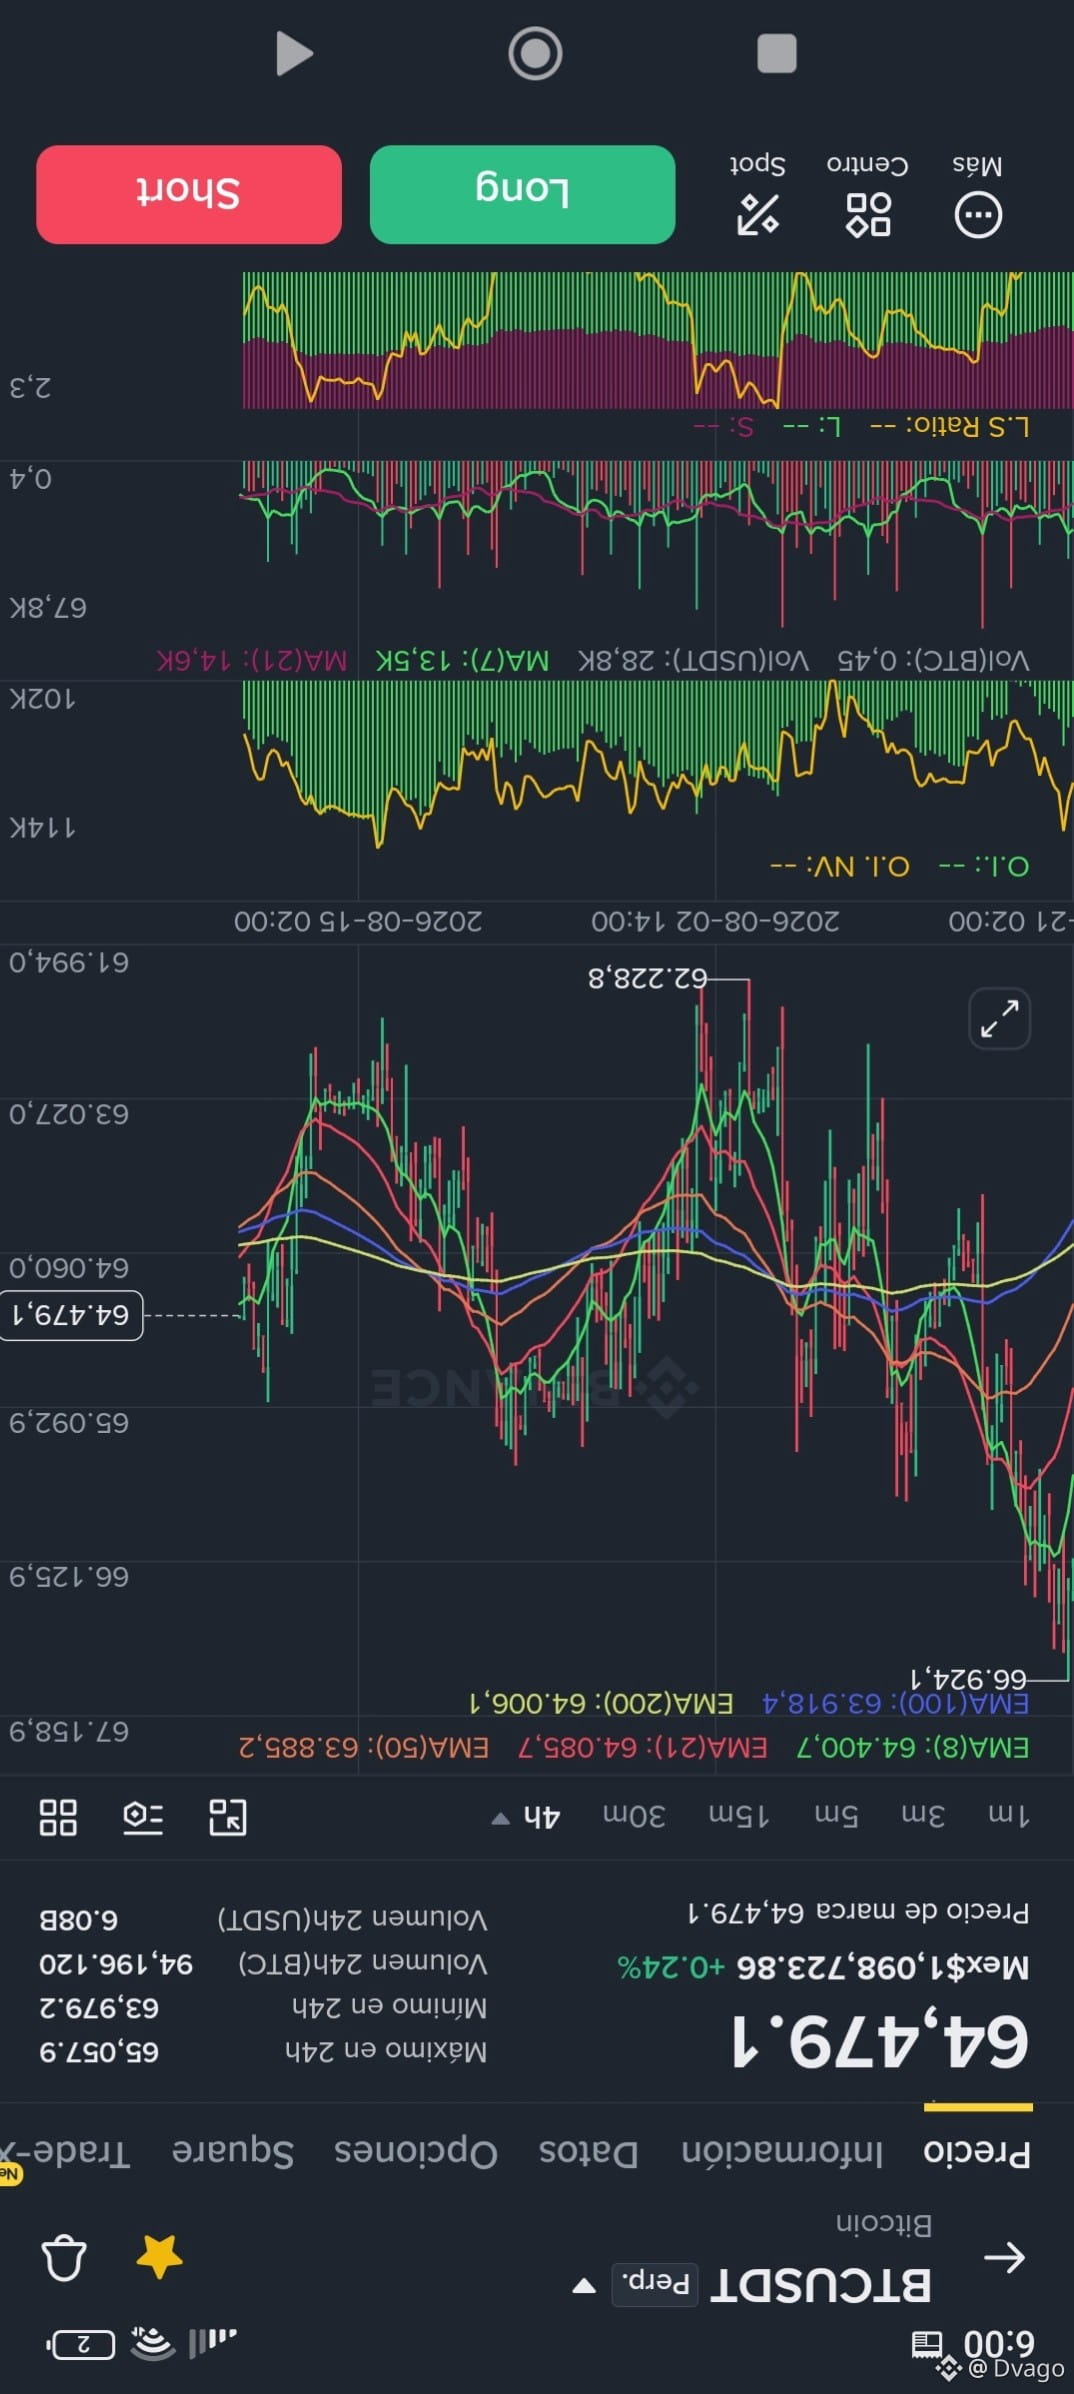
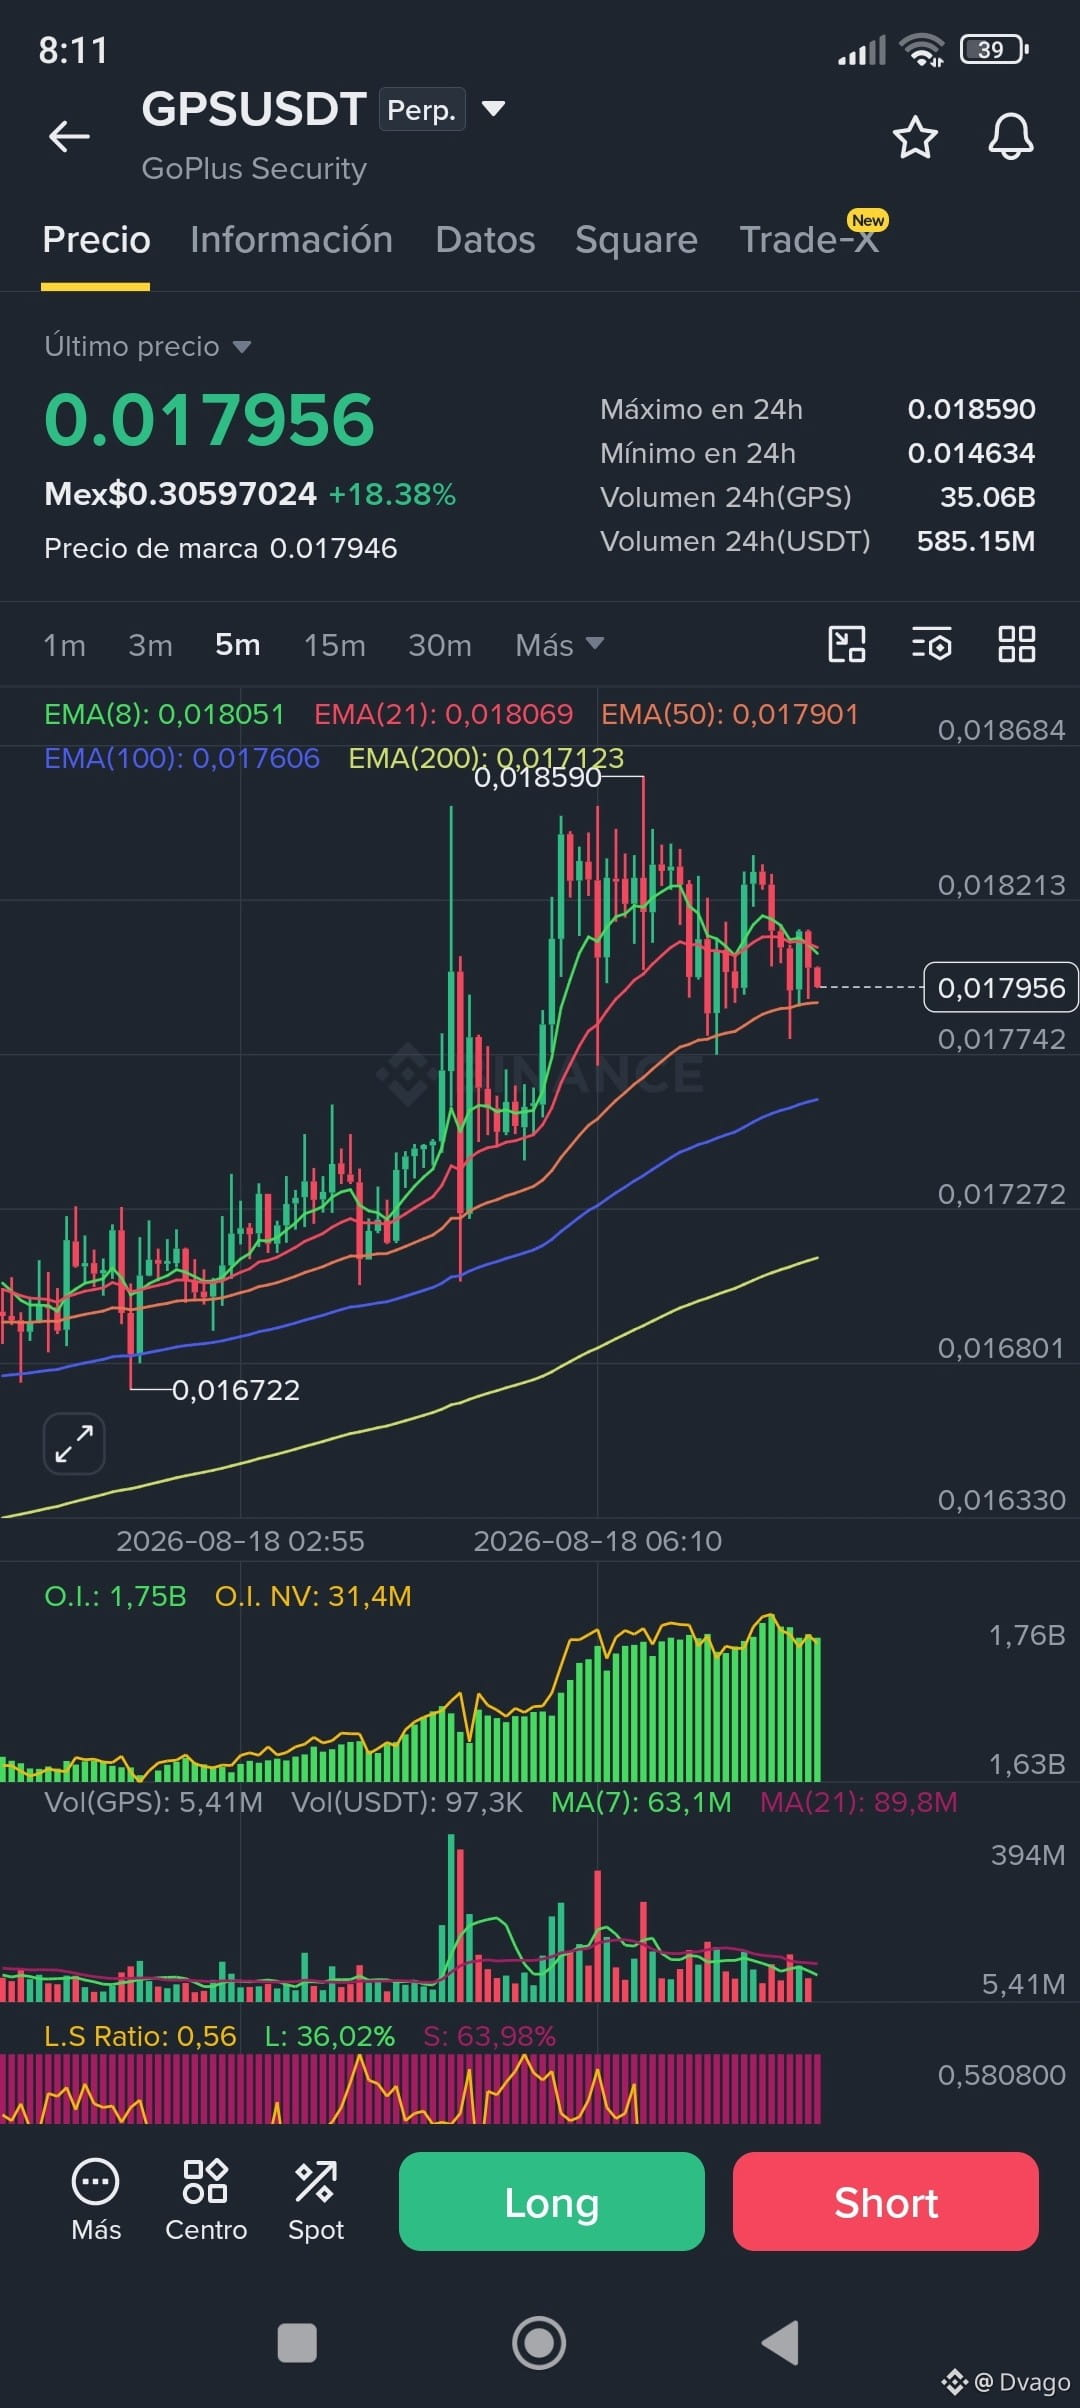
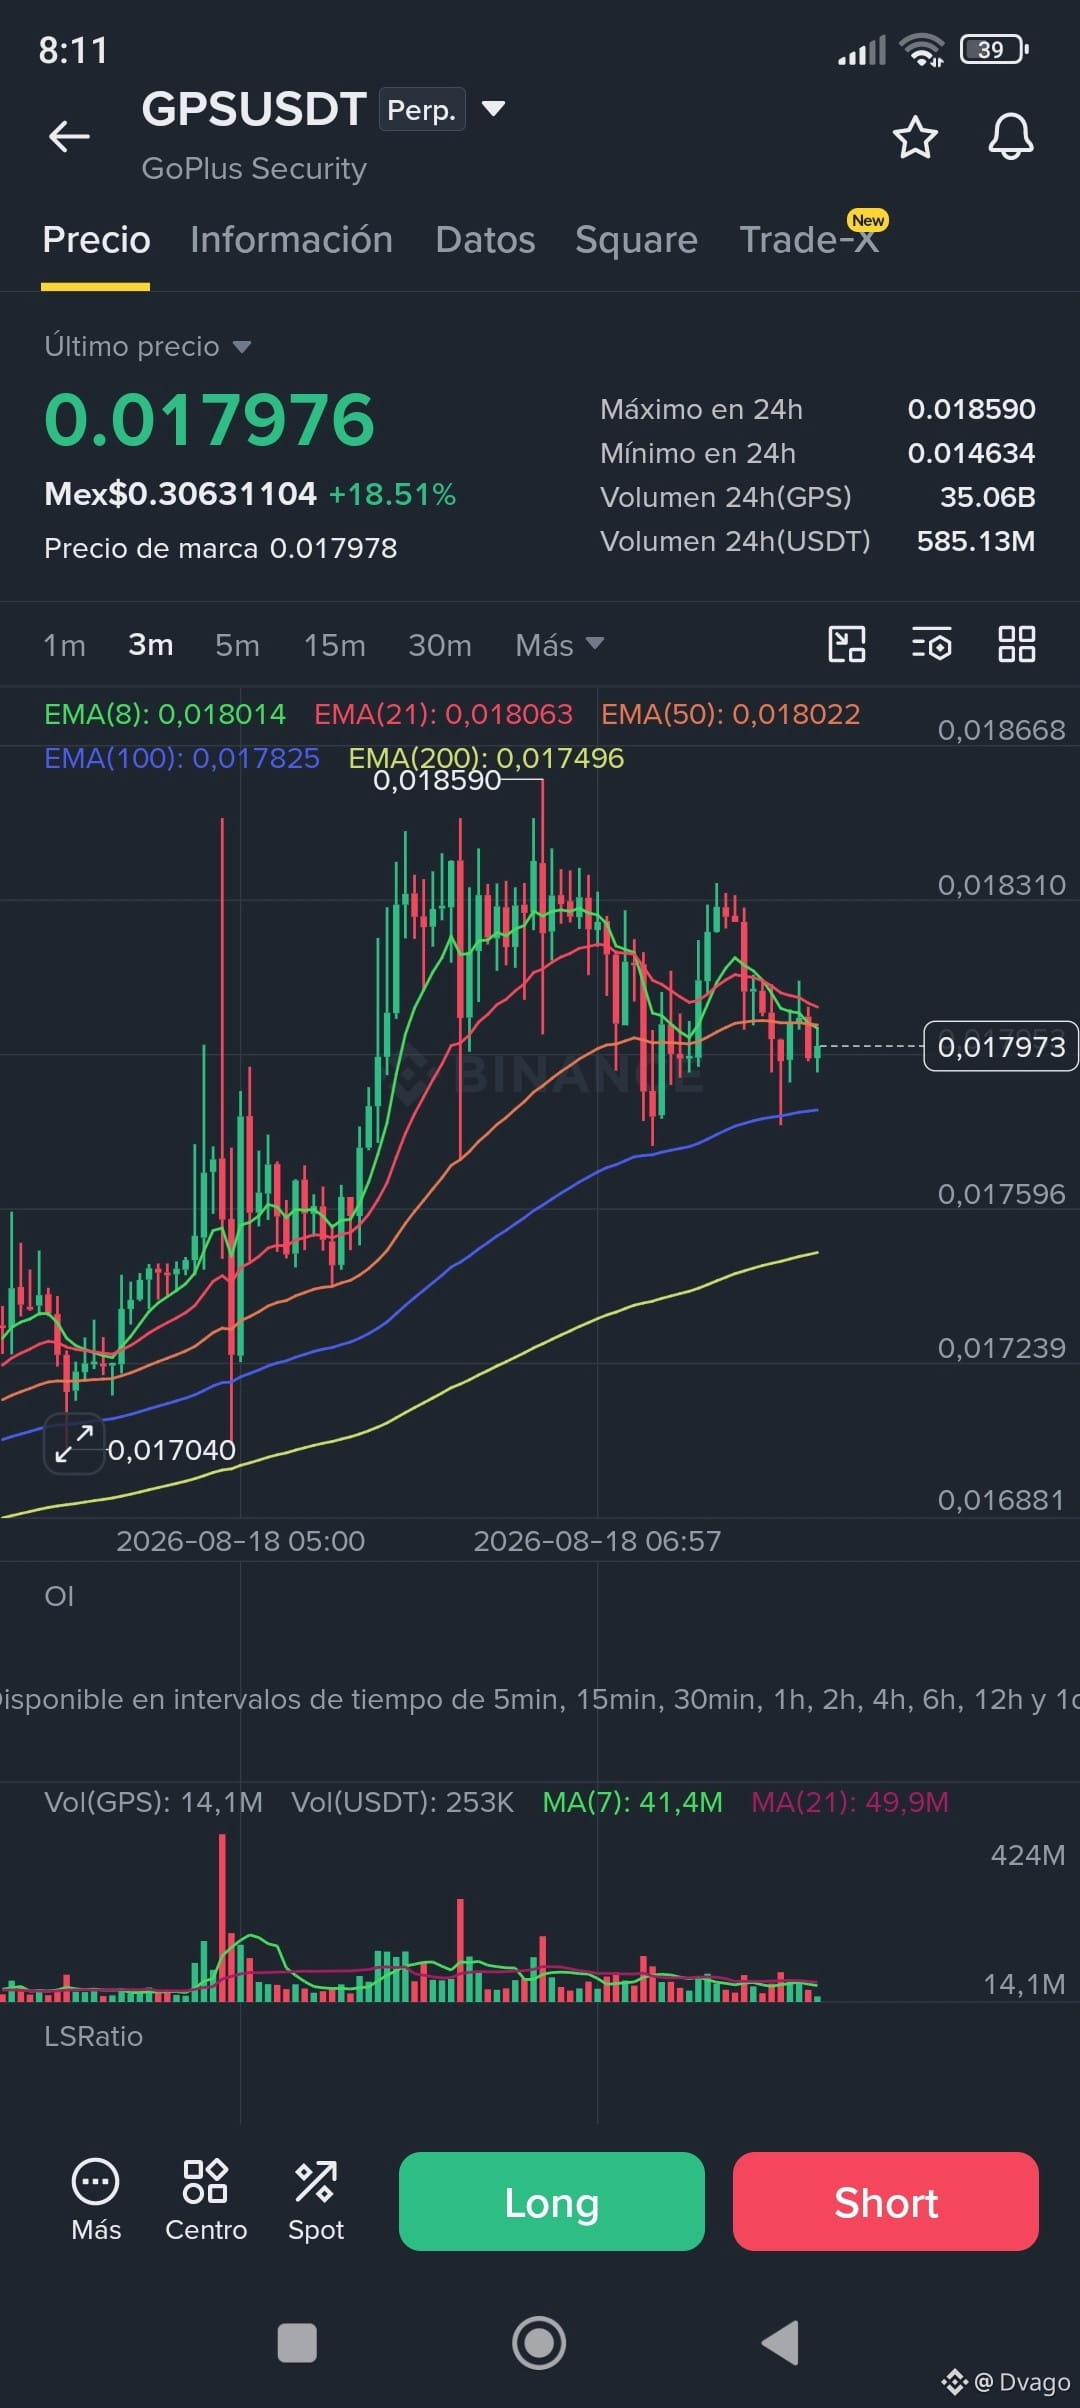
$BTC si when you turn the graph is going up lol
$BTC si when you turn the graph is going up lol
111
·
--
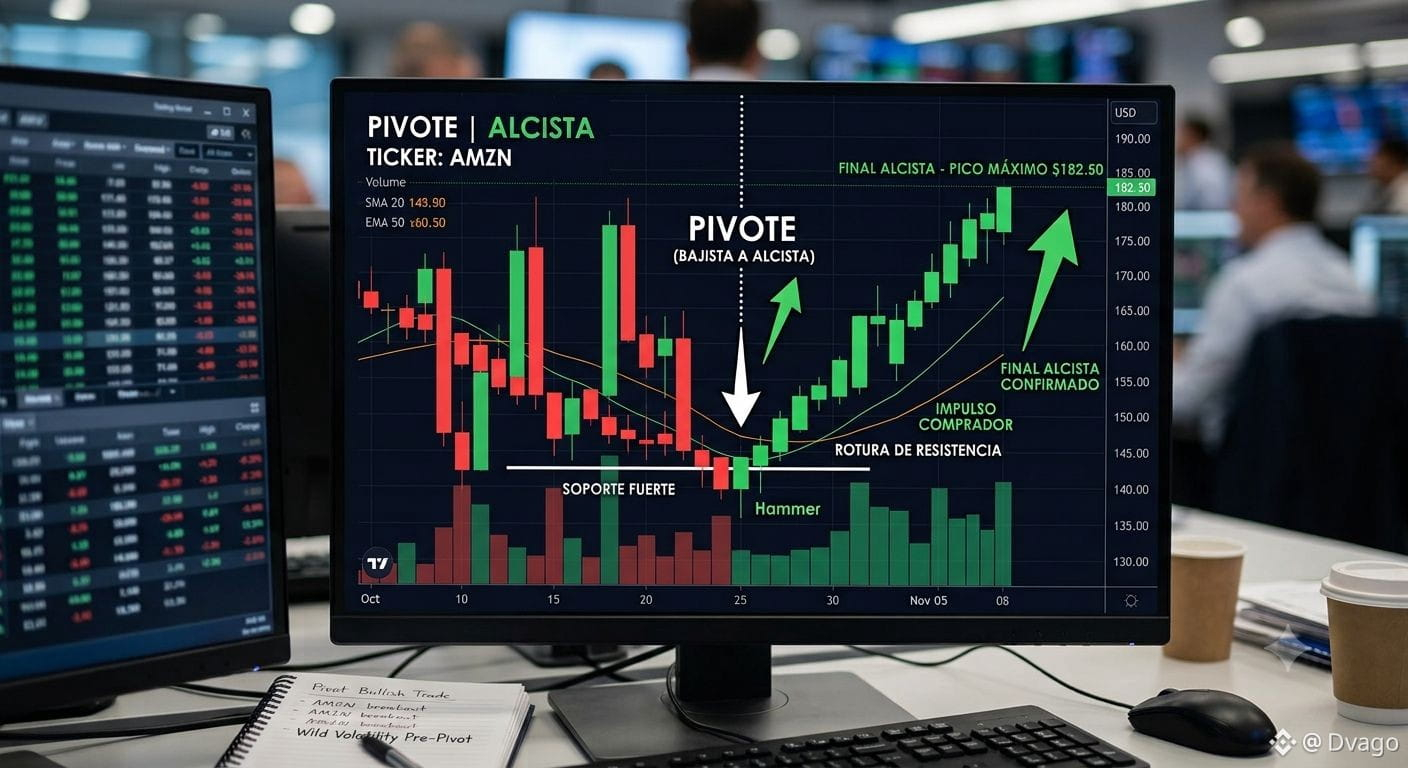
$BTC pay attention to the latest drop but to recover something according to the behavior of the chart
$BTC pay attention to the latest drop but to recover something according to the behavior of the chart
471
·
--
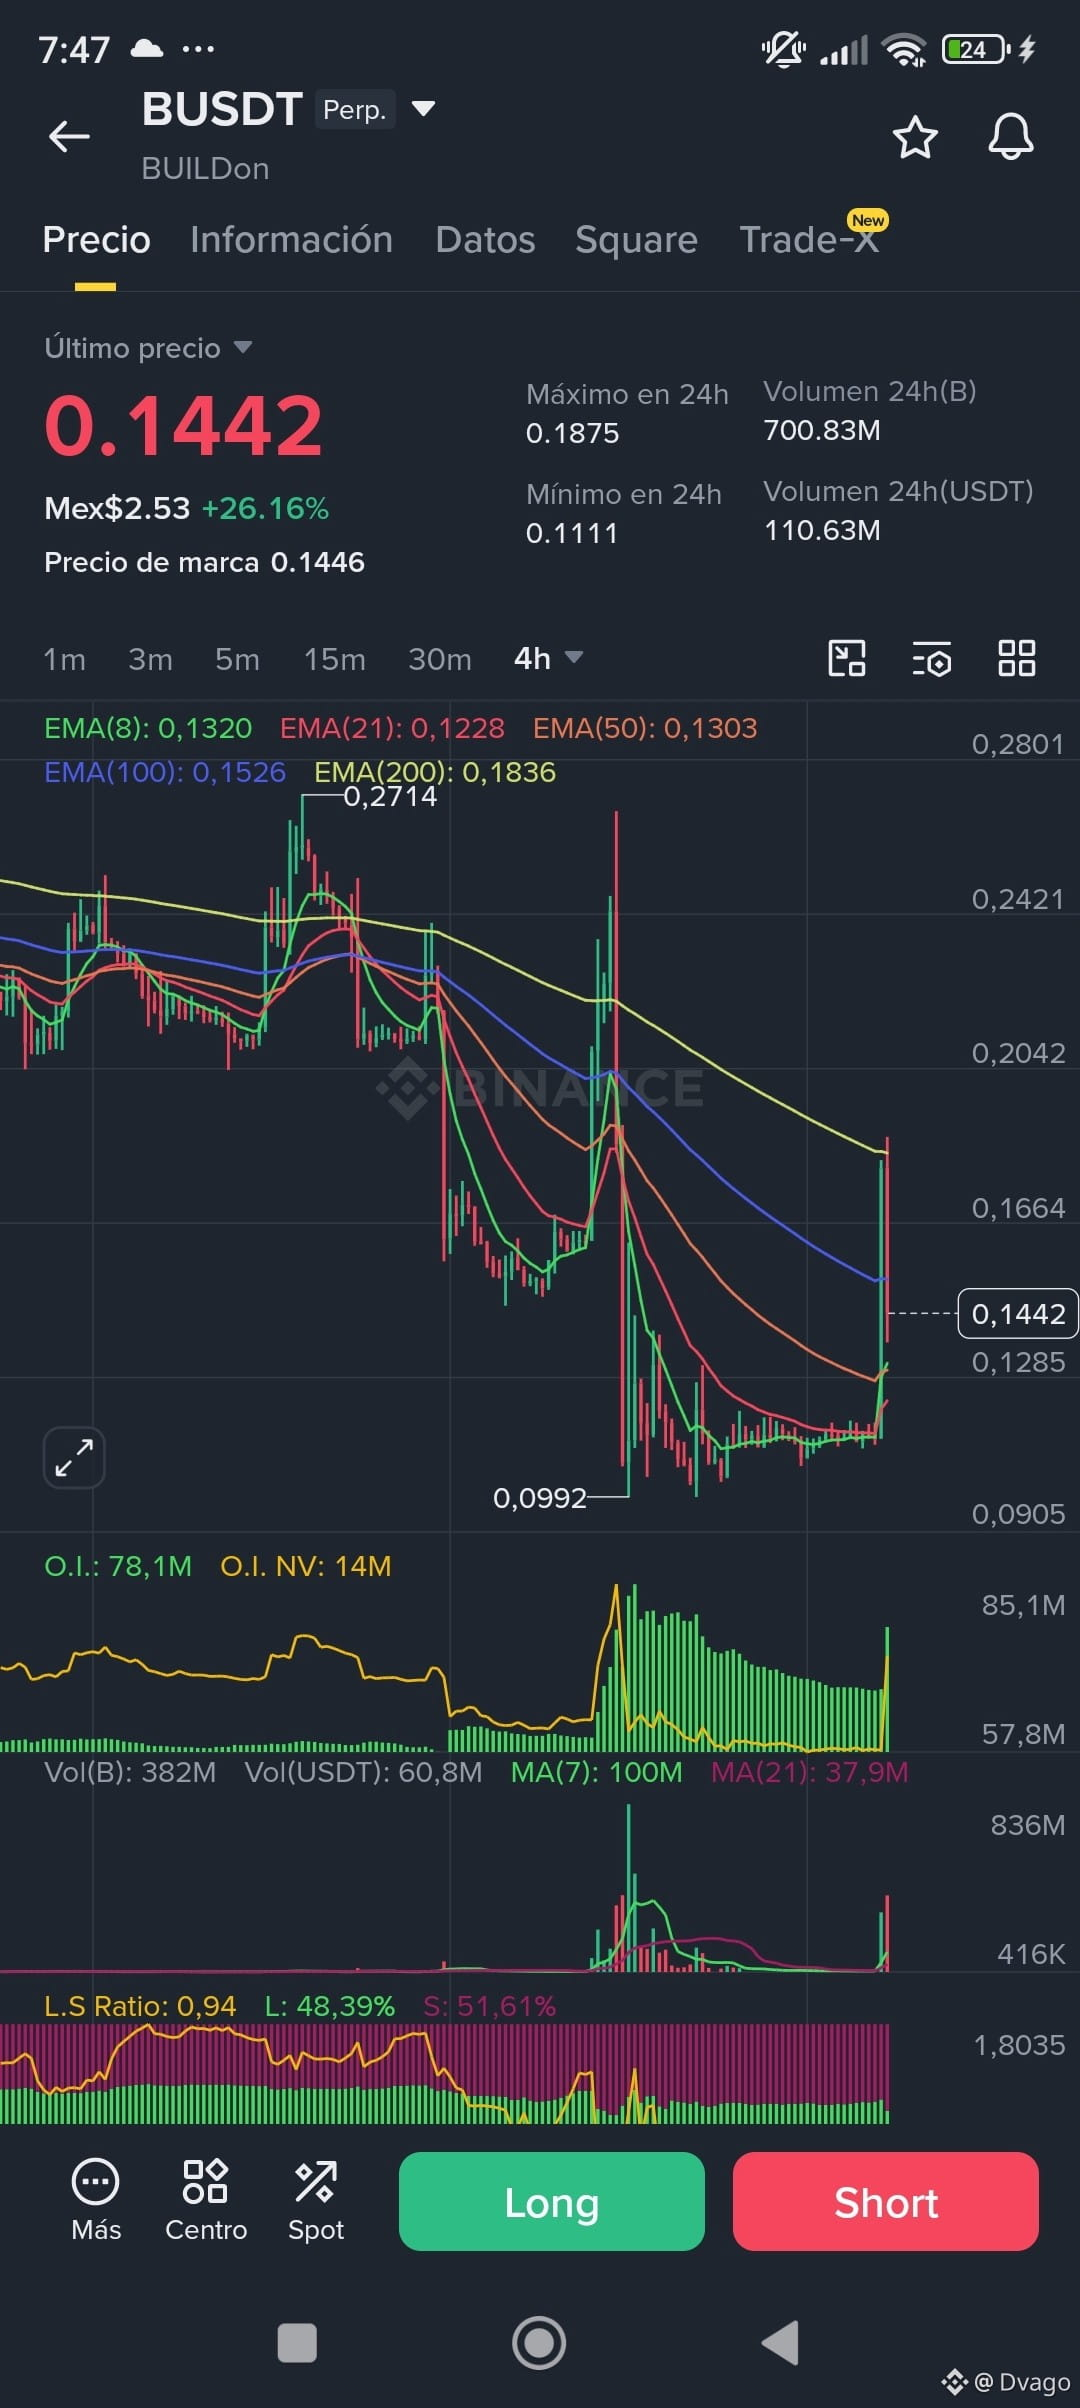
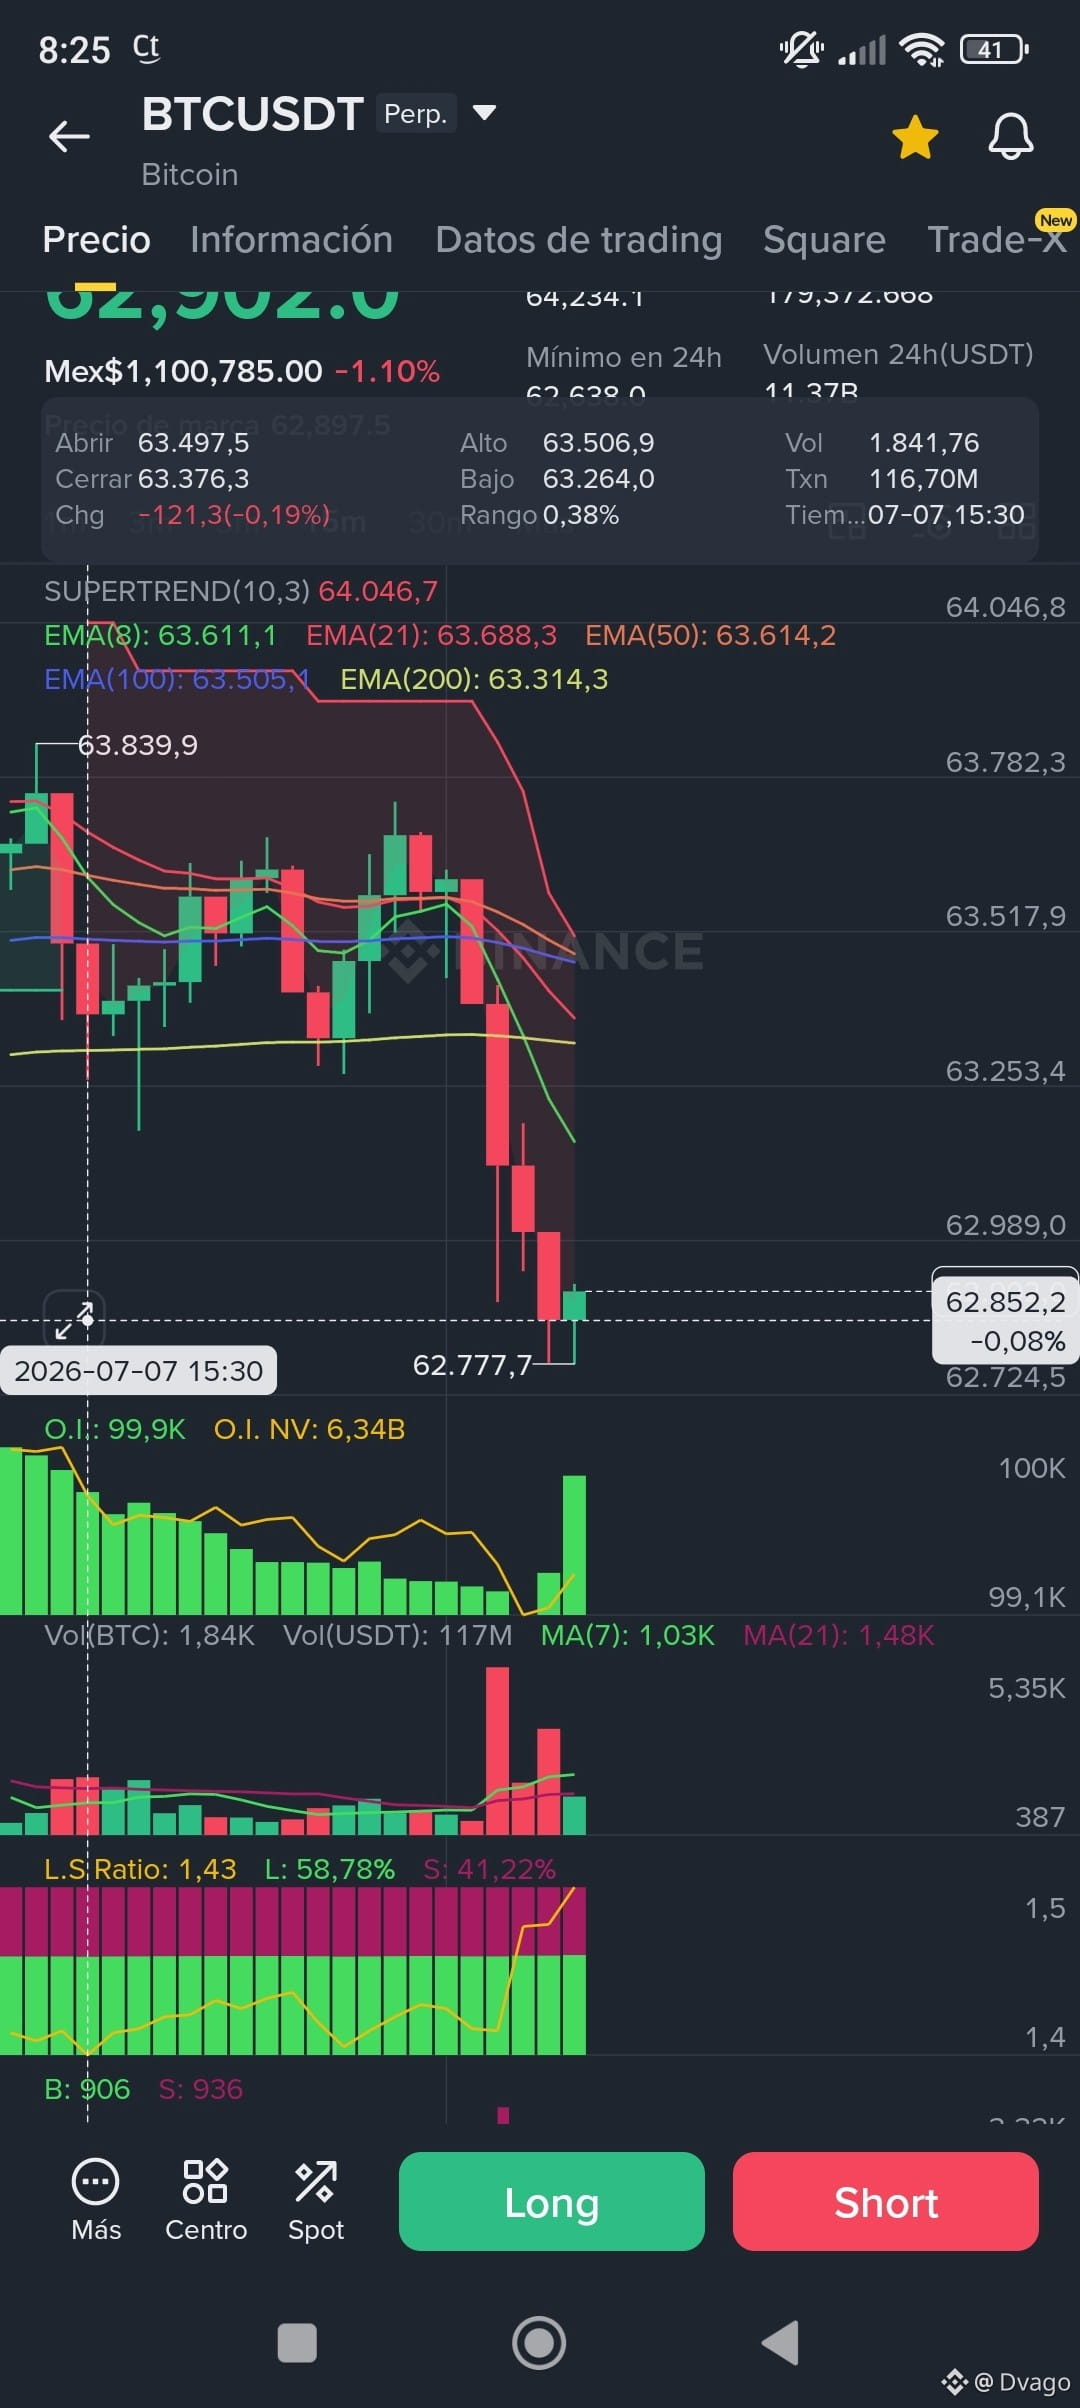
$B its drop behavior is based on volatile needles with minimums more minimums....
$B its drop behavior is based on volatile needles with minimums more minimums....
176
·
--
Bullish
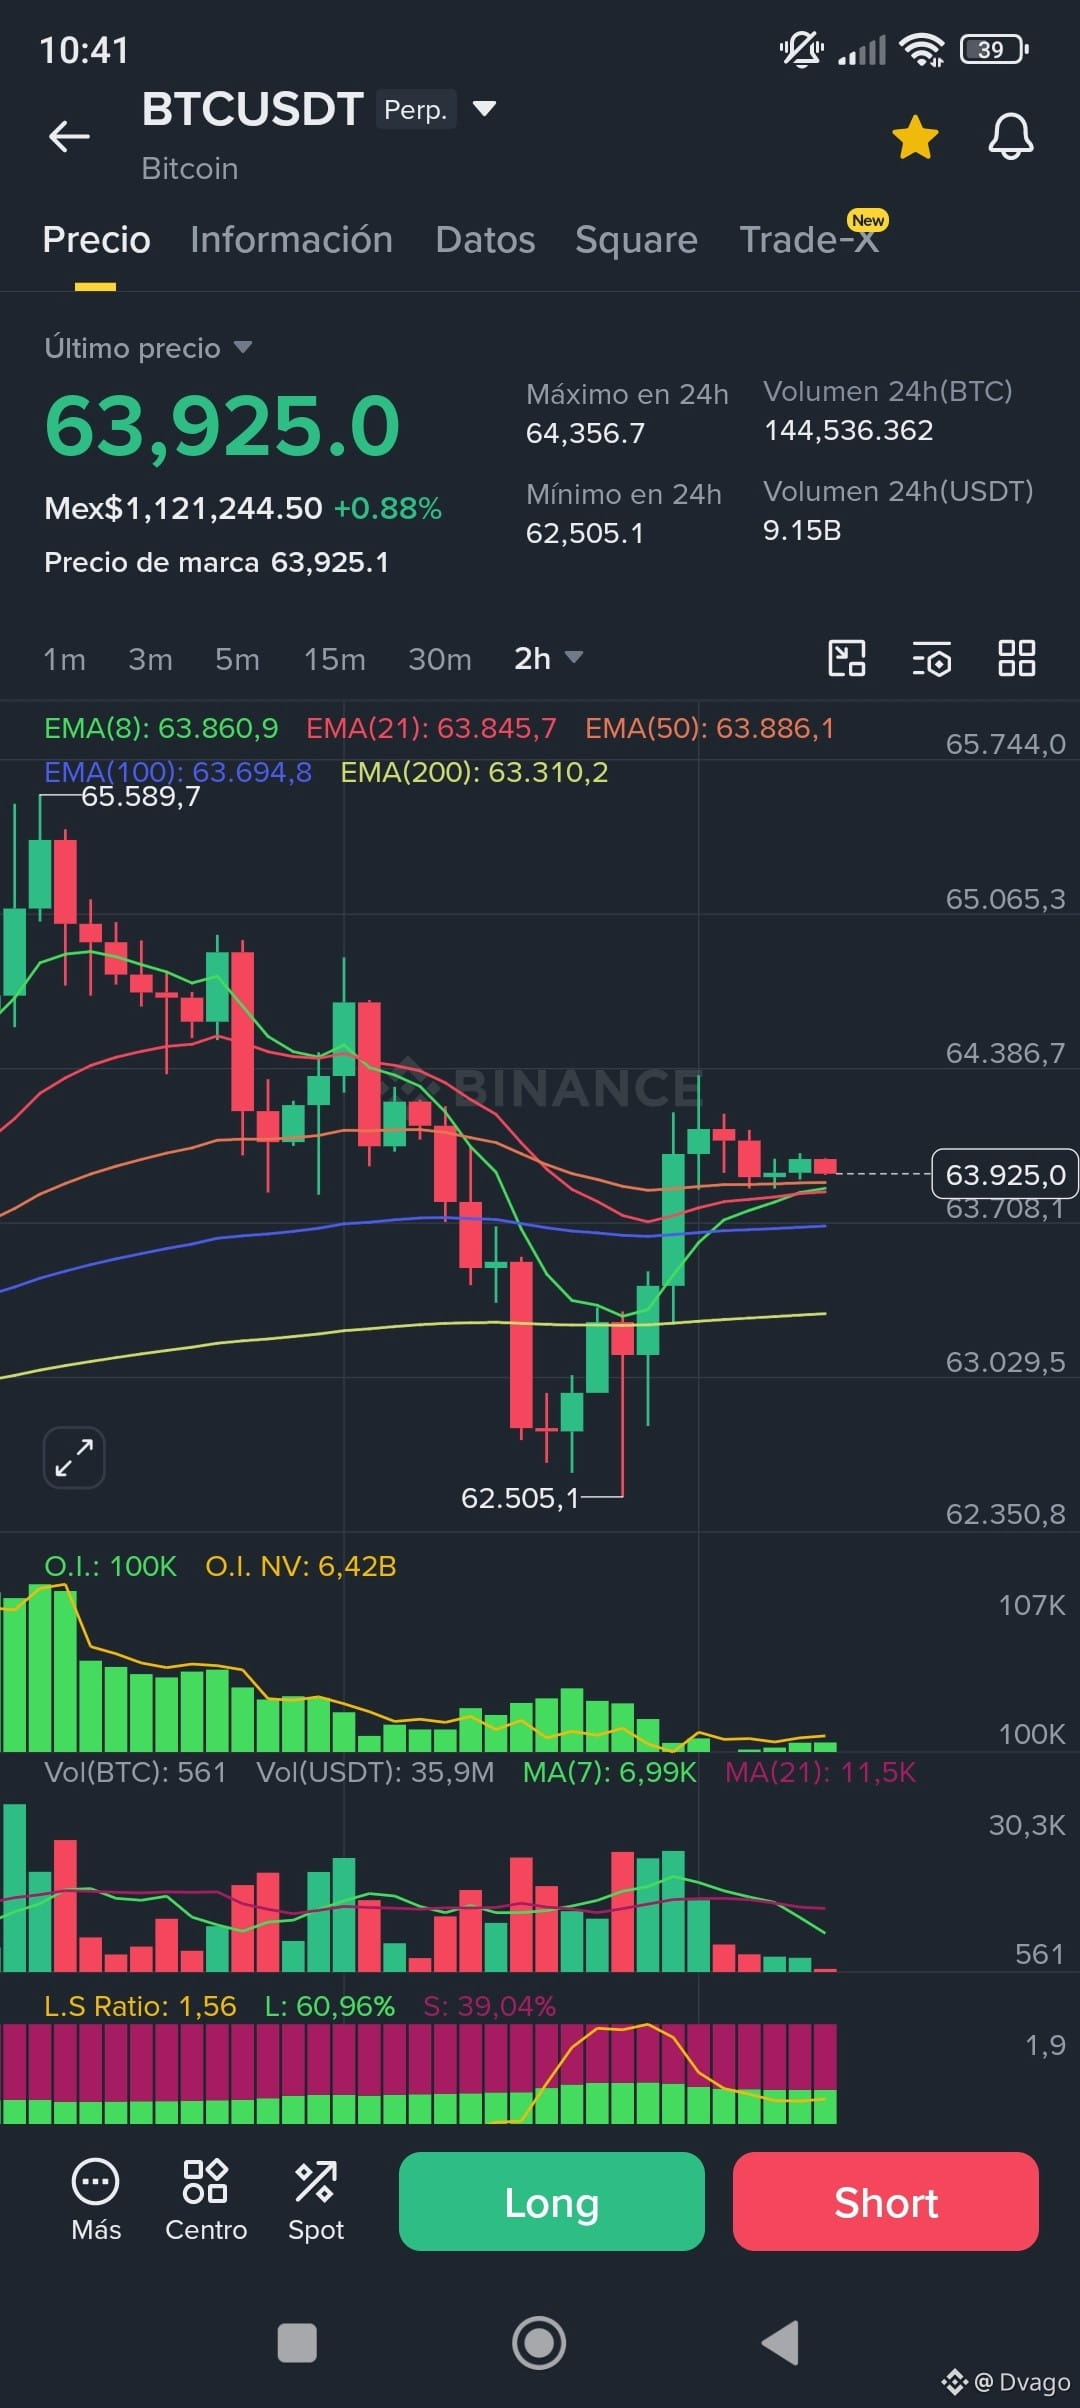
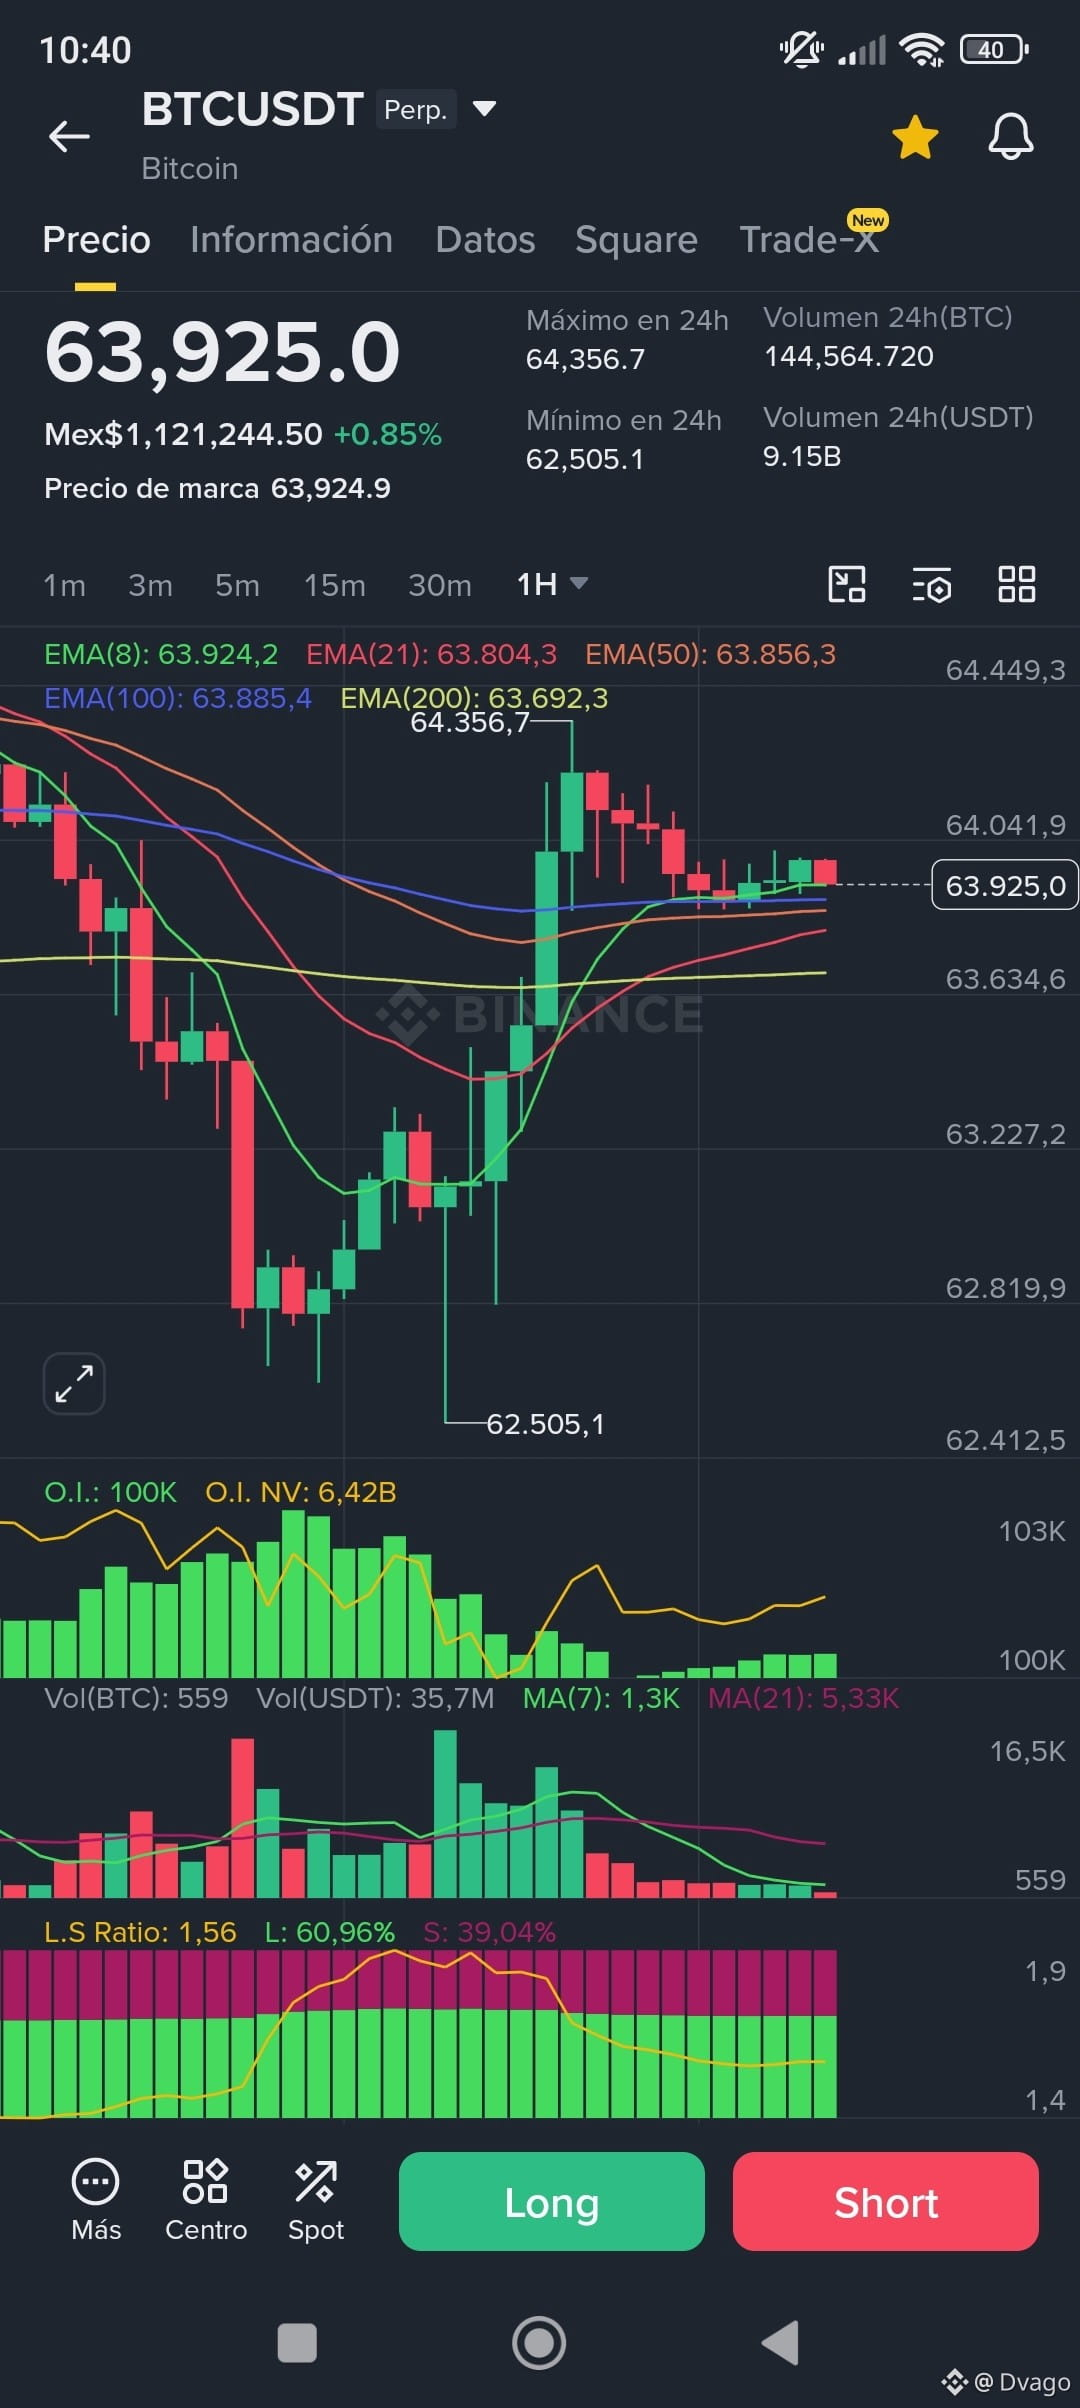
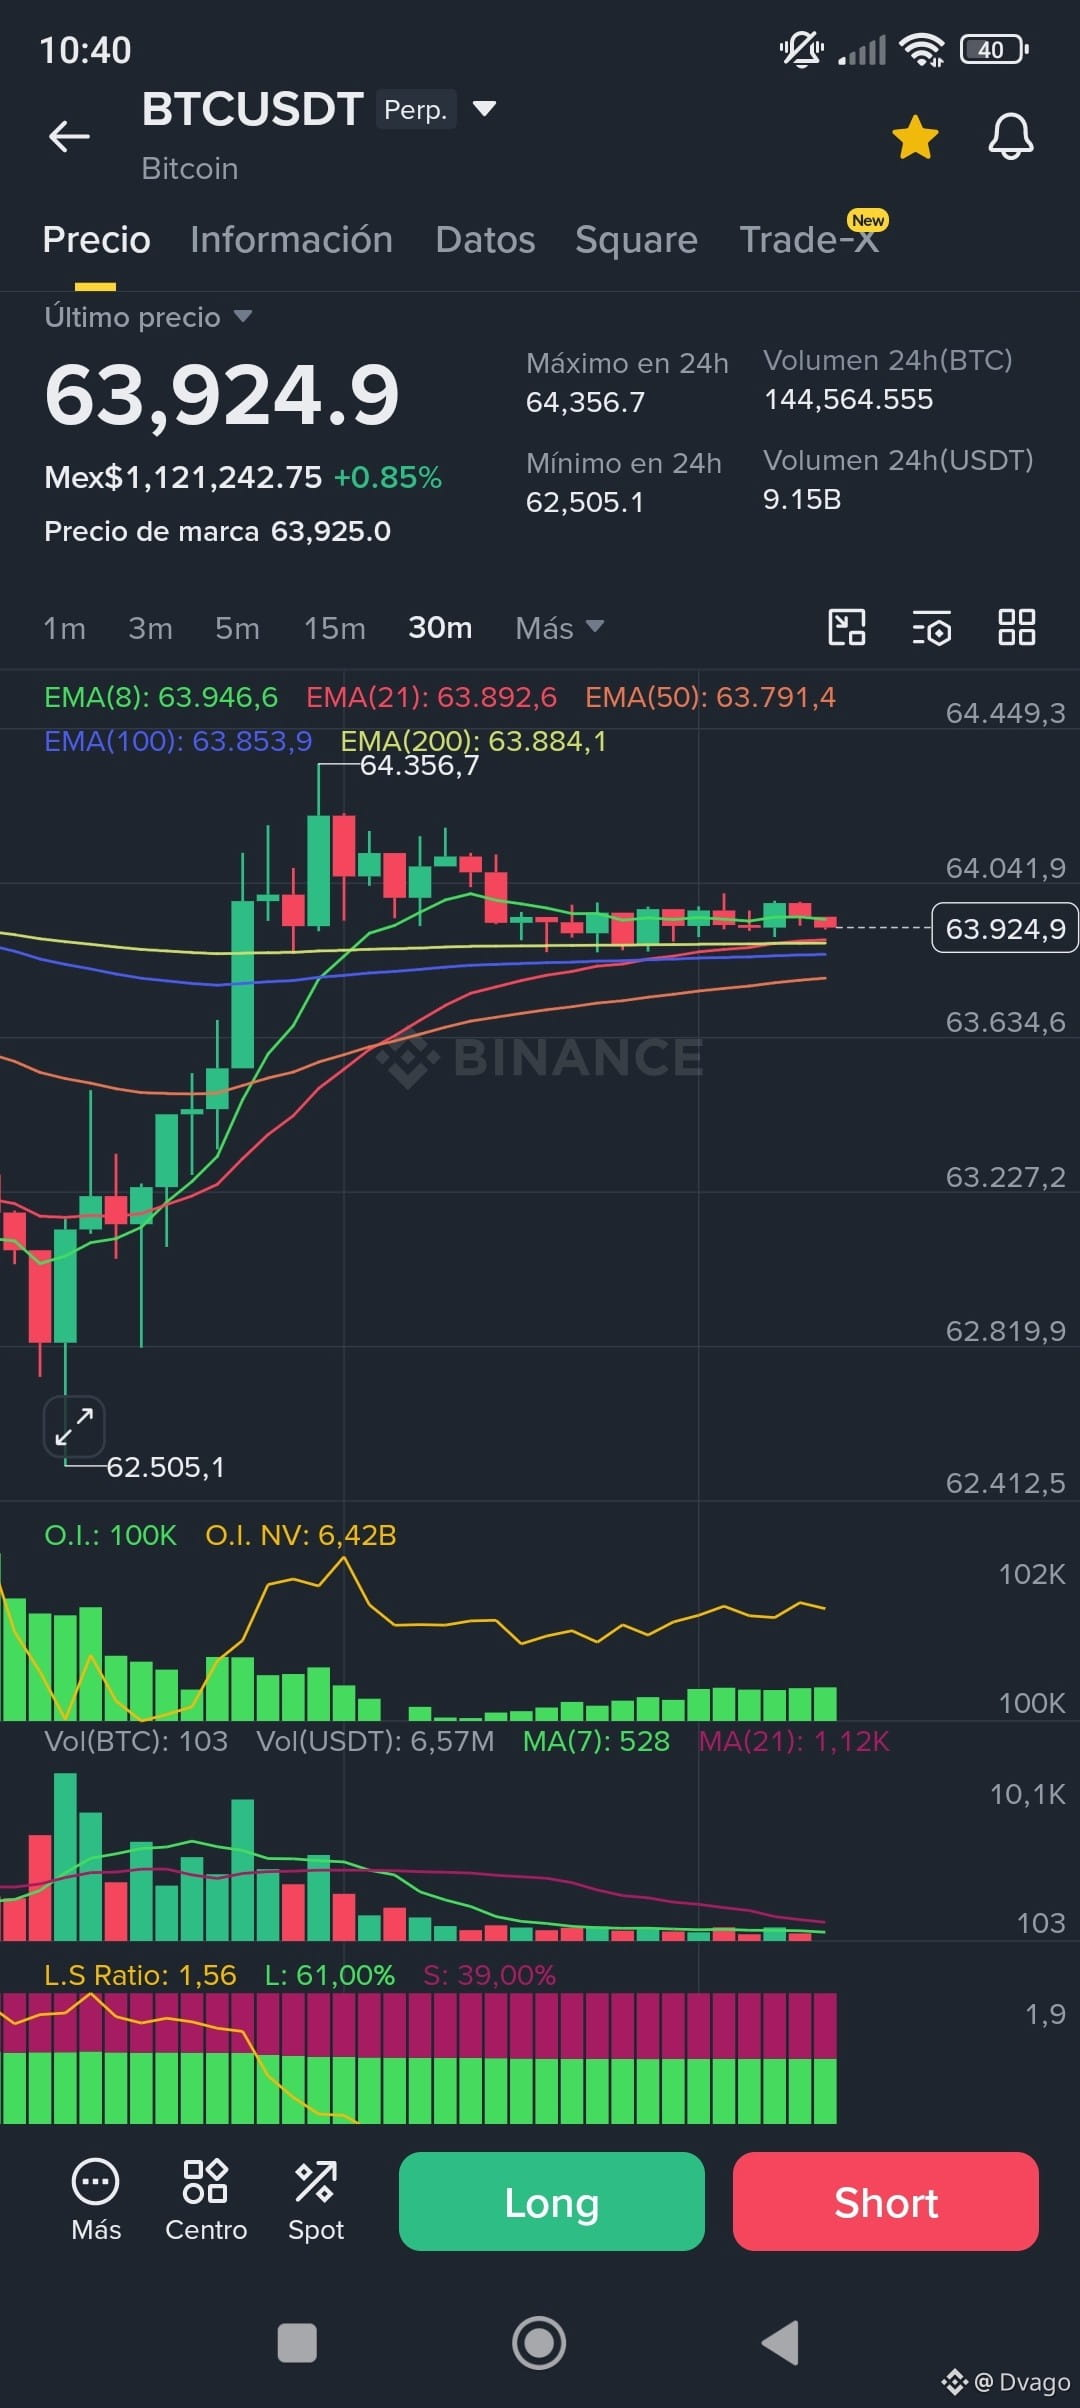
96
·
--
$BTC o are you swallowed by uncertainty or by optimism 😐😐😐😐
$BTC o are you swallowed by uncertainty or by optimism 😐😐😐😐

1.4k
·
--
Bearish
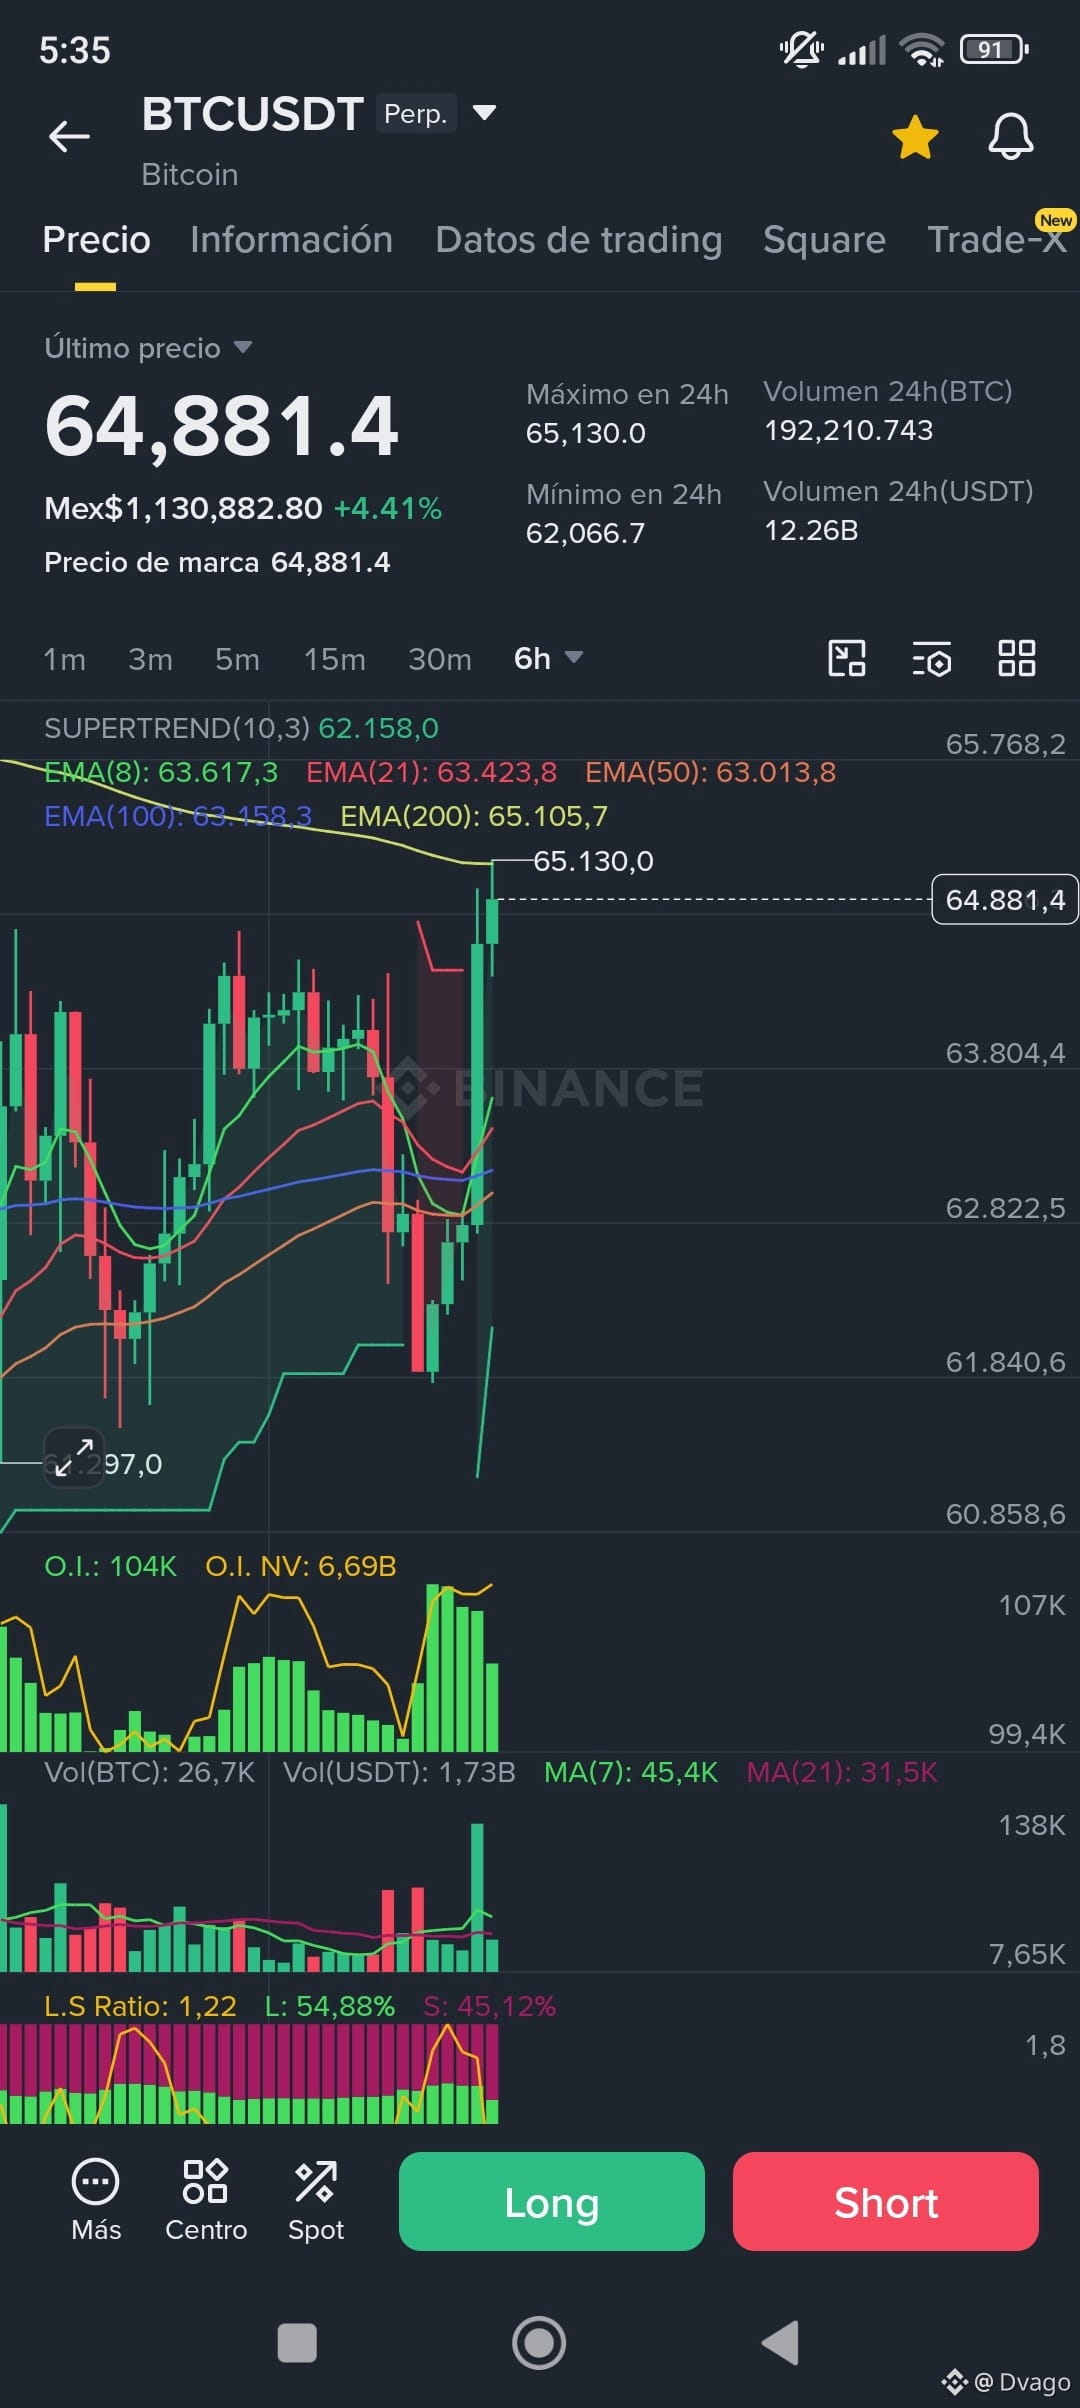
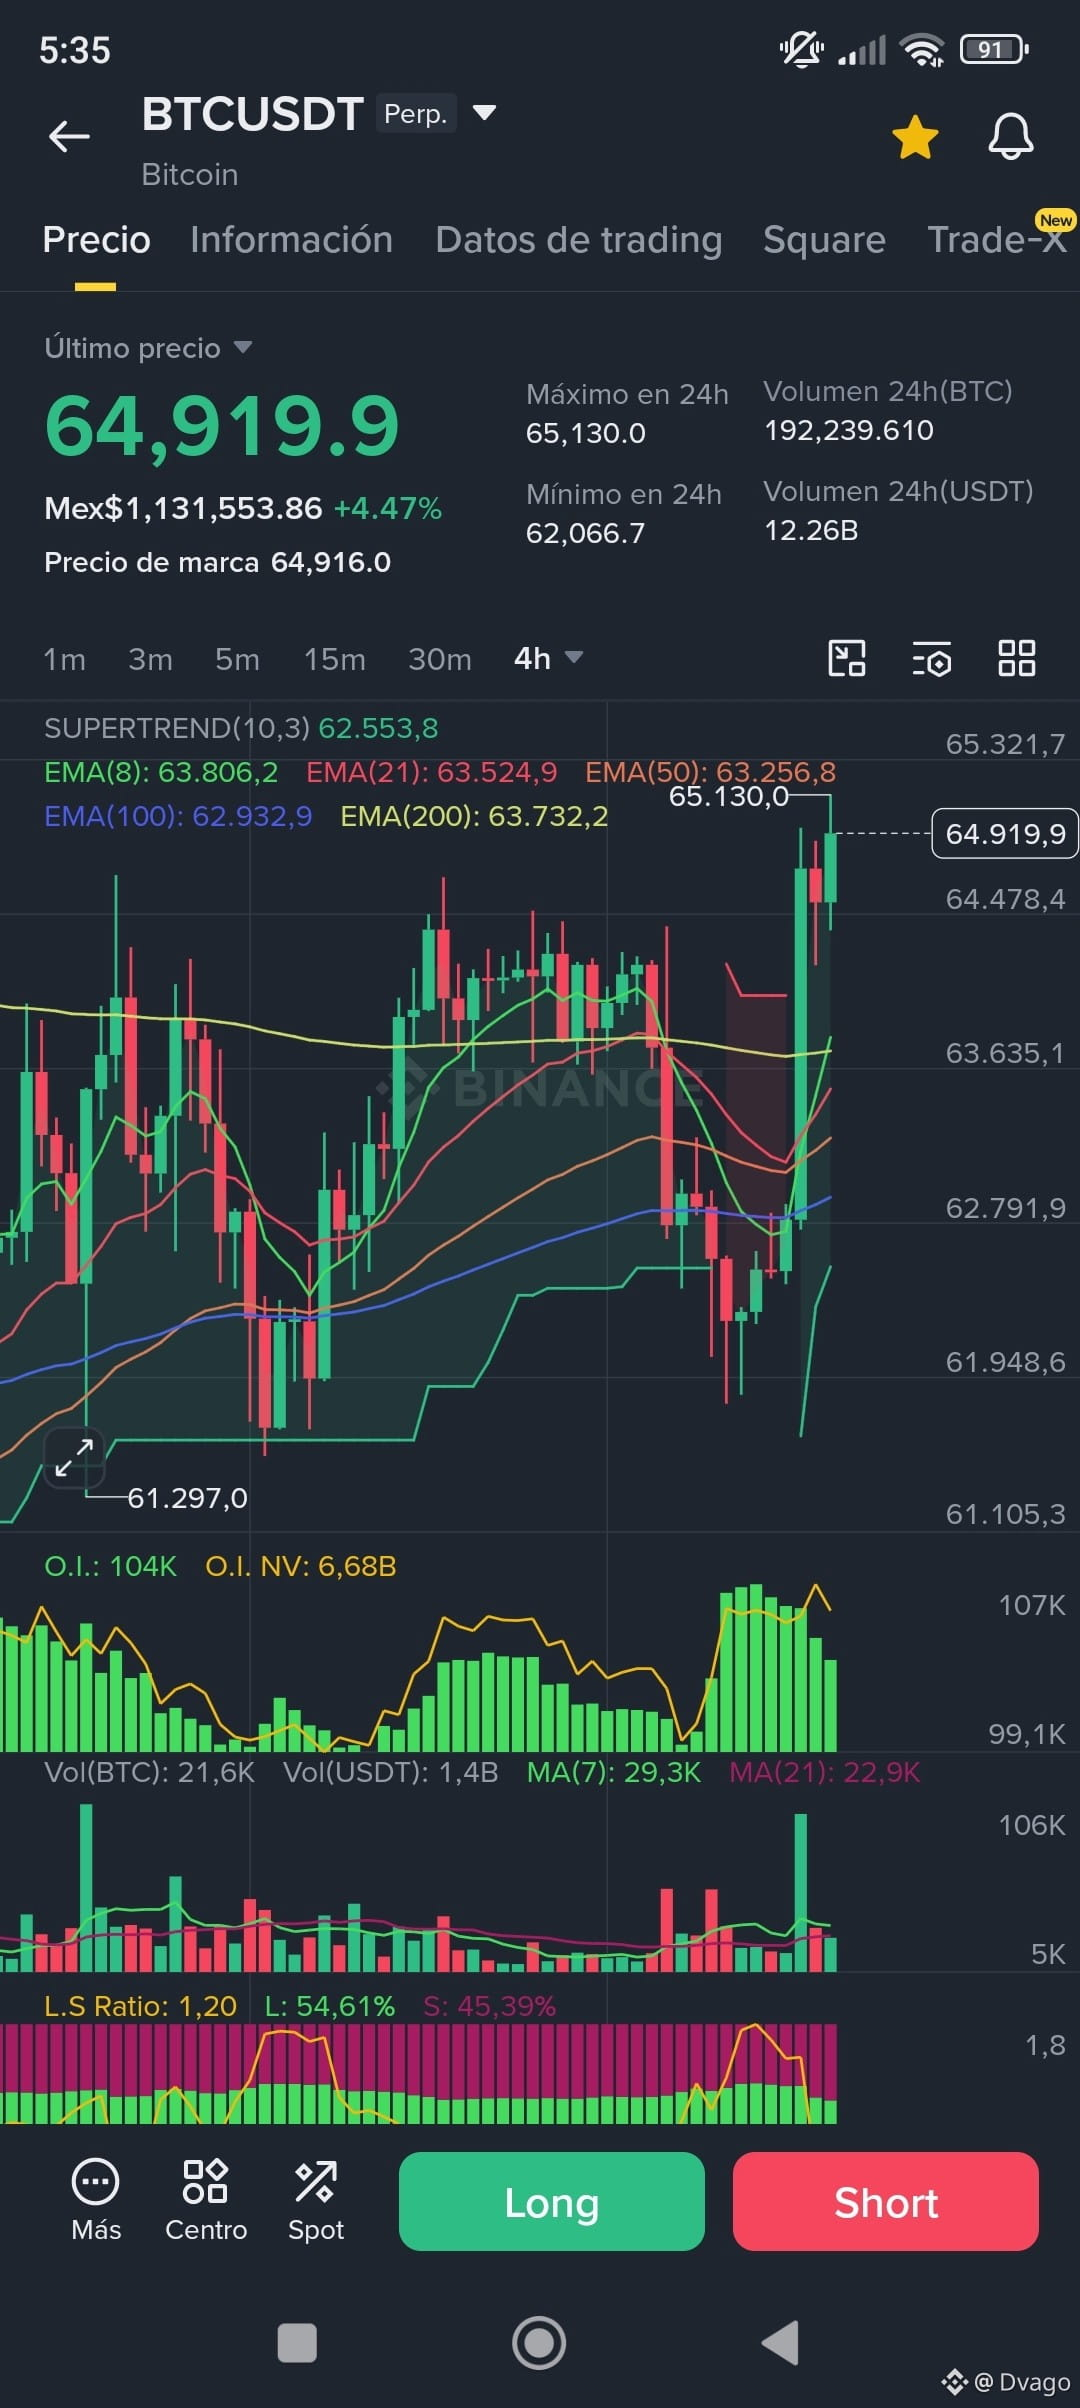
$BTC war news (Iranian attack and cluster bombs, banned weapons in crime) and there is still a way to go for the 6-hour macro push, with an average Mobil of force at 200 of push. Meanwhile, in 4 it reached it, but the pullback is likely. Clear prices???
$BTC war news (Iranian attack and cluster bombs, banned weapons in crime) and there is still a way to go for the 6-hour macro push, with an average Mobil of force at 200 of push. Meanwhile, in 4 it reached it, but the pullback is likely. Clear prices???
437
Log in to explore more content
Join global crypto users on Binance Square
⚡️ Get latest and useful information about crypto.
💬 Trusted by the world’s largest crypto exchange.
👍 Discover real insights from verified creators.
Email / Phone number
Trending Topics
StrategyFaces$2.8BSelloffRiskFromMSCIRemoval
26,229 views
180 Discussing
Could MSCI Removal of Strategy Trigger Up to $2.8 Billion in Selling and Affect Bitcoin?
Binance News
·7 Likes
·10.8k views
ZcashFallsBelow$1000ForFirstTimeSinceSeptember
14,907 views
104 Discussing
AnthropicRejectsIPODelayValuationinQuestion
388,348 views
3,327 Discussing