
Mr001_
33 Posts

Mr001_
Report
Block User
Crypto Market Analyst
Reading charts. Studying trends.
Letting data speak.
1 Following
3 Followers
33 Liked
Posts
·
--
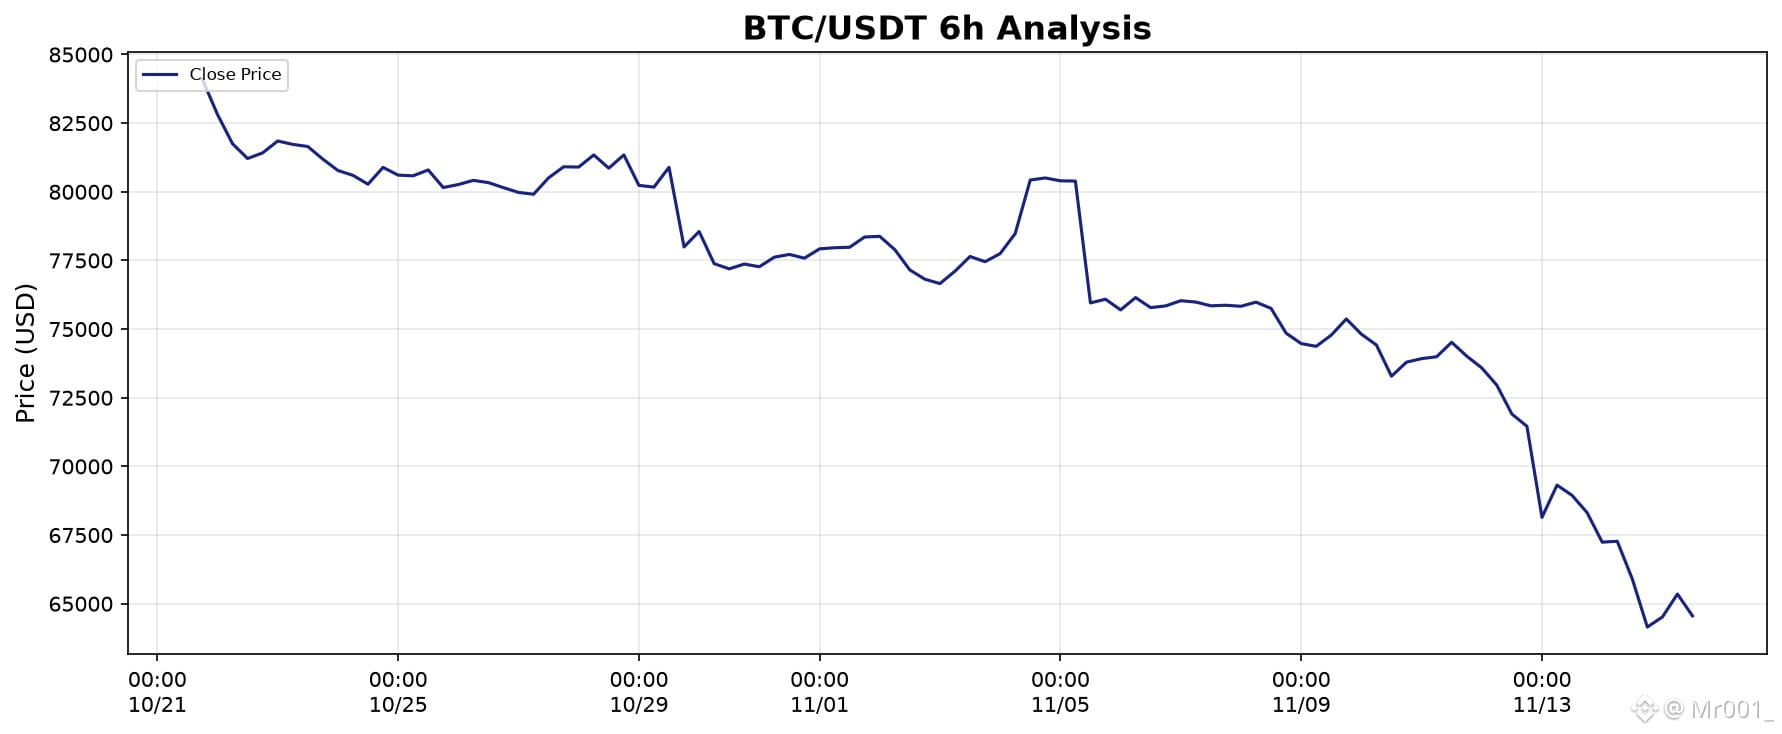
$BTC Short Analysis.
Current Price: $64,556.22
24h Change: -2.04%
RSI(Average of 6 hours): 23.97
Trend: Downtrend
Bias: Bearish
Resistance: $66,132.01
Support: $62,006.00
Critical Support: $64,556.22
Advice for traders/investors:
Wait for a bullish reversal signal before entering buy. Price holding above $64,556.22 signals recovery. Take profits near resistance. Only risk capital you can afford to lose.
$BTC
#Crypto #Trading #BTC #analysis
$BTC Short Analysis.
Current Price: $64,556.22
24h Change: -2.04%
RSI(Average of 6 hours): 23.97
Trend: Downtrend
Bias: Bearish
Resistance: $66,132.01
Support: $62,006.00
Critical Support: $64,556.22
Advice for traders/investors:
Wait for a bullish reversal signal before entering buy. Price holding above $64,556.22 signals recovery. Take profits near resistance. Only risk capital you can afford to lose.
$BTC
#Crypto #Trading #BTC #analysis
Current Price: $64,556.22
24h Change: -2.04%
RSI(Average of 6 hours): 23.97
Trend: Downtrend
Bias: Bearish
Resistance: $66,132.01
Support: $62,006.00
Critical Support: $64,556.22
Advice for traders/investors:
Wait for a bullish reversal signal before entering buy. Price holding above $64,556.22 signals recovery. Take profits near resistance. Only risk capital you can afford to lose.
$BTC
#Crypto #Trading #BTC #analysis
34
·
--
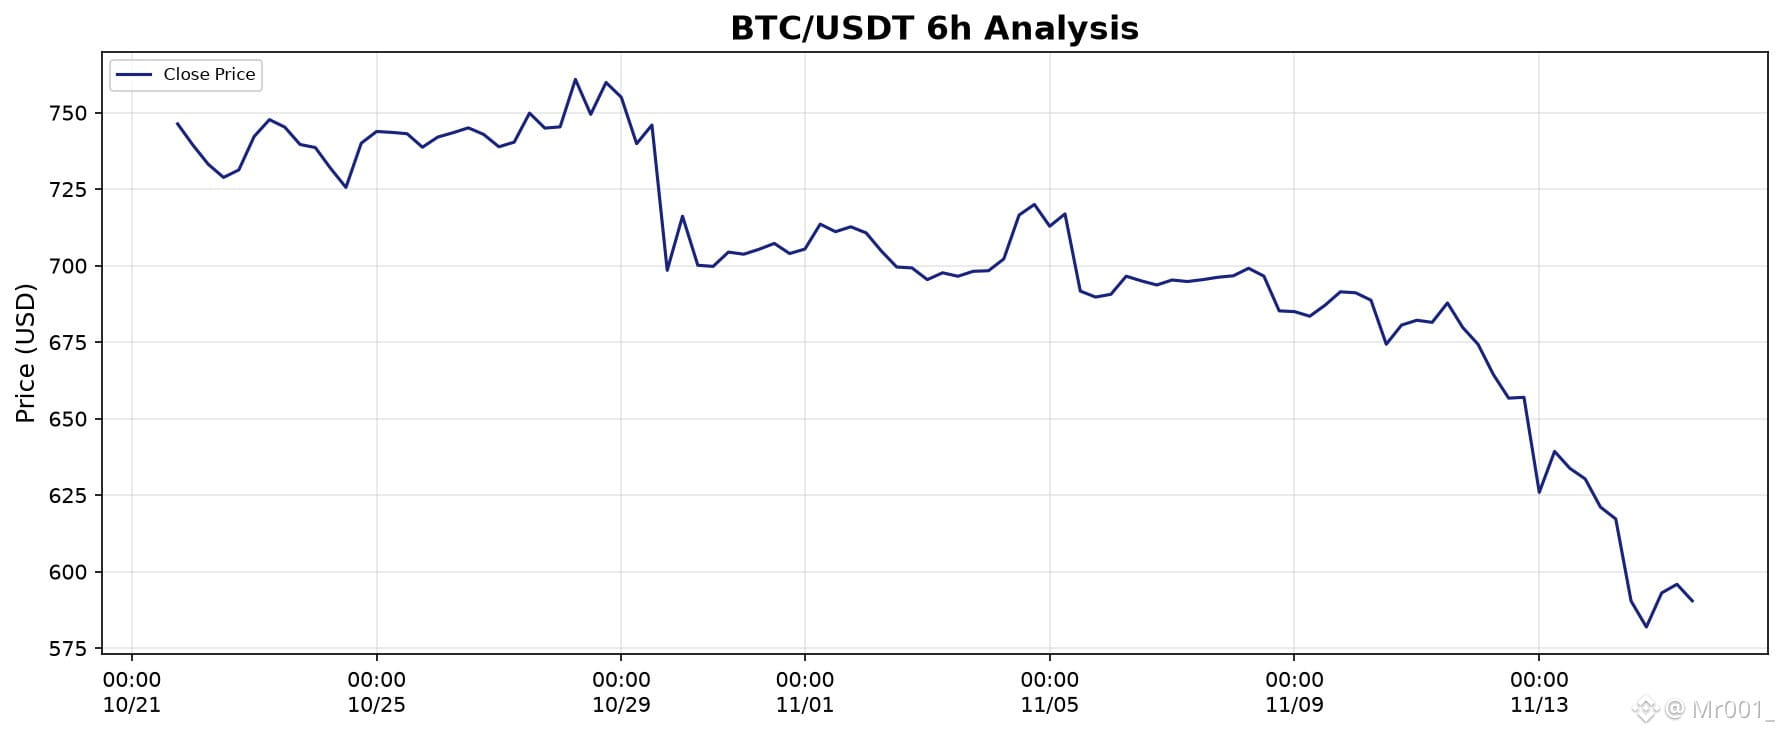
$BNB Short Analysis.
Current Price: $590.46
24h Change: +0.01%
RSI(Average of 6 hours): 25.92
Trend: Downtrend
Bias: Bearish
Resistance: $599.72
Support: $566.00
Critical Support: $590.46
Advice for traders/investors:
Wait for a bullish reversal signal before entering buy. Price holding above $590.46 signals recovery. Take profits near resistance. Only risk capital you can afford to lose.
$BNB
#Crypto #Trading #BNB #analysis
$BNB Short Analysis.
Current Price: $590.46
24h Change: +0.01%
RSI(Average of 6 hours): 25.92
Trend: Downtrend
Bias: Bearish
Resistance: $599.72
Support: $566.00
Critical Support: $590.46
Advice for traders/investors:
Wait for a bullish reversal signal before entering buy. Price holding above $590.46 signals recovery. Take profits near resistance. Only risk capital you can afford to lose.
$BNB
#Crypto #Trading #BNB #analysis
Current Price: $590.46
24h Change: +0.01%
RSI(Average of 6 hours): 25.92
Trend: Downtrend
Bias: Bearish
Resistance: $599.72
Support: $566.00
Critical Support: $590.46
Advice for traders/investors:
Wait for a bullish reversal signal before entering buy. Price holding above $590.46 signals recovery. Take profits near resistance. Only risk capital you can afford to lose.
$BNB
#Crypto #Trading #BNB #analysis
31
·
--
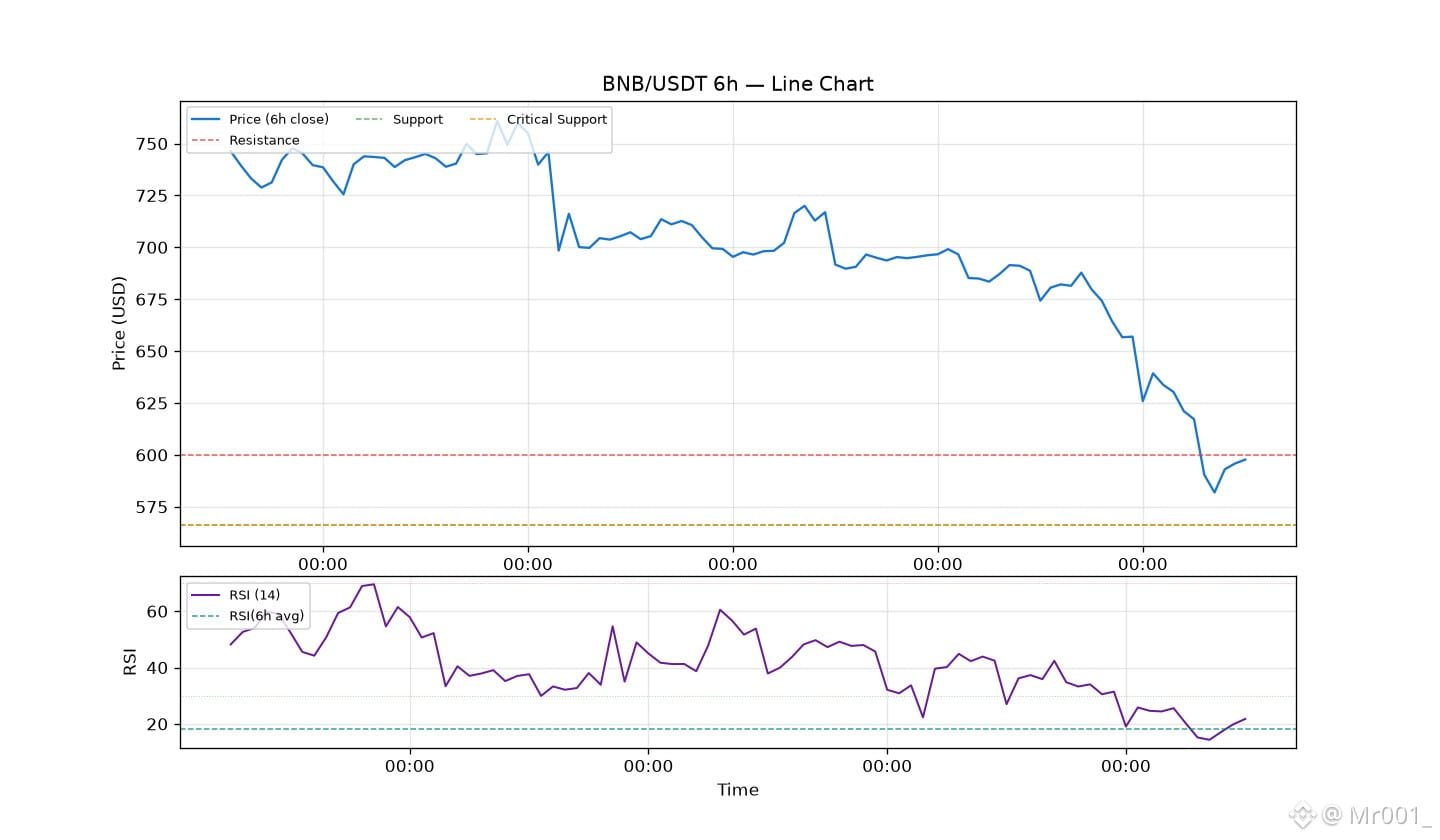
$BNB Short Analysis.
Current Price: $597.73
24h Change: +1.24%
RSI(Average of 6 hours): 18.10
Trend: Downtrend
Bias: Bearish
Resistance: $599.72
Support: $566.00
Critical Support: $566.00
Advice for traders/investors:
Wait for a bullish reversal signal before entering buy. Price holding above $566.00 signals recovery. Take profits near resistance. Only risk capital you can afford to lose.
#Crypto #Trading #BNB #analysis
#viralpost
$BNB Short Analysis.
Current Price: $597.73
24h Change: +1.24%
RSI(Average of 6 hours): 18.10
Trend: Downtrend
Bias: Bearish
Resistance: $599.72
Support: $566.00
Critical Support: $566.00
Advice for traders/investors:
Wait for a bullish reversal signal before entering buy. Price holding above $566.00 signals recovery. Take profits near resistance. Only risk capital you can afford to lose.
#Crypto #Trading #BNB #analysis
#viralpost
Current Price: $597.73
24h Change: +1.24%
RSI(Average of 6 hours): 18.10
Trend: Downtrend
Bias: Bearish
Resistance: $599.72
Support: $566.00
Critical Support: $566.00
Advice for traders/investors:
Wait for a bullish reversal signal before entering buy. Price holding above $566.00 signals recovery. Take profits near resistance. Only risk capital you can afford to lose.
#Crypto #Trading #BNB #analysis
#viralpost
1
57
·
--
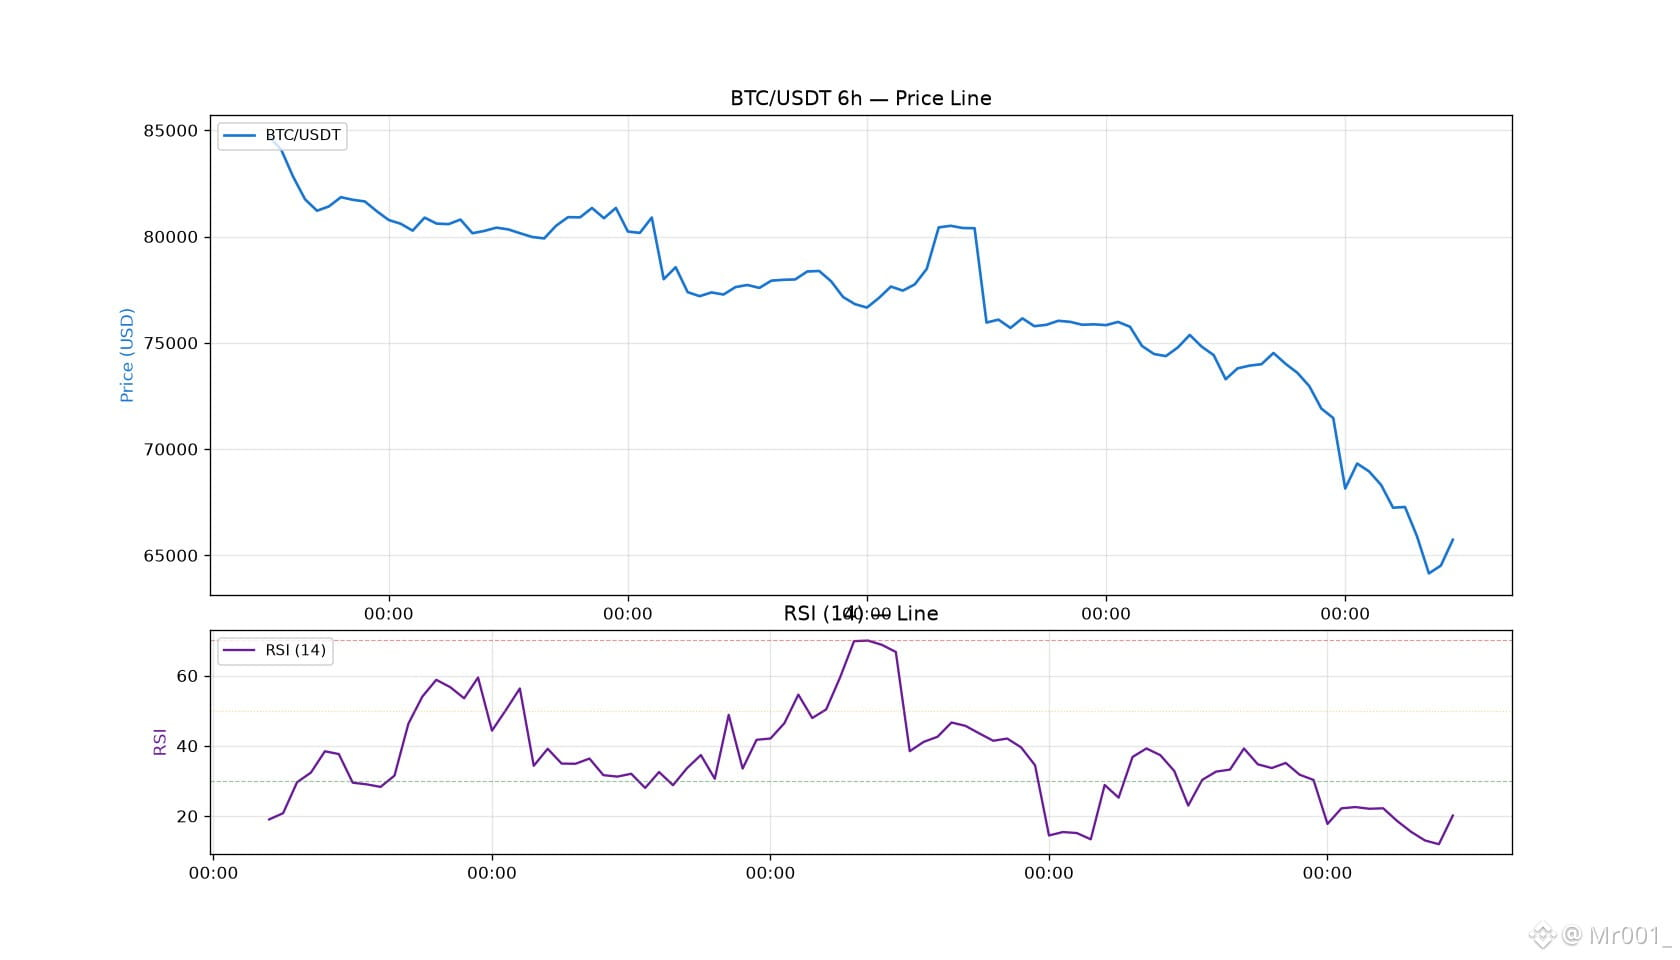
$BTC 6h Analysis
Current Price: $65,732.00
24h Change: -2.29%
RSI(Average of 6 hours): 20.12
Trend: Downtrend
Bias: Bearish
Resistance: $70,148.76
Support: $63,188.28
Critical Support: $62,006.00
Advice for traders/investors:
Wait for a bullish reversal signal before entering buy. RSI above 50 or price holding above $62,006.00 signals recovery. Take profits near resistance. Only risk capital you can afford to lose.
$BTC
#Crypto #Trading #BTC #analysis
$BTC 6h Analysis
Current Price: $65,732.00
24h Change: -2.29%
RSI(Average of 6 hours): 20.12
Trend: Downtrend
Bias: Bearish
Resistance: $70,148.76
Support: $63,188.28
Critical Support: $62,006.00
Advice for traders/investors:
Wait for a bullish reversal signal before entering buy. RSI above 50 or price holding above $62,006.00 signals recovery. Take profits near resistance. Only risk capital you can afford to lose.
$BTC
#Crypto #Trading #BTC #analysis
Current Price: $65,732.00
24h Change: -2.29%
RSI(Average of 6 hours): 20.12
Trend: Downtrend
Bias: Bearish
Resistance: $70,148.76
Support: $63,188.28
Critical Support: $62,006.00
Advice for traders/investors:
Wait for a bullish reversal signal before entering buy. RSI above 50 or price holding above $62,006.00 signals recovery. Take profits near resistance. Only risk capital you can afford to lose.
$BTC
#Crypto #Trading #BTC #analysis
1
119
·
--
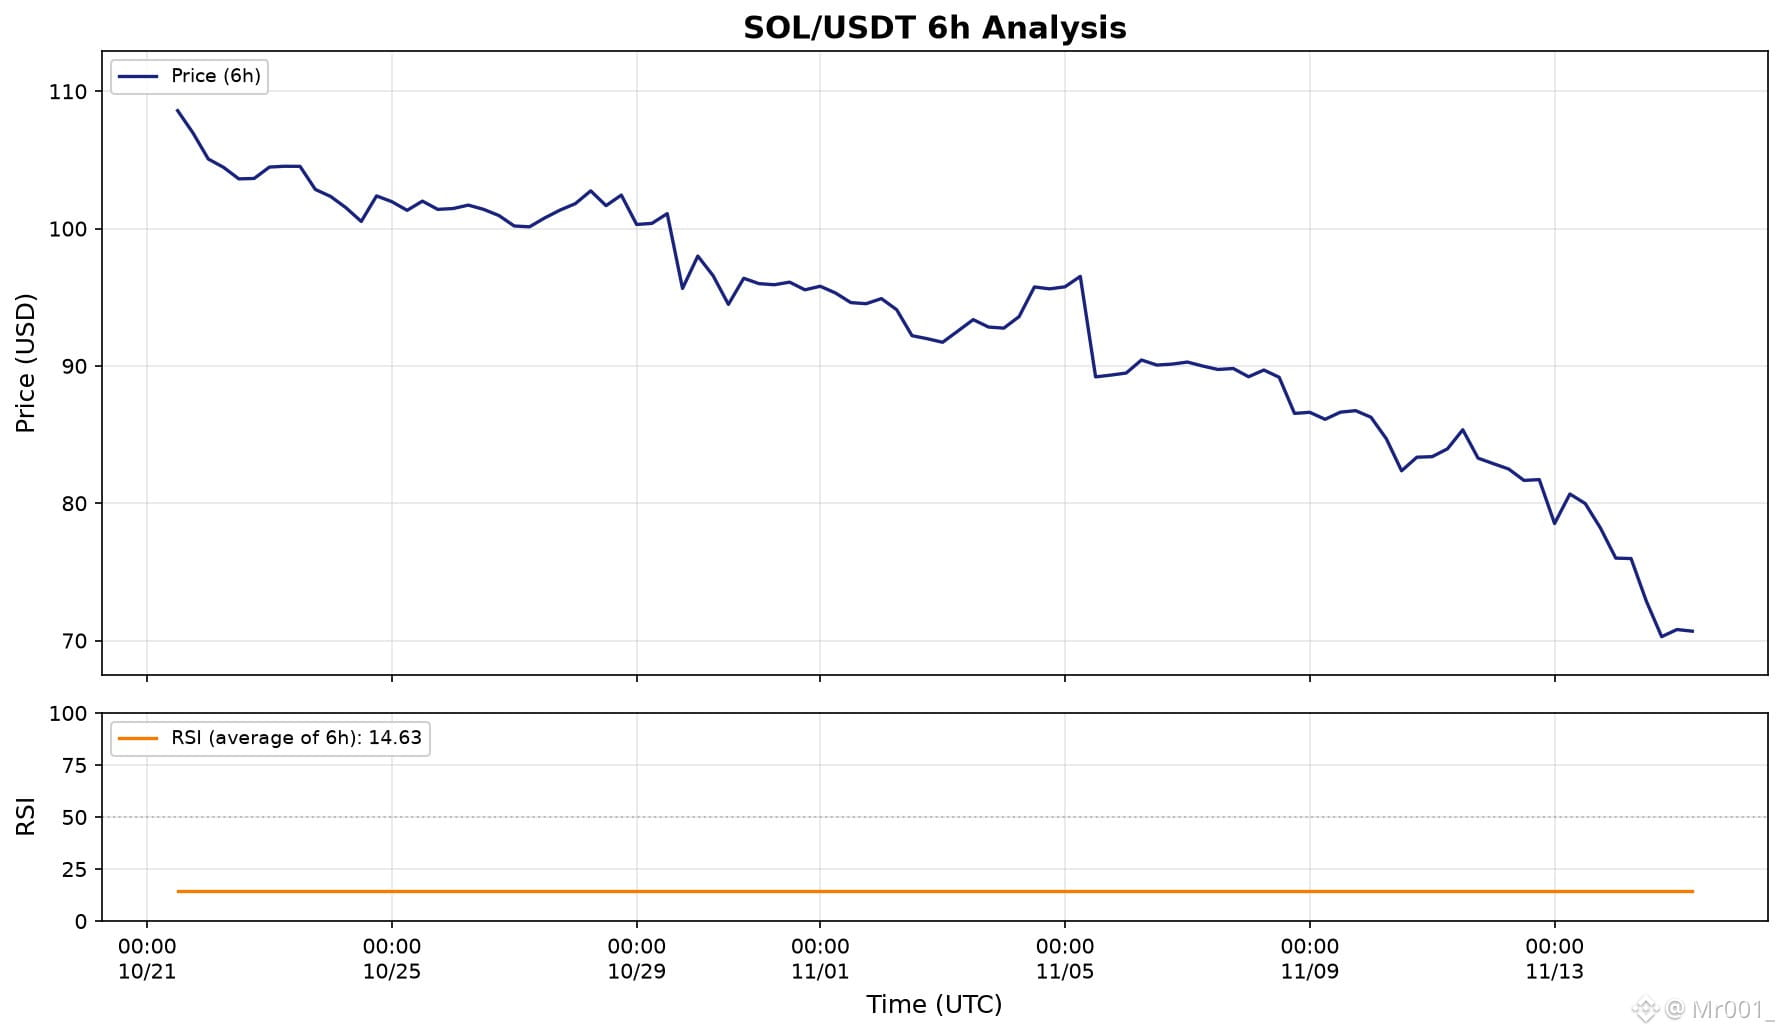
$SOL 6h Analysis Time 12:00 to 11:59 UTC
Current Price: $70.68
24h Change: -6.96%
RSI(Average of 6 hours): 14.63
Trend: Downtrend
Bias: Bearish
Resistance: $76.06
Support: $67.41
Critical Support: $70.68
Advice for traders/investors:
Wait for a bullish reversal signal before entering buy. RSI above 50 or price holding above $70.68 signals recovery. Take profits near resistance. Only risk capital you can afford to lose.
$SOL
#Crypto #Trading #SOL #analysis
$SOL 6h Analysis Time 12:00 to 11:59 UTC
Current Price: $70.68
24h Change: -6.96%
RSI(Average of 6 hours): 14.63
Trend: Downtrend
Bias: Bearish
Resistance: $76.06
Support: $67.41
Critical Support: $70.68
Advice for traders/investors:
Wait for a bullish reversal signal before entering buy. RSI above 50 or price holding above $70.68 signals recovery. Take profits near resistance. Only risk capital you can afford to lose.
$SOL
#Crypto #Trading #SOL #analysis
Current Price: $70.68
24h Change: -6.96%
RSI(Average of 6 hours): 14.63
Trend: Downtrend
Bias: Bearish
Resistance: $76.06
Support: $67.41
Critical Support: $70.68
Advice for traders/investors:
Wait for a bullish reversal signal before entering buy. RSI above 50 or price holding above $70.68 signals recovery. Take profits near resistance. Only risk capital you can afford to lose.
$SOL
#Crypto #Trading #SOL #analysis
1
107
·
--
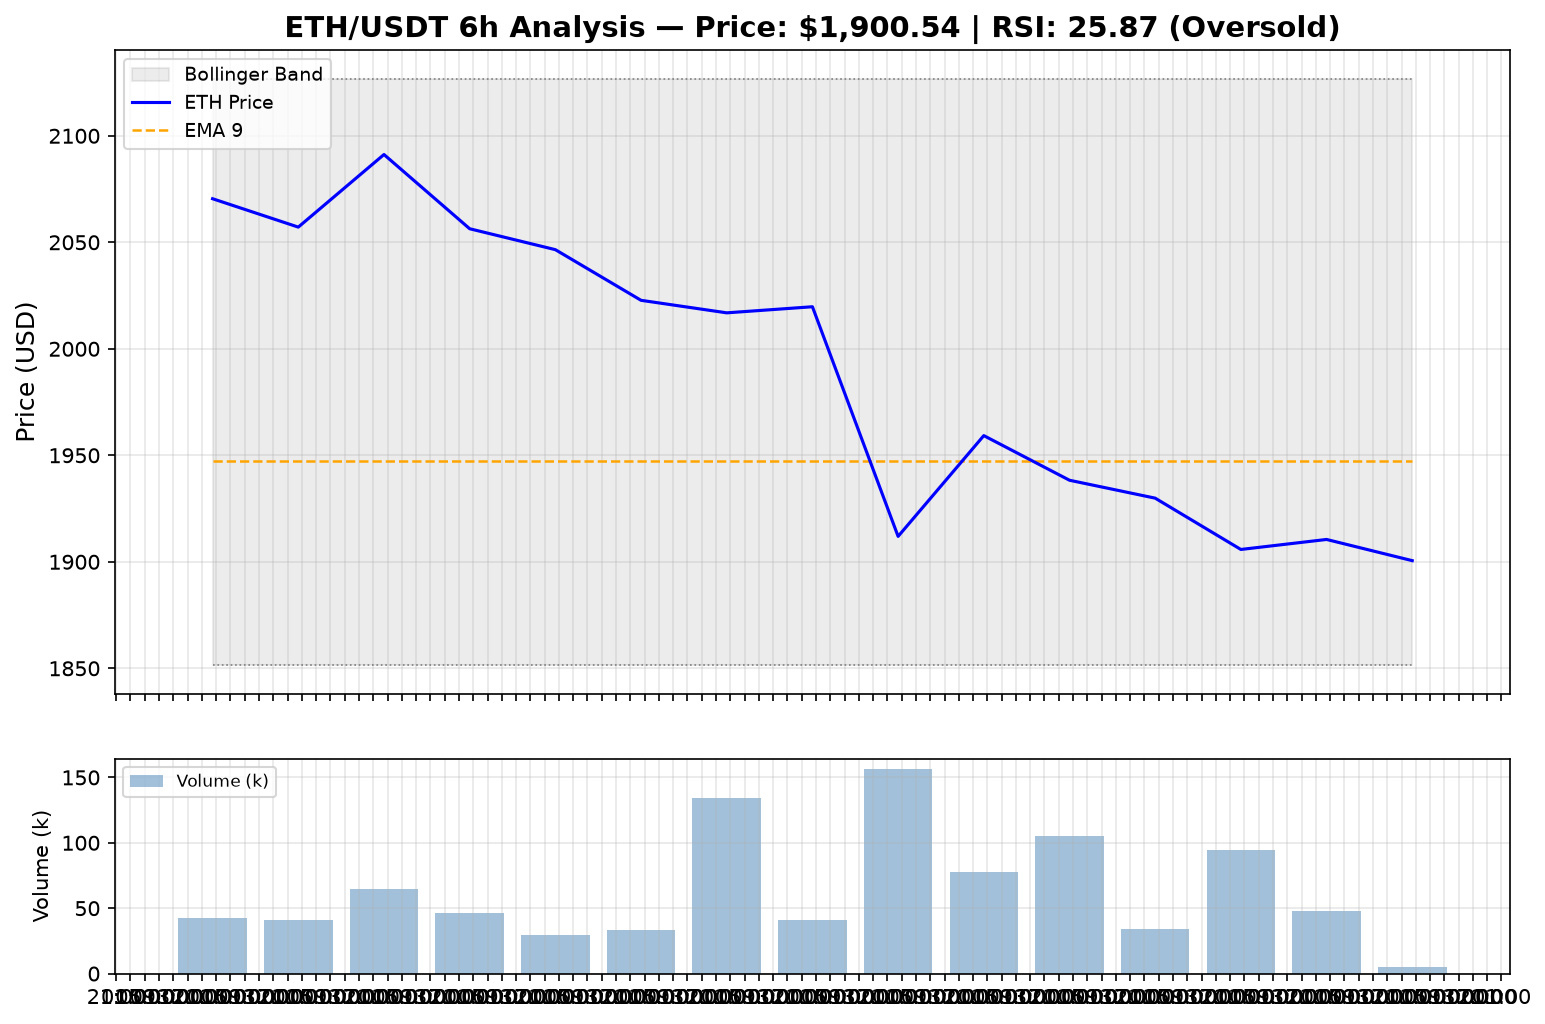
$ETH 6h Analysis Time 12:50 to 18:50
Current Price: $1,904.53
24h Change: -1.74%
RSI: 25.87
Trend: Downtrend
Bias: Bearish
Resistance: $1,956.50
Support: $1,878.00
Critical Support: $1,903.02
Advice for traders/investors:
Wait for a bullish reversal signal before entering long. RSI above 50 or price holding above $1,903 signals recovery. Take profits near resistance. Only risk capital you can afford to lose.
#Crypto #Trading #ETH #Binance
$ETH 6h Analysis Time 12:50 to 18:50
Current Price: $1,904.53
24h Change: -1.74%
RSI: 25.87
Trend: Downtrend
Bias: Bearish
Resistance: $1,956.50
Support: $1,878.00
Critical Support: $1,903.02
Advice for traders/investors:
Wait for a bullish reversal signal before entering long. RSI above 50 or price holding above $1,903 signals recovery. Take profits near resistance. Only risk capital you can afford to lose.
#Crypto #Trading #ETH #Binance
Current Price: $1,904.53
24h Change: -1.74%
RSI: 25.87
Trend: Downtrend
Bias: Bearish
Resistance: $1,956.50
Support: $1,878.00
Critical Support: $1,903.02
Advice for traders/investors:
Wait for a bullish reversal signal before entering long. RSI above 50 or price holding above $1,903 signals recovery. Take profits near resistance. Only risk capital you can afford to lose.
#Crypto #Trading #ETH #Binance
1
50
·
--
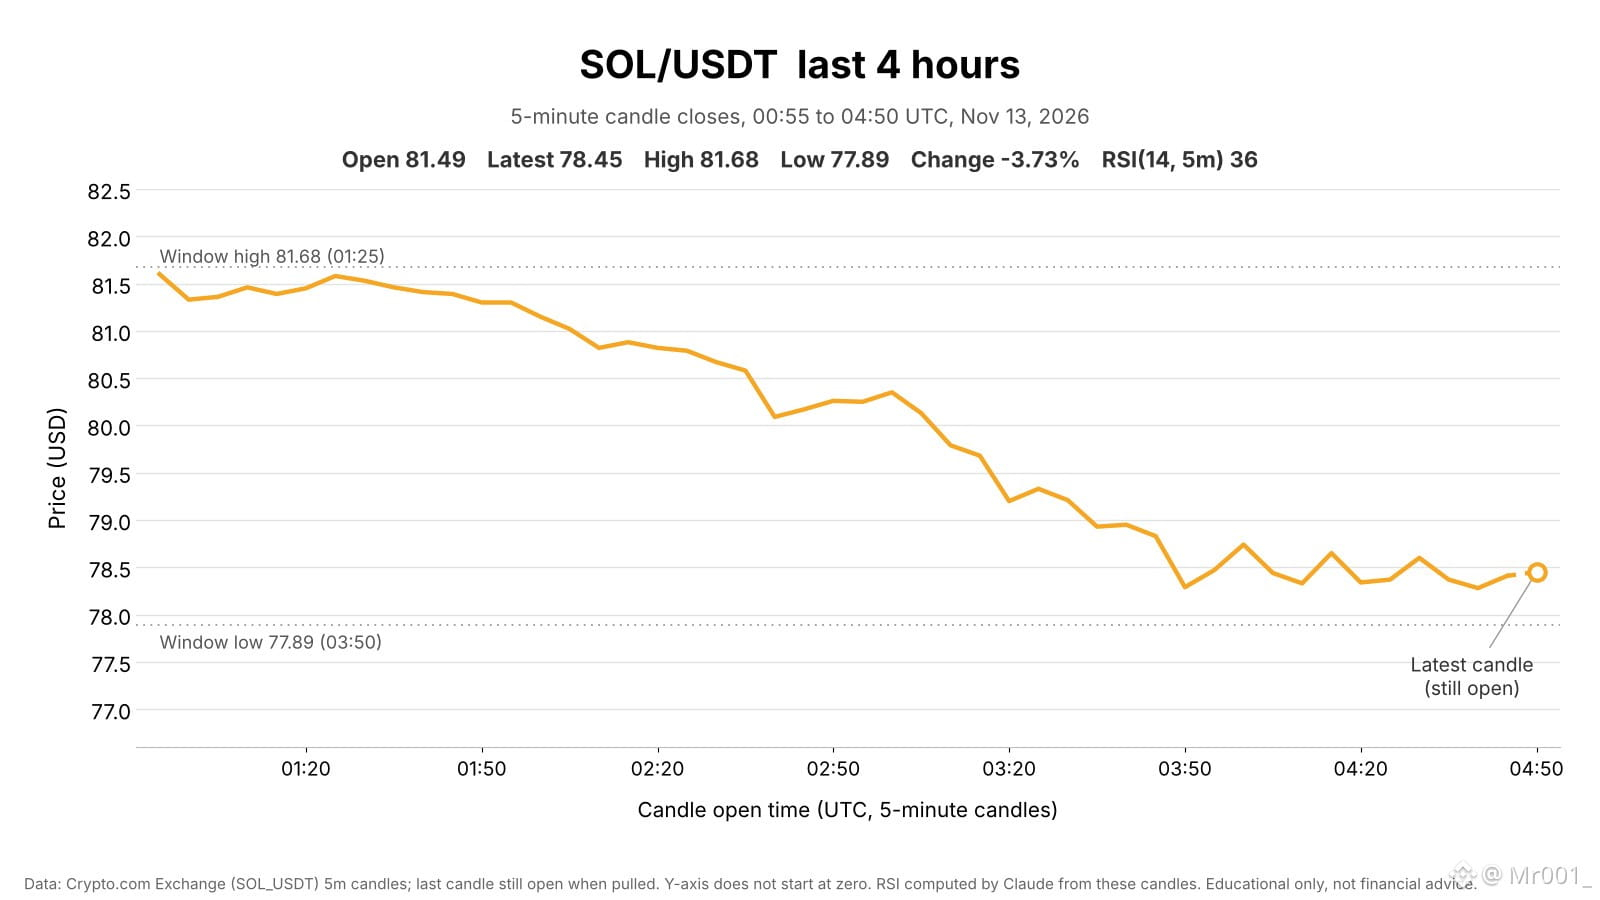
$SOL slides 3.7% to a 50-day low, then stalls near $78.4
Last 4 hours, Nov 13 00:55 – 04:50 UTC
$SOL is at $78.45, down 3.73% from $81.49. High $81.68, low $77.89 (4.87% range). Price held $81.0–$81.6 until ~02:05, slid to $79.2 by 03:20, hit the $77.89 low at 03:50 on the window's heaviest volume, then stalled at $78.3–$79.3.
📊 Market context
▪ BTC -3.31% over the same window. SOL lagged BTC by 0.42 pts.
▪ SOL is -4.0% since today's 00:00 UTC open ($81.72) and -17.9% since the Nov 5 open ($95.61), against BTC's -14.6%. Its $77.89 low is the lowest in the 50 days of daily data (since Sep 25).
📈 Volume
▪ 4h volume on Crypto.com ~$3.9M: 2.68x the 7-day average 4h bar ($1.5M) and 3.30x the median ($1.2M). The 03:50 candle was 8% of it.
🔎 Technicals & levels
▪ RSI(14, 5m) 36. On 4h bars RSI is 20 and price is below its 20-bar average ($83.40). On daily bars RSI is 20 and price is below its 20-day average ($93.09).
▪ Resistance: $81.68 (window high), $83.93 (Nov 12 high)
▪ Support: $77.89 (window low, a 50-day low)
🗓 News & Catalysts
▪ DTCC plans to bring tokenized securities to Solana in late 2027, making it the fifth network on its tokenization roadmap (per Unchained and Cointelegraph).
▪ Spout Finance added USDC loans on Solana using Ondo tokenized equities (per COINTURK).
#solana #AnthropicRejectsIPODelayValuationinQuestion #analysis
{spot}(SOLUSDT)
$SOL slides 3.7% to a 50-day low, then stalls near $78.4
Last 4 hours, Nov 13 00:55 – 04:50 UTC
$SOL is at $78.45, down 3.73% from $81.49. High $81.68, low $77.89 (4.87% range). Price held $81.0–$81.6 until ~02:05, slid to $79.2 by 03:20, hit the $77.89 low at 03:50 on the window's heaviest volume, then stalled at $78.3–$79.3.
📊 Market context
▪ BTC -3.31% over the same window. SOL lagged BTC by 0.42 pts.
▪ SOL is -4.0% since today's 00:00 UTC open ($81.72) and -17.9% since the Nov 5 open ($95.61), against BTC's -14.6%. Its $77.89 low is the lowest in the 50 days of daily data (since Sep 25).
📈 Volume
▪ 4h volume on Crypto.com ~$3.9M: 2.68x the 7-day average 4h bar ($1.5M) and 3.30x the median ($1.2M). The 03:50 candle was 8% of it.
🔎 Technicals & levels
▪ RSI(14, 5m) 36. On 4h bars RSI is 20 and price is below its 20-bar average ($83.40). On daily bars RSI is 20 and price is below its 20-day average ($93.09).
▪ Resistance: $81.68 (window high), $83.93 (Nov 12 high)
▪ Support: $77.89 (window low, a 50-day low)
🗓 News & Catalysts
▪ DTCC plans to bring tokenized securities to Solana in late 2027, making it the fifth network on its tokenization roadmap (per Unchained and Cointelegraph).
▪ Spout Finance added USDC loans on Solana using Ondo tokenized equities (per COINTURK).
#solana #AnthropicRejectsIPODelayValuationinQuestion #analysis
Last 4 hours, Nov 13 00:55 – 04:50 UTC
$SOL is at $78.45, down 3.73% from $81.49. High $81.68, low $77.89 (4.87% range). Price held $81.0–$81.6 until ~02:05, slid to $79.2 by 03:20, hit the $77.89 low at 03:50 on the window's heaviest volume, then stalled at $78.3–$79.3.
📊 Market context
▪ BTC -3.31% over the same window. SOL lagged BTC by 0.42 pts.
▪ SOL is -4.0% since today's 00:00 UTC open ($81.72) and -17.9% since the Nov 5 open ($95.61), against BTC's -14.6%. Its $77.89 low is the lowest in the 50 days of daily data (since Sep 25).
📈 Volume
▪ 4h volume on Crypto.com ~$3.9M: 2.68x the 7-day average 4h bar ($1.5M) and 3.30x the median ($1.2M). The 03:50 candle was 8% of it.
🔎 Technicals & levels
▪ RSI(14, 5m) 36. On 4h bars RSI is 20 and price is below its 20-bar average ($83.40). On daily bars RSI is 20 and price is below its 20-day average ($93.09).
▪ Resistance: $81.68 (window high), $83.93 (Nov 12 high)
▪ Support: $77.89 (window low, a 50-day low)
🗓 News & Catalysts
▪ DTCC plans to bring tokenized securities to Solana in late 2027, making it the fifth network on its tokenization roadmap (per Unchained and Cointelegraph).
▪ Spout Finance added USDC loans on Solana using Ondo tokenized equities (per COINTURK).
#solana #AnthropicRejectsIPODelayValuationinQuestion #analysis
128
·
--
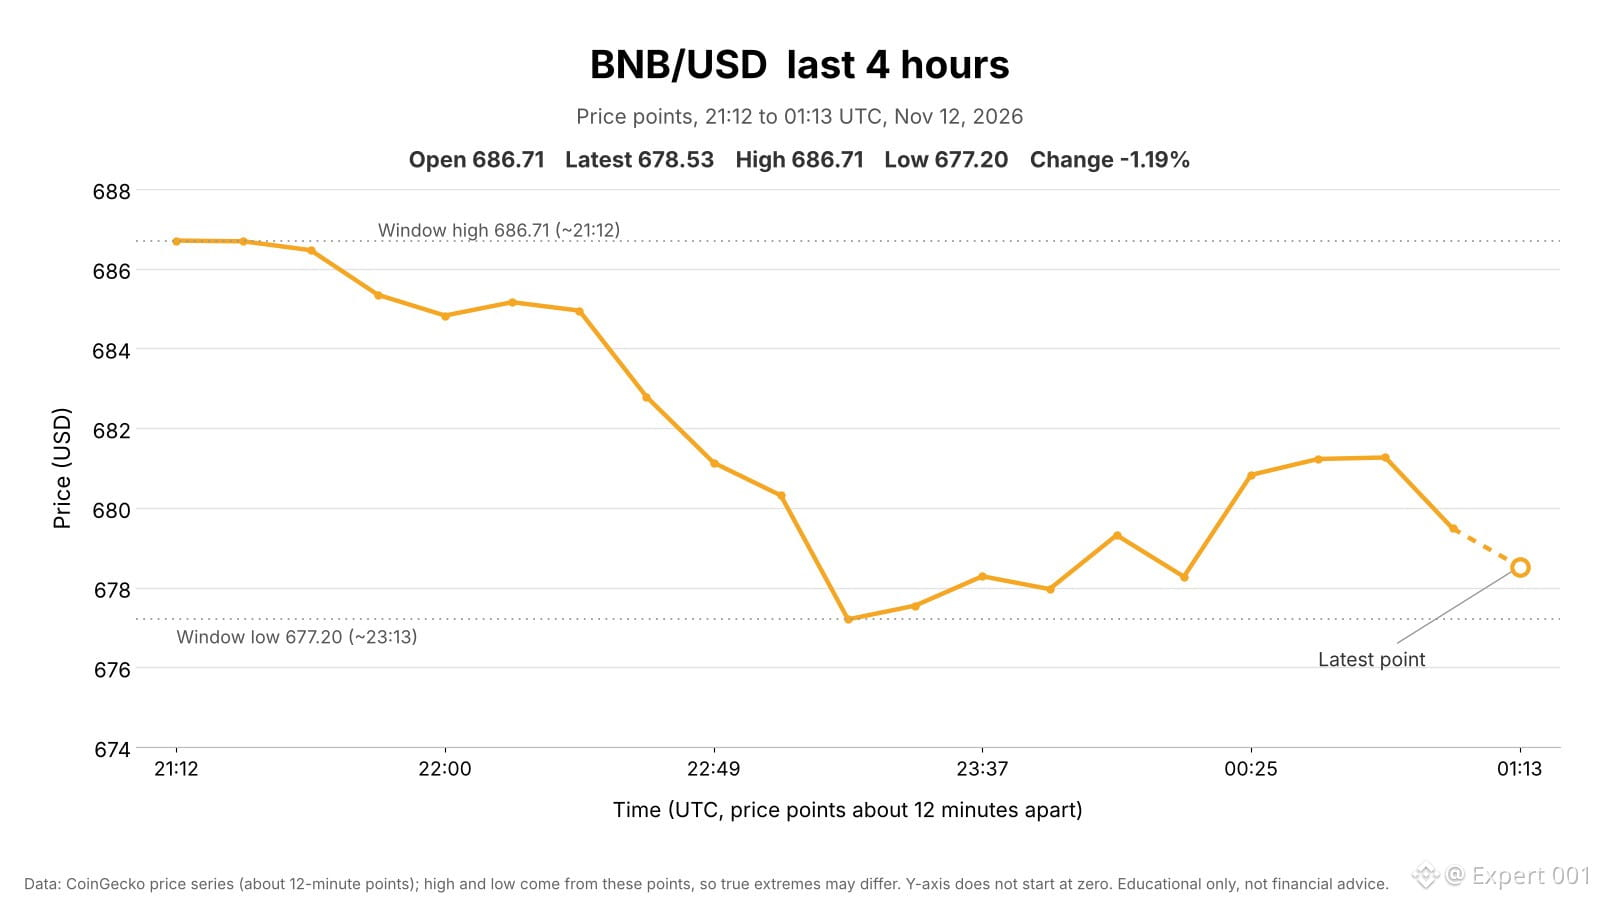
$BNB slides 1.4% to $677, recovers to $681, then slips back
Last 4 hours, Nov 11 21:12 – Nov 12 01:13 UTC
$BNB is at $678.53, down 1.19% from $686.71. High $686.71 (the window's first point), low $677.20 (1.40% range). Price slid to $677.20 by ~23:13, recovered to $681.26 by ~00:49, then slipped back to $678.53.
📊 Market context
▪ BTC -1.28% over the same window. BNB beat BTC by 0.08 pts.
▪ BNB is -0.04% over 24h (BTC +0.30%) and -5.65% over 7 days.
🔎 Levels
▪ Resistance: $686.71 (window high), $687.59 (24h high, Nov 11 ~18:36)
▪ Support: $677.20 (window low), $676.95 (24h low, Nov 11 ~06:57), $670.58 (7-day low, Nov 10 ~16:46)
🗓 News & Catalysts
▪ Nomura's Laser Digital helped launch a Saudi SME credit vault on BNB Chain targeting a $100M raise (per PANews, The Block and Crypto Briefing).
▪ Coindoo published a piece on fake USDT on BNB Chain.#BNB走势 #viralpost #analysis #cryptouniverseofficial
{spot}(BNBUSDT)
$BNB slides 1.4% to $677, recovers to $681, then slips back
Last 4 hours, Nov 11 21:12 – Nov 12 01:13 UTC
$BNB is at $678.53, down 1.19% from $686.71. High $686.71 (the window's first point), low $677.20 (1.40% range). Price slid to $677.20 by ~23:13, recovered to $681.26 by ~00:49, then slipped back to $678.53.
📊 Market context
▪ BTC -1.28% over the same window. BNB beat BTC by 0.08 pts.
▪ BNB is -0.04% over 24h (BTC +0.30%) and -5.65% over 7 days.
🔎 Levels
▪ Resistance: $686.71 (window high), $687.59 (24h high, Nov 11 ~18:36)
▪ Support: $677.20 (window low), $676.95 (24h low, Nov 11 ~06:57), $670.58 (7-day low, Nov 10 ~16:46)
🗓 News & Catalysts
▪ Nomura's Laser Digital helped launch a Saudi SME credit vault on BNB Chain targeting a $100M raise (per PANews, The Block and Crypto Briefing).
▪ Coindoo published a piece on fake USDT on BNB Chain.#BNB走势 #viralpost #analysis #cryptouniverseofficial
Last 4 hours, Nov 11 21:12 – Nov 12 01:13 UTC
$BNB is at $678.53, down 1.19% from $686.71. High $686.71 (the window's first point), low $677.20 (1.40% range). Price slid to $677.20 by ~23:13, recovered to $681.26 by ~00:49, then slipped back to $678.53.
📊 Market context
▪ BTC -1.28% over the same window. BNB beat BTC by 0.08 pts.
▪ BNB is -0.04% over 24h (BTC +0.30%) and -5.65% over 7 days.
🔎 Levels
▪ Resistance: $686.71 (window high), $687.59 (24h high, Nov 11 ~18:36)
▪ Support: $677.20 (window low), $676.95 (24h low, Nov 11 ~06:57), $670.58 (7-day low, Nov 10 ~16:46)
🗓 News & Catalysts
▪ Nomura's Laser Digital helped launch a Saudi SME credit vault on BNB Chain targeting a $100M raise (per PANews, The Block and Crypto Briefing).
▪ Coindoo published a piece on fake USDT on BNB Chain.#BNB走势 #viralpost #analysis #cryptouniverseofficial
1
125
·
--
$BTC ends flat after a $450 swing
Last 4 hours, Nov 9 22:05 – Nov 10 02:00 UTC
BTC is at $75,027, up 0.02% from $75,011. High $75,467, low $74,916 (0.74% range). Price climbed to $75,405 by 00:05, slid to the 01:35 low on above-average volume, then recovered to around $75,030.
📊 Market context
▪ BTC hit $73,738 on Nov 9 (08:00 UTC candle), then recovered to close at $75,361 (+0.68%). It is down 6.8% since the Nov 5 open ($80,507).
▪ US spot BTC ETFs: $1.282B net outflow last week, $1.209B of it from IBIT (per PANews).
▪ CMC Fear & Greed (Nov 7): 31 (Fear).
📈 Volume
▪ 4h volume on Crypto.com ~$12.7M: 0.69x the 7-day average 4h bar ($18.3M, which includes the Nov 8–9 flush and the Nov 5–6 sell-off) and 1.11x the median ($11.5M). The 01:05 candle was 6% of it.
🔎 Technicals & levels
▪ RSI(14, 5m) 45. On 4h bars RSI is 45 and price is below its 20-bar average ($75,538). On daily bars RSI is 36.5 and price is below its 20-day average ($78,706).
▪ Resistance: $75,467 (window high), $75,603 (Nov 9 high)
▪ Support: $74,916 (window low), $73,738 (Nov 9 low)
🗓 News & Catalysts
▪ MARA reported Q3 net profit of $632M and says it sold 13,597 BTC in October to repay loans (per Lookonchain).
▪ A PANews analysis says the post-drop rebound lacks spot demand as whale exchange inflows rise and leverage risk persists.
▪ Next: US CPI (Nov 10, 13:30 UTC).#CPITestsDecemberRateOutlook #BTC #BitcoinFiveWeeklyLosses #analysis
{spot}(BTCUSDT)
$BTC ends flat after a $450 swing
Last 4 hours, Nov 9 22:05 – Nov 10 02:00 UTC
BTC is at $75,027, up 0.02% from $75,011. High $75,467, low $74,916 (0.74% range). Price climbed to $75,405 by 00:05, slid to the 01:35 low on above-average volume, then recovered to around $75,030.
📊 Market context
▪ BTC hit $73,738 on Nov 9 (08:00 UTC candle), then recovered to close at $75,361 (+0.68%). It is down 6.8% since the Nov 5 open ($80,507).
▪ US spot BTC ETFs: $1.282B net outflow last week, $1.209B of it from IBIT (per PANews).
▪ CMC Fear & Greed (Nov 7): 31 (Fear).
📈 Volume
▪ 4h volume on Crypto.com ~$12.7M: 0.69x the 7-day average 4h bar ($18.3M, which includes the Nov 8–9 flush and the Nov 5–6 sell-off) and 1.11x the median ($11.5M). The 01:05 candle was 6% of it.
🔎 Technicals & levels
▪ RSI(14, 5m) 45. On 4h bars RSI is 45 and price is below its 20-bar average ($75,538). On daily bars RSI is 36.5 and price is below its 20-day average ($78,706).
▪ Resistance: $75,467 (window high), $75,603 (Nov 9 high)
▪ Support: $74,916 (window low), $73,738 (Nov 9 low)
🗓 News & Catalysts
▪ MARA reported Q3 net profit of $632M and says it sold 13,597 BTC in October to repay loans (per Lookonchain).
▪ A PANews analysis says the post-drop rebound lacks spot demand as whale exchange inflows rise and leverage risk persists.
▪ Next: US CPI (Nov 10, 13:30 UTC).#CPITestsDecemberRateOutlook #BTC #BitcoinFiveWeeklyLosses #analysis
Last 4 hours, Nov 9 22:05 – Nov 10 02:00 UTC
BTC is at $75,027, up 0.02% from $75,011. High $75,467, low $74,916 (0.74% range). Price climbed to $75,405 by 00:05, slid to the 01:35 low on above-average volume, then recovered to around $75,030.
📊 Market context
▪ BTC hit $73,738 on Nov 9 (08:00 UTC candle), then recovered to close at $75,361 (+0.68%). It is down 6.8% since the Nov 5 open ($80,507).
▪ US spot BTC ETFs: $1.282B net outflow last week, $1.209B of it from IBIT (per PANews).
▪ CMC Fear & Greed (Nov 7): 31 (Fear).
📈 Volume
▪ 4h volume on Crypto.com ~$12.7M: 0.69x the 7-day average 4h bar ($18.3M, which includes the Nov 8–9 flush and the Nov 5–6 sell-off) and 1.11x the median ($11.5M). The 01:05 candle was 6% of it.
🔎 Technicals & levels
▪ RSI(14, 5m) 45. On 4h bars RSI is 45 and price is below its 20-bar average ($75,538). On daily bars RSI is 36.5 and price is below its 20-day average ($78,706).
▪ Resistance: $75,467 (window high), $75,603 (Nov 9 high)
▪ Support: $74,916 (window low), $73,738 (Nov 9 low)
🗓 News & Catalysts
▪ MARA reported Q3 net profit of $632M and says it sold 13,597 BTC in October to repay loans (per Lookonchain).
▪ A PANews analysis says the post-drop rebound lacks spot demand as whale exchange inflows rise and leverage risk persists.
▪ Next: US CPI (Nov 10, 13:30 UTC).#CPITestsDecemberRateOutlook #BTC #BitcoinFiveWeeklyLosses #analysis
1
84
·
--
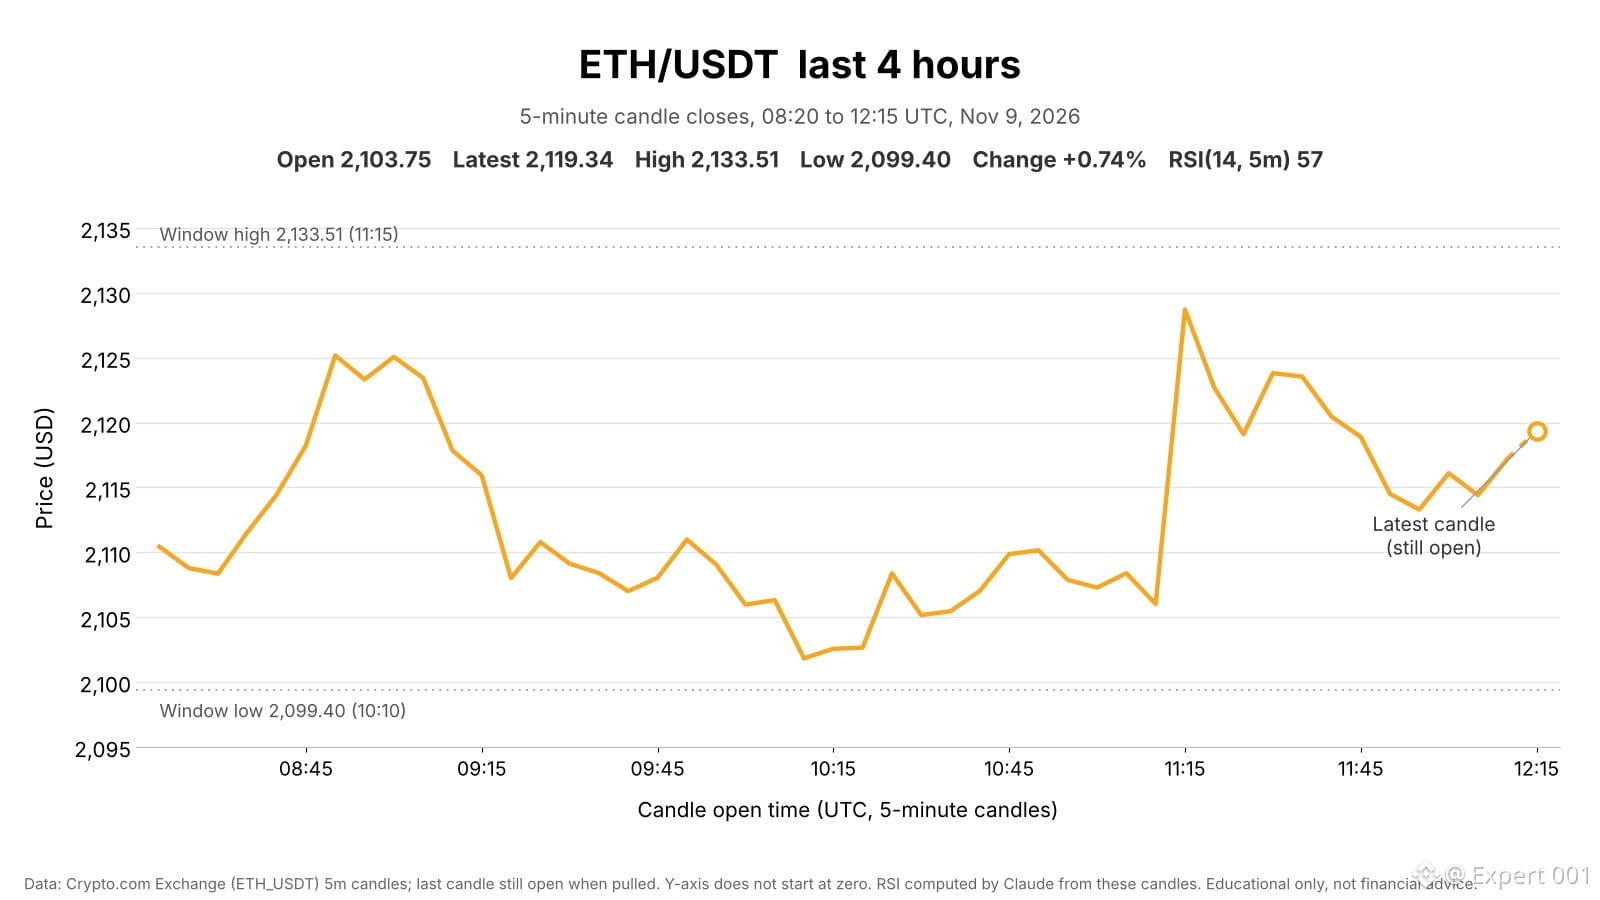
$ETH jumps 1% at 11:15, then holds above $2,110
Last 4 hours, Nov 9 08:20 – 12:15 UTC
ETH is at $2,119.34, up 0.74% from $2,103.75. High $2,133.51, low $2,099.40 (1.62% range). Price rose to $2,125 by 08:50, slid to $2,102 by 10:10, jumped to $2,129 in the 11:15 candle on the window's heaviest volume, then held $2,113–$2,124.
📊 Market context
▪ BTC +0.50% over the same 4h. ETH beat BTC by 0.24 pts.
▪ ETH fell 5.0% on Nov 8 (BTC -1.3%), with a flush to $2,060 in the 20:00–24:00 UTC candle. It is down 12.6% since the Nov 5 open ($2,424.65), against BTC's 7.4%.
▪ US spot ETH ETFs: $93.2M net outflow on Friday, $365.3M for the week, a sixth straight negative week (per The Block).
▪ CMC Fear & Greed (Nov 7): 31 (Fear).
📈 Volume
▪ 4h volume on Crypto.com ~$7.4M: 0.90x the 7-day average 4h bar ($8.2M, which includes the Nov 8 flush and the Nov 5–6 sell-off) and 1.39x the median ($5.3M). The 11:15 candle was 7% of it.
🔎 Technicals & levels
▪ RSI(14, 5m) 57. On 4h bars RSI is 28 and price is below its 20-bar average ($2,215). On daily bars RSI is 32 and price is below its 20-day average ($2,312).
▪ Resistance: $2,133.51 (window high), $2,160.55 (Nov 9 high)
▪ Support: $2,099.40 (window low), $2,082.95 (Nov 9 low)
🗓 News & Catalysts
▪ Ankr's Ethereum bridge exploit drained $303K after an Optimism deposit was reused (per Crypto.news).
▪ Raycash, a Zama spinoff, launched a privacy stablecoin payment app on Ethereum (per PANews).
▪ Next: Fed's Bowman speaks (Nov 9, 13:40 UTC), US CPI (Nov 10, 13:30 UTC).
#CPITestsDecemberRateOutlook #ETH #viralpost #analysis #cryptouniverseofficial
{spot}(ETHUSDT)
$ETH jumps 1% at 11:15, then holds above $2,110
Last 4 hours, Nov 9 08:20 – 12:15 UTC
ETH is at $2,119.34, up 0.74% from $2,103.75. High $2,133.51, low $2,099.40 (1.62% range). Price rose to $2,125 by 08:50, slid to $2,102 by 10:10, jumped to $2,129 in the 11:15 candle on the window's heaviest volume, then held $2,113–$2,124.
📊 Market context
▪ BTC +0.50% over the same 4h. ETH beat BTC by 0.24 pts.
▪ ETH fell 5.0% on Nov 8 (BTC -1.3%), with a flush to $2,060 in the 20:00–24:00 UTC candle. It is down 12.6% since the Nov 5 open ($2,424.65), against BTC's 7.4%.
▪ US spot ETH ETFs: $93.2M net outflow on Friday, $365.3M for the week, a sixth straight negative week (per The Block).
▪ CMC Fear & Greed (Nov 7): 31 (Fear).
📈 Volume
▪ 4h volume on Crypto.com ~$7.4M: 0.90x the 7-day average 4h bar ($8.2M, which includes the Nov 8 flush and the Nov 5–6 sell-off) and 1.39x the median ($5.3M). The 11:15 candle was 7% of it.
🔎 Technicals & levels
▪ RSI(14, 5m) 57. On 4h bars RSI is 28 and price is below its 20-bar average ($2,215). On daily bars RSI is 32 and price is below its 20-day average ($2,312).
▪ Resistance: $2,133.51 (window high), $2,160.55 (Nov 9 high)
▪ Support: $2,099.40 (window low), $2,082.95 (Nov 9 low)
🗓 News & Catalysts
▪ Ankr's Ethereum bridge exploit drained $303K after an Optimism deposit was reused (per Crypto.news).
▪ Raycash, a Zama spinoff, launched a privacy stablecoin payment app on Ethereum (per PANews).
▪ Next: Fed's Bowman speaks (Nov 9, 13:40 UTC), US CPI (Nov 10, 13:30 UTC).
#CPITestsDecemberRateOutlook #ETH #viralpost #analysis #cryptouniverseofficial
Last 4 hours, Nov 9 08:20 – 12:15 UTC
ETH is at $2,119.34, up 0.74% from $2,103.75. High $2,133.51, low $2,099.40 (1.62% range). Price rose to $2,125 by 08:50, slid to $2,102 by 10:10, jumped to $2,129 in the 11:15 candle on the window's heaviest volume, then held $2,113–$2,124.
📊 Market context
▪ BTC +0.50% over the same 4h. ETH beat BTC by 0.24 pts.
▪ ETH fell 5.0% on Nov 8 (BTC -1.3%), with a flush to $2,060 in the 20:00–24:00 UTC candle. It is down 12.6% since the Nov 5 open ($2,424.65), against BTC's 7.4%.
▪ US spot ETH ETFs: $93.2M net outflow on Friday, $365.3M for the week, a sixth straight negative week (per The Block).
▪ CMC Fear & Greed (Nov 7): 31 (Fear).
📈 Volume
▪ 4h volume on Crypto.com ~$7.4M: 0.90x the 7-day average 4h bar ($8.2M, which includes the Nov 8 flush and the Nov 5–6 sell-off) and 1.39x the median ($5.3M). The 11:15 candle was 7% of it.
🔎 Technicals & levels
▪ RSI(14, 5m) 57. On 4h bars RSI is 28 and price is below its 20-bar average ($2,215). On daily bars RSI is 32 and price is below its 20-day average ($2,312).
▪ Resistance: $2,133.51 (window high), $2,160.55 (Nov 9 high)
▪ Support: $2,099.40 (window low), $2,082.95 (Nov 9 low)
🗓 News & Catalysts
▪ Ankr's Ethereum bridge exploit drained $303K after an Optimism deposit was reused (per Crypto.news).
▪ Raycash, a Zama spinoff, launched a privacy stablecoin payment app on Ethereum (per PANews).
▪ Next: Fed's Bowman speaks (Nov 9, 13:40 UTC), US CPI (Nov 10, 13:30 UTC).
#CPITestsDecemberRateOutlook #ETH #viralpost #analysis #cryptouniverseofficial
1
85
·
--
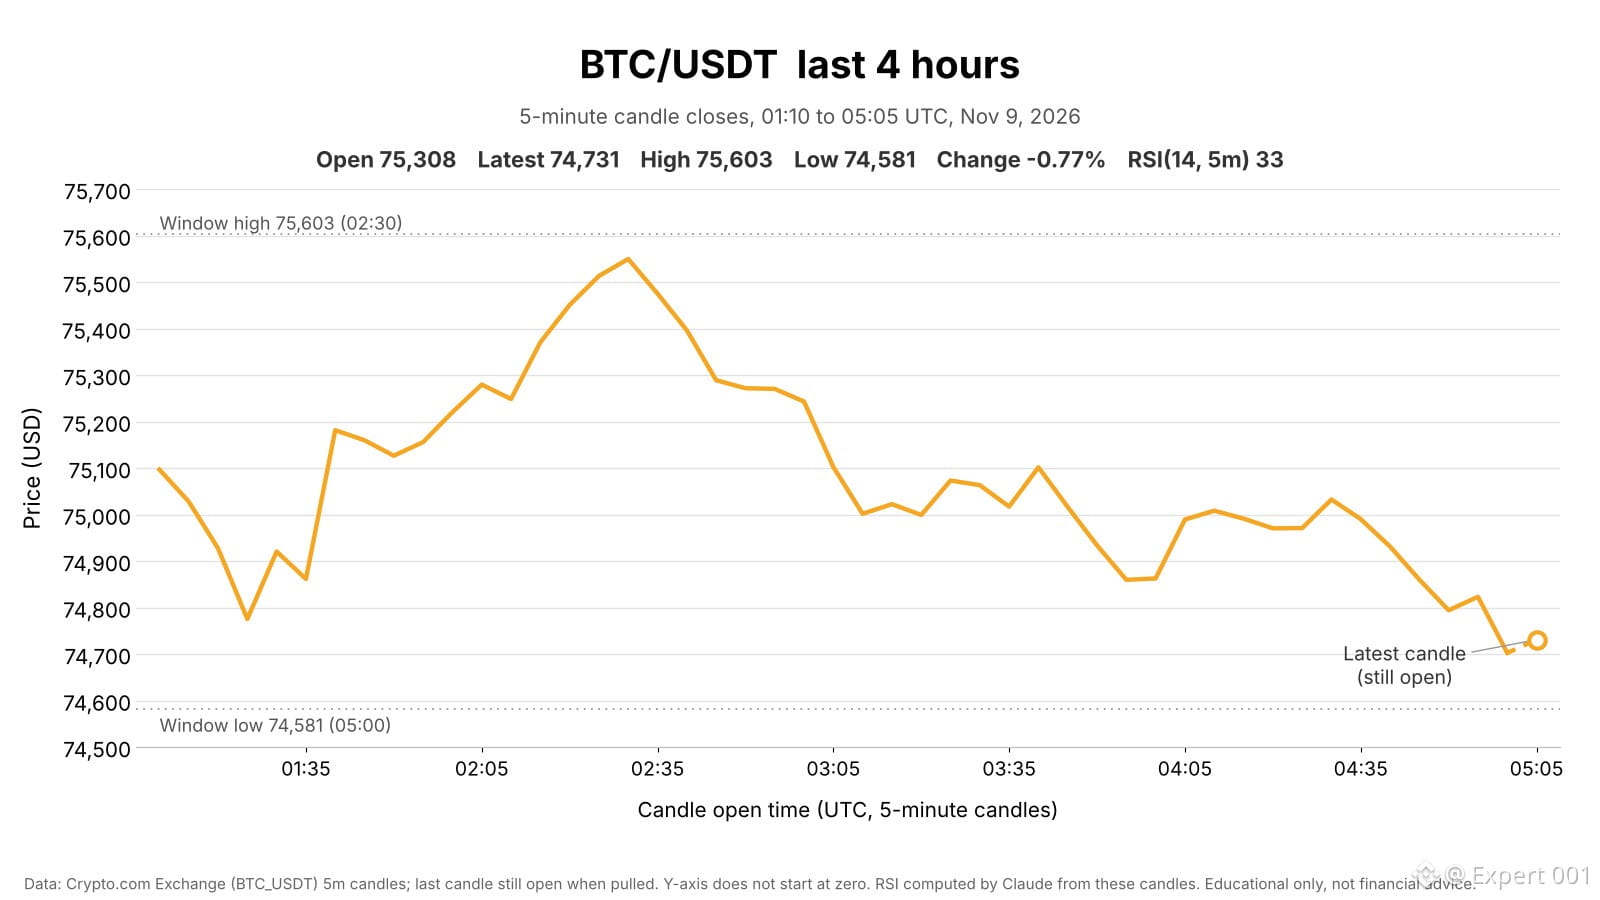
$BTC drops, pops to $75.6K, then slides to $74.7K
Last 4 hours, Nov 9 01:10 – 05:05 UTC
BTC is at $74,731, down 0.77% from $75,308. High $75,603, low $74,581 (1.37% range). Price dipped to $74,698 around 01:30, rebounded to $75,603 by 02:30, then slid to the 05:00 low.
📊 Market context
▪ BTC hit $73,469 on Sunday (Nov 8), then recovered to close at $74,855. It is down 7.2% since the Nov 5 open ($80,507).
▪ US spot BTC ETFs: $1.282B net outflow last week, $1.209B of it from IBIT (per PANews).
▪ CMC Fear & Greed (Nov 7): 31 (Fear).
📈 Volume
▪ 4h volume on Crypto.com ~$22.5M: 1.29x the 7-day average 4h bar ($17.5M, which includes the Nov 5–6 sell-off and Sunday's flush) and 2.08x the median ($10.8M).
🔎 Technicals & levels
▪ RSI(14, 5m) 33. On 4h bars RSI is 31 and price is below its 20-bar average ($75,819). On daily bars RSI is 34 and price is below its 20-day average ($79,089).
▪ Galaxy's head of research notes BTC's weekly close slipped below its 50-week average after seven straight weeks above it (per PANews).
▪ Resistance: $75,603 (window high), $76,201 (Nov 8 high)
▪ Support: $74,581 (window low), $73,469 (Nov 8 low)
🗓 News & Catalysts
▪ CoinDesk attributes today's volatility to an Nvidia cheating scandal and failed Iran talks (per its headline).
▪ Next: Fed's Bowman speaks (Nov 9, 13:40 UTC), US CPI (Nov 10, 13:30 UTC).
#BinanceReopensWithdrawalsForMoreAssets #viralpost #BTC #analysis #cryptouniverseofficial
{spot}(BTCUSDT)
$BTC drops, pops to $75.6K, then slides to $74.7K
Last 4 hours, Nov 9 01:10 – 05:05 UTC
BTC is at $74,731, down 0.77% from $75,308. High $75,603, low $74,581 (1.37% range). Price dipped to $74,698 around 01:30, rebounded to $75,603 by 02:30, then slid to the 05:00 low.
📊 Market context
▪ BTC hit $73,469 on Sunday (Nov 8), then recovered to close at $74,855. It is down 7.2% since the Nov 5 open ($80,507).
▪ US spot BTC ETFs: $1.282B net outflow last week, $1.209B of it from IBIT (per PANews).
▪ CMC Fear & Greed (Nov 7): 31 (Fear).
📈 Volume
▪ 4h volume on Crypto.com ~$22.5M: 1.29x the 7-day average 4h bar ($17.5M, which includes the Nov 5–6 sell-off and Sunday's flush) and 2.08x the median ($10.8M).
🔎 Technicals & levels
▪ RSI(14, 5m) 33. On 4h bars RSI is 31 and price is below its 20-bar average ($75,819). On daily bars RSI is 34 and price is below its 20-day average ($79,089).
▪ Galaxy's head of research notes BTC's weekly close slipped below its 50-week average after seven straight weeks above it (per PANews).
▪ Resistance: $75,603 (window high), $76,201 (Nov 8 high)
▪ Support: $74,581 (window low), $73,469 (Nov 8 low)
🗓 News & Catalysts
▪ CoinDesk attributes today's volatility to an Nvidia cheating scandal and failed Iran talks (per its headline).
▪ Next: Fed's Bowman speaks (Nov 9, 13:40 UTC), US CPI (Nov 10, 13:30 UTC).
#BinanceReopensWithdrawalsForMoreAssets #viralpost #BTC #analysis #cryptouniverseofficial
Last 4 hours, Nov 9 01:10 – 05:05 UTC
BTC is at $74,731, down 0.77% from $75,308. High $75,603, low $74,581 (1.37% range). Price dipped to $74,698 around 01:30, rebounded to $75,603 by 02:30, then slid to the 05:00 low.
📊 Market context
▪ BTC hit $73,469 on Sunday (Nov 8), then recovered to close at $74,855. It is down 7.2% since the Nov 5 open ($80,507).
▪ US spot BTC ETFs: $1.282B net outflow last week, $1.209B of it from IBIT (per PANews).
▪ CMC Fear & Greed (Nov 7): 31 (Fear).
📈 Volume
▪ 4h volume on Crypto.com ~$22.5M: 1.29x the 7-day average 4h bar ($17.5M, which includes the Nov 5–6 sell-off and Sunday's flush) and 2.08x the median ($10.8M).
🔎 Technicals & levels
▪ RSI(14, 5m) 33. On 4h bars RSI is 31 and price is below its 20-bar average ($75,819). On daily bars RSI is 34 and price is below its 20-day average ($79,089).
▪ Galaxy's head of research notes BTC's weekly close slipped below its 50-week average after seven straight weeks above it (per PANews).
▪ Resistance: $75,603 (window high), $76,201 (Nov 8 high)
▪ Support: $74,581 (window low), $73,469 (Nov 8 low)
🗓 News & Catalysts
▪ CoinDesk attributes today's volatility to an Nvidia cheating scandal and failed Iran talks (per its headline).
▪ Next: Fed's Bowman speaks (Nov 9, 13:40 UTC), US CPI (Nov 10, 13:30 UTC).
#BinanceReopensWithdrawalsForMoreAssets #viralpost #BTC #analysis #cryptouniverseofficial
1
83
·
--
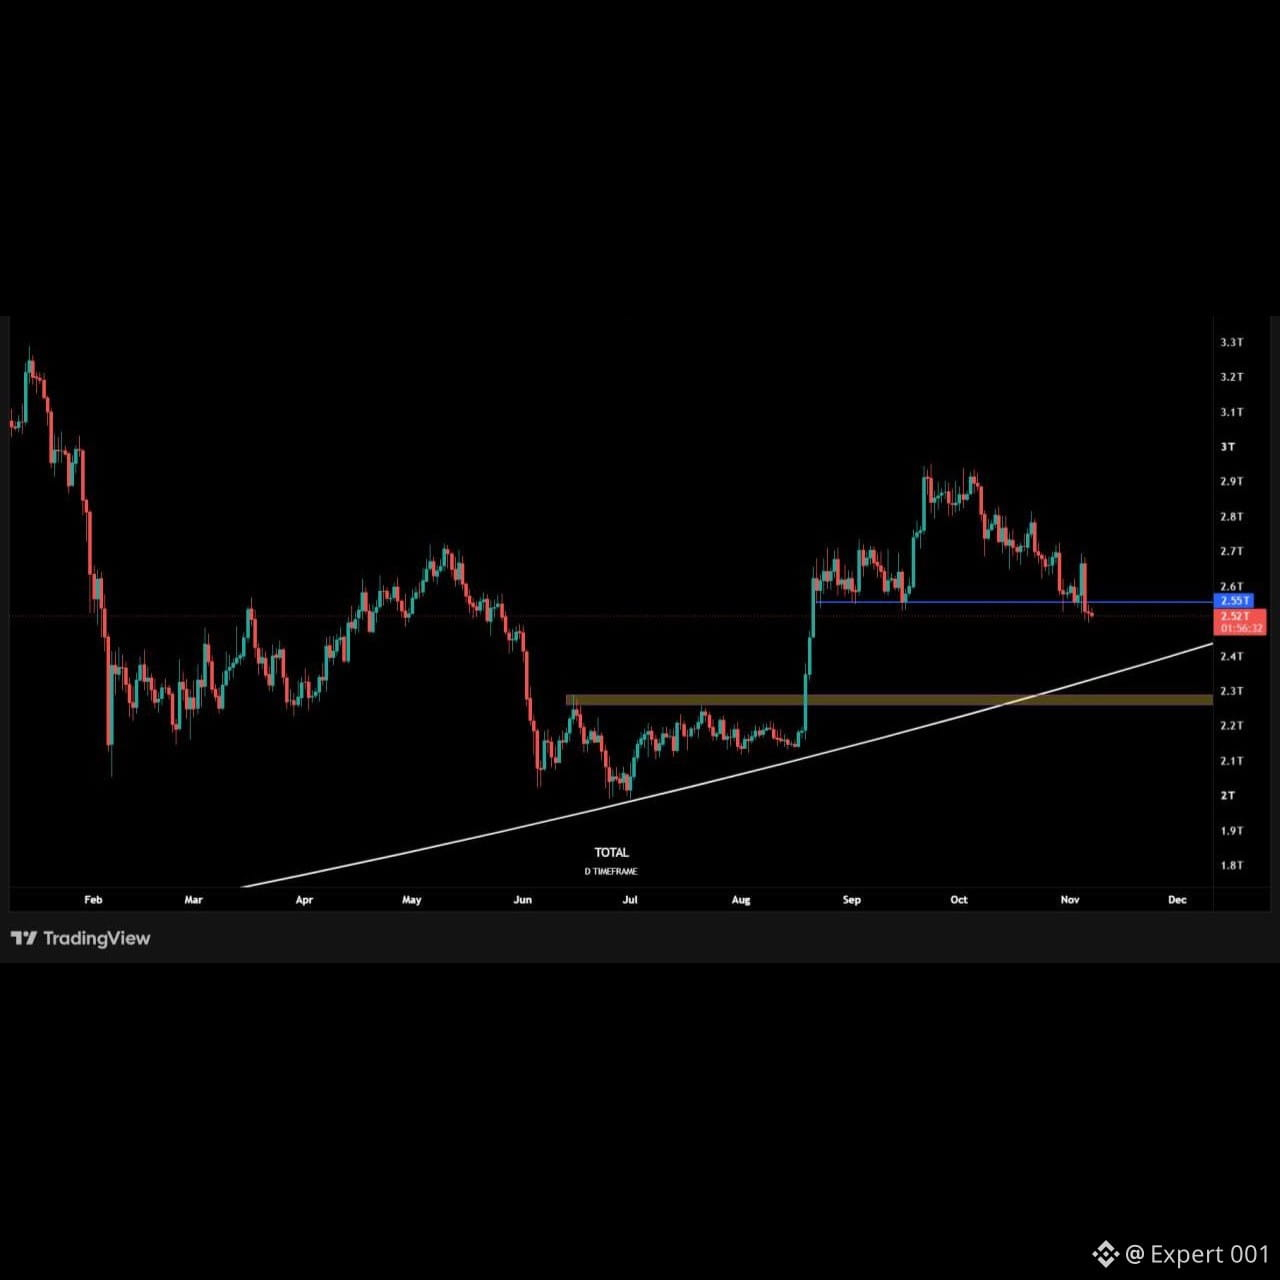
Crypto Total Market Cap has found acceptance below $2.55T. If this level is not reclaimed as soon as possible, we can expect lower prices.
TOTAL 1D
#cryptouniverseofficial #JobsReportRaisesHikeOdds #viralpost #analysis
Crypto Total Market Cap has found acceptance below $2.55T. If this level is not reclaimed as soon as possible, we can expect lower prices.
TOTAL 1D
#cryptouniverseofficial #JobsReportRaisesHikeOdds #viralpost #analysis
TOTAL 1D
#cryptouniverseofficial #JobsReportRaisesHikeOdds #viralpost #analysis
1
88
·
--
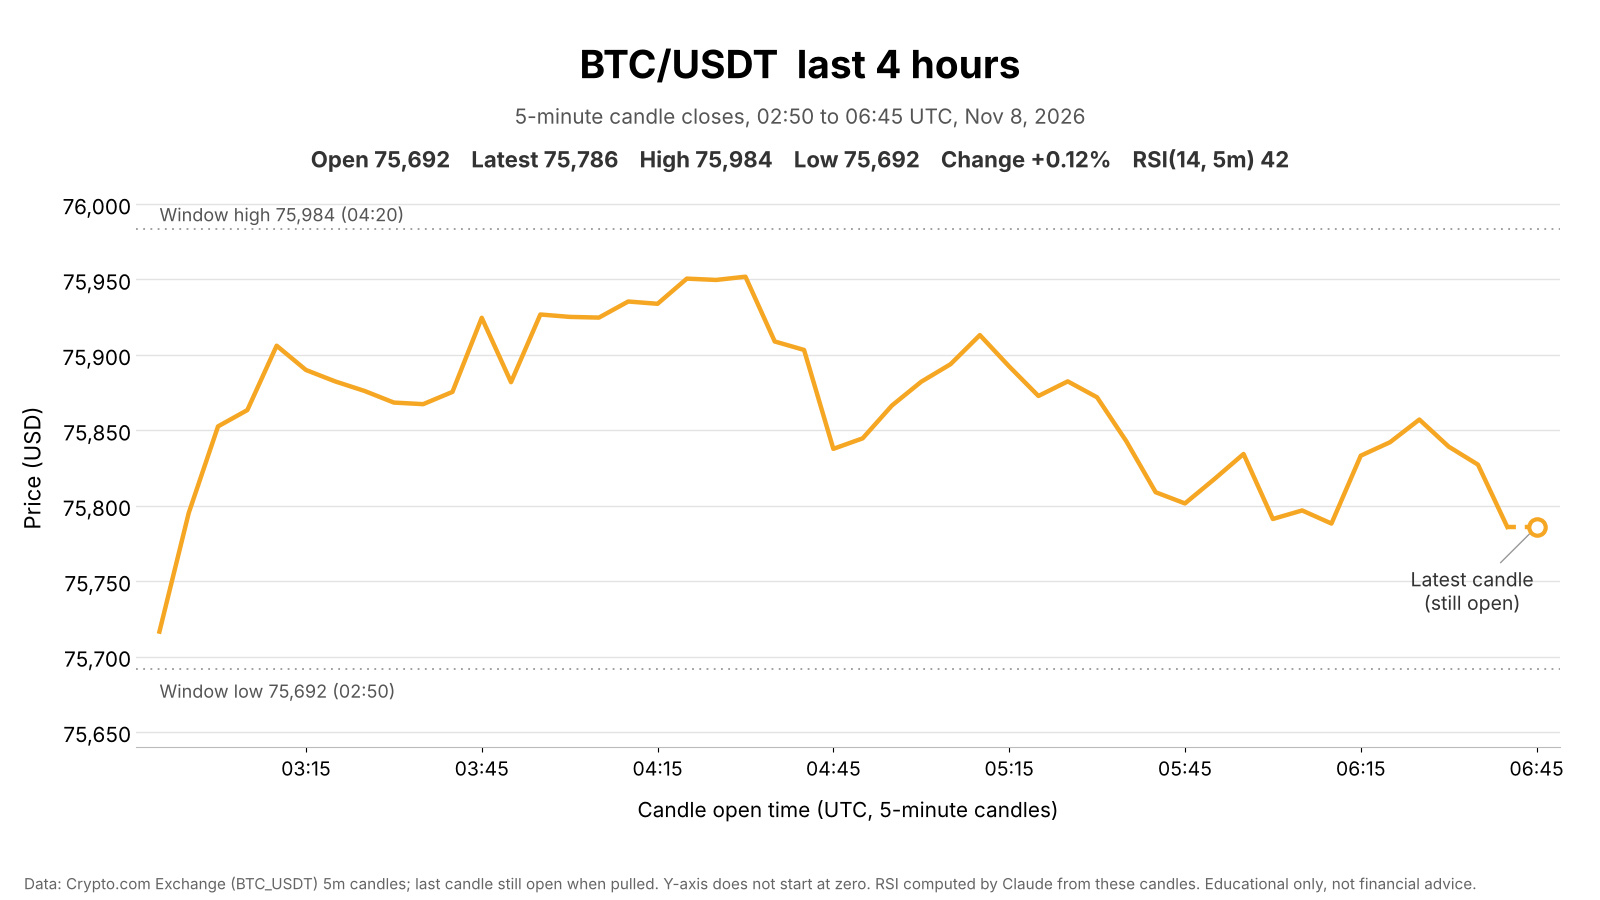
$BTC climbs off the 02:50 low, then fades toward $75.8K
Last 4 hours, Nov 8 02:50 – 06:45 UTC
$BTC is at $75,786, up 0.12% from $75,692. High $75,984, low $75,692 (0.39% range). Price climbed on heavy volume between 02:55 and 03:15, peaked near $75,950 around 04:20–04:30, then faded back toward $75,790.
📊 Market context
▪
BTC is down 2.2% since Nov 1 and 5.9% since the Nov 5 open ($80,507).
▪ US spot BTC ETFs: $411.9M net outflow on Friday, $1.28B for the week, a second straight negative week that turned 2026 flows negative (per The Block).
▪ CMC Fear & Greed (Nov 7): 31 (Fear).
📈 Volume
▪ 4h volume on Crypto.com ~$2.1M: 0.12x the 7-day average 4h bar ($17.1M, skewed by the Nov 5–6 sell-off) and 0.20x the median ($10.2M). The 02:55 candle was 7% of it.
🔎 Technicals & levels
▪ RSI(14, 5m) 42. On 4h bars RSI is 41 and price is below its 20-bar average ($76,846). On daily bars RSI is 38 and price is below its 20-day average ($79,444).
▪ Resistance: $75,984 (window high), $76,252 (Nov 7 high)
▪ Support: $75,692 (window low), $75,550 (Nov 7 low)
🗓 News & Catalysts
▪ EU set up a dedicated crypto task force to crack down on Russian sanctions evasion (per PANews).
▪ A Blockchain Reporter piece argues BTC's 64-day Coinbase discount mostly reflects a USDT basis rather than US selling.
▪ Next: China CPI/PPI (Nov 9, 01:30 UTC), Fed's Bowman speaks (Nov 9, 13:40 UTC), US CPI (Nov 10, 13:30 UTC).
#BTC #JobsReportRaisesHikeOdds #viralpost #analysis #cryptouniverseofficial
$BTC climbs off the 02:50 low, then fades toward $75.8K
Last 4 hours, Nov 8 02:50 – 06:45 UTC
$BTC is at $75,786, up 0.12% from $75,692. High $75,984, low $75,692 (0.39% range). Price climbed on heavy volume between 02:55 and 03:15, peaked near $75,950 around 04:20–04:30, then faded back toward $75,790.
📊 Market context
▪
BTC is down 2.2% since Nov 1 and 5.9% since the Nov 5 open ($80,507).
▪ US spot BTC ETFs: $411.9M net outflow on Friday, $1.28B for the week, a second straight negative week that turned 2026 flows negative (per The Block).
▪ CMC Fear & Greed (Nov 7): 31 (Fear).
📈 Volume
▪ 4h volume on Crypto.com ~$2.1M: 0.12x the 7-day average 4h bar ($17.1M, skewed by the Nov 5–6 sell-off) and 0.20x the median ($10.2M). The 02:55 candle was 7% of it.
🔎 Technicals & levels
▪ RSI(14, 5m) 42. On 4h bars RSI is 41 and price is below its 20-bar average ($76,846). On daily bars RSI is 38 and price is below its 20-day average ($79,444).
▪ Resistance: $75,984 (window high), $76,252 (Nov 7 high)
▪ Support: $75,692 (window low), $75,550 (Nov 7 low)
🗓 News & Catalysts
▪ EU set up a dedicated crypto task force to crack down on Russian sanctions evasion (per PANews).
▪ A Blockchain Reporter piece argues BTC's 64-day Coinbase discount mostly reflects a USDT basis rather than US selling.
▪ Next: China CPI/PPI (Nov 9, 01:30 UTC), Fed's Bowman speaks (Nov 9, 13:40 UTC), US CPI (Nov 10, 13:30 UTC).
#BTC #JobsReportRaisesHikeOdds #viralpost #analysis #cryptouniverseofficial
Last 4 hours, Nov 8 02:50 – 06:45 UTC
$BTC is at $75,786, up 0.12% from $75,692. High $75,984, low $75,692 (0.39% range). Price climbed on heavy volume between 02:55 and 03:15, peaked near $75,950 around 04:20–04:30, then faded back toward $75,790.
📊 Market context
▪
BTC is down 2.2% since Nov 1 and 5.9% since the Nov 5 open ($80,507).
▪ US spot BTC ETFs: $411.9M net outflow on Friday, $1.28B for the week, a second straight negative week that turned 2026 flows negative (per The Block).
▪ CMC Fear & Greed (Nov 7): 31 (Fear).
📈 Volume
▪ 4h volume on Crypto.com ~$2.1M: 0.12x the 7-day average 4h bar ($17.1M, skewed by the Nov 5–6 sell-off) and 0.20x the median ($10.2M). The 02:55 candle was 7% of it.
🔎 Technicals & levels
▪ RSI(14, 5m) 42. On 4h bars RSI is 41 and price is below its 20-bar average ($76,846). On daily bars RSI is 38 and price is below its 20-day average ($79,444).
▪ Resistance: $75,984 (window high), $76,252 (Nov 7 high)
▪ Support: $75,692 (window low), $75,550 (Nov 7 low)
🗓 News & Catalysts
▪ EU set up a dedicated crypto task force to crack down on Russian sanctions evasion (per PANews).
▪ A Blockchain Reporter piece argues BTC's 64-day Coinbase discount mostly reflects a USDT basis rather than US selling.
▪ Next: China CPI/PPI (Nov 9, 01:30 UTC), Fed's Bowman speaks (Nov 9, 13:40 UTC), US CPI (Nov 10, 13:30 UTC).
#BTC #JobsReportRaisesHikeOdds #viralpost #analysis #cryptouniverseofficial
1
97
·
--
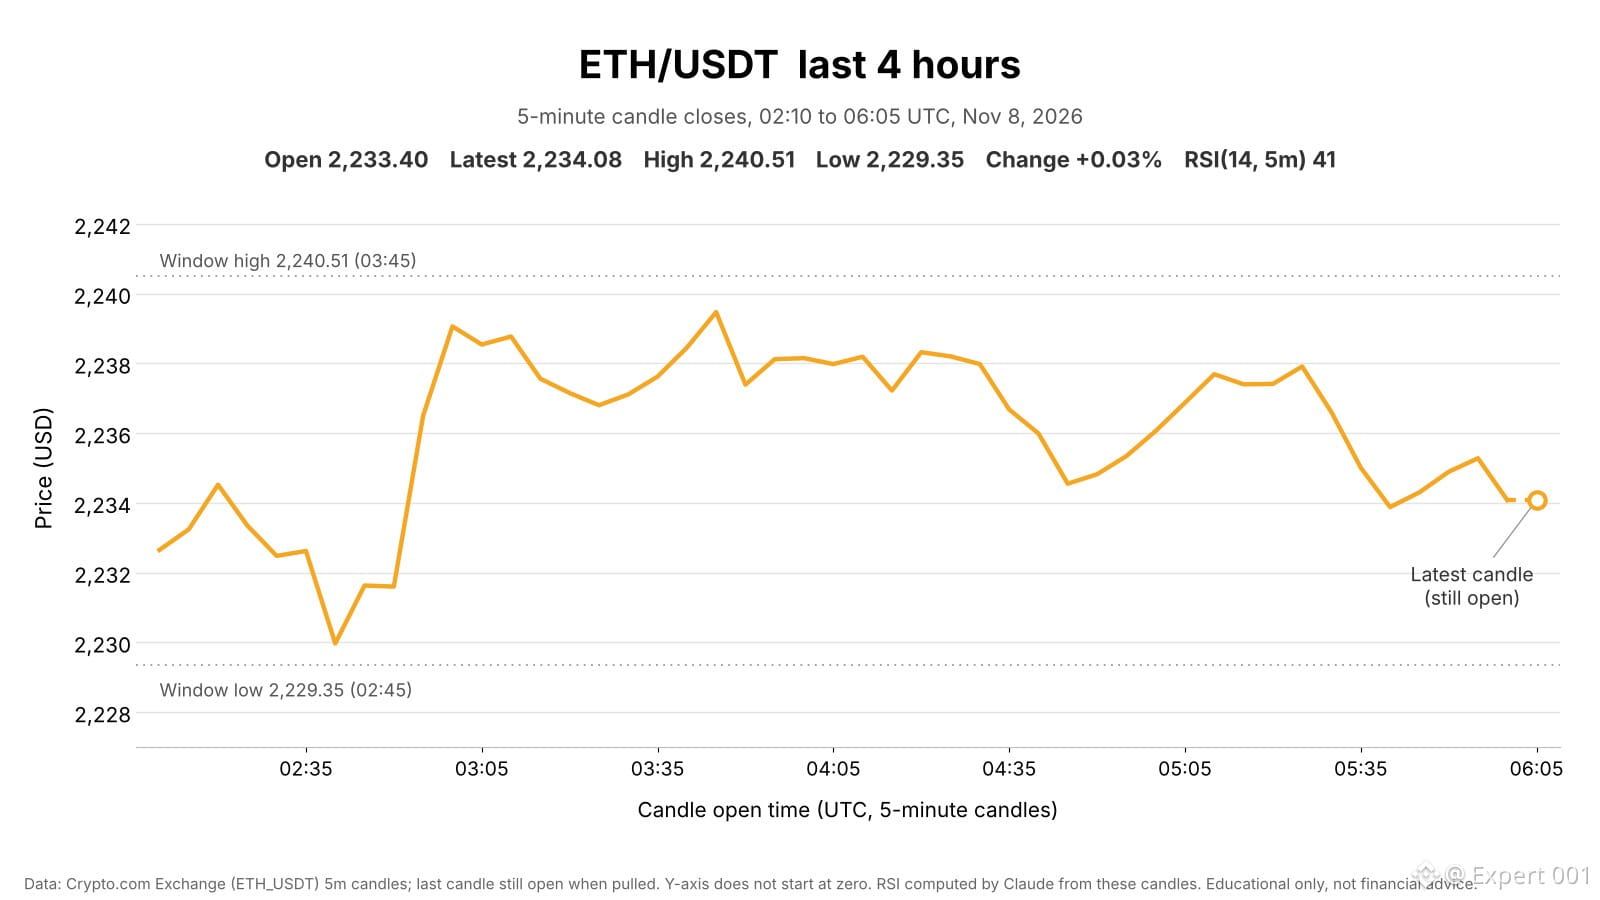
$ETH round-trips: dips to $2,229, jumps to $2,239, ends flat
Last 4 hours, Nov 8 02:10 – 06:05 UTC
ETH is at $2,234.08, up 0.03% from $2,233.40. High $2,240.51, low $2,229.35 (0.50% range). Price dipped to the low at 02:45, jumped to ~$2,239 by 03:00 on the window's heaviest volume, then drifted back to $2,234.
📊 Market context
▪ BTC +0.08% over the same 4h. ETH lagged by 0.05 pts.
▪ US spot ETH ETFs: $93.2M net outflow on Friday, $365.3M for the week, a sixth straight negative week (per The Block).
▪ CMC Fear & Greed (Nov 7): 31 (Fear).
📈 Volume
▪ 4h volume on Crypto.com ~$1.5M: 0.21x the 7-day average 4h bar ($7.4M, skewed by the Nov 5–6 sell-off) and 0.33x the median ($4.7M). The 02:55 candle was 8% of it.
🔎 Technicals & levels
▪ RSI(14, 5m) 41. On 4h bars RSI is 42 and price is below its 20-bar average ($2,277). On daily bars RSI is 39 and price is below its 20-day average ($2,326).
▪ Resistance: $2,240.51 (window high), $2,251.39 (Nov 7 high)
▪ Support: $2,229.35 (window low), $2,222.51 (Nov 7 low)
🗓 News & Catalysts
▪ Amundi put a European equity fund share class on Ethereum (per NewsBTC).
▪ Next: China CPI/PPI (Nov 9, 01:30 UTC), Fed's Bowman speaks (Nov 9, 13:40 UTC), US CPI (Nov 10, 13:30 UTC).
#JobsReportRaisesHikeOdds #viralpost
{spot}(ETHUSDT)
#Ethereum #analysis
$ETH round-trips: dips to $2,229, jumps to $2,239, ends flat
Last 4 hours, Nov 8 02:10 – 06:05 UTC
ETH is at $2,234.08, up 0.03% from $2,233.40. High $2,240.51, low $2,229.35 (0.50% range). Price dipped to the low at 02:45, jumped to ~$2,239 by 03:00 on the window's heaviest volume, then drifted back to $2,234.
📊 Market context
▪ BTC +0.08% over the same 4h. ETH lagged by 0.05 pts.
▪ US spot ETH ETFs: $93.2M net outflow on Friday, $365.3M for the week, a sixth straight negative week (per The Block).
▪ CMC Fear & Greed (Nov 7): 31 (Fear).
📈 Volume
▪ 4h volume on Crypto.com ~$1.5M: 0.21x the 7-day average 4h bar ($7.4M, skewed by the Nov 5–6 sell-off) and 0.33x the median ($4.7M). The 02:55 candle was 8% of it.
🔎 Technicals & levels
▪ RSI(14, 5m) 41. On 4h bars RSI is 42 and price is below its 20-bar average ($2,277). On daily bars RSI is 39 and price is below its 20-day average ($2,326).
▪ Resistance: $2,240.51 (window high), $2,251.39 (Nov 7 high)
▪ Support: $2,229.35 (window low), $2,222.51 (Nov 7 low)
🗓 News & Catalysts
▪ Amundi put a European equity fund share class on Ethereum (per NewsBTC).
▪ Next: China CPI/PPI (Nov 9, 01:30 UTC), Fed's Bowman speaks (Nov 9, 13:40 UTC), US CPI (Nov 10, 13:30 UTC).
#JobsReportRaisesHikeOdds #viralpost
#Ethereum #analysis
Last 4 hours, Nov 8 02:10 – 06:05 UTC
ETH is at $2,234.08, up 0.03% from $2,233.40. High $2,240.51, low $2,229.35 (0.50% range). Price dipped to the low at 02:45, jumped to ~$2,239 by 03:00 on the window's heaviest volume, then drifted back to $2,234.
📊 Market context
▪ BTC +0.08% over the same 4h. ETH lagged by 0.05 pts.
▪ US spot ETH ETFs: $93.2M net outflow on Friday, $365.3M for the week, a sixth straight negative week (per The Block).
▪ CMC Fear & Greed (Nov 7): 31 (Fear).
📈 Volume
▪ 4h volume on Crypto.com ~$1.5M: 0.21x the 7-day average 4h bar ($7.4M, skewed by the Nov 5–6 sell-off) and 0.33x the median ($4.7M). The 02:55 candle was 8% of it.
🔎 Technicals & levels
▪ RSI(14, 5m) 41. On 4h bars RSI is 42 and price is below its 20-bar average ($2,277). On daily bars RSI is 39 and price is below its 20-day average ($2,326).
▪ Resistance: $2,240.51 (window high), $2,251.39 (Nov 7 high)
▪ Support: $2,229.35 (window low), $2,222.51 (Nov 7 low)
🗓 News & Catalysts
▪ Amundi put a European equity fund share class on Ethereum (per NewsBTC).
▪ Next: China CPI/PPI (Nov 9, 01:30 UTC), Fed's Bowman speaks (Nov 9, 13:40 UTC), US CPI (Nov 10, 13:30 UTC).
#JobsReportRaisesHikeOdds #viralpost
#Ethereum #analysis
1
122
·
--
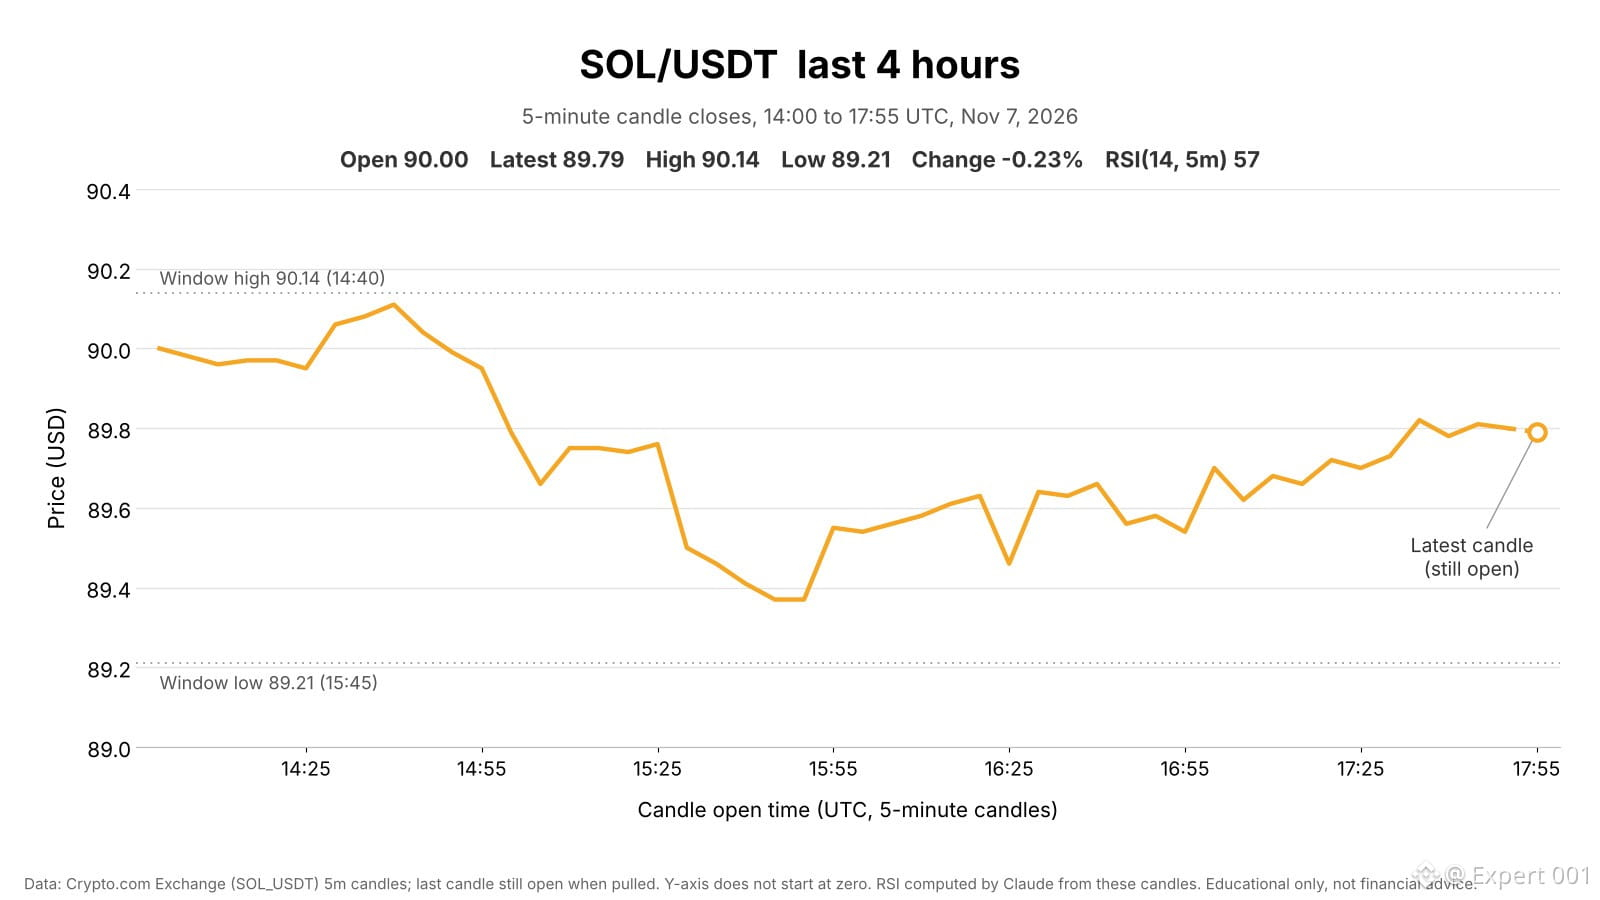
$SOL slips to $89.4, then regains about half
Last 4 hours, Nov 7 14:00 – 17:55 UTC
SOL is at $89.79, down 0.23% from $90.00. High $90.14, low $89.21 (1.04% range). Price held $89.95–$90.11 until ~15:00, slid to $89.37 by 15:45 (the window's heaviest volume), then regained about half of the drop.
📊 Market context
▪ Total crypto market cap -0.17% in 4h, BTC -0.12%. SOL lagged BTC by 0.12 pts.
▪ SOL -6.6% over 7 days, -5.1% this week after three straight weekly declines. It trails BTC by 4.4 pts over 7 days and 10.1 pts over 30 days.
▪ CMC Fear & Greed (daily): 31 (Fear), down from 61 a month ago.
▪ US spot SOL ETFs: $26.3M net outflow last week, nearly all on Friday, five straight negative weeks totaling $165.4M (per The Block).
📈 Volume
▪ 4h volume on Crypto.com ~$0.54M: 0.33x the 7-day average 4h bar ($1.6M, skewed by the Nov 5–6 sell-off) and 0.45x the median ($1.2M). The 15:45 candle was 11% of it.
🔎 Technicals & levels
▪ RSI(14, 5m) 57. On 4h bars RSI is 37.6 and price is below its 20-bar average ($91.85). On daily bars price is below its 20-day ($98.86) and 50-day ($108.16) averages.
▪ Resistance: $90.14 (window high, also the nearest 4h resistance per CMC)
▪ Support: $89.21 (window low), $88.48 (4h bars, per CMC)
🗓 News & Catalysts
▪ Samsung Wallet's USDC account on Solana went live Nov 2 for eligible US Galaxy users (per a Solana Foundation update, via TradingView News).
▪ Next: China CPI/PPI (Nov 9, 01:30 UTC), Fed's Bowman speaks (Nov 9, 13:40 UTC), US CPI (Nov 10, 13:30 UTC).
#solana #viralpost #cryptouniverseofficial #JobsReportRaisesHikeOdds #analysis
{spot}(SOLUSDT)
$SOL slips to $89.4, then regains about half
Last 4 hours, Nov 7 14:00 – 17:55 UTC
SOL is at $89.79, down 0.23% from $90.00. High $90.14, low $89.21 (1.04% range). Price held $89.95–$90.11 until ~15:00, slid to $89.37 by 15:45 (the window's heaviest volume), then regained about half of the drop.
📊 Market context
▪ Total crypto market cap -0.17% in 4h, BTC -0.12%. SOL lagged BTC by 0.12 pts.
▪ SOL -6.6% over 7 days, -5.1% this week after three straight weekly declines. It trails BTC by 4.4 pts over 7 days and 10.1 pts over 30 days.
▪ CMC Fear & Greed (daily): 31 (Fear), down from 61 a month ago.
▪ US spot SOL ETFs: $26.3M net outflow last week, nearly all on Friday, five straight negative weeks totaling $165.4M (per The Block).
📈 Volume
▪ 4h volume on Crypto.com ~$0.54M: 0.33x the 7-day average 4h bar ($1.6M, skewed by the Nov 5–6 sell-off) and 0.45x the median ($1.2M). The 15:45 candle was 11% of it.
🔎 Technicals & levels
▪ RSI(14, 5m) 57. On 4h bars RSI is 37.6 and price is below its 20-bar average ($91.85). On daily bars price is below its 20-day ($98.86) and 50-day ($108.16) averages.
▪ Resistance: $90.14 (window high, also the nearest 4h resistance per CMC)
▪ Support: $89.21 (window low), $88.48 (4h bars, per CMC)
🗓 News & Catalysts
▪ Samsung Wallet's USDC account on Solana went live Nov 2 for eligible US Galaxy users (per a Solana Foundation update, via TradingView News).
▪ Next: China CPI/PPI (Nov 9, 01:30 UTC), Fed's Bowman speaks (Nov 9, 13:40 UTC), US CPI (Nov 10, 13:30 UTC).
#solana #viralpost #cryptouniverseofficial #JobsReportRaisesHikeOdds #analysis
Last 4 hours, Nov 7 14:00 – 17:55 UTC
SOL is at $89.79, down 0.23% from $90.00. High $90.14, low $89.21 (1.04% range). Price held $89.95–$90.11 until ~15:00, slid to $89.37 by 15:45 (the window's heaviest volume), then regained about half of the drop.
📊 Market context
▪ Total crypto market cap -0.17% in 4h, BTC -0.12%. SOL lagged BTC by 0.12 pts.
▪ SOL -6.6% over 7 days, -5.1% this week after three straight weekly declines. It trails BTC by 4.4 pts over 7 days and 10.1 pts over 30 days.
▪ CMC Fear & Greed (daily): 31 (Fear), down from 61 a month ago.
▪ US spot SOL ETFs: $26.3M net outflow last week, nearly all on Friday, five straight negative weeks totaling $165.4M (per The Block).
📈 Volume
▪ 4h volume on Crypto.com ~$0.54M: 0.33x the 7-day average 4h bar ($1.6M, skewed by the Nov 5–6 sell-off) and 0.45x the median ($1.2M). The 15:45 candle was 11% of it.
🔎 Technicals & levels
▪ RSI(14, 5m) 57. On 4h bars RSI is 37.6 and price is below its 20-bar average ($91.85). On daily bars price is below its 20-day ($98.86) and 50-day ($108.16) averages.
▪ Resistance: $90.14 (window high, also the nearest 4h resistance per CMC)
▪ Support: $89.21 (window low), $88.48 (4h bars, per CMC)
🗓 News & Catalysts
▪ Samsung Wallet's USDC account on Solana went live Nov 2 for eligible US Galaxy users (per a Solana Foundation update, via TradingView News).
▪ Next: China CPI/PPI (Nov 9, 01:30 UTC), Fed's Bowman speaks (Nov 9, 13:40 UTC), US CPI (Nov 10, 13:30 UTC).
#solana #viralpost #cryptouniverseofficial #JobsReportRaisesHikeOdds #analysis
1
56
·
--
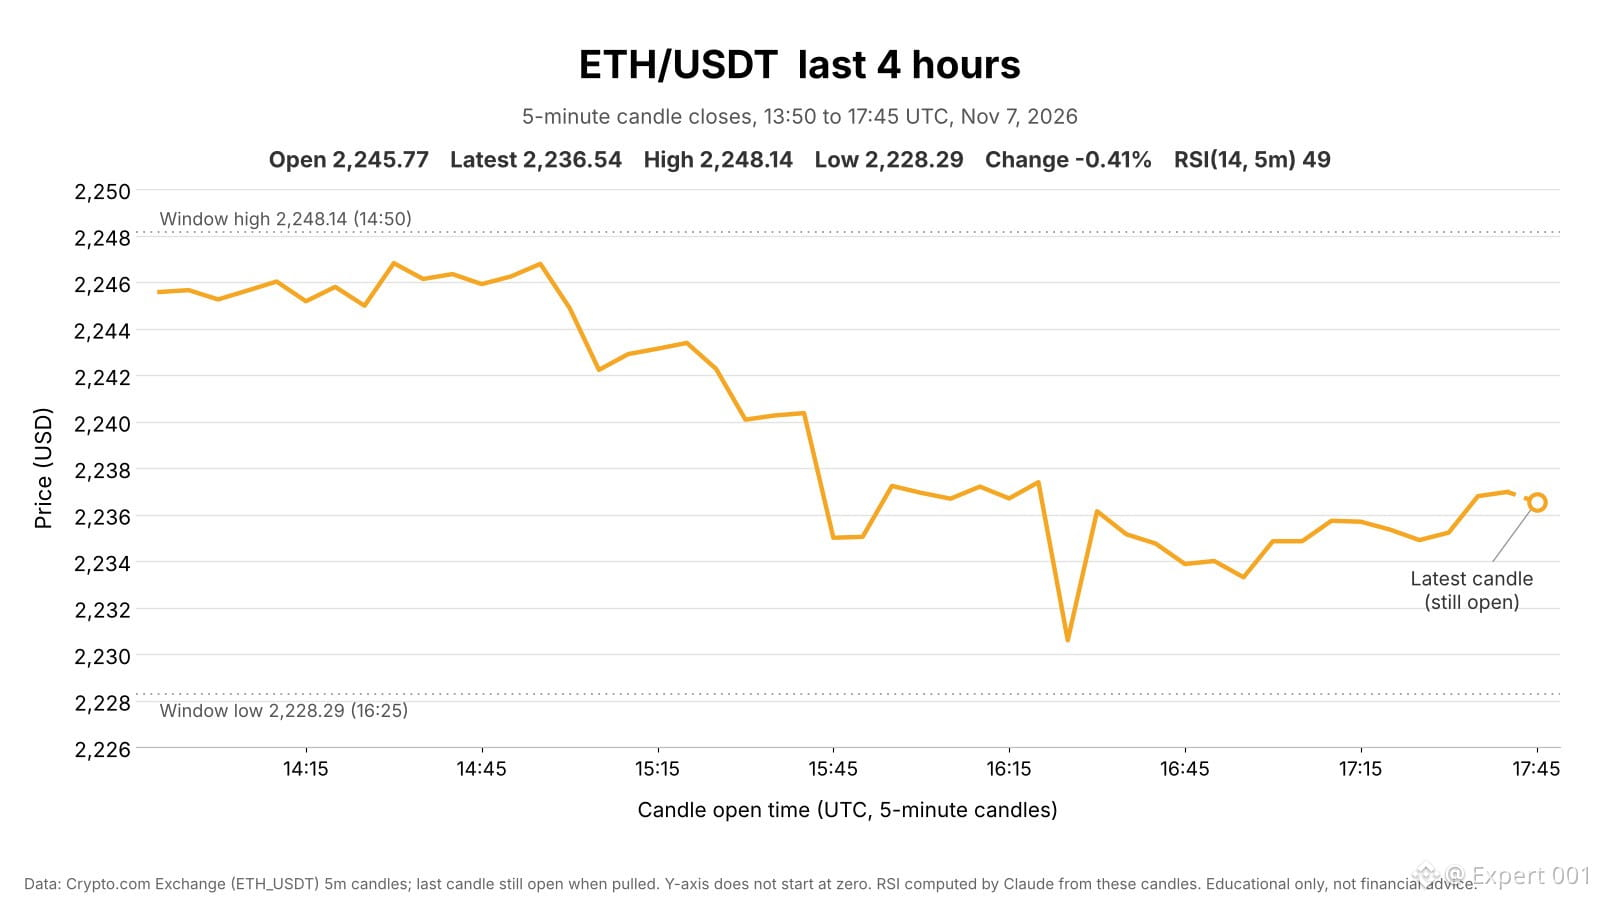
$ETH steps down in two legs, then holds near $2,236
Last 4 hours, Nov 7 13:50 – 17:45 UTC
ETH is at $2,236.54, down 0.41% from $2,245.77. High $2,248.14, low $2,228.29 (0.89% range). Price held $2,245–$2,247 until ~14:55, slid to $2,235 by 15:45 on heavy volume, dipped to the low at 16:25, then held $2,233–$2,237.
📊 Market context
▪ Total crypto market cap -0.16% in 4h, BTC -0.13%. ETH lagged BTC by 0.24 pts.
▪ ETH +0.7% over 24h, -0.8% over 7 days. CMC Fear & Greed (daily): 31 (Fear), down from 61 a month ago.
▪ US spot ETH ETFs: $93.3M net outflow on the latest settled day, $365.2M over five sessions.
📈 Volume
▪ 4h volume on Crypto.com ~$2.1M: 0.29x the 7-day average 4h bar ($7.4M, skewed by the Nov 5–6 sell-off) and 0.46x the median ($4.7M). The 15:45 candle alone was 15% of it.
🔎 Technicals & levels
▪ RSI(14, 5m) 49. On 1h bars RSI is 41 and price is below its 20-bar average ($2,240.74). On 4h bars price is below its 20-bar average ($2,295.92).
▪ Resistance: $2,243.74 (session high, per CMC), $2,248.14 (window high)
▪ Support: $2,228.94 (4h bars, tested twice, per CMC), $2,228.29 (window low)
🗓 News & Catalysts
▪ Ethereum developers postponed the next Glamsterdam hard-fork step on the Hoodi testnet over gas-accounting compatibility issues, with no new date set (per TradingView News).
▪ Arkham data cited by U.Today shows whales buying more than $42M of ETH.
▪ Next: China CPI/PPI (Nov 9, 01:30 UTC), Fed's Bowman speaks (Nov 9, 13:40 UTC), US CPI (Nov 10, 13:30 UTC).#JobsReportRaisesHikeOdds #ETH #analysis #cryptouniverseofficial #viralpost
{spot}(ETHUSDT)
$ETH steps down in two legs, then holds near $2,236
Last 4 hours, Nov 7 13:50 – 17:45 UTC
ETH is at $2,236.54, down 0.41% from $2,245.77. High $2,248.14, low $2,228.29 (0.89% range). Price held $2,245–$2,247 until ~14:55, slid to $2,235 by 15:45 on heavy volume, dipped to the low at 16:25, then held $2,233–$2,237.
📊 Market context
▪ Total crypto market cap -0.16% in 4h, BTC -0.13%. ETH lagged BTC by 0.24 pts.
▪ ETH +0.7% over 24h, -0.8% over 7 days. CMC Fear & Greed (daily): 31 (Fear), down from 61 a month ago.
▪ US spot ETH ETFs: $93.3M net outflow on the latest settled day, $365.2M over five sessions.
📈 Volume
▪ 4h volume on Crypto.com ~$2.1M: 0.29x the 7-day average 4h bar ($7.4M, skewed by the Nov 5–6 sell-off) and 0.46x the median ($4.7M). The 15:45 candle alone was 15% of it.
🔎 Technicals & levels
▪ RSI(14, 5m) 49. On 1h bars RSI is 41 and price is below its 20-bar average ($2,240.74). On 4h bars price is below its 20-bar average ($2,295.92).
▪ Resistance: $2,243.74 (session high, per CMC), $2,248.14 (window high)
▪ Support: $2,228.94 (4h bars, tested twice, per CMC), $2,228.29 (window low)
🗓 News & Catalysts
▪ Ethereum developers postponed the next Glamsterdam hard-fork step on the Hoodi testnet over gas-accounting compatibility issues, with no new date set (per TradingView News).
▪ Arkham data cited by U.Today shows whales buying more than $42M of ETH.
▪ Next: China CPI/PPI (Nov 9, 01:30 UTC), Fed's Bowman speaks (Nov 9, 13:40 UTC), US CPI (Nov 10, 13:30 UTC).#JobsReportRaisesHikeOdds #ETH #analysis #cryptouniverseofficial #viralpost
Last 4 hours, Nov 7 13:50 – 17:45 UTC
ETH is at $2,236.54, down 0.41% from $2,245.77. High $2,248.14, low $2,228.29 (0.89% range). Price held $2,245–$2,247 until ~14:55, slid to $2,235 by 15:45 on heavy volume, dipped to the low at 16:25, then held $2,233–$2,237.
📊 Market context
▪ Total crypto market cap -0.16% in 4h, BTC -0.13%. ETH lagged BTC by 0.24 pts.
▪ ETH +0.7% over 24h, -0.8% over 7 days. CMC Fear & Greed (daily): 31 (Fear), down from 61 a month ago.
▪ US spot ETH ETFs: $93.3M net outflow on the latest settled day, $365.2M over five sessions.
📈 Volume
▪ 4h volume on Crypto.com ~$2.1M: 0.29x the 7-day average 4h bar ($7.4M, skewed by the Nov 5–6 sell-off) and 0.46x the median ($4.7M). The 15:45 candle alone was 15% of it.
🔎 Technicals & levels
▪ RSI(14, 5m) 49. On 1h bars RSI is 41 and price is below its 20-bar average ($2,240.74). On 4h bars price is below its 20-bar average ($2,295.92).
▪ Resistance: $2,243.74 (session high, per CMC), $2,248.14 (window high)
▪ Support: $2,228.94 (4h bars, tested twice, per CMC), $2,228.29 (window low)
🗓 News & Catalysts
▪ Ethereum developers postponed the next Glamsterdam hard-fork step on the Hoodi testnet over gas-accounting compatibility issues, with no new date set (per TradingView News).
▪ Arkham data cited by U.Today shows whales buying more than $42M of ETH.
▪ Next: China CPI/PPI (Nov 9, 01:30 UTC), Fed's Bowman speaks (Nov 9, 13:40 UTC), US CPI (Nov 10, 13:30 UTC).#JobsReportRaisesHikeOdds #ETH #analysis #cryptouniverseofficial #viralpost
1
99
·
--
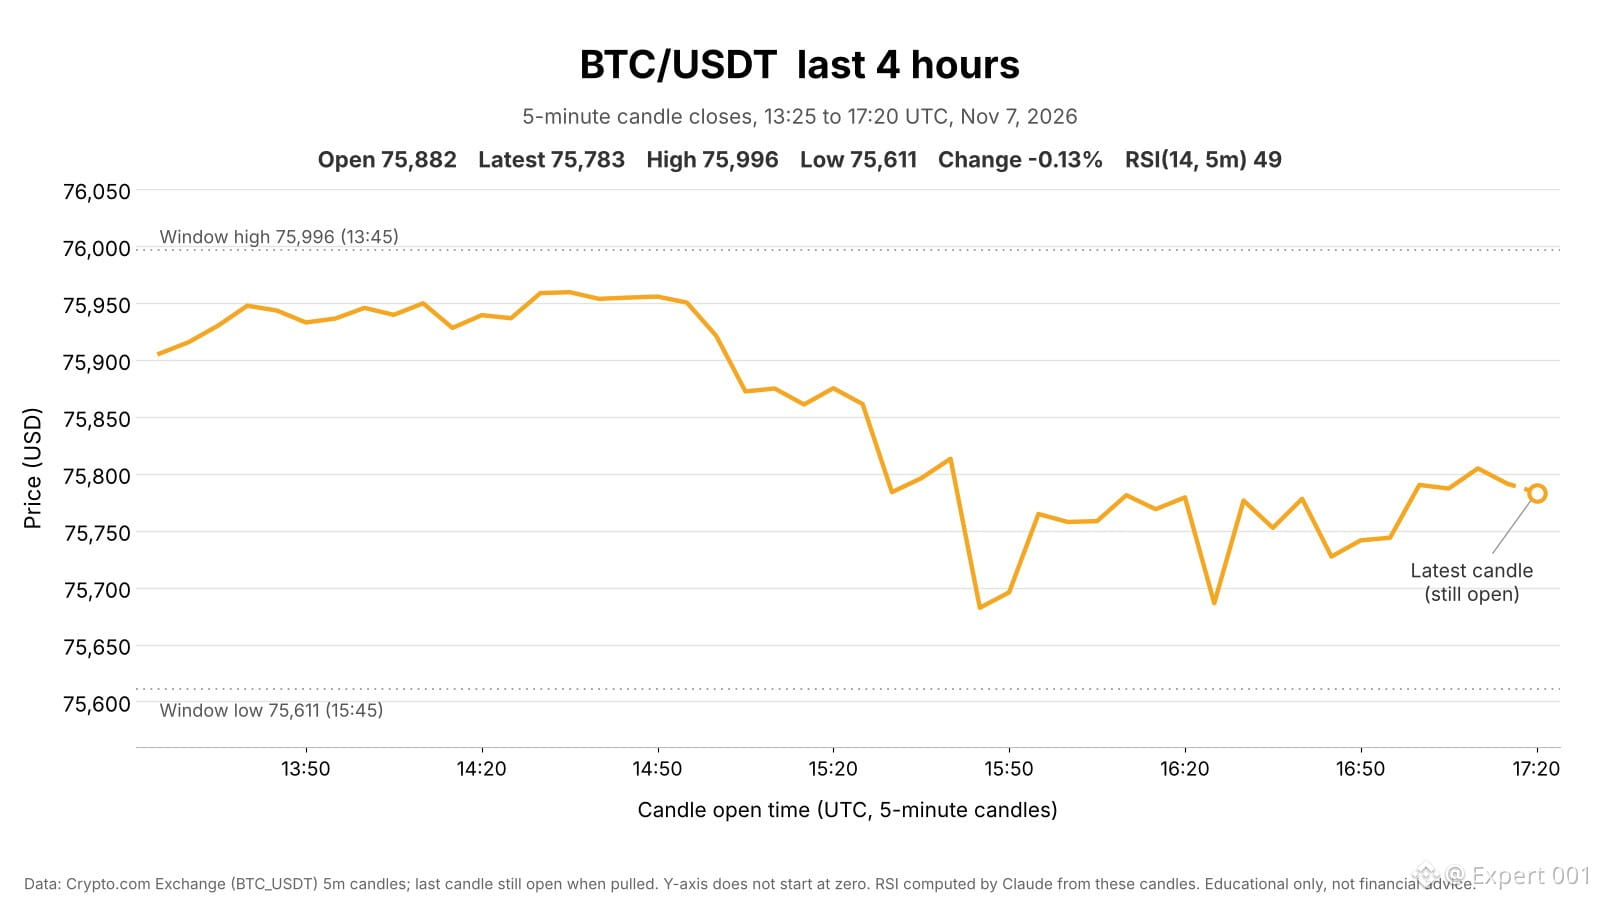
$BTC slips, then holds near $75.8K after a 15:45 flush
Last 4 hours, Nov 7 13:25 – 17:20 UTC
BTC is at $75,783, down 0.13% from $75,882. High $75,996, low $75,611 (0.51% range). Price held near $75,950 until ~14:55, slid into 15:45 (low $75,611 on the window's heaviest volume), then ranged $75,690–$75,805.
📊 Market context
▪ Total crypto market cap -0.43% over 24h. BTC -2.4% over 7 days, -6.3% over 30 days.
▪ CMC Fear & Greed (daily): 31 (Fear), down from 61 a month ago.
▪ US spot BTC ETFs: $411.9M net outflow on Nov 6 (second straight outflow day), $1.28B over five days.
📈 Volume & derivatives
▪ 4h volume on Crypto.com ~$3.8M: 0.22x the 7-day average 4h bar ($17.2M, skewed by the Nov 5–6 sell-off) and 0.37x the median ($10.2M). The 15:45 candle alone was 12% of it.
▪ BTC liquidations ~$1.72M in 4h, almost all longs ($1.67M).
🔎 Technicals & levels
▪ RSI(14, 5m) 49. On 4h bars RSI is 39 with lower highs. On daily bars RSI is 38, price is below its 20-day and 50-day averages and above its 200-day, 1.2% above its 30-day low.
▪ Resistance: $75,996 (window high), $76,470 (2 touches on 4h structure, per CMC)
▪ Support: $75,611 (window low), $74,795 (30-day low, per CMC)
🗓 News & Catalysts
▪ Next: China CPI/PPI (Nov 9, 01:30 UTC), Fed's Bowman speaks (Nov 9, 13:40 UTC), US CPI (Nov 10, 13:30 UTC).
▪ Russia finalized retail trading of BTC, ETH and USDT from Nov 17, with a $3,700 annual purchase limit. Strive bought 15,124 BTC in October (per CMC Community).
#JobsReportRaisesHikeOdds #viralpost #BTC走势分析 #analysis #cryptouniverseofficial
{spot}(BTCUSDT)
$BTC slips, then holds near $75.8K after a 15:45 flush
Last 4 hours, Nov 7 13:25 – 17:20 UTC
BTC is at $75,783, down 0.13% from $75,882. High $75,996, low $75,611 (0.51% range). Price held near $75,950 until ~14:55, slid into 15:45 (low $75,611 on the window's heaviest volume), then ranged $75,690–$75,805.
📊 Market context
▪ Total crypto market cap -0.43% over 24h. BTC -2.4% over 7 days, -6.3% over 30 days.
▪ CMC Fear & Greed (daily): 31 (Fear), down from 61 a month ago.
▪ US spot BTC ETFs: $411.9M net outflow on Nov 6 (second straight outflow day), $1.28B over five days.
📈 Volume & derivatives
▪ 4h volume on Crypto.com ~$3.8M: 0.22x the 7-day average 4h bar ($17.2M, skewed by the Nov 5–6 sell-off) and 0.37x the median ($10.2M). The 15:45 candle alone was 12% of it.
▪ BTC liquidations ~$1.72M in 4h, almost all longs ($1.67M).
🔎 Technicals & levels
▪ RSI(14, 5m) 49. On 4h bars RSI is 39 with lower highs. On daily bars RSI is 38, price is below its 20-day and 50-day averages and above its 200-day, 1.2% above its 30-day low.
▪ Resistance: $75,996 (window high), $76,470 (2 touches on 4h structure, per CMC)
▪ Support: $75,611 (window low), $74,795 (30-day low, per CMC)
🗓 News & Catalysts
▪ Next: China CPI/PPI (Nov 9, 01:30 UTC), Fed's Bowman speaks (Nov 9, 13:40 UTC), US CPI (Nov 10, 13:30 UTC).
▪ Russia finalized retail trading of BTC, ETH and USDT from Nov 17, with a $3,700 annual purchase limit. Strive bought 15,124 BTC in October (per CMC Community).
#JobsReportRaisesHikeOdds #viralpost #BTC走势分析 #analysis #cryptouniverseofficial
Last 4 hours, Nov 7 13:25 – 17:20 UTC
BTC is at $75,783, down 0.13% from $75,882. High $75,996, low $75,611 (0.51% range). Price held near $75,950 until ~14:55, slid into 15:45 (low $75,611 on the window's heaviest volume), then ranged $75,690–$75,805.
📊 Market context
▪ Total crypto market cap -0.43% over 24h. BTC -2.4% over 7 days, -6.3% over 30 days.
▪ CMC Fear & Greed (daily): 31 (Fear), down from 61 a month ago.
▪ US spot BTC ETFs: $411.9M net outflow on Nov 6 (second straight outflow day), $1.28B over five days.
📈 Volume & derivatives
▪ 4h volume on Crypto.com ~$3.8M: 0.22x the 7-day average 4h bar ($17.2M, skewed by the Nov 5–6 sell-off) and 0.37x the median ($10.2M). The 15:45 candle alone was 12% of it.
▪ BTC liquidations ~$1.72M in 4h, almost all longs ($1.67M).
🔎 Technicals & levels
▪ RSI(14, 5m) 49. On 4h bars RSI is 39 with lower highs. On daily bars RSI is 38, price is below its 20-day and 50-day averages and above its 200-day, 1.2% above its 30-day low.
▪ Resistance: $75,996 (window high), $76,470 (2 touches on 4h structure, per CMC)
▪ Support: $75,611 (window low), $74,795 (30-day low, per CMC)
🗓 News & Catalysts
▪ Next: China CPI/PPI (Nov 9, 01:30 UTC), Fed's Bowman speaks (Nov 9, 13:40 UTC), US CPI (Nov 10, 13:30 UTC).
▪ Russia finalized retail trading of BTC, ETH and USDT from Nov 17, with a $3,700 annual purchase limit. Strive bought 15,124 BTC in October (per CMC Community).
#JobsReportRaisesHikeOdds #viralpost #BTC走势分析 #analysis #cryptouniverseofficial
1
104
·
--
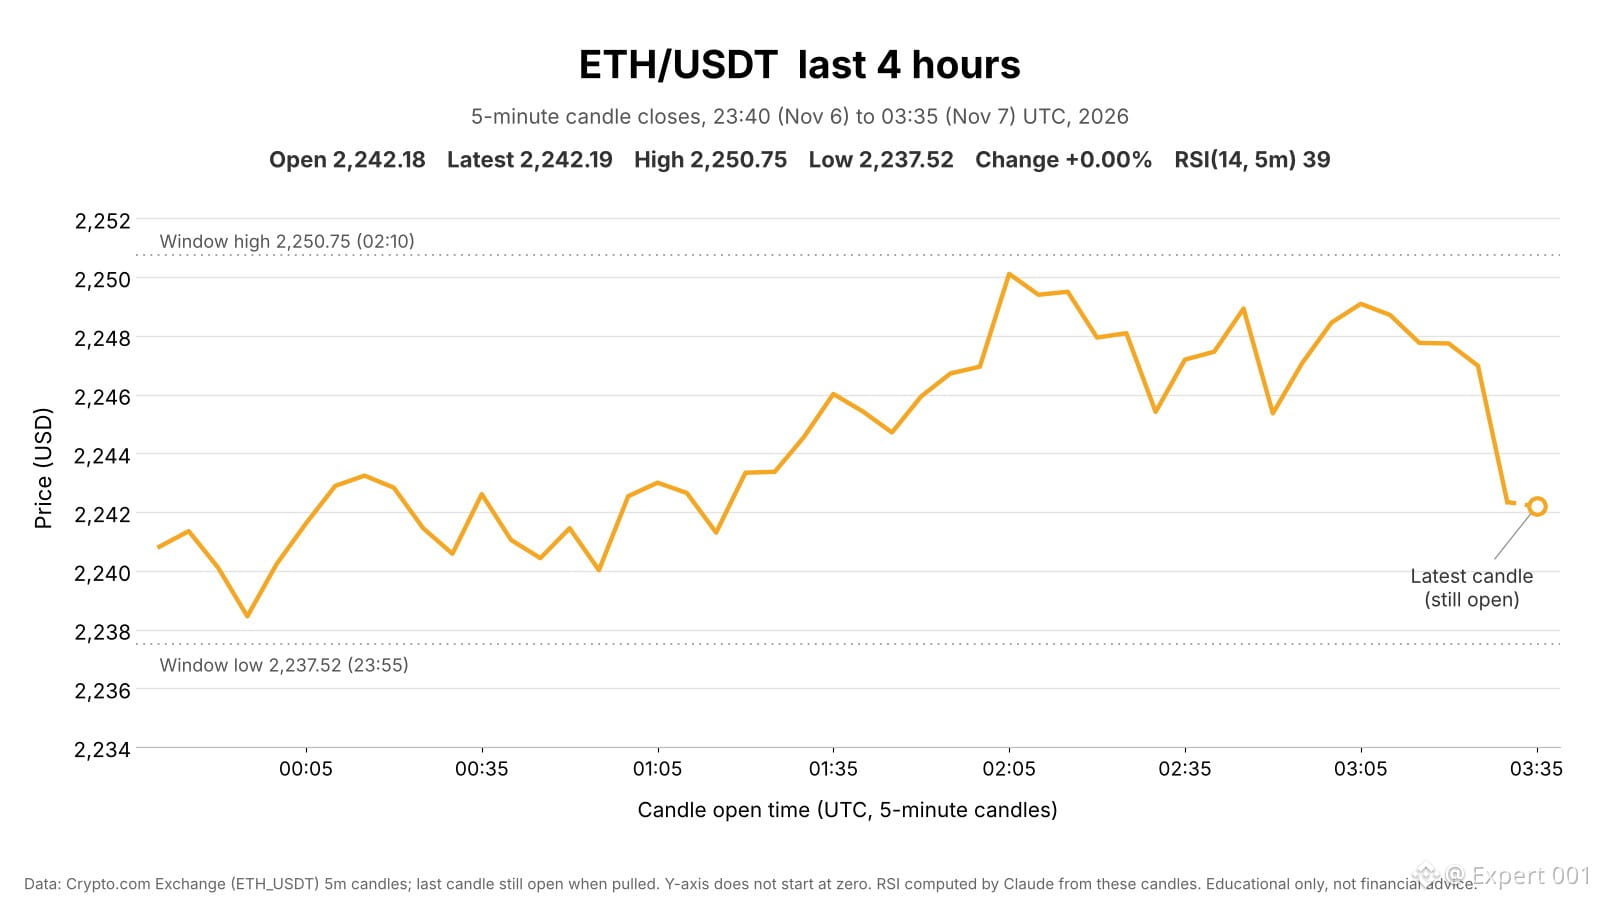
Last 4 hours, Nov 6 23:40 – Nov 7 03:35 UTC
$ETH is at $2,242.19, flat from $2,242.18 (+0.00%). High $2,250.75, low $2,237.52 (0.59% range). Price climbed from the 23:55 low to the 02:10 high, then faded back to where it started.
📊 Market context
▪ Total crypto market cap -0.08% in 4h, BTC -0.21%, Layer 1 tokens -0.67% (median). ETH beat BTC by 0.3 pts.
▪ ETH +0.5% over 24h, -1.5% this week after three straight weekly losses. CMC Fear & Greed (daily): 32 (Fear), down from 61 a month ago.
▪ US spot ETH ETFs: $3.6M net outflow on the latest settled day, $275.5M over five sessions.
📈 Volume & derivatives
▪ 4h volume on Crypto.com ~$2.1M: 0.28x the 7-day average 4h bar ($7.5M, skewed by the Nov 5 sell-off) and 0.44x the median ($4.7M).
▪ Open interest $28.3B (+0.16%), funding 0.0069% per interval (normal), liquidations 0.0% of OI. Perp net taker flow was -$17.8M vs +$0.5M in spot, so sellers led in perps.
🔎 Technicals & levels
▪ RSI(14, 5m) 39. On 4h bars RSI is 40.6 and price is below its 20-bar average ($2,303.05). On daily bars price is below its 20-day ($2,331.98) and 50-day ($2,498.67) averages and above its 200-day.
▪ Resistance: $2,252.96 (4h bars, per CMC), $2,250.75 (window high)
▪ Support: $2,237.52 (window low), $2,228.94 (4h bars, per CMC)
🗓 News & Catalysts
▪ Next: China CPI/PPI (Nov 9, 01:30 UTC), Fed's Bowman speaks (Nov 9, 13:40 UTC), US CPI (Nov 10, 13:30 UTC).#JobsReportRaisesHikeOdds #ETH #analysis #cryptouniverseofficial #viralpost
{spot}(ETHUSDT)
Last 4 hours, Nov 6 23:40 – Nov 7 03:35 UTC
$ETH is at $2,242.19, flat from $2,242.18 (+0.00%). High $2,250.75, low $2,237.52 (0.59% range). Price climbed from the 23:55 low to the 02:10 high, then faded back to where it started.
📊 Market context
▪ Total crypto market cap -0.08% in 4h, BTC -0.21%, Layer 1 tokens -0.67% (median). ETH beat BTC by 0.3 pts.
▪ ETH +0.5% over 24h, -1.5% this week after three straight weekly losses. CMC Fear & Greed (daily): 32 (Fear), down from 61 a month ago.
▪ US spot ETH ETFs: $3.6M net outflow on the latest settled day, $275.5M over five sessions.
📈 Volume & derivatives
▪ 4h volume on Crypto.com ~$2.1M: 0.28x the 7-day average 4h bar ($7.5M, skewed by the Nov 5 sell-off) and 0.44x the median ($4.7M).
▪ Open interest $28.3B (+0.16%), funding 0.0069% per interval (normal), liquidations 0.0% of OI. Perp net taker flow was -$17.8M vs +$0.5M in spot, so sellers led in perps.
🔎 Technicals & levels
▪ RSI(14, 5m) 39. On 4h bars RSI is 40.6 and price is below its 20-bar average ($2,303.05). On daily bars price is below its 20-day ($2,331.98) and 50-day ($2,498.67) averages and above its 200-day.
▪ Resistance: $2,252.96 (4h bars, per CMC), $2,250.75 (window high)
▪ Support: $2,237.52 (window low), $2,228.94 (4h bars, per CMC)
🗓 News & Catalysts
▪ Next: China CPI/PPI (Nov 9, 01:30 UTC), Fed's Bowman speaks (Nov 9, 13:40 UTC), US CPI (Nov 10, 13:30 UTC).#JobsReportRaisesHikeOdds #ETH #analysis #cryptouniverseofficial #viralpost
$ETH is at $2,242.19, flat from $2,242.18 (+0.00%). High $2,250.75, low $2,237.52 (0.59% range). Price climbed from the 23:55 low to the 02:10 high, then faded back to where it started.
📊 Market context
▪ Total crypto market cap -0.08% in 4h, BTC -0.21%, Layer 1 tokens -0.67% (median). ETH beat BTC by 0.3 pts.
▪ ETH +0.5% over 24h, -1.5% this week after three straight weekly losses. CMC Fear & Greed (daily): 32 (Fear), down from 61 a month ago.
▪ US spot ETH ETFs: $3.6M net outflow on the latest settled day, $275.5M over five sessions.
📈 Volume & derivatives
▪ 4h volume on Crypto.com ~$2.1M: 0.28x the 7-day average 4h bar ($7.5M, skewed by the Nov 5 sell-off) and 0.44x the median ($4.7M).
▪ Open interest $28.3B (+0.16%), funding 0.0069% per interval (normal), liquidations 0.0% of OI. Perp net taker flow was -$17.8M vs +$0.5M in spot, so sellers led in perps.
🔎 Technicals & levels
▪ RSI(14, 5m) 39. On 4h bars RSI is 40.6 and price is below its 20-bar average ($2,303.05). On daily bars price is below its 20-day ($2,331.98) and 50-day ($2,498.67) averages and above its 200-day.
▪ Resistance: $2,252.96 (4h bars, per CMC), $2,250.75 (window high)
▪ Support: $2,237.52 (window low), $2,228.94 (4h bars, per CMC)
🗓 News & Catalysts
▪ Next: China CPI/PPI (Nov 9, 01:30 UTC), Fed's Bowman speaks (Nov 9, 13:40 UTC), US CPI (Nov 10, 13:30 UTC).#JobsReportRaisesHikeOdds #ETH #analysis #cryptouniverseofficial #viralpost
2
1
89
·
--
$BTC drifts sideways near $76K
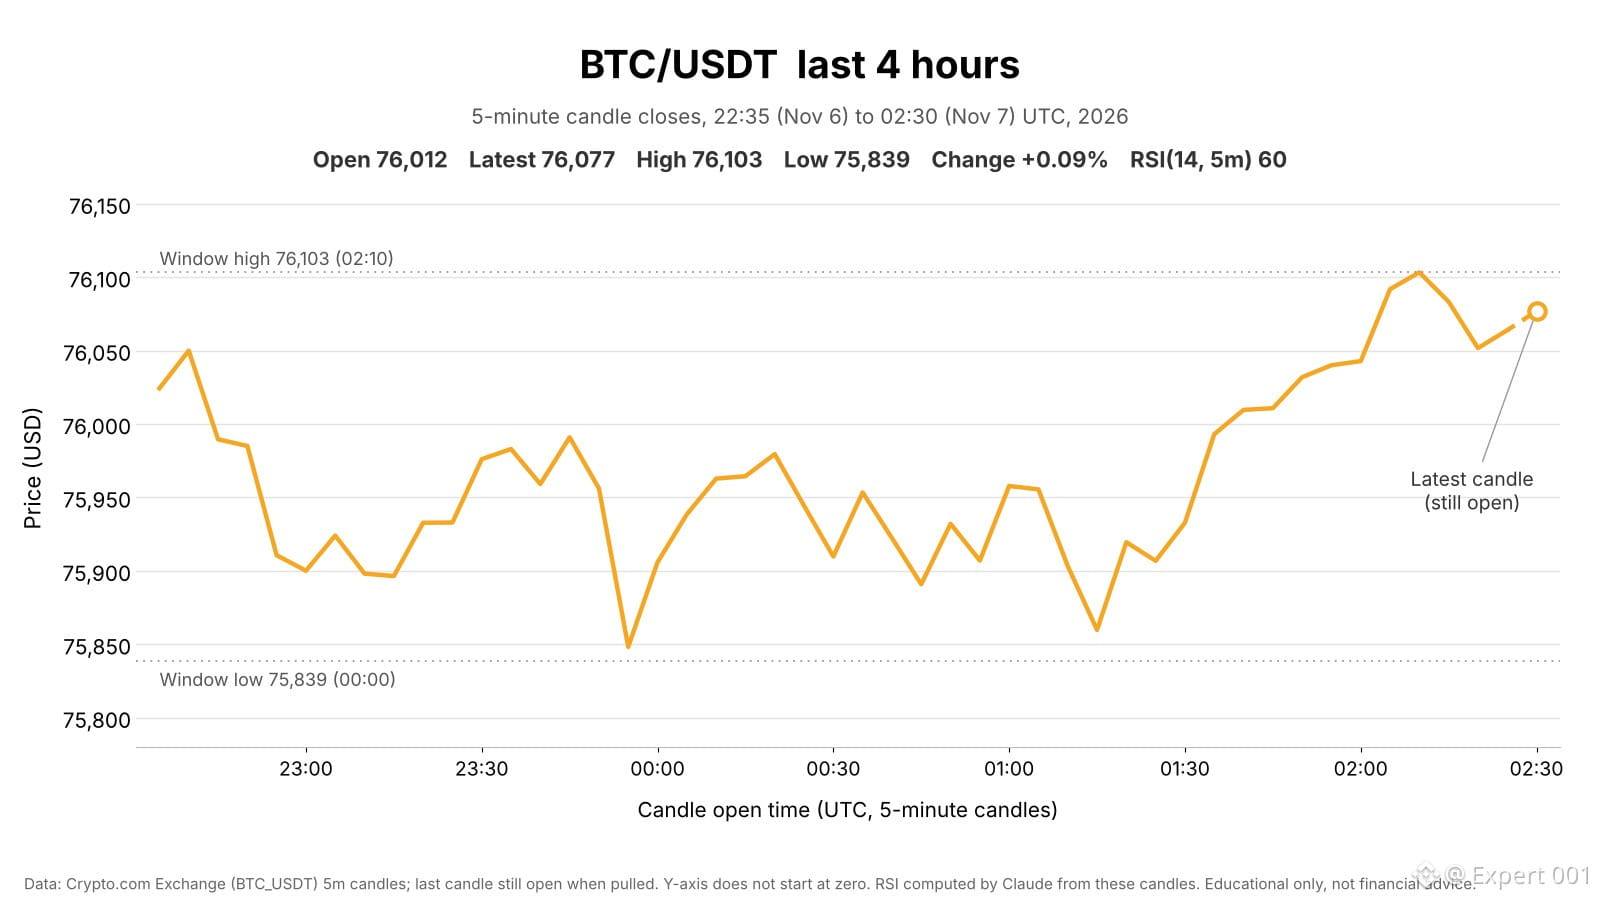
Last 4 hours, Nov 6 22:35 – Nov 7 02:30 UTC
BTC is at $76,077, up 0.09% from $76,012. High $76,103, low $75,839 (0.35% range). Price dipped to the low at 00:00, climbed into 02:10 and held near the high.
📊 Market context
▪ Total crypto market cap +0.04% in 4h. Nasdaq 100 proxy +0.04%, S&P 500 +0.02%, gold -0.01%, US dollar +0.12%. US stocks are closed for the weekend.
▪ BTC is down 1.6% over 7 days. CMC Fear & Greed (daily): 32 (Fear), down from 61 a month ago.
▪ US spot BTC ETFs: $8.9M net outflow on Nov 6 (10 of 12 funds reported), $878.7M over five days.
📈 Volume & derivatives
▪ 4h volume on Crypto.com ~$4.6M: 0.26x the 7-day average 4h bar ($17.8M, skewed by the Nov 5–6 sell-off) and 0.41x the median ($11.3M).
▪ Open interest -0.1%, funding +0.006% and stable, liquidations negligible (0.0% of OI). Sellers were the more aggressive side in spot and perps.
🔎 Technicals & levels
▪ RSI(14, 5m) 60. On 4h bars RSI is 38 and price is below its 20-bar average ($77,585). On 1h bars price is back above its 20-bar average ($75,771). On daily bars price is below its 20-day ($79,644) and 50-day ($81,975) averages.
▪ Resistance: $76,271 (rejected price 3x on 4h bars, per CMC), $76,103 (window high)
▪ Support: $75,839 (window low), $75,628 (4h bars, per CMC)
🗓 News & Catalysts
▪ Next: China CPI/PPI (Nov 9, 01:30 UTC), Fed's Bowman speaks (Nov 9, 13:40 UTC), US CPI (Nov 10, 13:30 UTC).
▪ Russia's central bank finalized retail trading of BTC, ETH and USDT from Nov 17, with a $3,700 annual purchase limit (per CMC).
Crypto.com, CoinMarketCap. Not financial advice.#JobsReportRaisesHikeOdds #BTC走势分析 #analysis #cryptouniverseofficial
{spot}(BTCUSDT)
$BTC drifts sideways near $76K
Last 4 hours, Nov 6 22:35 – Nov 7 02:30 UTC
BTC is at $76,077, up 0.09% from $76,012. High $76,103, low $75,839 (0.35% range). Price dipped to the low at 00:00, climbed into 02:10 and held near the high.
📊 Market context
▪ Total crypto market cap +0.04% in 4h. Nasdaq 100 proxy +0.04%, S&P 500 +0.02%, gold -0.01%, US dollar +0.12%. US stocks are closed for the weekend.
▪ BTC is down 1.6% over 7 days. CMC Fear & Greed (daily): 32 (Fear), down from 61 a month ago.
▪ US spot BTC ETFs: $8.9M net outflow on Nov 6 (10 of 12 funds reported), $878.7M over five days.
📈 Volume & derivatives
▪ 4h volume on Crypto.com ~$4.6M: 0.26x the 7-day average 4h bar ($17.8M, skewed by the Nov 5–6 sell-off) and 0.41x the median ($11.3M).
▪ Open interest -0.1%, funding +0.006% and stable, liquidations negligible (0.0% of OI). Sellers were the more aggressive side in spot and perps.
🔎 Technicals & levels
▪ RSI(14, 5m) 60. On 4h bars RSI is 38 and price is below its 20-bar average ($77,585). On 1h bars price is back above its 20-bar average ($75,771). On daily bars price is below its 20-day ($79,644) and 50-day ($81,975) averages.
▪ Resistance: $76,271 (rejected price 3x on 4h bars, per CMC), $76,103 (window high)
▪ Support: $75,839 (window low), $75,628 (4h bars, per CMC)
🗓 News & Catalysts
▪ Next: China CPI/PPI (Nov 9, 01:30 UTC), Fed's Bowman speaks (Nov 9, 13:40 UTC), US CPI (Nov 10, 13:30 UTC).
▪ Russia's central bank finalized retail trading of BTC, ETH and USDT from Nov 17, with a $3,700 annual purchase limit (per CMC).
Crypto.com, CoinMarketCap. Not financial advice.#JobsReportRaisesHikeOdds #BTC走势分析 #analysis #cryptouniverseofficial
Last 4 hours, Nov 6 22:35 – Nov 7 02:30 UTC
BTC is at $76,077, up 0.09% from $76,012. High $76,103, low $75,839 (0.35% range). Price dipped to the low at 00:00, climbed into 02:10 and held near the high.
📊 Market context
▪ Total crypto market cap +0.04% in 4h. Nasdaq 100 proxy +0.04%, S&P 500 +0.02%, gold -0.01%, US dollar +0.12%. US stocks are closed for the weekend.
▪ BTC is down 1.6% over 7 days. CMC Fear & Greed (daily): 32 (Fear), down from 61 a month ago.
▪ US spot BTC ETFs: $8.9M net outflow on Nov 6 (10 of 12 funds reported), $878.7M over five days.
📈 Volume & derivatives
▪ 4h volume on Crypto.com ~$4.6M: 0.26x the 7-day average 4h bar ($17.8M, skewed by the Nov 5–6 sell-off) and 0.41x the median ($11.3M).
▪ Open interest -0.1%, funding +0.006% and stable, liquidations negligible (0.0% of OI). Sellers were the more aggressive side in spot and perps.
🔎 Technicals & levels
▪ RSI(14, 5m) 60. On 4h bars RSI is 38 and price is below its 20-bar average ($77,585). On 1h bars price is back above its 20-bar average ($75,771). On daily bars price is below its 20-day ($79,644) and 50-day ($81,975) averages.
▪ Resistance: $76,271 (rejected price 3x on 4h bars, per CMC), $76,103 (window high)
▪ Support: $75,839 (window low), $75,628 (4h bars, per CMC)
🗓 News & Catalysts
▪ Next: China CPI/PPI (Nov 9, 01:30 UTC), Fed's Bowman speaks (Nov 9, 13:40 UTC), US CPI (Nov 10, 13:30 UTC).
▪ Russia's central bank finalized retail trading of BTC, ETH and USDT from Nov 17, with a $3,700 annual purchase limit (per CMC).
Crypto.com, CoinMarketCap. Not financial advice.#JobsReportRaisesHikeOdds #BTC走势分析 #analysis #cryptouniverseofficial
1
109
·
--
$BTC BTC edges higher, stalls under $76.4K
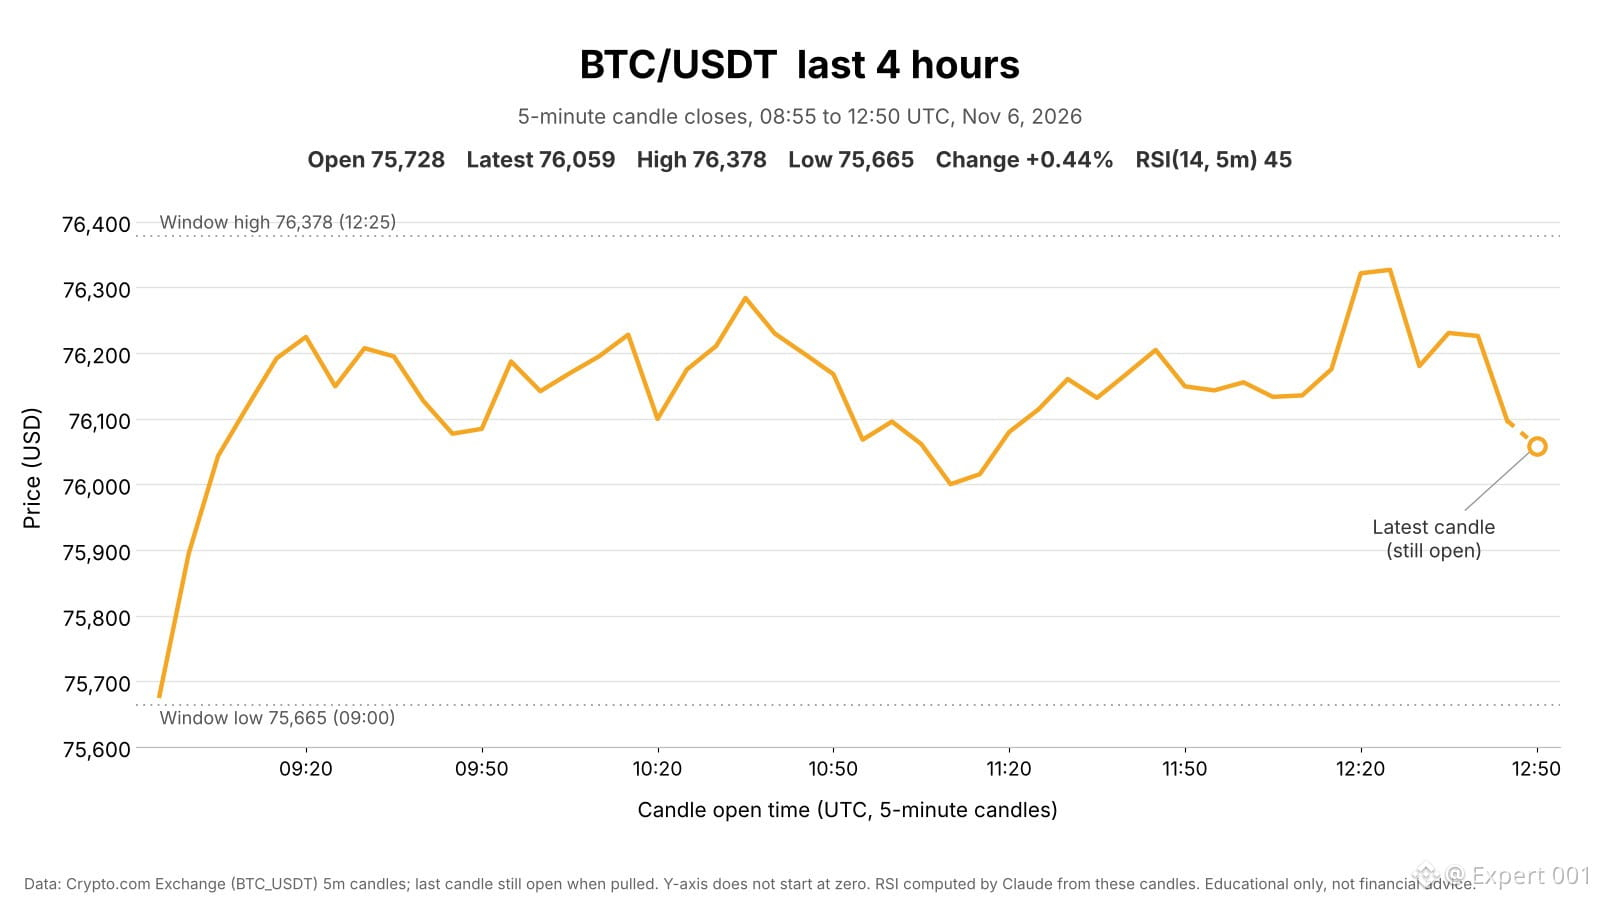
Last 4 hours, Nov 6, 08:55–12:50 UTC
BTC is at $76,059, up 0.44% from $75,728. High $76,378, low $75,665. Most of the gain came right after 09:00. Since then price has ranged roughly $76,000–$76,330.
📊 Market context
▪ Total crypto market cap +0.7% in 4h. Nasdaq 100 proxy +0.9%, S&P 500 flat, gold -0.7%, US dollar +0.5%.
▪ BTC is still down 4.6% over 24h. CMC Fear & Greed (daily): 32 (Fear), down from 67 a month ago.
▪ US spot BTC ETFs: $430M net outflow on Nov 5, $870M over five days.
📈 Volume & derivatives
▪ 4h volume on Crypto.com was ~$7.6M, about 0.4x the 7-day average 4h bar ($18.6M, skewed by the Nov 5 sell-off) and 0.66x the median ($11.5M).
▪ Open interest ~$52.3B (+0.2%), funding 0.007% and stable, liquidations ~$4M (0.01% of OI). Perp buyers were more aggressive by ~$136M.
🔎 Technicals & levels
▪ RSI(14, 5m) is 45. On 1h bars RSI is 41 and price is above its 20-bar average ($75,890). On 4h bars RSI is 39 and price is below its 20-bar average ($77,787).
▪ Resistance: $76,271 (rejected price three times on 4h bars, per CMC), $76,378 (window high)
▪ Support: ~$75,960 (11:10 low), $75,665 (window low)
🗓 Catalysts
▪ Today: US October payrolls and unemployment (13:30 UTC), U. Michigan sentiment (15:00 UTC). No single trigger was found for the 4h move.#BinanceReopensWithdrawalsForMoreAssets #viralpost #BTC走势分析 #analysis #cryptouniverseofficial
{spot}(BTCUSDT)
$BTC BTC edges higher, stalls under $76.4K
Last 4 hours, Nov 6, 08:55–12:50 UTC
BTC is at $76,059, up 0.44% from $75,728. High $76,378, low $75,665. Most of the gain came right after 09:00. Since then price has ranged roughly $76,000–$76,330.
📊 Market context
▪ Total crypto market cap +0.7% in 4h. Nasdaq 100 proxy +0.9%, S&P 500 flat, gold -0.7%, US dollar +0.5%.
▪ BTC is still down 4.6% over 24h. CMC Fear & Greed (daily): 32 (Fear), down from 67 a month ago.
▪ US spot BTC ETFs: $430M net outflow on Nov 5, $870M over five days.
📈 Volume & derivatives
▪ 4h volume on Crypto.com was ~$7.6M, about 0.4x the 7-day average 4h bar ($18.6M, skewed by the Nov 5 sell-off) and 0.66x the median ($11.5M).
▪ Open interest ~$52.3B (+0.2%), funding 0.007% and stable, liquidations ~$4M (0.01% of OI). Perp buyers were more aggressive by ~$136M.
🔎 Technicals & levels
▪ RSI(14, 5m) is 45. On 1h bars RSI is 41 and price is above its 20-bar average ($75,890). On 4h bars RSI is 39 and price is below its 20-bar average ($77,787).
▪ Resistance: $76,271 (rejected price three times on 4h bars, per CMC), $76,378 (window high)
▪ Support: ~$75,960 (11:10 low), $75,665 (window low)
🗓 Catalysts
▪ Today: US October payrolls and unemployment (13:30 UTC), U. Michigan sentiment (15:00 UTC). No single trigger was found for the 4h move.#BinanceReopensWithdrawalsForMoreAssets #viralpost #BTC走势分析 #analysis #cryptouniverseofficial
Last 4 hours, Nov 6, 08:55–12:50 UTC
BTC is at $76,059, up 0.44% from $75,728. High $76,378, low $75,665. Most of the gain came right after 09:00. Since then price has ranged roughly $76,000–$76,330.
📊 Market context
▪ Total crypto market cap +0.7% in 4h. Nasdaq 100 proxy +0.9%, S&P 500 flat, gold -0.7%, US dollar +0.5%.
▪ BTC is still down 4.6% over 24h. CMC Fear & Greed (daily): 32 (Fear), down from 67 a month ago.
▪ US spot BTC ETFs: $430M net outflow on Nov 5, $870M over five days.
📈 Volume & derivatives
▪ 4h volume on Crypto.com was ~$7.6M, about 0.4x the 7-day average 4h bar ($18.6M, skewed by the Nov 5 sell-off) and 0.66x the median ($11.5M).
▪ Open interest ~$52.3B (+0.2%), funding 0.007% and stable, liquidations ~$4M (0.01% of OI). Perp buyers were more aggressive by ~$136M.
🔎 Technicals & levels
▪ RSI(14, 5m) is 45. On 1h bars RSI is 41 and price is above its 20-bar average ($75,890). On 4h bars RSI is 39 and price is below its 20-bar average ($77,787).
▪ Resistance: $76,271 (rejected price three times on 4h bars, per CMC), $76,378 (window high)
▪ Support: ~$75,960 (11:10 low), $75,665 (window low)
🗓 Catalysts
▪ Today: US October payrolls and unemployment (13:30 UTC), U. Michigan sentiment (15:00 UTC). No single trigger was found for the 4h move.#BinanceReopensWithdrawalsForMoreAssets #viralpost #BTC走势分析 #analysis #cryptouniverseofficial
1
814
Log in to explore more content
Join global crypto users on Binance Square
⚡️ Get latest and useful information about crypto.
💬 Trusted by the world’s largest crypto exchange.
👍 Discover real insights from verified creators.
Email / Phone number
Trending Topics
CryptoSelloffTriggersMultipleWhaleLiquidations
202,742 views
1,867 Discussing
Crypto Liquidations Top $2B in 24 Hours as 329,000 Traders Are Wiped Out
Binance News
·40 Likes
·58.1k views
USSpotXRPETFsSeeLargestWeeklyOutflowIn8Months
173,521 views
1,602 Discussing
WillFOMCMinutesReinforceRateHikeExpectations?
53,815 views
787 Discussing