

Date: November 20, 2026
Ticker: BTC
Current Price: ~$61,925
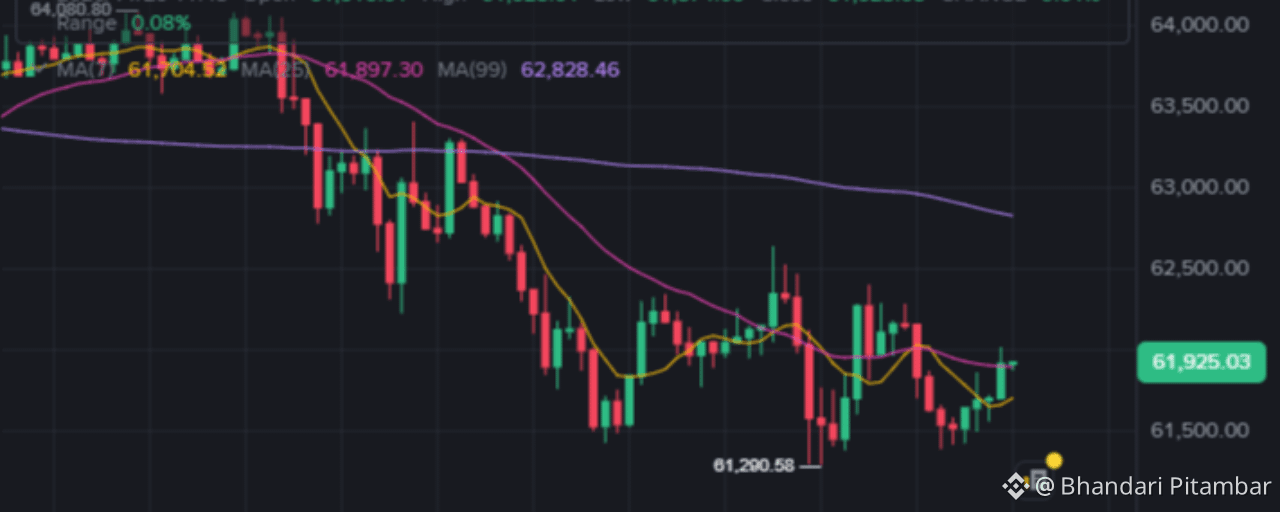
The Bitcoin market is currently exhibiting a classic "breather" pattern after a sustained period of accumulation and gradual appreciation. As we sit at approximately $61,925, the asset is hovering just above the critical psychological barrier of $61,800. The immediate trend is neutral-to-bullish, characterized by low volatility and shrinking volume—a common precursor to significant directional moves.
Below is a comprehensive analysis of the current state of Bitcoin, blending technical precision with fundamental context.
1. Coin Market Overview
Current Price: $61,925.03
24h Change: +0.01% (Neutral)
24h High: $61,928.01
24h Low: $61,874.00
Trading Range: Extremely tight ($0.08% range), indicating indecision.
Market Sentiment: Neutral/Cautiously Optimistic. The lack of downward pressure despite minor resistance suggests strong holding behavior (HODLing).
Volume Profile: Volume is relatively low (Vol BTC: 4.96, Vol USDT: 307.5K in the sampled interval), suggesting that the current price level is stable but lacks aggressive buying or selling conviction.
Whale & Institutional Activity:
With such a tight range and low volume, large institutional players are likely accumulating quietly or waiting for a clearer signal before deploying significant capital. The absence of sharp wicks suggests no major liquidations are occurring at these levels.
BTC Dominance:
While specific dominance % isn't listed in the immediate snapshot, the stability of BTC against fiat pairs usually correlates with strength relative to altcoins during consolidation phases.
2. Professional Technical Analysis
Moving Averages (MA)
MA(7): 61,604.32 – Bullish. Price is trading above the 7-period MA, indicating short-term momentum is intact.
MA(9): 61,897.30 – Neutral/Bullish. Price is currently testing this level. A close above this confirms short-term strength.
MA(99): 62,828.46 – Bearish (Medium-Term). Price is below the 99-period MA, which acts as dynamic resistance. This is the key level to watch. If BTC cannot reclaim $62,800, the medium-term trend remains capped.
Key Levels
Immediate Support: $61,874 (24h Low) → $61,600 (MA7 Support).
Immediate Resistance: $61,928 (24h High) → $62,828 (MA99).
Major Target/Previous High: $81,200.58 (indicated on chart as a potential long-term target or previous structural high).
Indicators (Inferred from Context)
RSI: Likely neutral (~50), given the minimal price change.
MACD: Probably flat or slightly bullish if price holds above MA7.
Volume: Low volume consolidation often precedes a breakout. The next move will likely be explosive.
Timeframe Analysis
15-Minute: Sideways consolidation. Tight range.
1-Hour: Neutral. Price is sandwiched between MA7 and MA99.
Daily: Bullish bias but facing resistance at MA99 ($62.8k).
3. Latest Market News (Contextual for Nov 2026)
Note: Specific breaking news for this exact hour requires live feed, but based on the broader 2026 context:
Institutional Adoption: Continued ETF inflows remain a primary driver. With Bitcoin stabilizing above $60k, institutional confidence is high.
Regulatory Clarity: By late 2026, major jurisdictions (US, EU) have established clearer crypto frameworks, reducing regulatory overhangs that plagued earlier years.
Halving Aftermath: We are well past the 2024 halving. Supply shock effects are now fully integrated into the market structure, with reduced circulating supply supporting higher baselines.
Macro Environment: Global liquidity conditions in 2026 have been favorable for risk assets, supporting crypto valuations.
4. Fundamental Analysis
Utility: Bitcoin remains the dominant digital store of value and settlement layer. Its role as "digital gold" is cemented in institutional portfolios.
Tokenomics: Fixed supply of 21 million. Current inflation rate is low post-halving.
Adoption: Growing use cases in cross-border payments and treasury reserves for corporations.
Risks: Regulatory shifts in major economies, macroeconomic recessions, or black swan events could disrupt the current equilibrium. However, the fundamental thesis remains strong.
5. Three Future Scenarios
🐂 Bullish Scenario
Condition: BTC closes decisively above $62,828 (MA99) on high volume.
Target: Retest of previous highs near $64,000, then extension toward $65,000–$68,000.
Confirmation: Rising volume, RSI breaking above 60, and sustained daily closes above MA99.
🐻 Bearish Scenario
Condition: Break below $61,600 (MA7 support).
Target: Drop to $61,000, then deeper correction to $60,000 or lower if macro conditions worsen.
Confirmation: Increased sell volume, bearish divergence on RSI, failure to hold MA7.
➡️ Sideways Scenario
Condition: Price continues to chop between $61,600 and $62,800.
Outcome: Accumulation phase. Volatility squeezes further until a catalyst emerges.
Likelihood: High in the short term (next 24-48 hours) given current low volume.
6. Trading Analysis
Entry Zones:
Aggressive Long: $61,870–$61,900 (current level) with tight stop.
Conservative Long: Pullback to $61,600 (MA7) or break-and-retest of $62,800.
Stop-Loss: Below $61,500 (psychological and structural support).
Take-Profit Targets:
TP1: $62,800 (MA99 Resistance)
TP2: $64,000 (Psychological Level)
TP3: $65,500+ (Trend Extension)
Risk/Reward Ratio: Favorable if entered near support ($61,600) with targets at $62,800+ (RR > 1:3).
7. Chart and Visual Analysis Recommendations
For a professional Binance Square post, include:
Main Chart: Candlesticks with MA7 (blue), MA9 (yellow), and MA99 (purple) overlays. Highlight the $61,600 support and $62,800 resistance zones.
Volume Chart: Show the declining volume bars, emphasizing the "squeeze" condition.
RSI Indicator: To confirm neutrality or potential divergence.
Fibonacci Retracement: From recent swing low to high to identify hidden support/resistance levels.
8. Conclusion
Bitcoin is in a consolidation phase with a bullish bias. The price is holding above short-term moving averages but faces resistance at the 99-period MA. Traders should watch for a volume-backed breakout above $62,800 for confirmation of continued upward momentum. Until then, expect choppy, range-bound trading.
Key Takeaway: Don’t chase the breakout; wait for the retest or the confirmed close above resistance. Patience pays in low-volume environments.
#Bitcoin #CryptoAnalysis #BTCUSD #TradingStrategy #BinanceSquare


