🏦 Central banks bought 321 tonnes of gold last quarter. Gold just broke $3,600 anyway.
Now: $3,551
24 hours ago: ~$3,766
From the January record near $5,590: about -36%
Lowest in more than 14 months
Yesterday’s map: lose $3,650 and the next leg opens.
It opened overnight. 📉
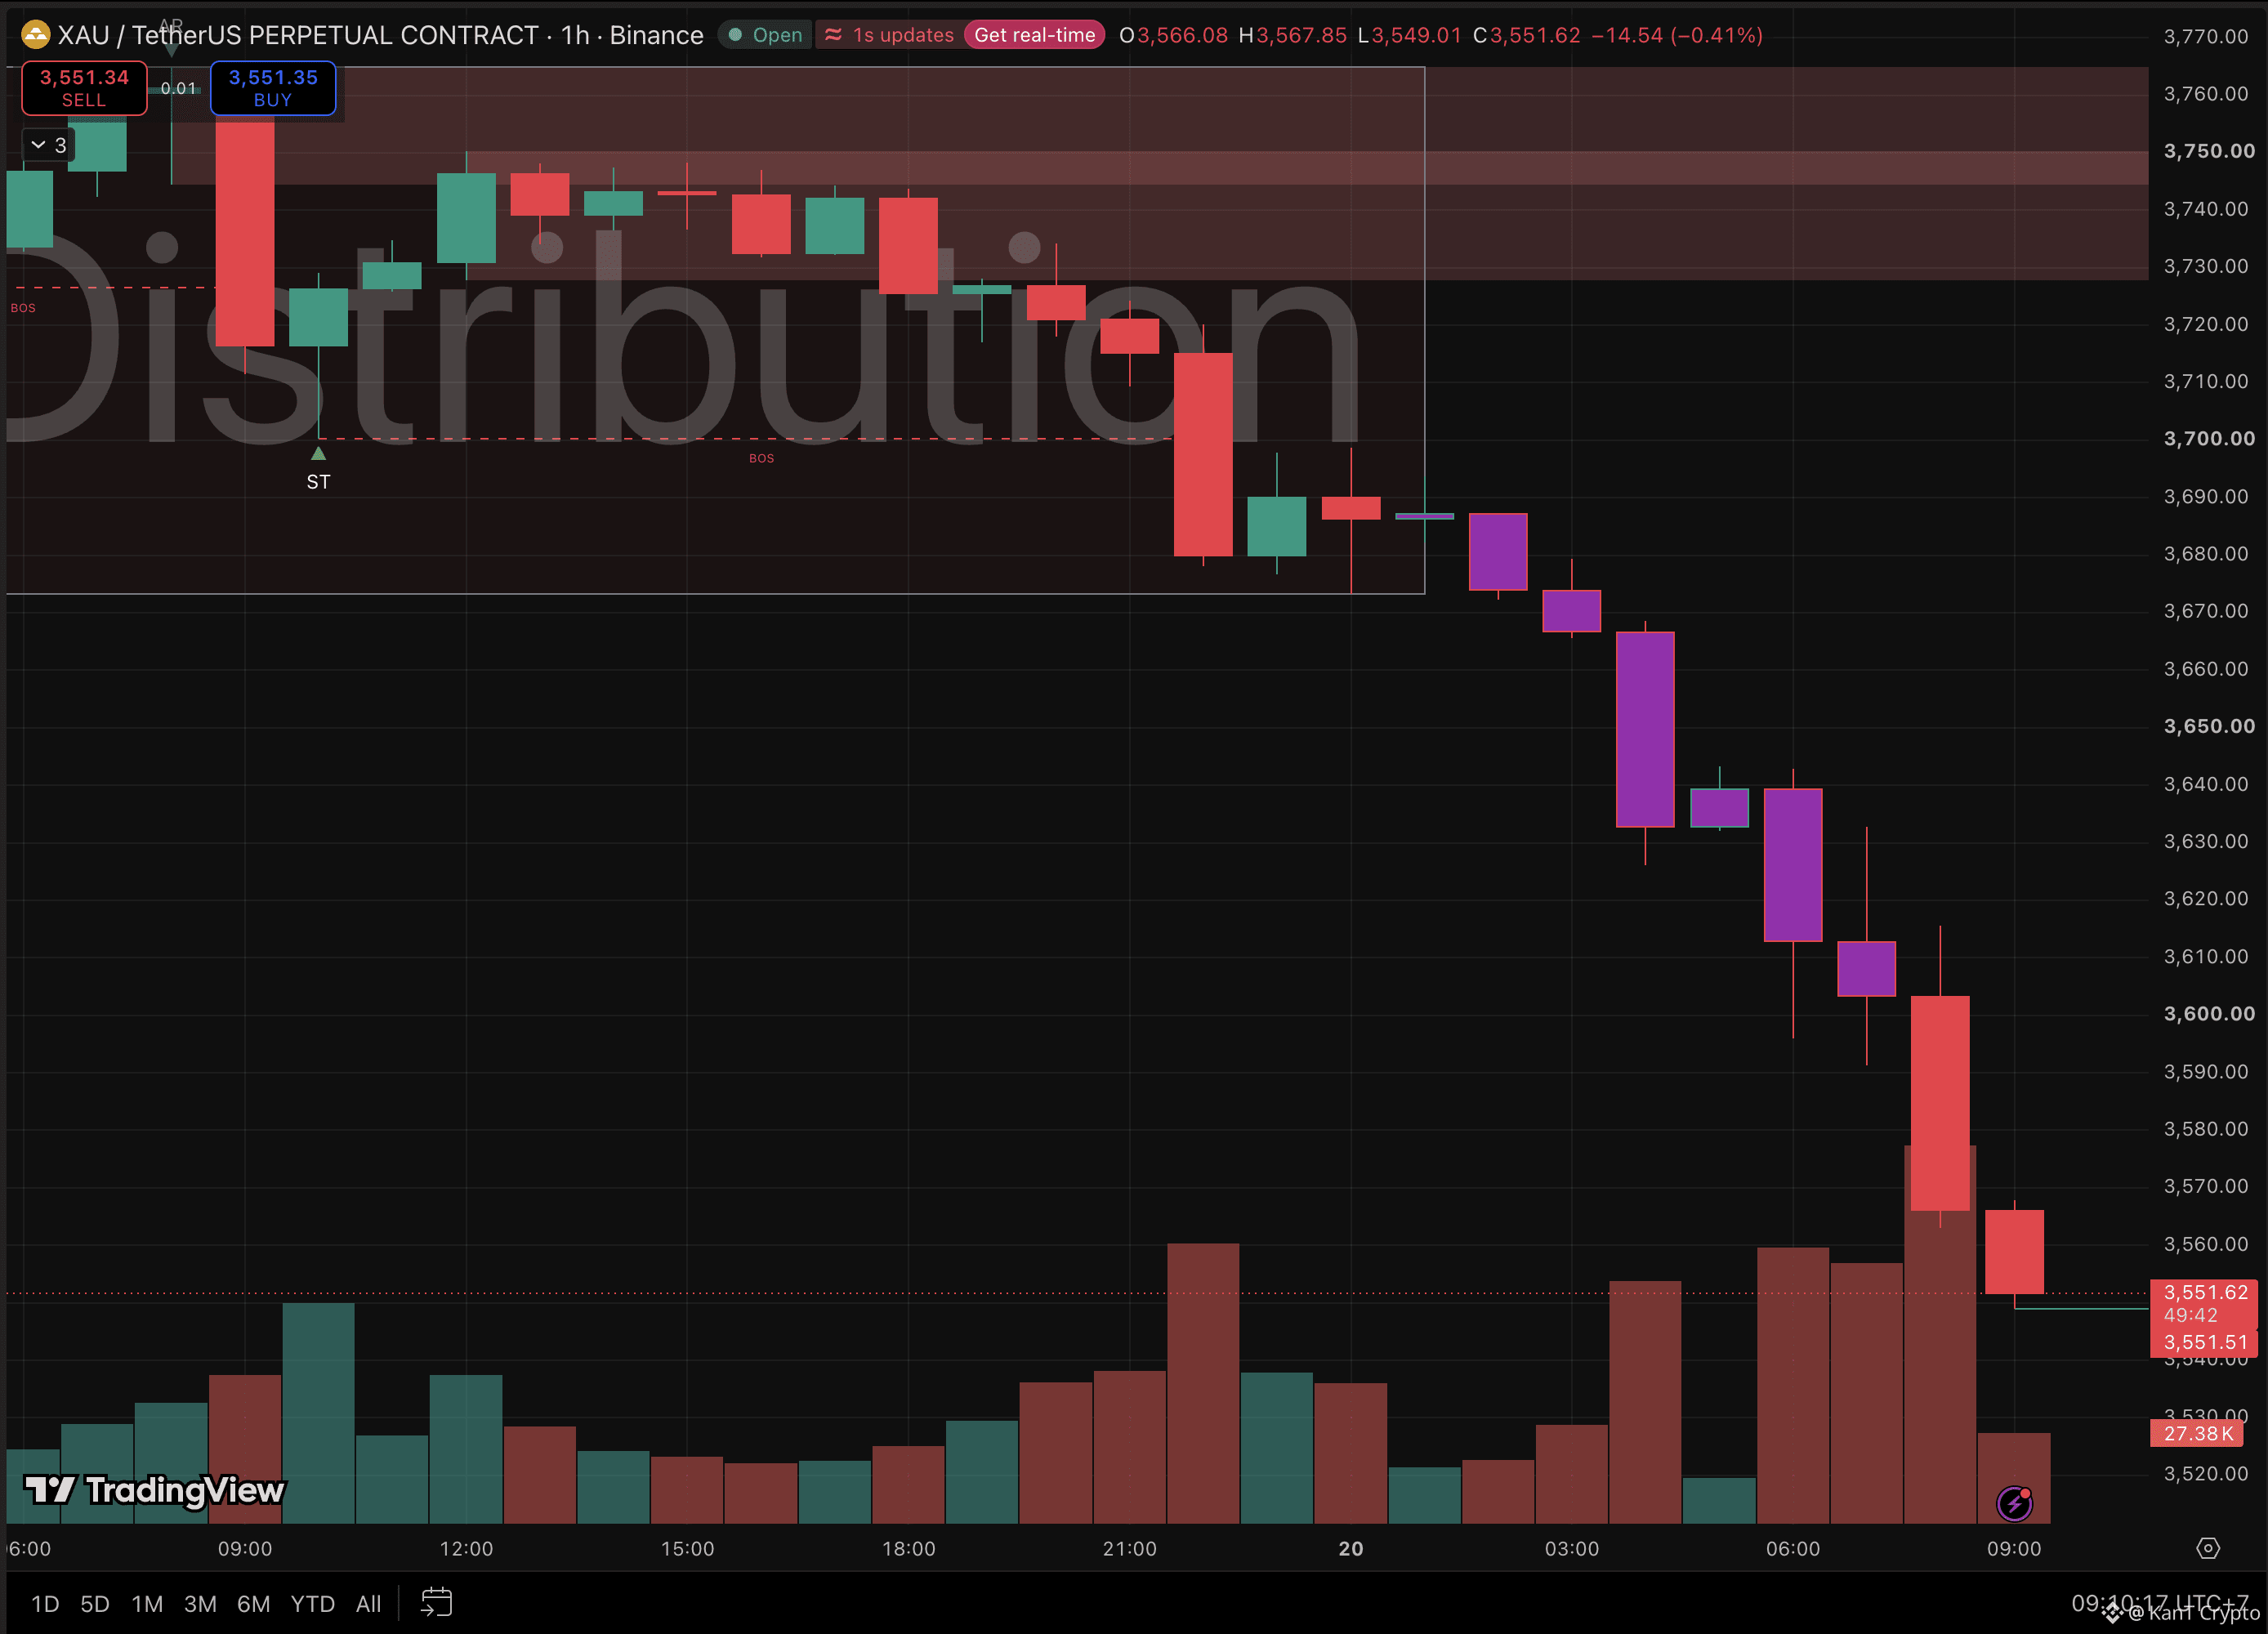
The chart was a textbook distribution: a flat range at $3,674 to $3,766 where sellers kept unloading into every bounce.
Once the BOS (break of structure) at $3,700 gave way, the floor at $3,674 went next.
Then came a string of heavy-volume candles, each closing near its low, straight through $3,600.
So who is selling into central bank demand?
US funds, mostly. North America was the only region with ETF outflows in October.
India’s bar and coin buying fell about 40%.
With the 10-year yield above 5% and a December hike close to certain, Western money has a better place to park cash.
But the other side hasn’t quit.
Global gold ETF holdings hit a record near 4,256 tonnes in October, led by Europe.
Chinese bar and coin demand rose 7%.
The West is selling, the East is buying, and right now the West is winning the tape.
Reclaim $3,600 on a 4H close → the flush is losing steam, $3,674 is the ceiling.
Stay under $3,600 → the flush can keep going, and nothing on this chart marks a floor below today’s $3,549 low.
Long-term buyers may see value building. Short-term, a trend this clean doesn’t reverse on hope.
West keeps selling, or East starts winning?
Not financial advice.
$XAUT
$XAU
$PAXG
Now: $3,551
24 hours ago: ~$3,766
From the January record near $5,590: about -36%
Lowest in more than 14 months
Yesterday’s map: lose $3,650 and the next leg opens.
It opened overnight. 📉
The chart was a textbook distribution: a flat range at $3,674 to $3,766 where sellers kept unloading into every bounce.
Once the BOS (break of structure) at $3,700 gave way, the floor at $3,674 went next.
Then came a string of heavy-volume candles, each closing near its low, straight through $3,600.
So who is selling into central bank demand?
US funds, mostly. North America was the only region with ETF outflows in October.
India’s bar and coin buying fell about 40%.
With the 10-year yield above 5% and a December hike close to certain, Western money has a better place to park cash.
But the other side hasn’t quit.
Global gold ETF holdings hit a record near 4,256 tonnes in October, led by Europe.
Chinese bar and coin demand rose 7%.
The West is selling, the East is buying, and right now the West is winning the tape.
Reclaim $3,600 on a 4H close → the flush is losing steam, $3,674 is the ceiling.
Stay under $3,600 → the flush can keep going, and nothing on this chart marks a floor below today’s $3,549 low.
Long-term buyers may see value building. Short-term, a trend this clean doesn’t reverse on hope.
West keeps selling, or East starts winning?
Not financial advice.
$XAUT
$XAU
$PAXG