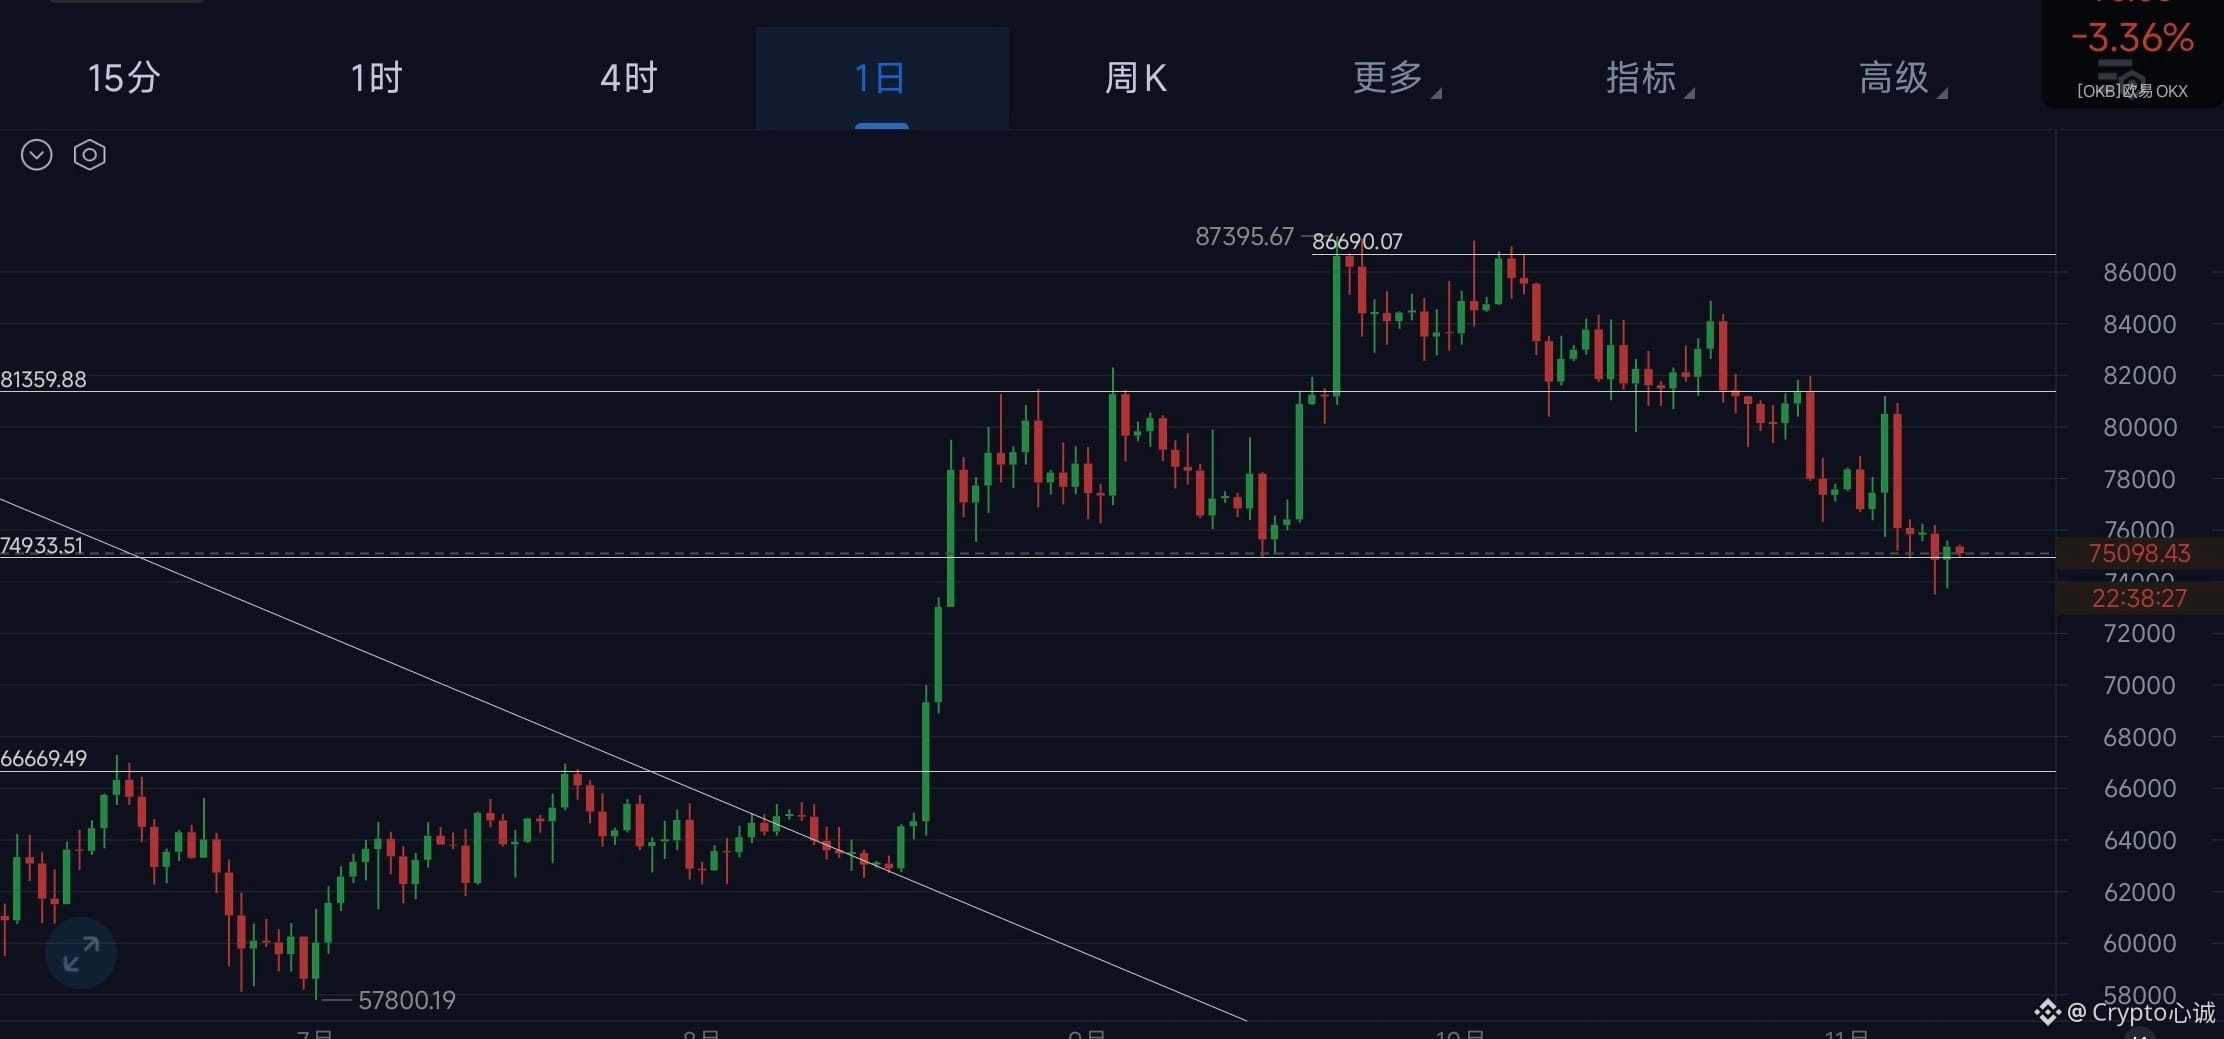
Has the market finished its wick, or is it just getting started?❓
Nov 10 $BTC Comprehensive Market Analysis
✊ News:
Large ETF outflows are driving lower risk appetite: On Nov 9, net outflows totaled about $468M in a single day, with cumulative outflows of about $1.32B over seven days. Outflows the previous week were about $1.28B, the largest weekly outflow since June, with BlackRock’s IBIT accounting for the largest share. Institutional risk appetite is clearly weak.
Clear divergence from gold: Gold broke above $4,100 as funds flowed into traditional safe-haven assets, while BTC came under downward pressure. The market remains cautious ahead of upcoming U.S. CPI/PPI data and potential regulatory developments, with overall sentiment toward risk assets turning bearish.
✊ Fund flows:
Persistent net outflows from institutional funds are the main drag. Cumulative flows since ETF launches are still positive (about +$55–56B), but the recent trend has shifted to ongoing redemptions. On-chain whale activity shows some addresses moving toward distribution, while spot-market buying is not strong enough to absorb the pressure from ETF redemptions.
✊ Sentiment:
The Fear & Greed Index is at 30, in fear territory.
✊ Technicals:
Indicators: Daily RSI is around 34–37, near oversold territory, but there are no strong reversal signals; MACD and other momentum indicators remain bearish. Some models indicate that the price is trading at a discount to its long-term fair value, but short-term technicals have not yet confirmed a bottom.
Trend structure: Clearly downward in the short term, with price below several key moving averages. Wait patiently for a base to form.
Support: 73500–74000
Resistance: 75800–76700
$BTC
Nov 10 $BTC Comprehensive Market Analysis
✊ News:
Large ETF outflows are driving lower risk appetite: On Nov 9, net outflows totaled about $468M in a single day, with cumulative outflows of about $1.32B over seven days. Outflows the previous week were about $1.28B, the largest weekly outflow since June, with BlackRock’s IBIT accounting for the largest share. Institutional risk appetite is clearly weak.
Clear divergence from gold: Gold broke above $4,100 as funds flowed into traditional safe-haven assets, while BTC came under downward pressure. The market remains cautious ahead of upcoming U.S. CPI/PPI data and potential regulatory developments, with overall sentiment toward risk assets turning bearish.
✊ Fund flows:
Persistent net outflows from institutional funds are the main drag. Cumulative flows since ETF launches are still positive (about +$55–56B), but the recent trend has shifted to ongoing redemptions. On-chain whale activity shows some addresses moving toward distribution, while spot-market buying is not strong enough to absorb the pressure from ETF redemptions.
✊ Sentiment:
The Fear & Greed Index is at 30, in fear territory.
✊ Technicals:
Indicators: Daily RSI is around 34–37, near oversold territory, but there are no strong reversal signals; MACD and other momentum indicators remain bearish. Some models indicate that the price is trading at a discount to its long-term fair value, but short-term technicals have not yet confirmed a bottom.
Trend structure: Clearly downward in the short term, with price below several key moving averages. Wait patiently for a base to form.
Support: 73500–74000
Resistance: 75800–76700
$BTC