



Wells Fargo stock has a neutral daily setup, with nearby support intact but key averages still overhead. The hourly chart offers partial bullish support, while short-term signals remain mixed. Tuesday’s earnings coverage adds a separate test for the next session, rather than an explanation for Monday’s move.
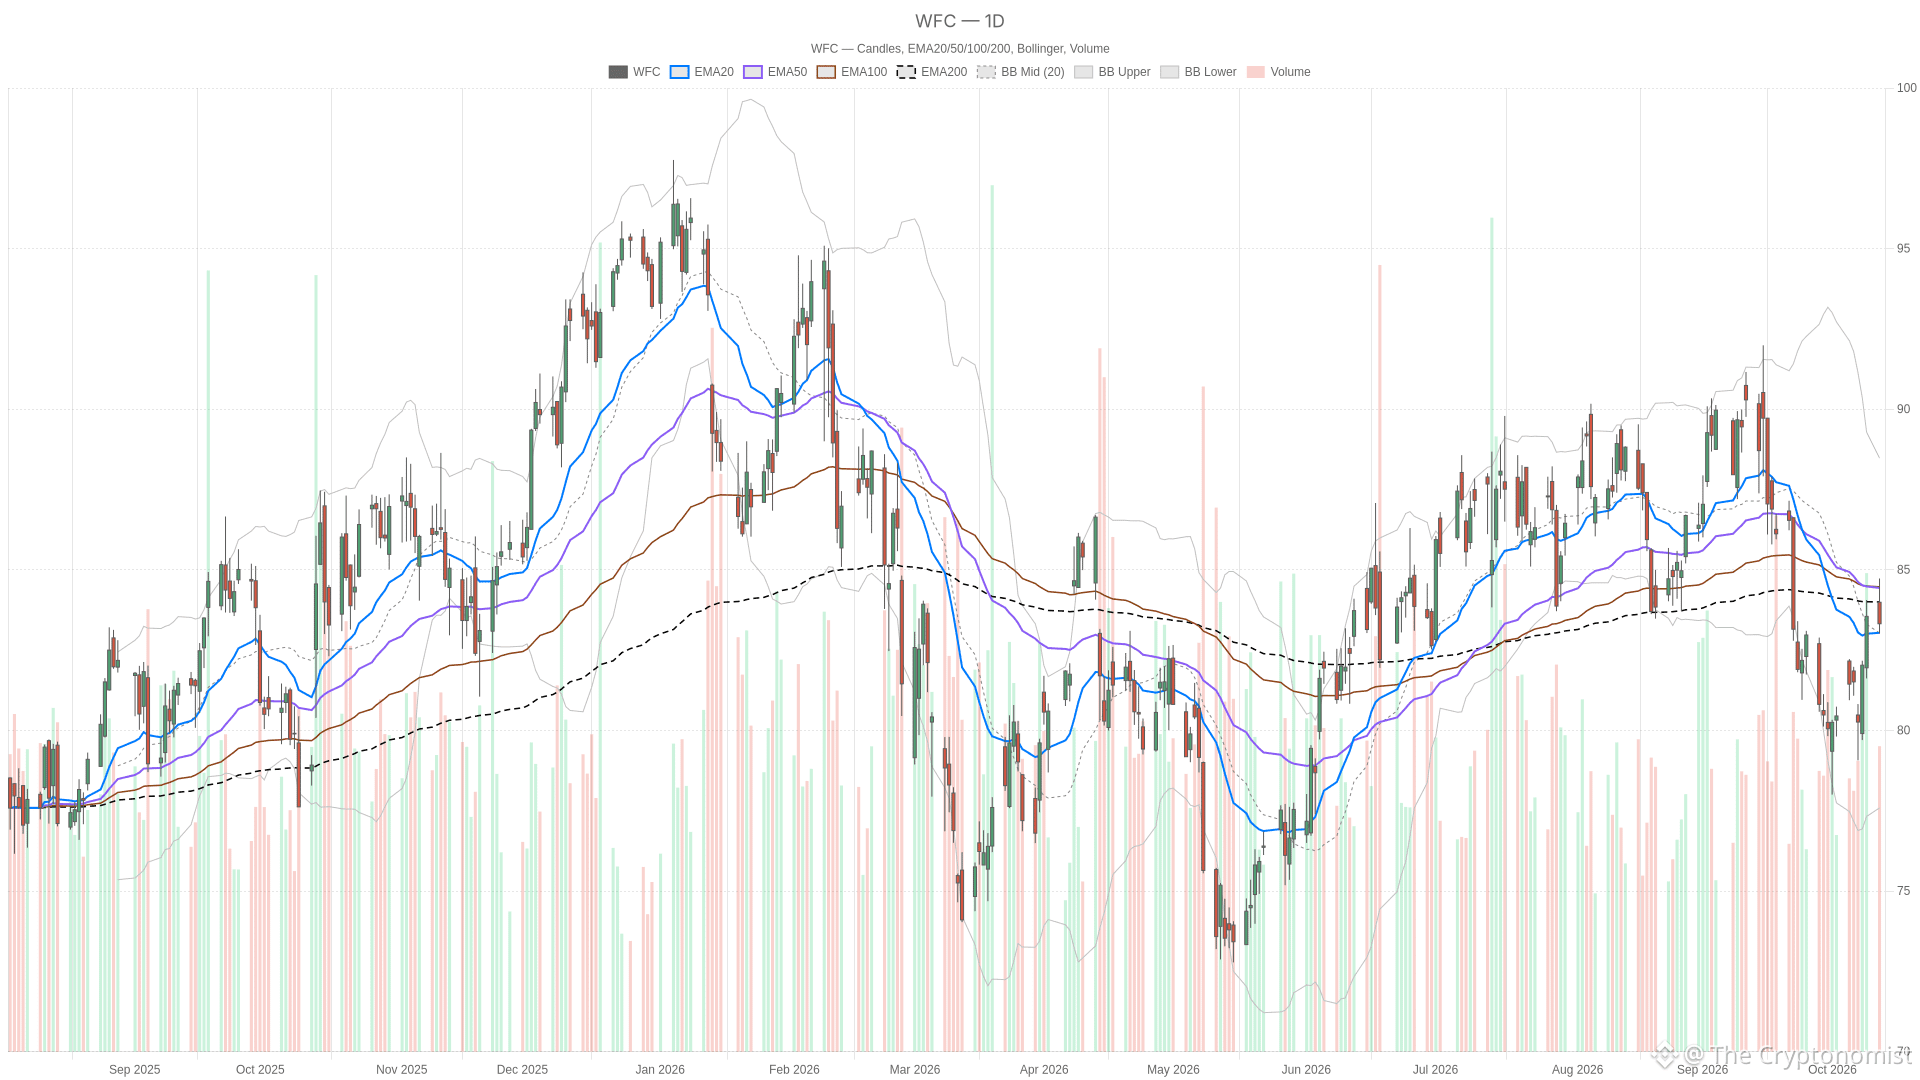 WFC — daily chart with candlesticks, EMA20/EMA50 and volume.
Key takeaways
Wells Fargo closed Monday at $83.32, -0.28% from the prior close of $83.55, holding above the daily 20-session EMA at $83.04.
Daily RSI14 is 48.91, below the neutral 50; daily MACD histogram is 0.25, with the MACD line at -1.18 above its signal at -1.43.
The close sits below the 200-session EMA at $83.73 and the 50-session EMA at $84.44.
Hourly RSI14 is 60.57, above 50; hourly MACD histogram is -0.04, with the MACD line at 0.64 below its signal at 0.68.
Q3 earnings reported Tuesday morning: Yahoo Finance reported revenue of $21.87 billion (below estimates) and GAAP EPS of $1.87 (above estimates).
According to Twelve Data, Wells Fargo opened at $83.99 on Monday, October 12, 2026. It traded between a low of $83.02 and a high of $84.73, and closed at $83.32. The session’s change was -0.28% versus the previous close of $83.55 on October 9, 2026.
Wells Fargo stock holds support without a bullish daily alignment
Wells Fargo stock holds above its daily 20-session EMA at $83.04. However, it remains below the 200-session EMA at $83.73 and the 50-session EMA at $84.44. This creates a neutral daily structure: nearby support is intact, yet overhead resistance from key averages persists.
Meanwhile, daily RSI14 stands at 48.91, just below the neutral 50 threshold. The MACD line is -1.18, above its signal at -1.43, with a positive histogram of 0.25. These readings conflict: RSI offers no bullish advantage, while MACD has a positive line-to-signal relationship despite both lines remaining below zero.
The daily Bollinger midpoint is $83.03, just beneath the session close. Its upper band is $88.48 and its lower band is $77.59. Price therefore sits near the band’s center, not at either outer boundary. Daily ATR14 reads $1.9, providing a volatility reference without resolving the chart’s directional ambiguity.
Wells Fargo: hourly support meets weaker execution signals
The hourly chart places Wells Fargo stock above the 20-hour EMA at $82.88 and the 50-hour EMA at $82.12. In contrast, the 200-hour EMA at $83.64 remains overhead. The shorter averages support the bullish side of the picture, but the full hourly structure is not bullishly aligned.
Hourly RSI14 is 60.57, above 50 and below overbought territory. However, the MACD line at 0.64 sits below its signal at 0.68, producing a negative histogram of -0.04. This limits the hourly confirmation: RSI favors buyers, but MACD does not confirm that advantage. Hourly ATR14 is $0.55.
For execution context, the 15-minute chart places the daily close below its 20-quarter-hour EMA at $83.43. It remains above the 50-quarter-hour EMA at $83.18. RSI14 is 45.77, below 50, while the MACD line of -0.08 sits below its signal of -0.02. The histogram is -0.06. These short-term readings do not confirm the hourly RSI’s bullish position.
Tuesday’s earnings reports present a mixed picture for Wells Fargo
Separately, Q3 results reported Tuesday morning were mixed. Yahoo Finance reported revenue of $21.87 billion, up 1.7% year on year but below Wall Street’s expectations. Yahoo Finance also reported GAAP profit of $1.87 per share, 0.8% above consensus estimates. The revenue miss and earnings beat make the results mixed.
At the same time, Seeking Alpha reported that capital-market revenue fell short of expectations and that 2026 net interest income guidance was maintained. Investing.com carried a Reuters report attributing higher profit to robust loan growth and interest income. These Tuesday reports provide news context for the next session; they should not be treated as causes of Monday’s decline.
Bullish and bearish conditions for Wells Fargo stock
The next session’s daily pivot sits at $83.69, with first resistance at $84.36 and first support at $82.65. These levels are calculated from Monday’s completed daily candle and apply when trading resumes.
To the upside, a bullish case would require holding the daily 20-session EMA at $83.04, then reclaiming the next-session daily pivot at $83.69. Clearing the daily 200-session EMA at $83.73 would add support to that case. The next overhead references would be daily first resistance at $84.36, followed by the 50-session EMA at $84.44.
Conversely, a break below the daily 20-session EMA at $83.04 and Bollinger midpoint at $83.03 would undermine the bullish case. A subsequent break below next-session daily first support at $82.65 would strengthen the bearish scenario. The daily lower Bollinger band at $77.59 remains a more distant downside reference, not a projected destination.
Overall, Wells Fargo stock stands between nearby daily support and overhead averages, with a daily ATR14 of $1.9. The hourly chart offers only partial confirmation, and the 15-minute readings add execution caution. Whether the next session clears resistance or breaks support remains unresolved alongside the mixed earnings coverage.
FAQ
What is the daily chart setup for Wells Fargo stock?
Wells Fargo stock closed Monday at $83.32, above its daily 20-session EMA at $83.04 but below the 200-session EMA at $83.73 and the 50-session EMA at $84.44. Daily RSI14 is 48.91, below the neutral 50. The daily MACD line is -1.18, above its signal at -1.43, with a positive histogram of 0.25.
What are the key support and resistance levels?
For the next session, daily first support sits at $82.65 and the daily pivot is at $83.69. The daily 20-session EMA at $83.04 and Bollinger midpoint at $83.03 serve as nearby support references. On the resistance side, daily first resistance is $84.36, with the 200-session EMA at $83.73 and the 50-session EMA at $84.44 overhead.
What do the hourly momentum indicators show?
Hourly RSI14 is 60.57, above 50 and below overbought territory. However, the hourly MACD line at 0.64 sits below its signal at 0.68, with a negative histogram of -0.04. The 15-minute chart shows RSI14 at 45.77, below 50, with the MACD line at -0.08 below its signal at -0.02 and a histogram of -0.06.
What were Wells Fargo’s Q3 earnings results?
Yahoo Finance reported Q3 revenue of $21.87 billion, up 1.7% year on year but below Wall Street’s expectations. Yahoo Finance also reported GAAP profit of $1.87 per share, 0.8% above consensus estimates. Seeking Alpha reported that capital-market revenue fell short of expectations and that 2026 net interest income guidance was maintained. These results were published Tuesday morning.
Disclaimer: This article is for informational purposes only and does not constitute financial advice, an investment recommendation, or a solicitation to buy or sell any financial instrument. The analysis provided is not indicative of future results. Investing in financial markets carries a high risk of capital loss. Always do your own research (DYOR) and consult a qualified financial advisor before making any decision.
Cryptonomist and the author hold no positions in the financial instruments mentioned and receive no compensation from the companies covered.
Article produced with the assistance of artificial intelligence and reviewed by the editorial team.