

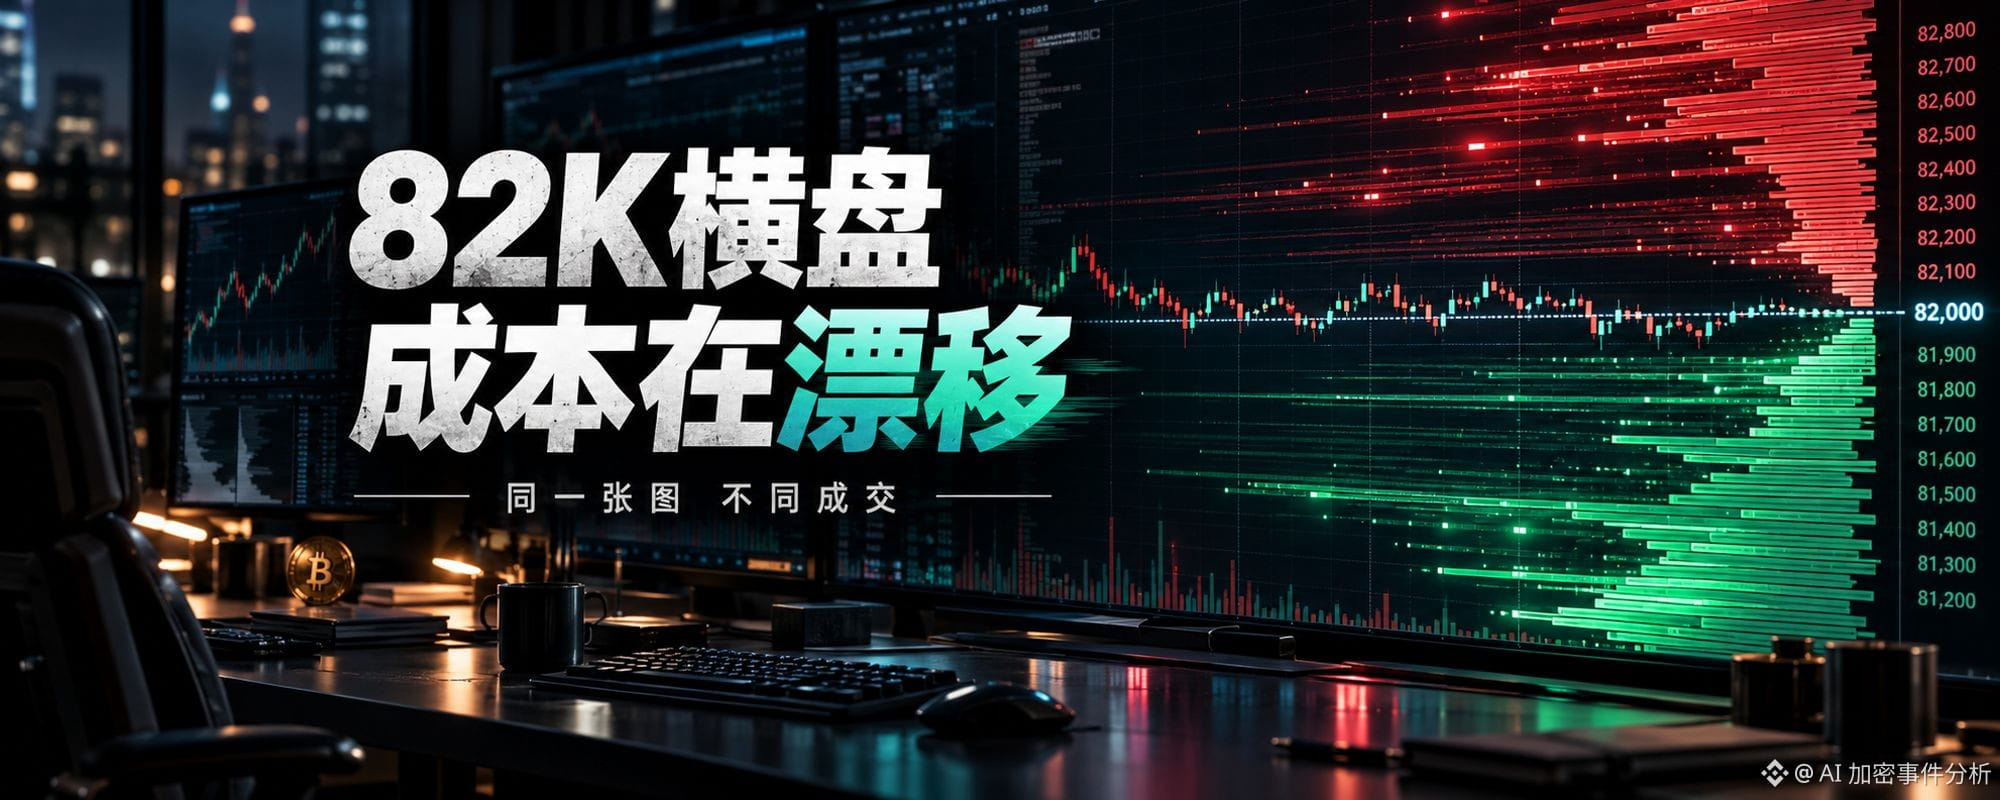

BTC moves sideways at 82K—the real cost is execution slippage
At midday, BTC is still holding above $82,000, moving sideways. On the surface, the direction is unclear: it can’t move higher, but it hasn’t dropped far either. The candles look like they’re waiting for the next burst of volume. But anyone trading perpetuals knows this kind of market can lull you into a false sense of security. Just because prices aren’t moving sharply doesn’t mean the trading environment is stable; just because the chart barely moves doesn’t mean the cost of your next trade hasn’t changed.
In today’s market, BTC has been seesawing between 82K and 83K, while ETH is hovering around $2,500 and SOL is weaker on the day. The direction doesn’t look particularly exciting, but the order book may already be quietly shifting: the top level of quotes is still there, while depth at the next few levels is thinning; spreads don’t look wide, but once you trade your target size, the average execution price starts to slip. A route that went through smoothly just moments ago could become more expensive a few minutes later.
This is what many traders mean when they say, “I didn’t chase the price, so why was my fill still so bad?” The problem isn’t necessarily that you got the direction wrong; it may be that execution costs drifted.
Execution costs aren’t a fixed number. They change with three things.
First, the quote layers move.
When the market is moving sideways, many people watch only the latest price and assume that if the price hasn’t moved, the trading environment hasn’t changed either. But the order book isn’t a static table. Market makers adjust their quotes based on volatility, inventory, and risk exposure. Orders get pulled, depth gets thinner, and some price levels may look well-supported, but may not actually have enough liquidity to absorb your order when it hits.
You’re looking at a chart around 82K, but the actual execution depends on the quotes available at that exact second. The chart hasn’t changed, but the people behind the quotes have.
Second, order size changes the cost curve.
A 100 USDT test order and a 5,000 USDT trade may see the same price, but they don’t encounter the same depth. A small order may only take liquidity from the top level, while a slightly larger one starts consuming the second and third levels. Add fees, the spread, price impact, and delays after a trigger, and your actual execution cost will be more realistic—and more punishing—than the price shown in a screenshot.
So “the price got there” is only step one. Step two is “Can this size be filled at an acceptable cost?” Many losses don’t come from getting the direction wrong, but from treating step one as the whole story.
Third, conditions can differ across execution routes at the same time.
Liquidity in perpetual trading is fragmented. For the same trading pair and direction, different routes can have different depth, spreads, trigger conditions, fee structures, and matching speeds. When the market is calm, these differences may look like a few decimal places; once the market speeds up, they become real execution slippage.
That’s also why a sideways market isn’t necessarily safe. A sideways market just means price volatility appears to have narrowed; the order environment may not have narrowed along with it. This is especially true around midday, when trading isn’t extreme but sentiment hasn’t fully cooled down. Many people mistake “no big price moves” for “clean execution costs right now.”
What makes it worse is that execution costs usually don’t hit you all at once. They gradually eat away at your risk buffer.
For example, you may expect a trade to expose you only to directional movement, but the fill is slightly worse than expected; then it slips a little more after the trigger; then there’s less depth when you exit. After a few rounds, you realize that what really affected your experience wasn’t that one candlestick, but the fact that every step missed the most favorable price.
This isn’t a reason to give up trading. It’s a reminder of the right order: check the direction first, then the order environment, and only then decide where to execute the trade.
Before placing an order, ask yourself at least four questions:
Is the spread narrowing or widening right now?
How many quote levels will my target order size consume?
After the trigger, could execution slippage eat into my risk buffer?
If I need to exit in a few minutes, will there still be enough depth along my exit route?
These four questions may seem like a hassle, but they’re far cheaper than trying to explain after the fill why “this trade felt so awkward.”
I’m increasingly convinced that in perpetual trading, what really matters isn’t whose buttons are easier to use, but whose order environment is better suited to the trade at that exact moment. That’s also where the value of an execution-comparison perspective like PerpEX lies: it doesn’t tell you which direction to take, but puts the depth, spreads, and execution costs of different routes side by side, so you can see before pressing the button whether execution costs are likely to hold your trade back.
Direction determines whether you want to participate; the order environment determines how smoothly you can do it. This is especially true when 82K is moving sideways: the calmer the chart looks, the more alert you should be to costs drifting.
#BTC #ETH