



Prices can change direction in a single day, but the movement of coins on-chain doesn’t lie. In October 2026, BTC is grinding sideways around $82,000–$84,000, while headlines about daily ETF outflows are once again flooding the news. But shift your focus from the charts to on-chain data, and you’ll see a completely different story.
1. First, let’s look at the price: panic zone or golden buying opportunity? 📊
Taking a longer-term view, the current position is actually quite nuanced:
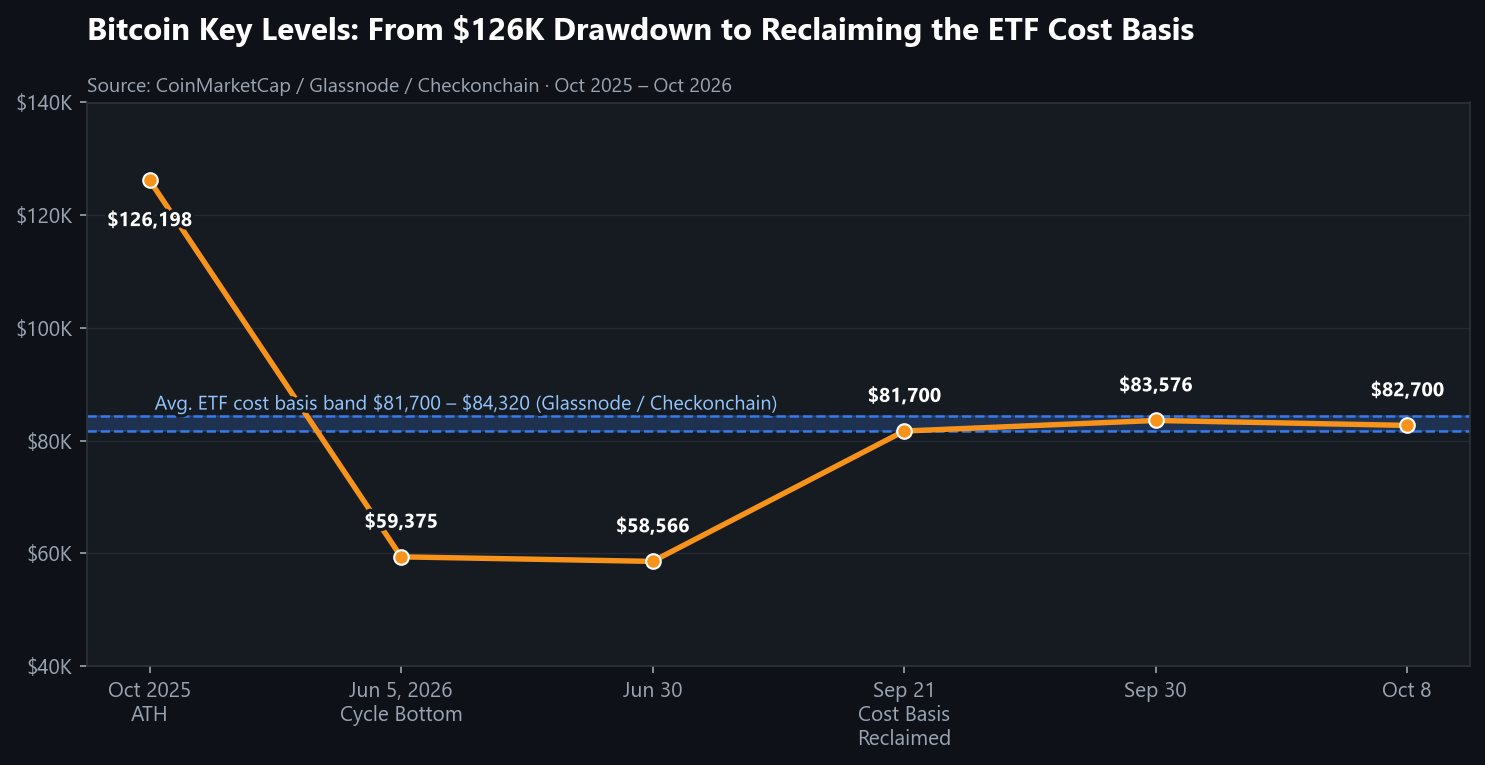
In October 2025, BTC hit an all-time high of $126,198, then declined steadily, falling as low as $59,375 on June 5, 2026—a maximum drawdown of about 53%.
BTC rose from $58,566 to $83,576 in the third quarter, gaining 43%—its best quarterly performance since Q4 2024.
More importantly, on September 21, BTC reclaimed the average cost basis band for U.S. spot ETF holdings ($81,700–$84,320). Before that, ETF holders had been collectively underwater for a full 233 days.
Why is the cost basis so important? Bitfinex Alpha’s data is clear: when the price is near the ETF cost basis band, average daily ETF inflows are only about $65 million. But when the price is more than 10% above cost basis, average daily inflows jump to $136 million—more than double. In other words, we’re at the point where the spring is being compressed 🚀 ETF buyers have only just returned to breakeven, so uncertainty is at its peak. But once the price holds steady and moves further above cost basis, incremental capital will automatically start flowing in faster.
II. ETF flows: don’t be spooked by a single day’s data 💰
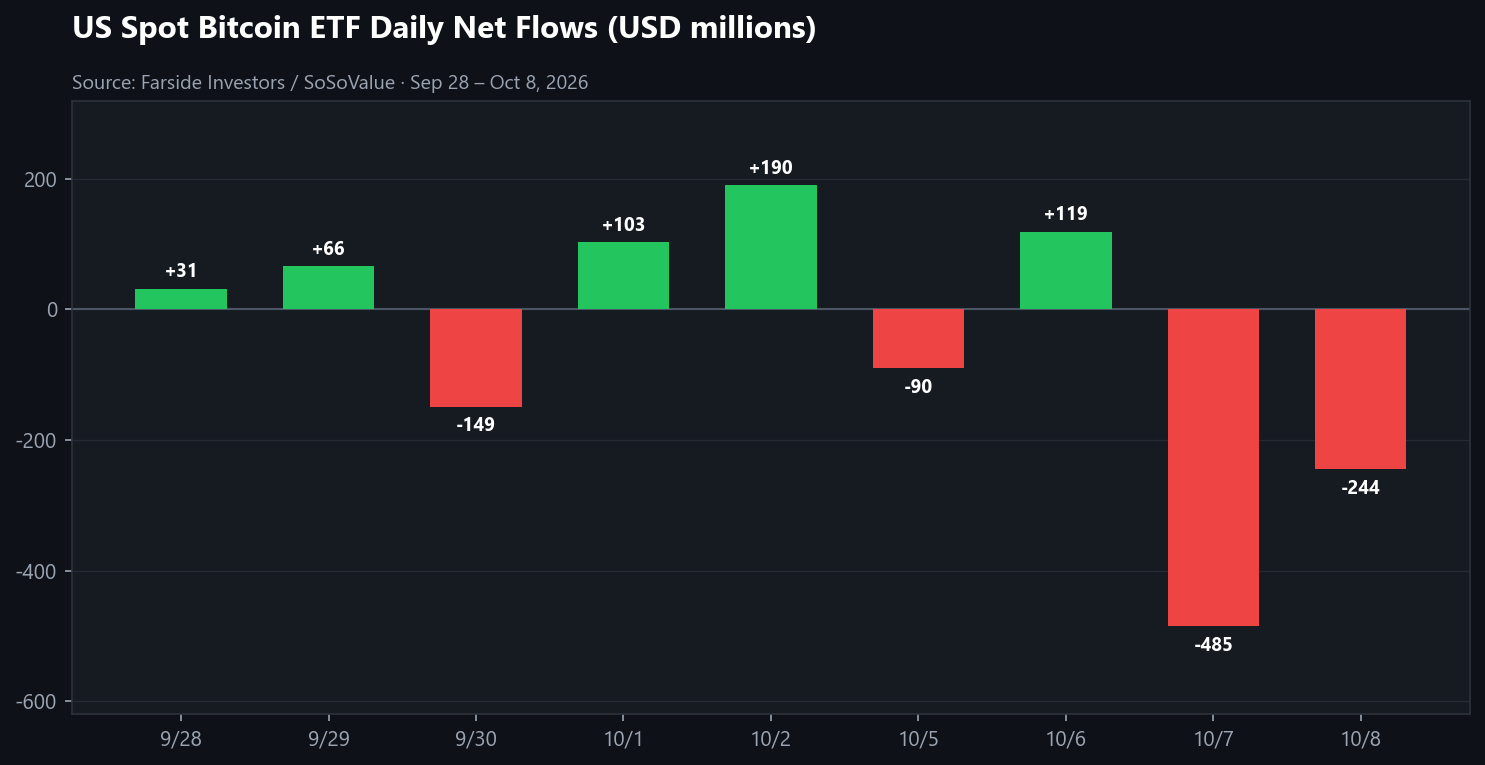
On October 7, U.S. spot ETFs saw net outflows of $485 million, followed by another $244 million on October 8. Social media started up with the “institutions are bailing” talk again.
But zoom out:
September saw net inflows of $2.65 billion, the second-highest monthly total since October 2025; August was even higher, at $3.52 billion.
Inflows totaled $2.4 billion in the week of September 21–25, the strongest single week of the year; net inflows continued for three consecutive weeks afterward.
ETFs hold about $108 billion in total net assets, around 6.4% of Bitcoin’s total market cap, with cumulative net inflows of about $57.8 billion since their launch.
A $485 million outflow in a single day sounds scary, but it represents only about 0.4% of total ETF assets—and is less than half of the largest single-day outflow on record ($1.11 billion). Daily flows are noise; monthly trends are the signal, and the monthly trend has already turned since August ✅
III. On-chain highlight: three waves of concentrated whale accumulation 🐋
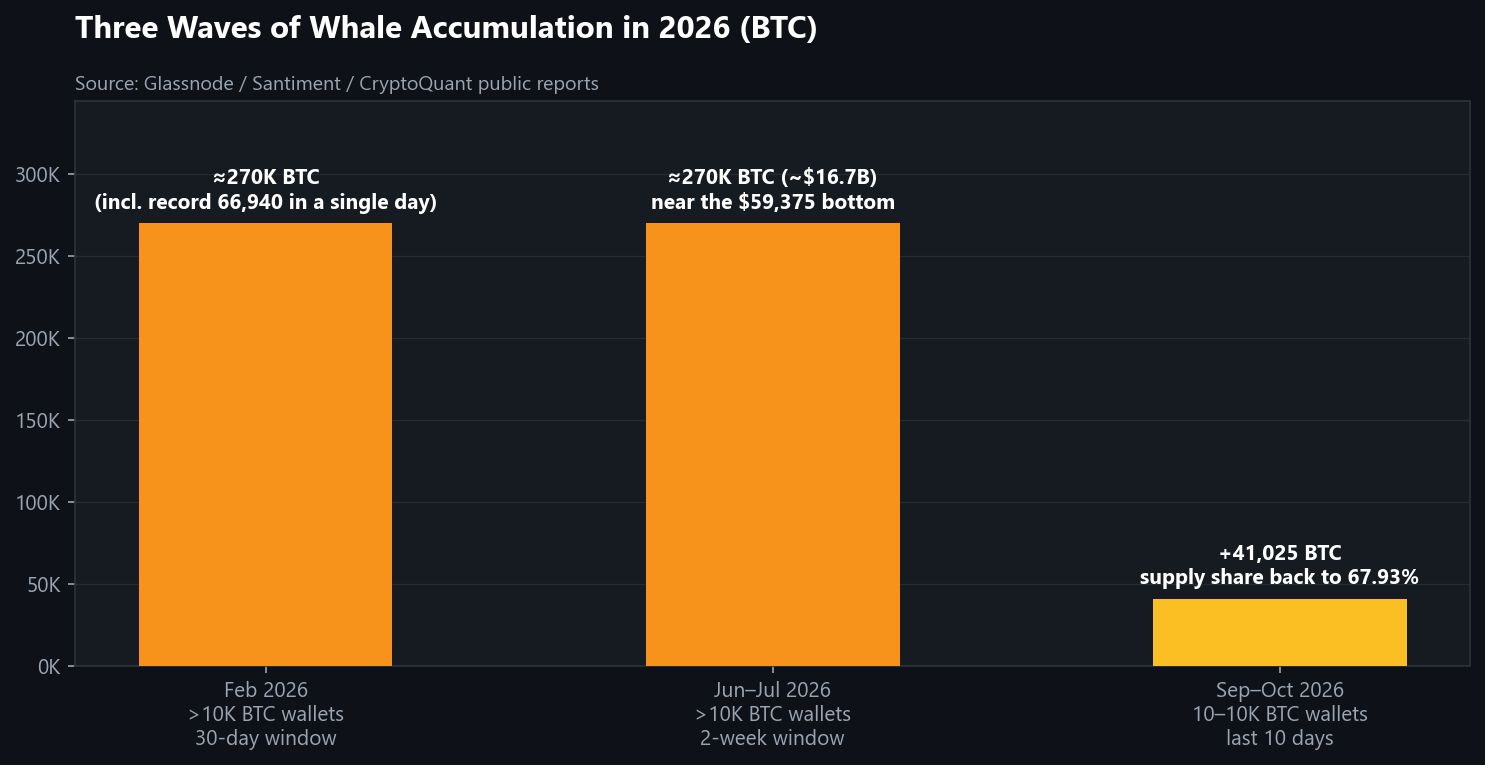
This is the most data-heavy part of this update. So far in 2026, on-chain data has shown three distinct waves of whale accumulation:
The first wave came in February: wallets holding more than 10,000 BTC accumulated a net total of about 270,000 coins in 30 days. On February 6 alone, 66,940 coins flowed into accumulation addresses, setting an all-time record.
The second wave came in June–July: near the cycle bottom at $59,375, the same group of super-whale wallets scooped up another 270,000 coins (about $16.7 billion) in just two weeks, while ETFs were experiencing their worst monthly outflows on record. Whales and retail investors were moving in completely opposite directions.
The third wave is happening now: Santiment data shows that wallets holding 10–10,000 BTC have accumulated another 41,025 coins over the past 10 days. These wallets now control 13.64 million BTC, or 67.93% of the total supply—the highest level since the August rally began.
Two rounds of whale accumulation—each involving around 270,000 coins within the same cycle—both landed precisely at local lows. This double-bottom, double-accumulation pattern is more convincing than looking at either wave alone 🚀 By contrast, retail wallets holding less than 0.01 BTC have barely moved. Santiment’s conclusion is clear: the combination of retail investors staying on the sidelines or capitulating while whales continue accumulating has historically been a harbinger of a market reversal.
IV. Supply: fewer and fewer coins are available to sell ⛏️
Exchange reserves have fallen to about 2.4–2.7 million BTC, their lowest level in nearly seven years, accounting for around 8.3% of the circulating supply (versus 12.8% in 2020). Coins that aren’t on exchanges aren’t sitting there ready to be dumped at any moment.
59.1% of the supply has not moved in over a year (about 11.84 million coins), and long-term holders returned to net accumulation in July.
Corporate holdings: Strategy now holds 845,050 BTC (at an average cost of $75,412) and resumed buying in late August; the U.S. Strategic Reserve holds 328,372 coins.
The biggest event is still ahead: the fifth halving in April 2028, when the block reward will drop from 3.125 to 1.5625 BTC, cutting new supply from about 450 coins to 225 per day.
In short, on the supply side: exchange shelves are getting emptier, diamond hands are holding tighter, and new coin issuance will be cut in half again in a year and a half 💎
V. My clear position: accumulate spot BTC, with a $300,000 target for 2028 💎🙌
My view is straightforward: at this point, I have just one strategy—accumulate spot BTC in batches, avoid leverage, and treat BTC as the anchor of my entire portfolio.
Those who know me know that altcoins have always been my main focus. But precisely because I focus on altcoins, this is the stage when I need to build a solid BTC core position. Historically, BTC always moves first, with altcoins following later: only after BTC reclaims its cost basis and its market-cap dominance peaks and starts to fall does capital spill over in stages, from Bitcoin to Ethereum and then to altcoins. That’s when altcoin season really gets going. What we’re seeing on-chain now is whales aggressively buying BTC—it’s like someone is setting the table for the whole feast. Hold on to your BTC core position, and when the wind picks up, you’ll have the capital and conviction to make your move into altcoins.
As for $300,000 in 2028, let me explain why it’s not just a number pulled out of thin air:
First, the pattern of diminishing returns. In the previous cycle, BTC rose about 8x from the 2022 low of $15,500 to the 2025 high of $126,198. Starting from this cycle’s low of $59,375, BTC only needs to rise about 5x to reach $300,000. That’s entirely consistent with the historical pattern of diminishing returns across cycles—in fact, it’s on the conservative side.
Second, the supply-demand scissors. After the halving, only 225 new BTC will be produced each day, worth about $18.6 million at current prices. At the pace of ETF inflows seen in September, ETFs can absorb several months’ worth of new supply in a single week. Institutional demand is flowing in while supply is contracting, so prices can only rise to find a new equilibrium.
Third, market-cap comparisons. At $300,000 per coin, BTC’s total market cap would be about $6 trillion, less than a third of gold’s market cap. If the digital-gold narrative materializes by just one-third, that alone is enough to make this target attainable.
Fourth, the time window. The halving is in April 2028, and historically the 12–18 months around a halving have been the window for the main rally. In other words, 2027–2028 is harvest season for this cycle, and the time from now until 2027 is the final accumulation phase 🚀
Between BTC at $82,000 and BTC at $300,000, the only things standing in the way are time—and whether you can hold on.#BTC #ETH

