

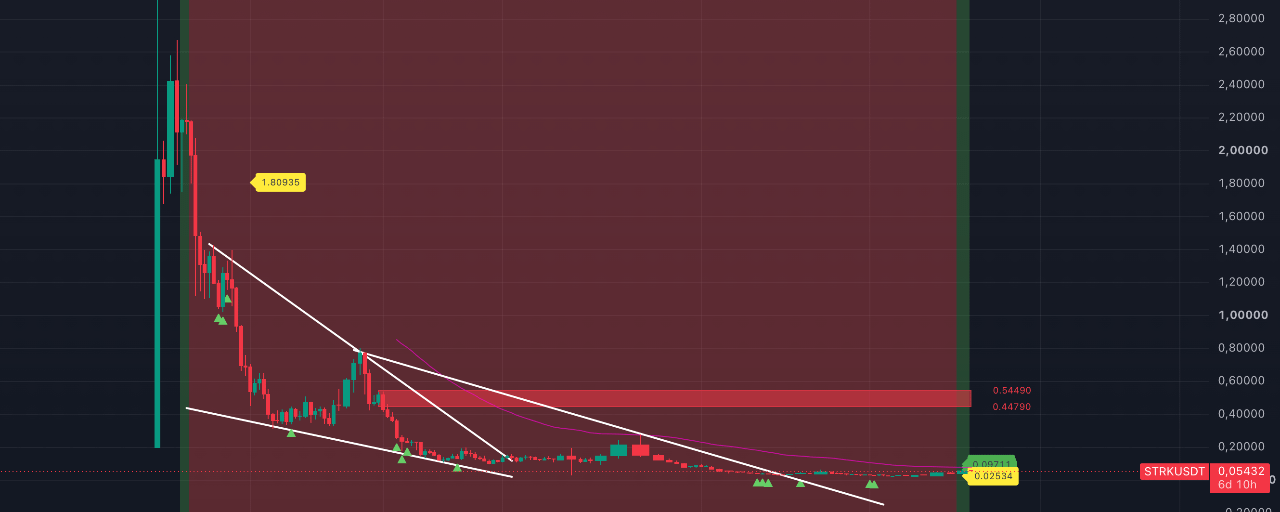


A milestone for STRK — for the first time in its history, the asset has entered a sustained uptrend on the weekly timeframe. As you can see, the initial targets are $0.06521, $0.08116, and $0.09711. The level that could potentially break the uptrend is $0.02534.
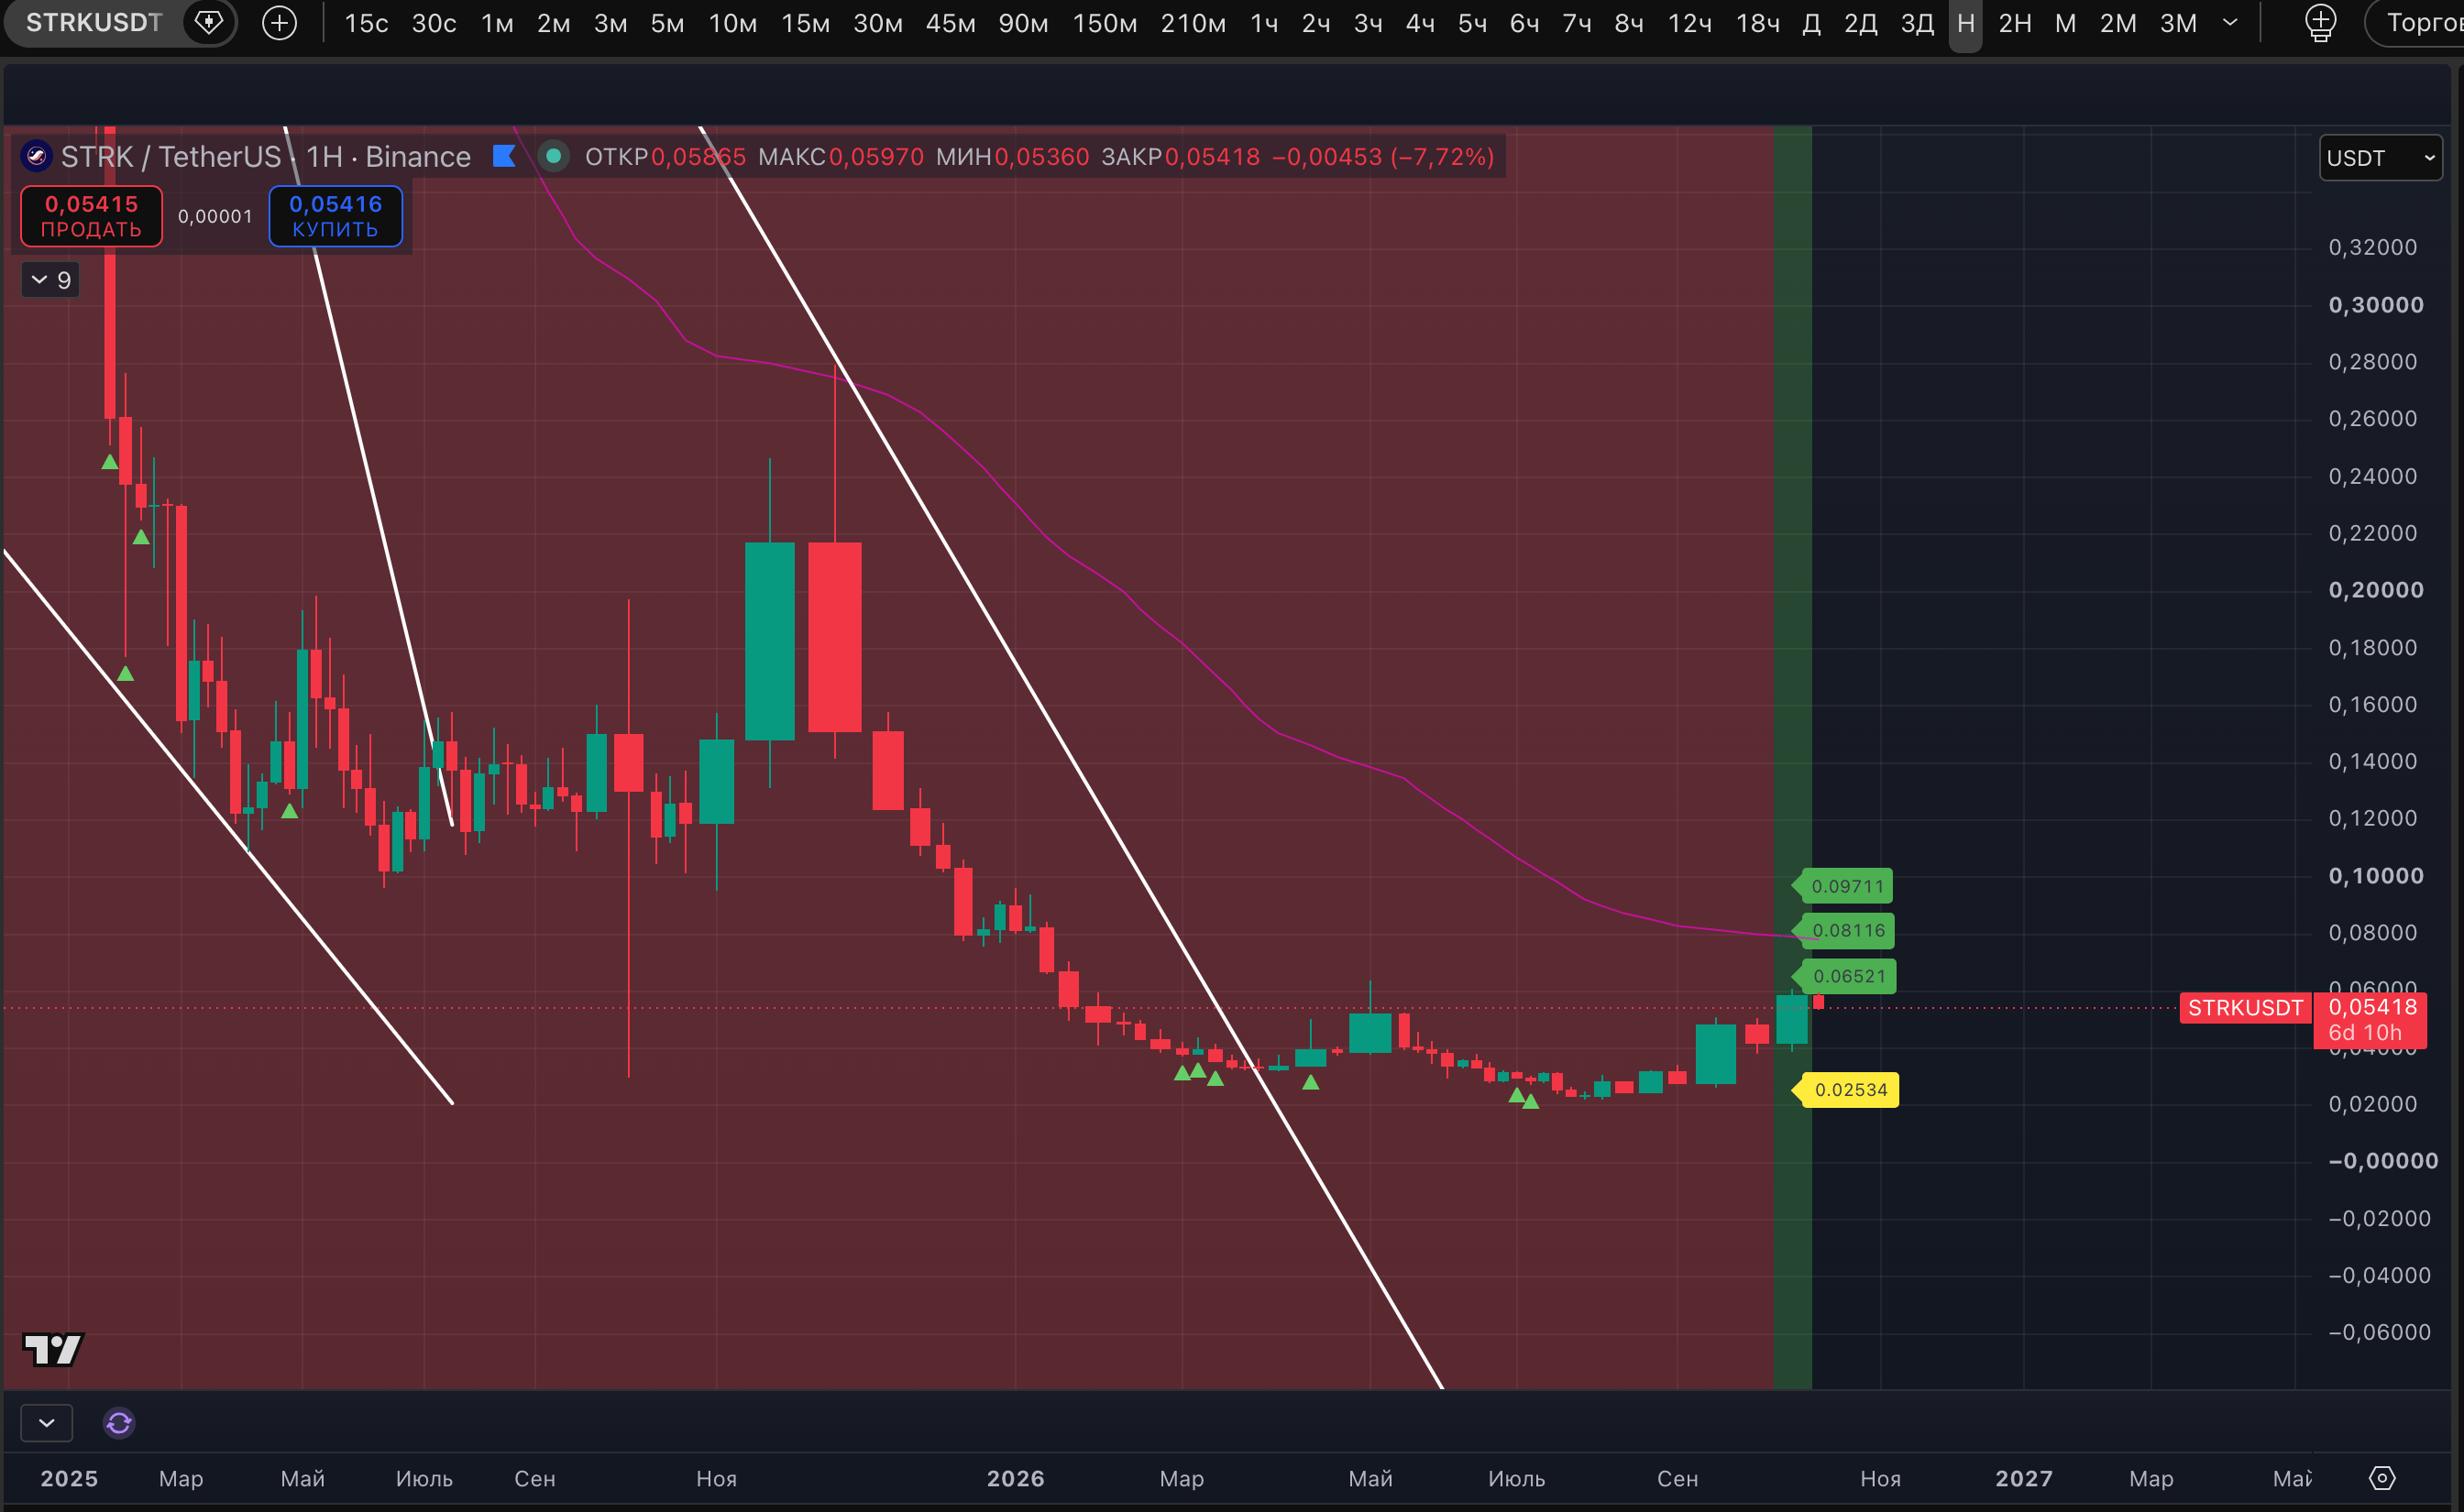
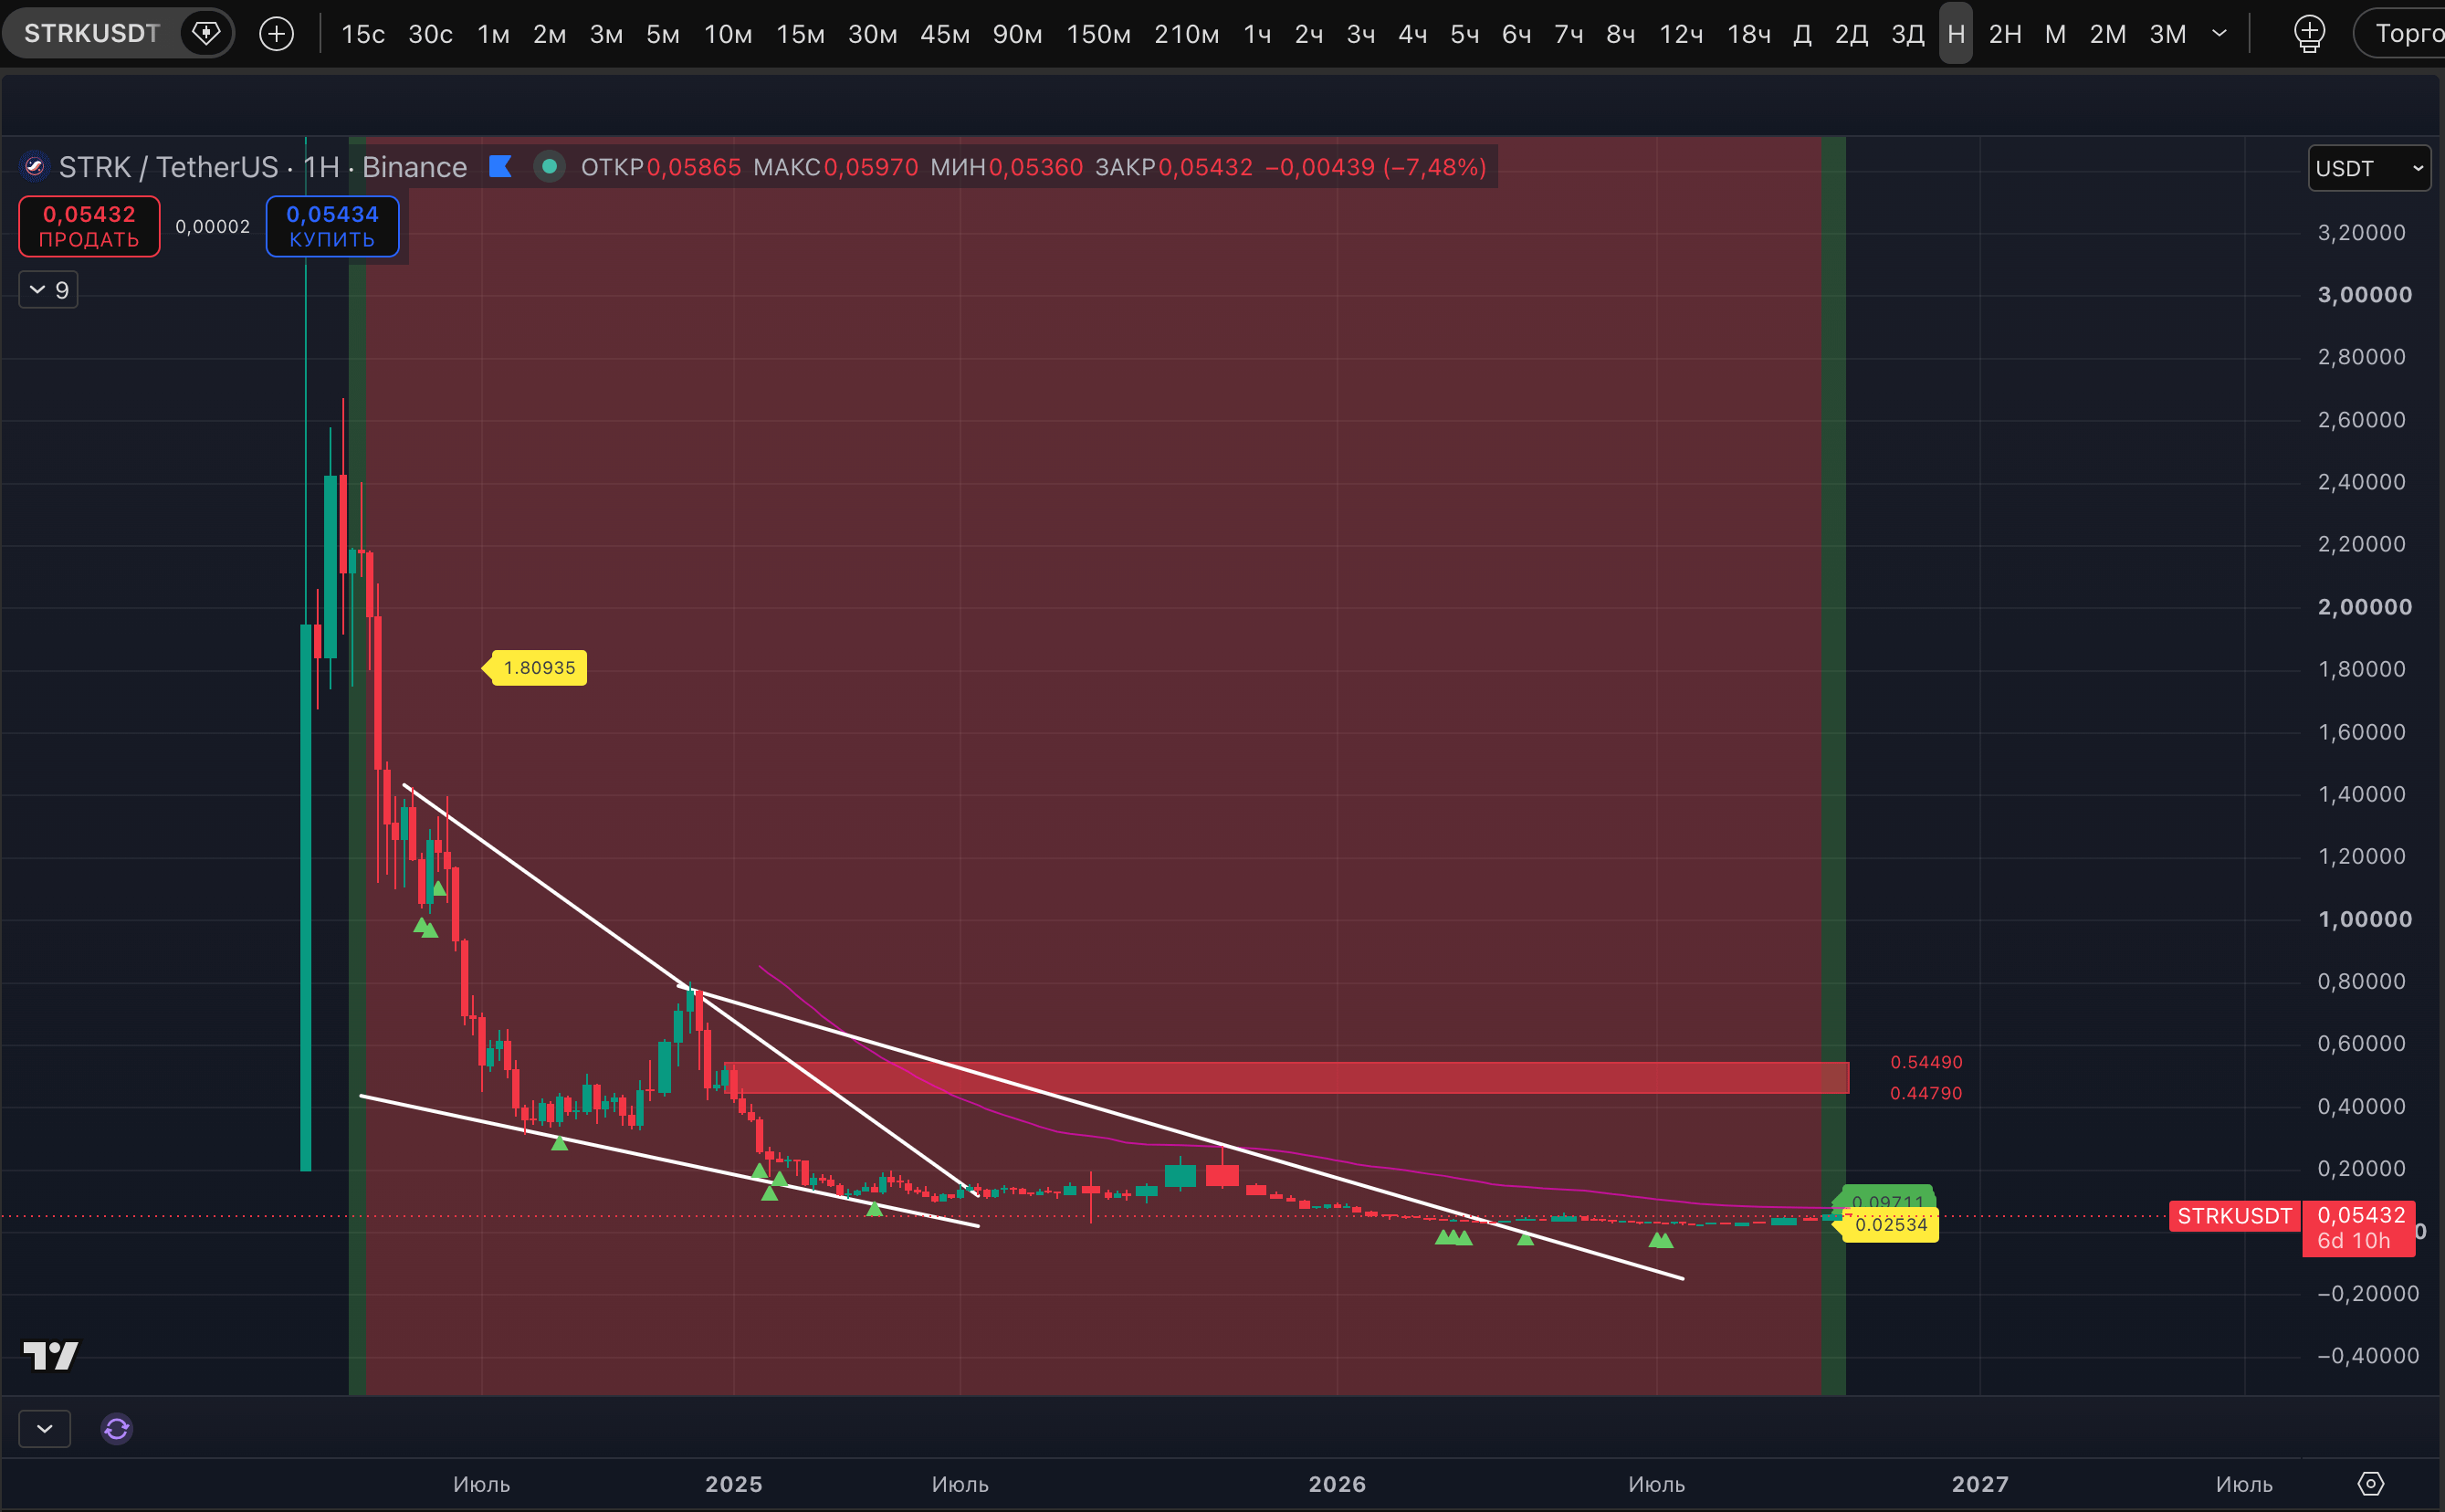
This means that on the weekly timeframe, #STRK has finally (and let’s emphasize, for the first time in its history) shifted into an uptrend structure. So, if you buy it now, you’re buying an asset that’s rising on the weekly chart, rather than one searching for its 101st bottom.
This does NOT mean steady growth, of course. But it does mean that dumps in this asset are now a genuine opportunity to buy low and sell high—not to buy low and then wonder where to average down. On the weekly timeframe, the nearest significant liquidity zone according to our P73 Smart Liquidity Zones is $0.44790–0.5490. As long as the price is in a sustained uptrend on the weekly timeframe, it will move toward that zone.
As you can see in the screenshot, with the new weekly candle, the asset is showing a price pullback. Technical signals pointing to this pullback are also visible on the lower timeframes: there is a Strong signal for a potential high on the 3-, 4-, 5-, 6-, and 7-hour timeframes. As these signals play out, the price has already moved into a sustained downtrend on the hourly timeframe, with initial targets down to $0.05047.
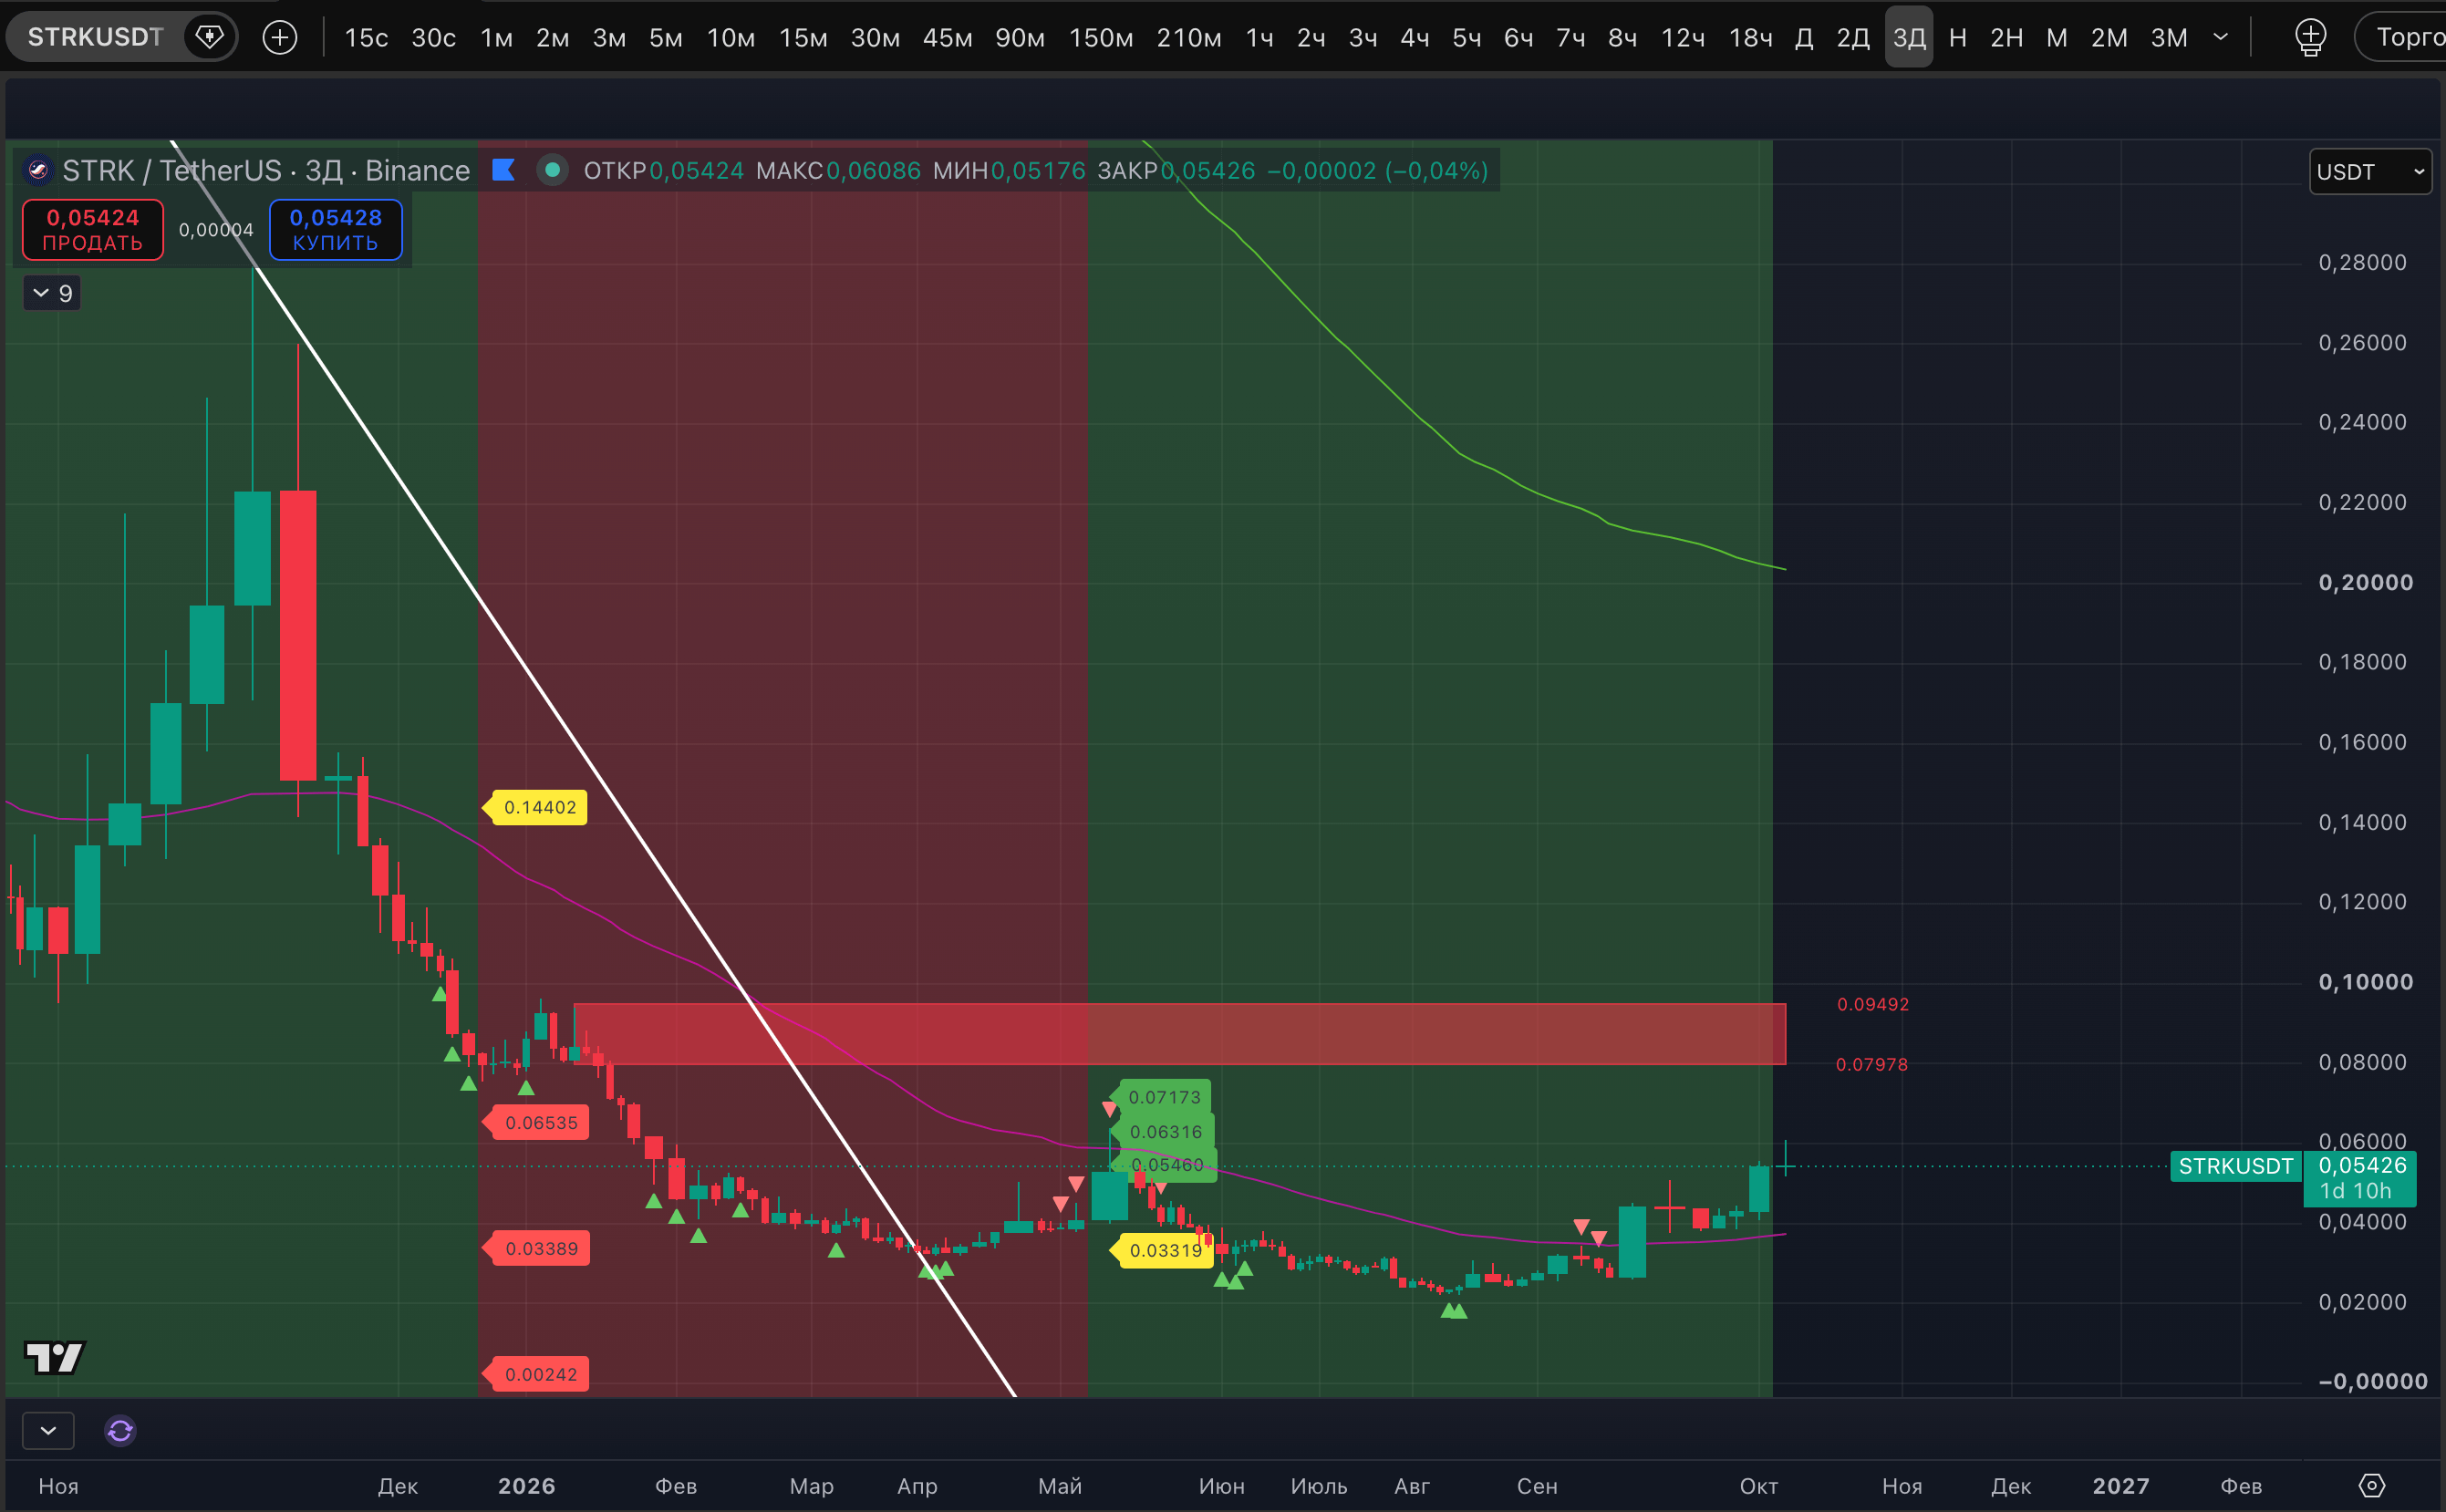
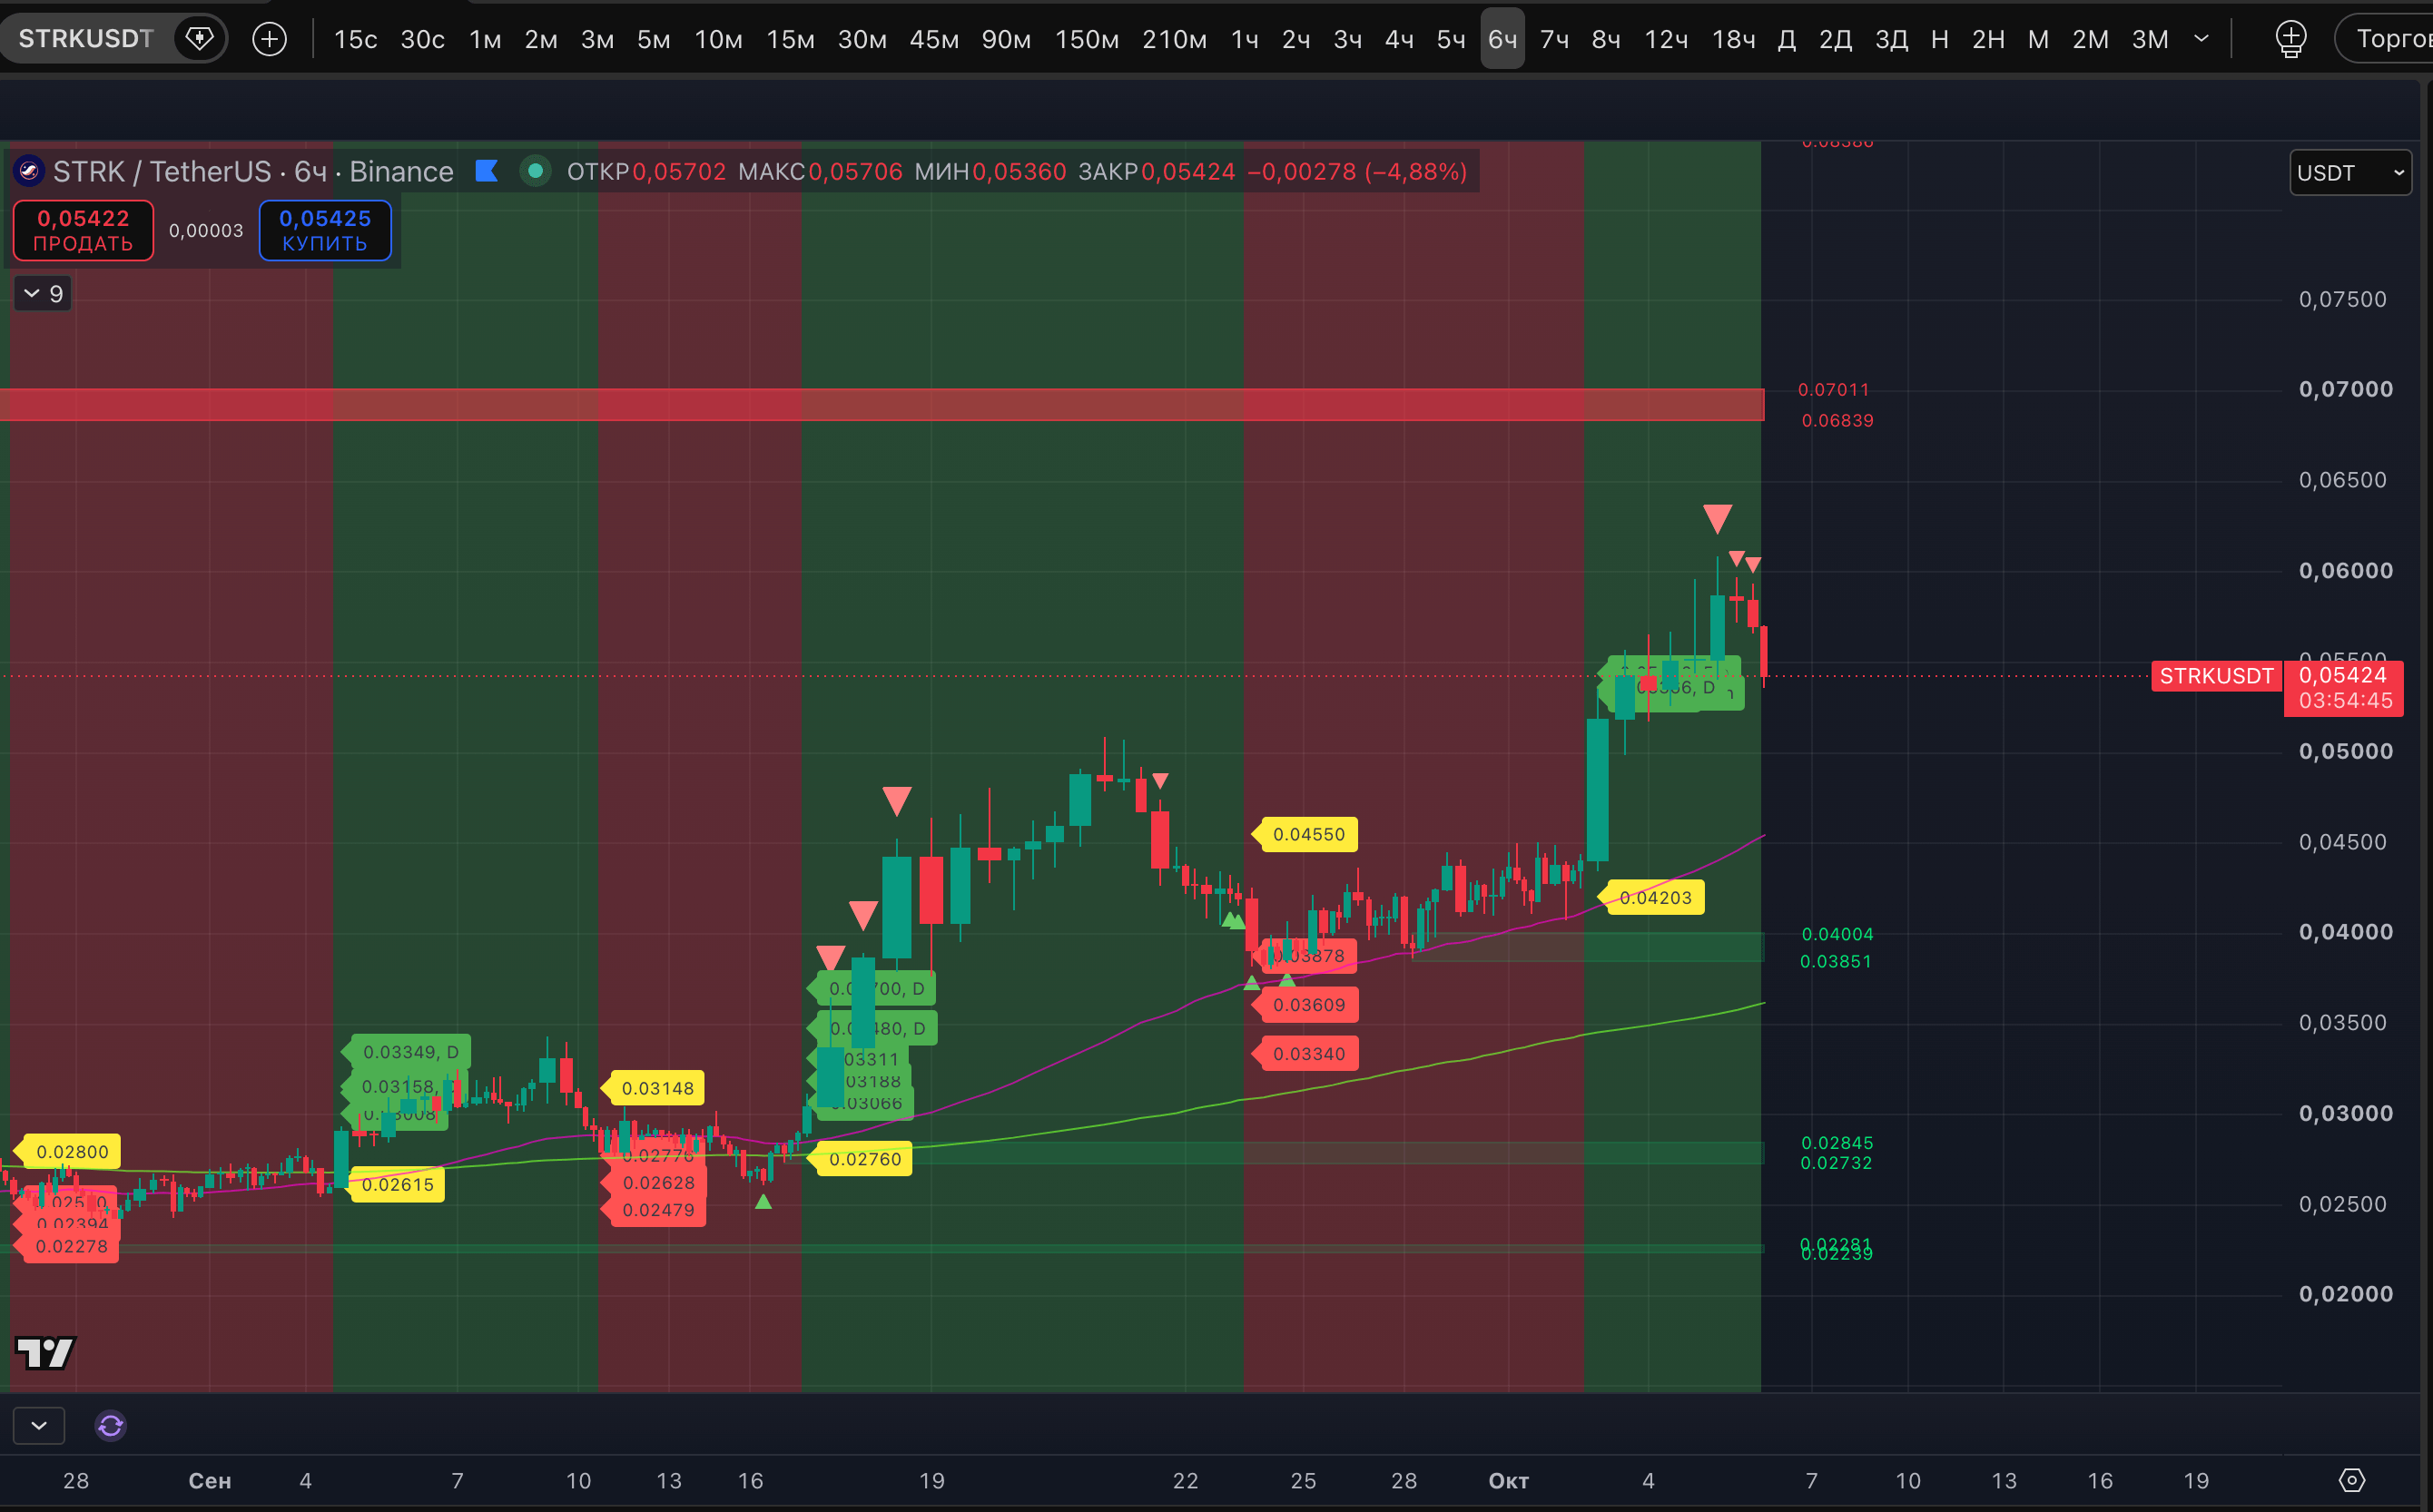
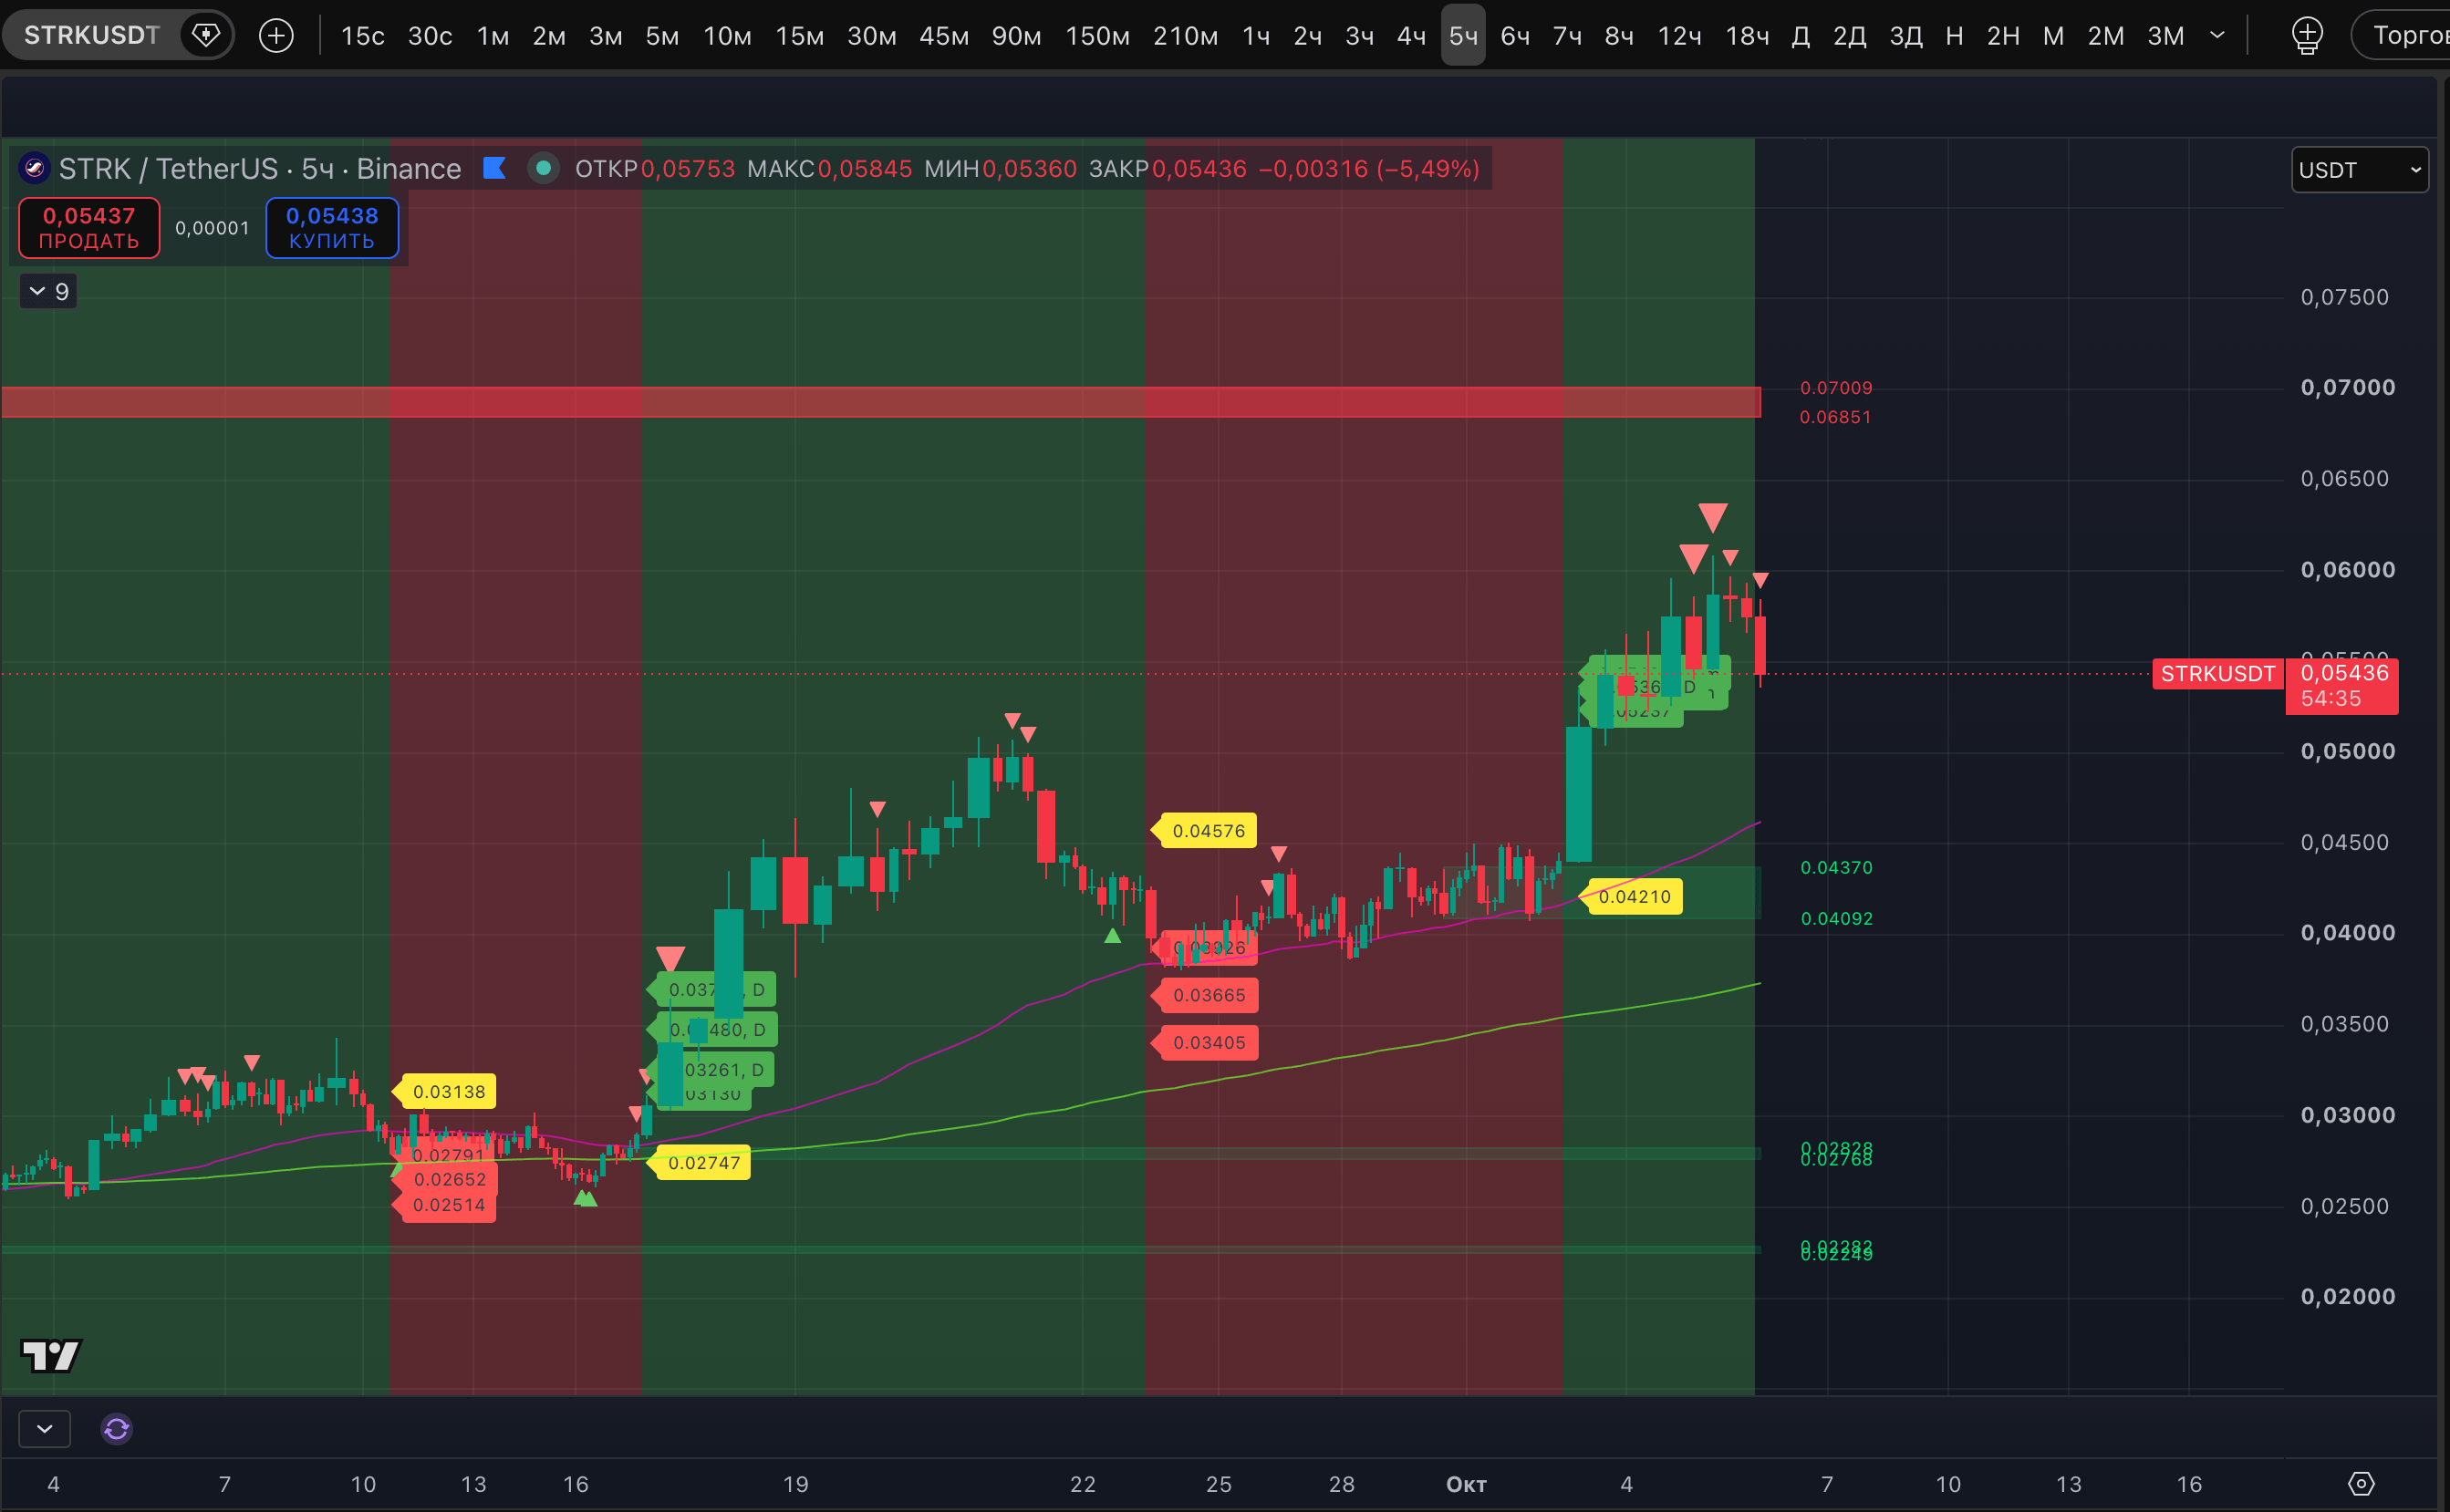
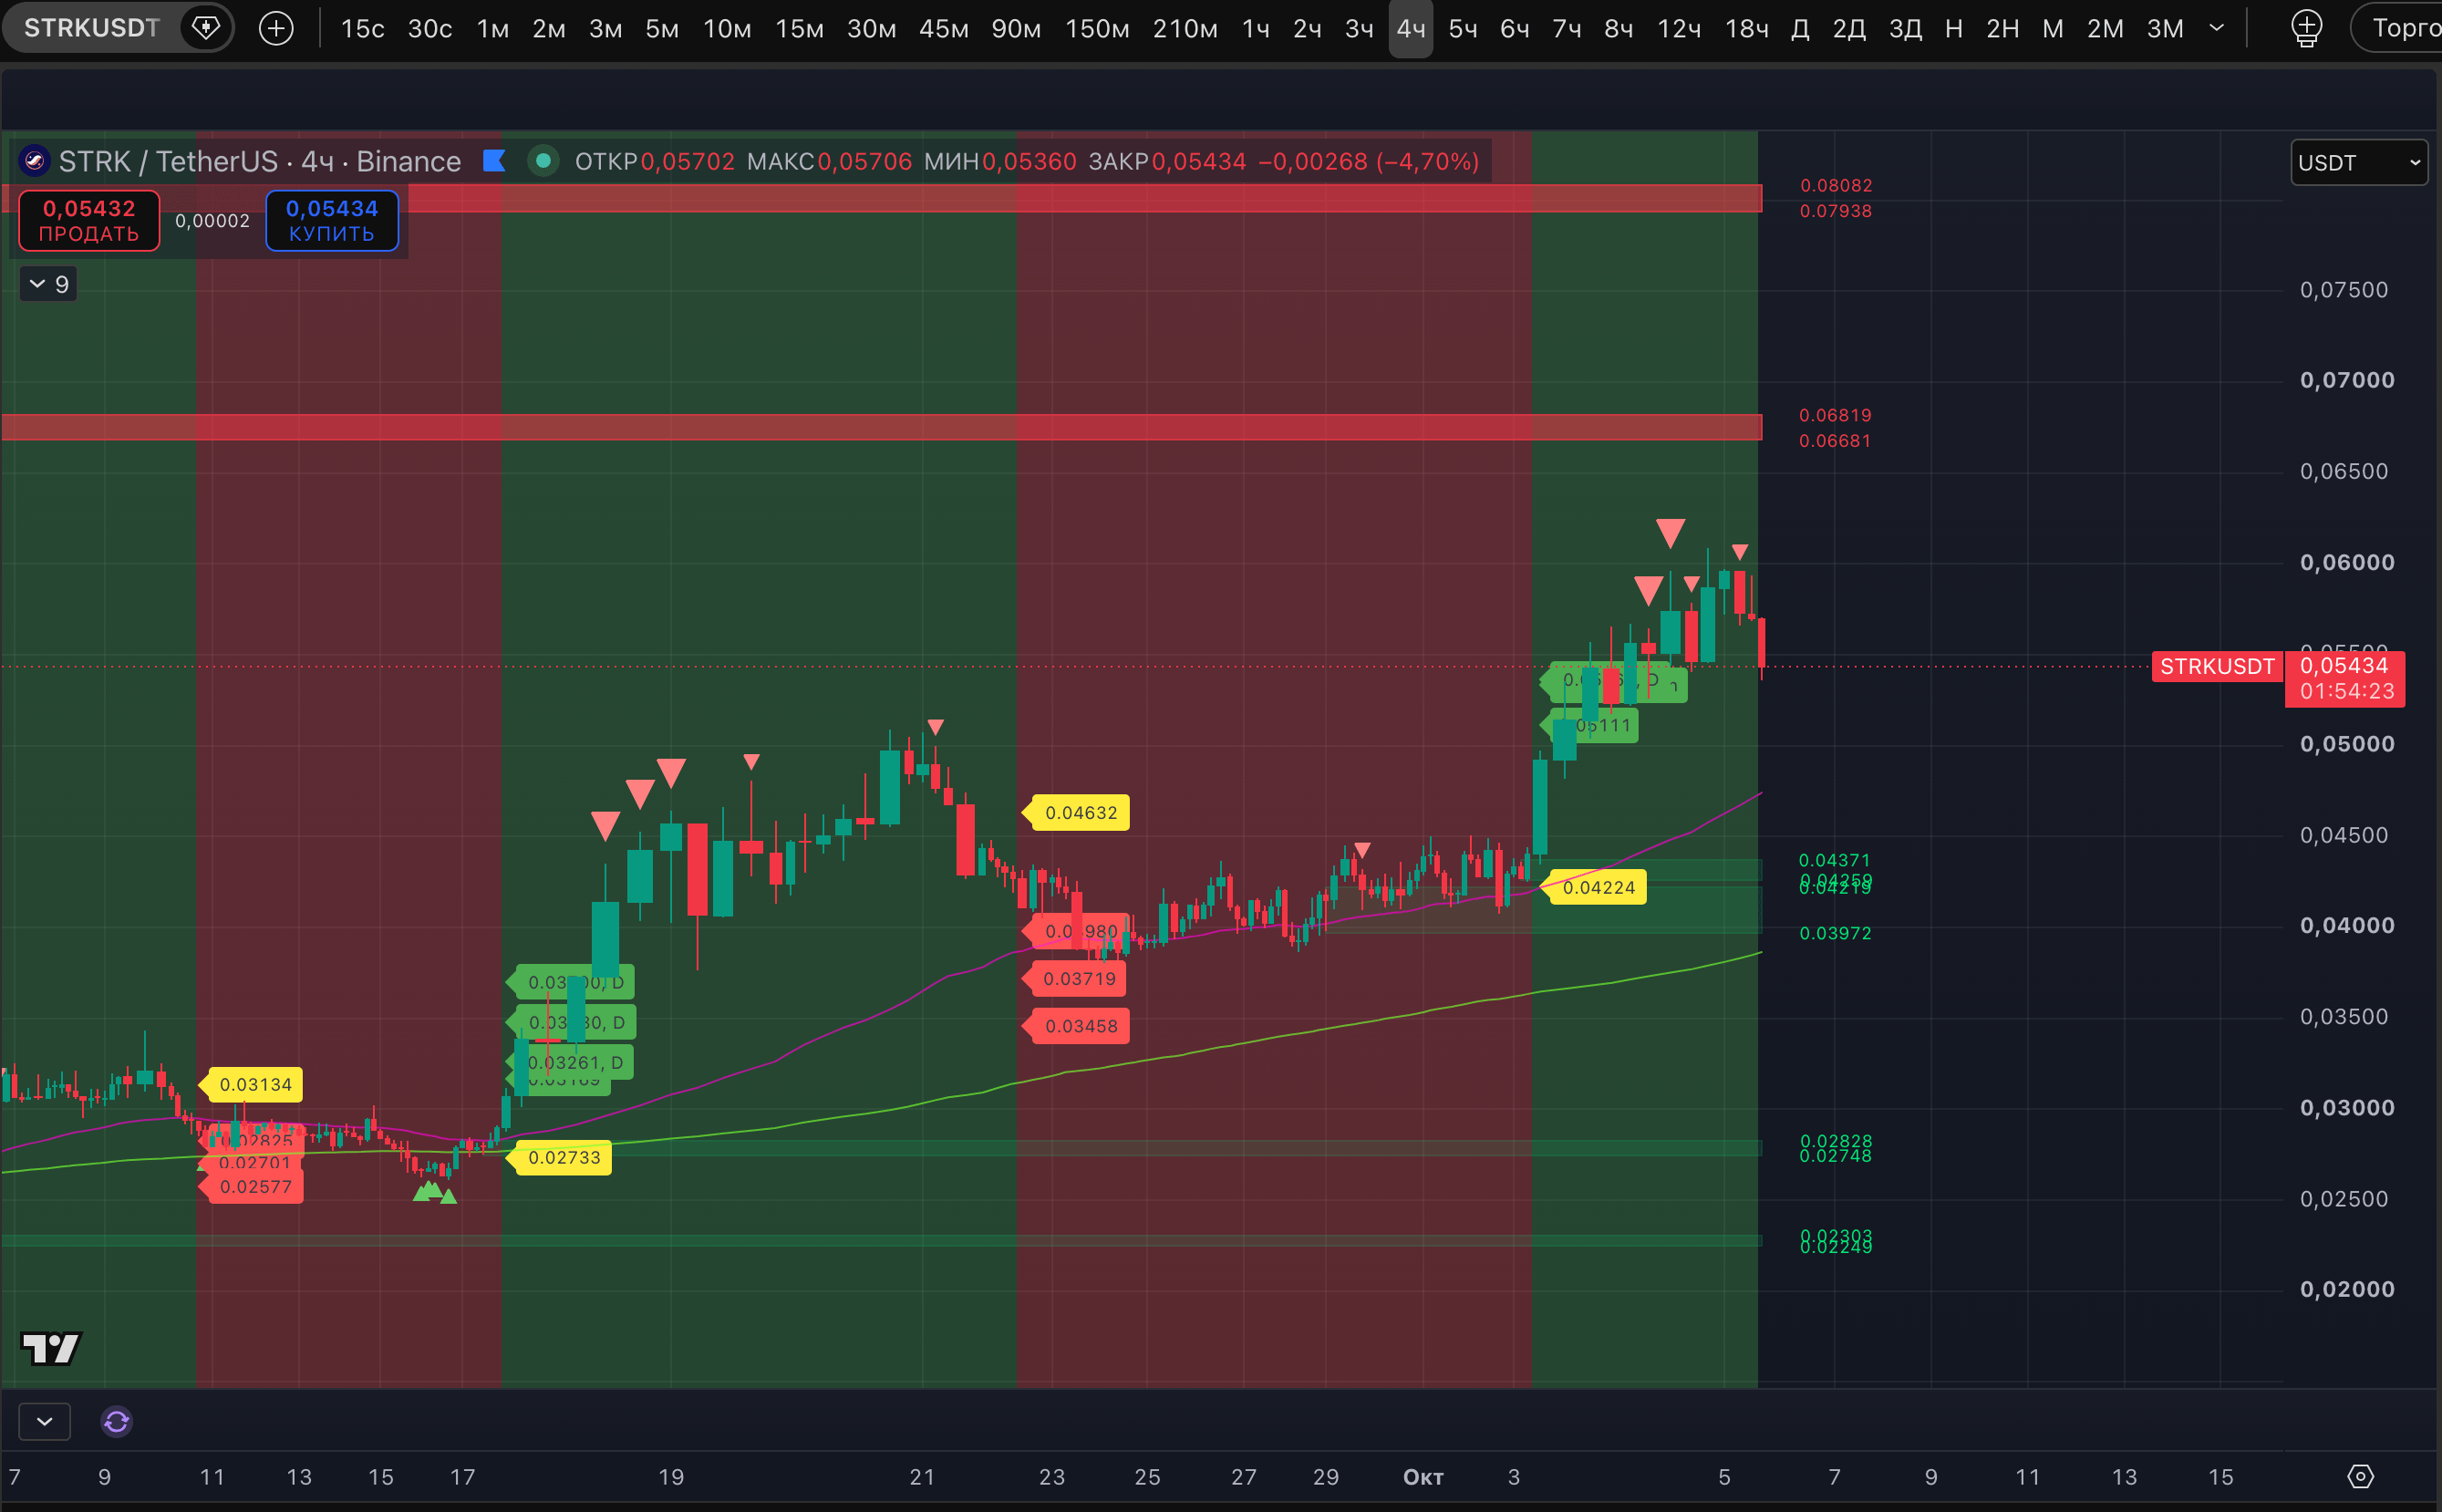
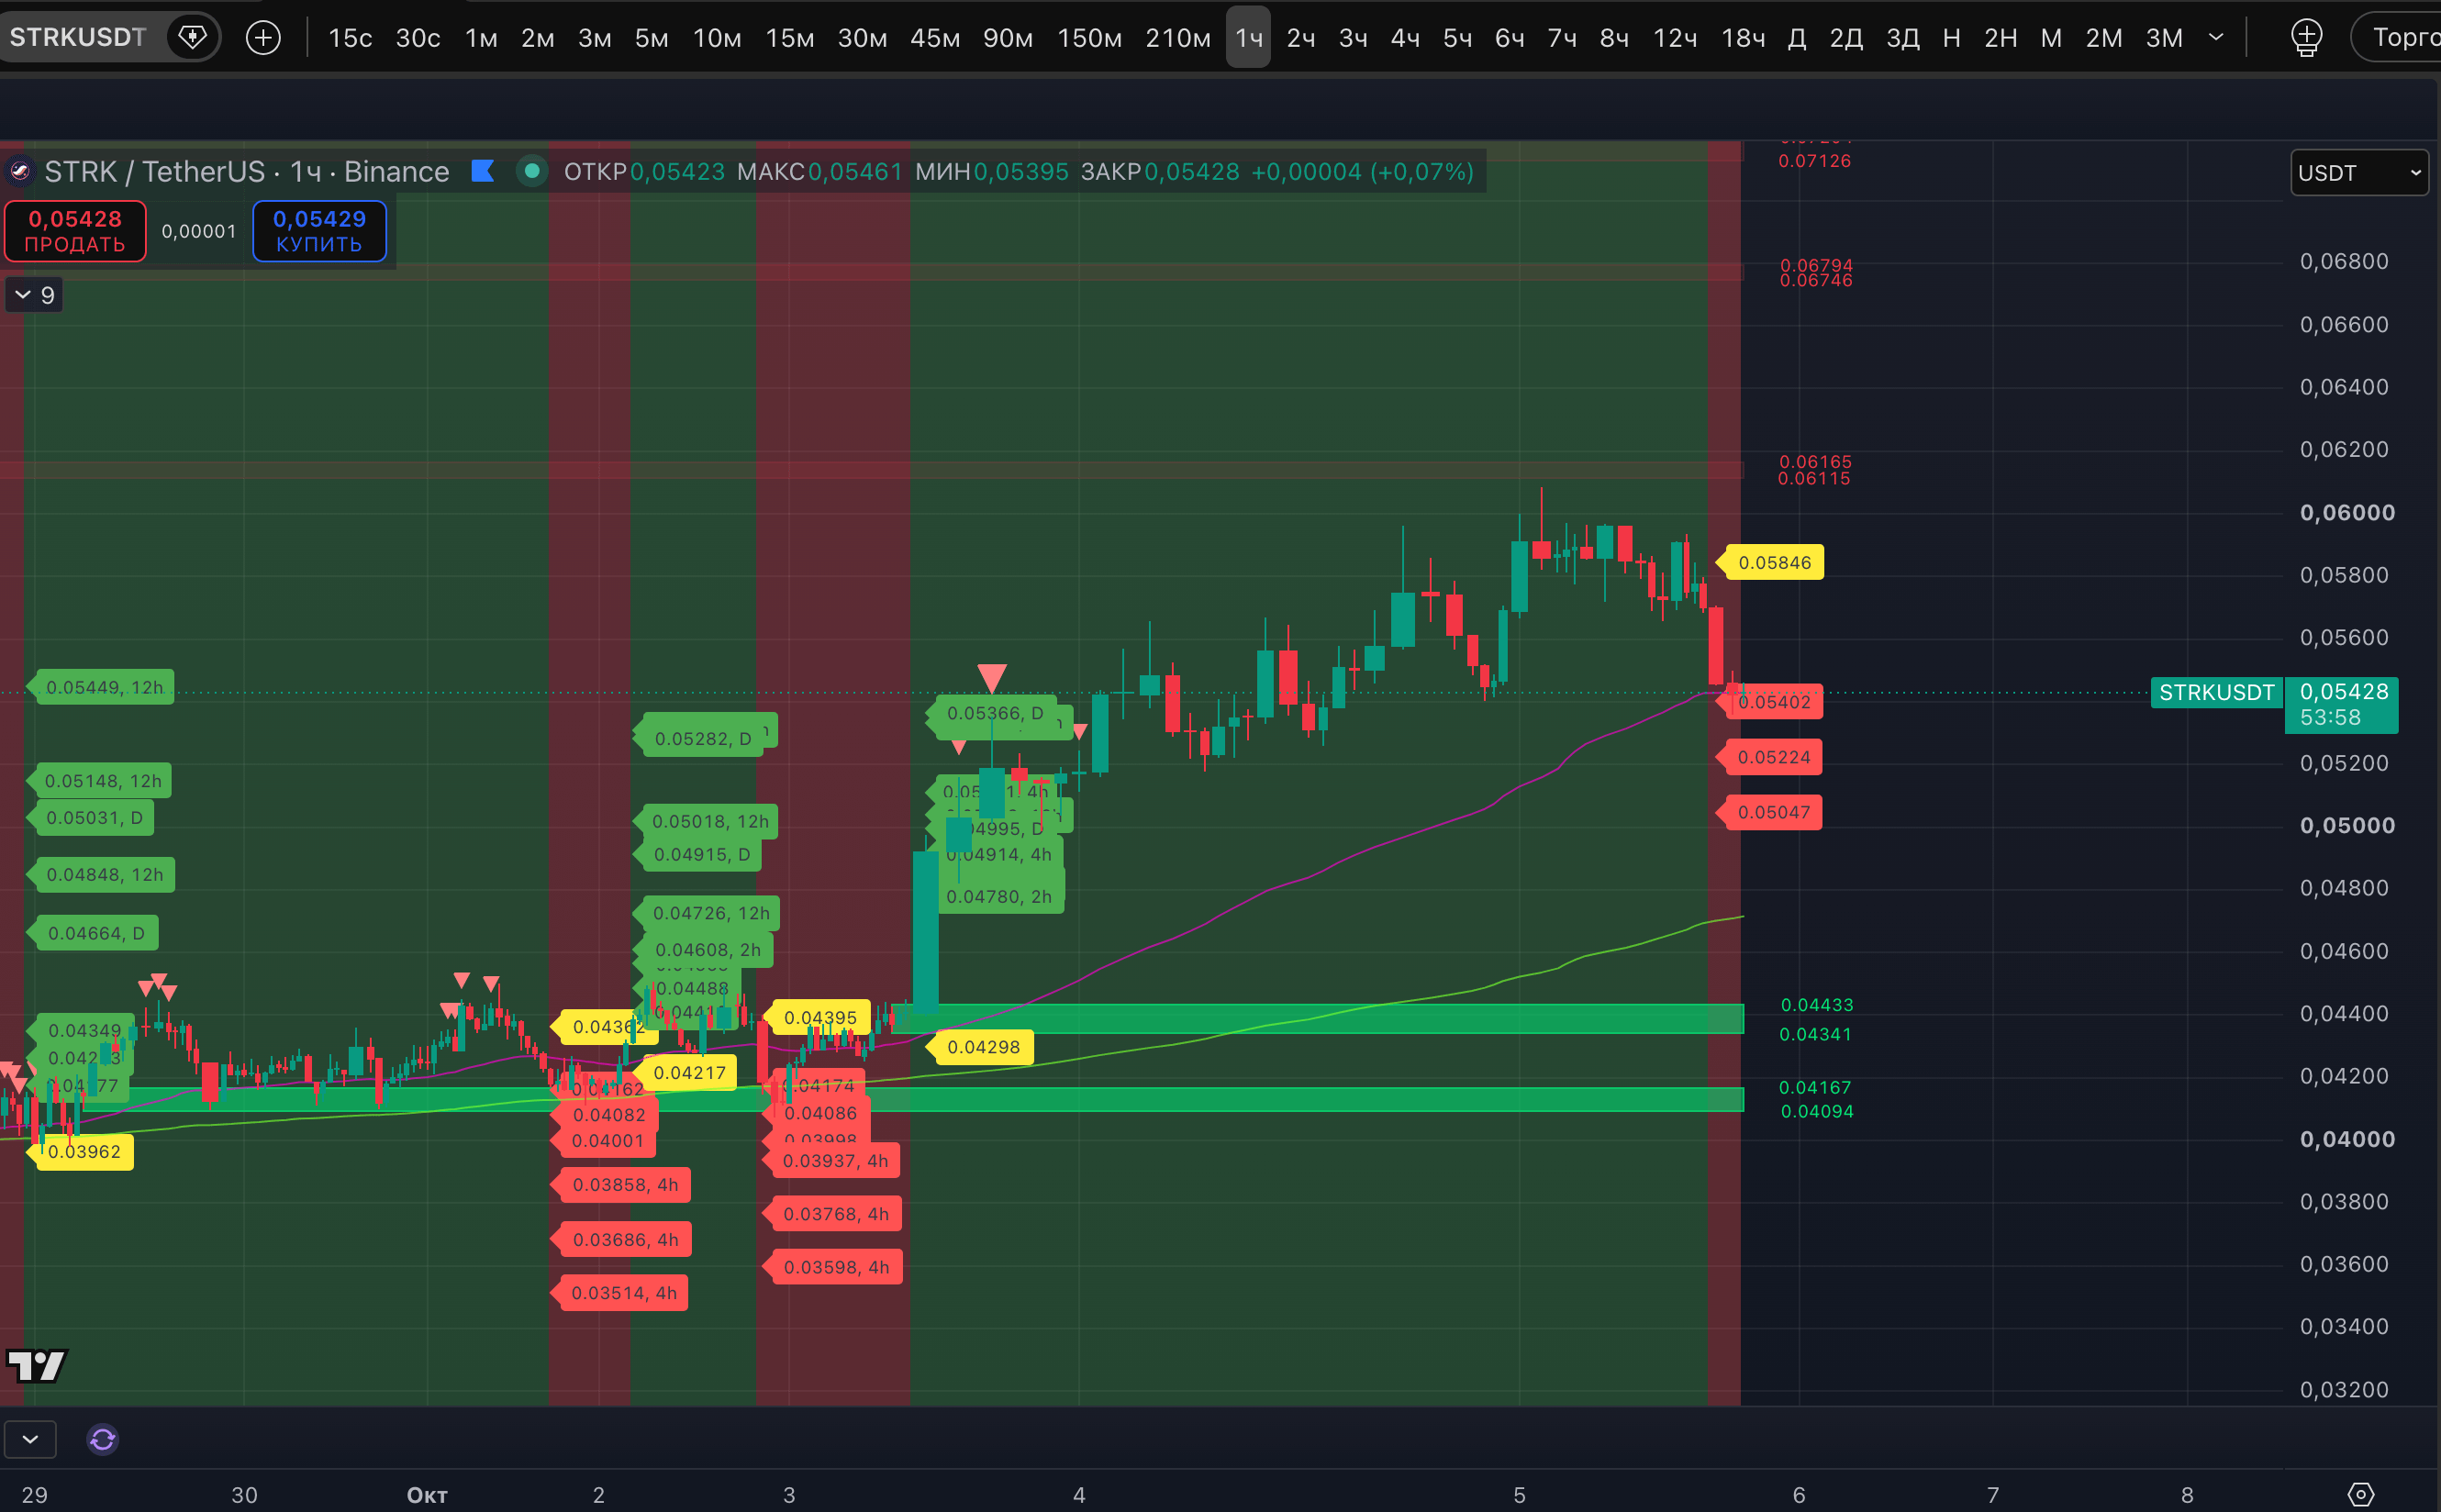
If the market pullback we expect begins in October, the asset will likely show even more attractive prices. In a correction scenario like a “COVID dump,” one could even look for a test of the level that could potentially break the weekly uptrend: $0.02534. But this is not the primary scenario to wait for before making most of your purchases.
For long-term purchases of the asset, good initial reference points right now would be the potential low markers on timeframes from 4-hour and higher (with particular emphasis on the 12-hour timeframe and higher), as well as a Strong signal for a potential low on timeframes from hourly and higher. This is especially true if the price is testing liquidity zones on the corresponding timeframes.