📊 $BNB BNB COIN — TECHNICAL ANALYSIS
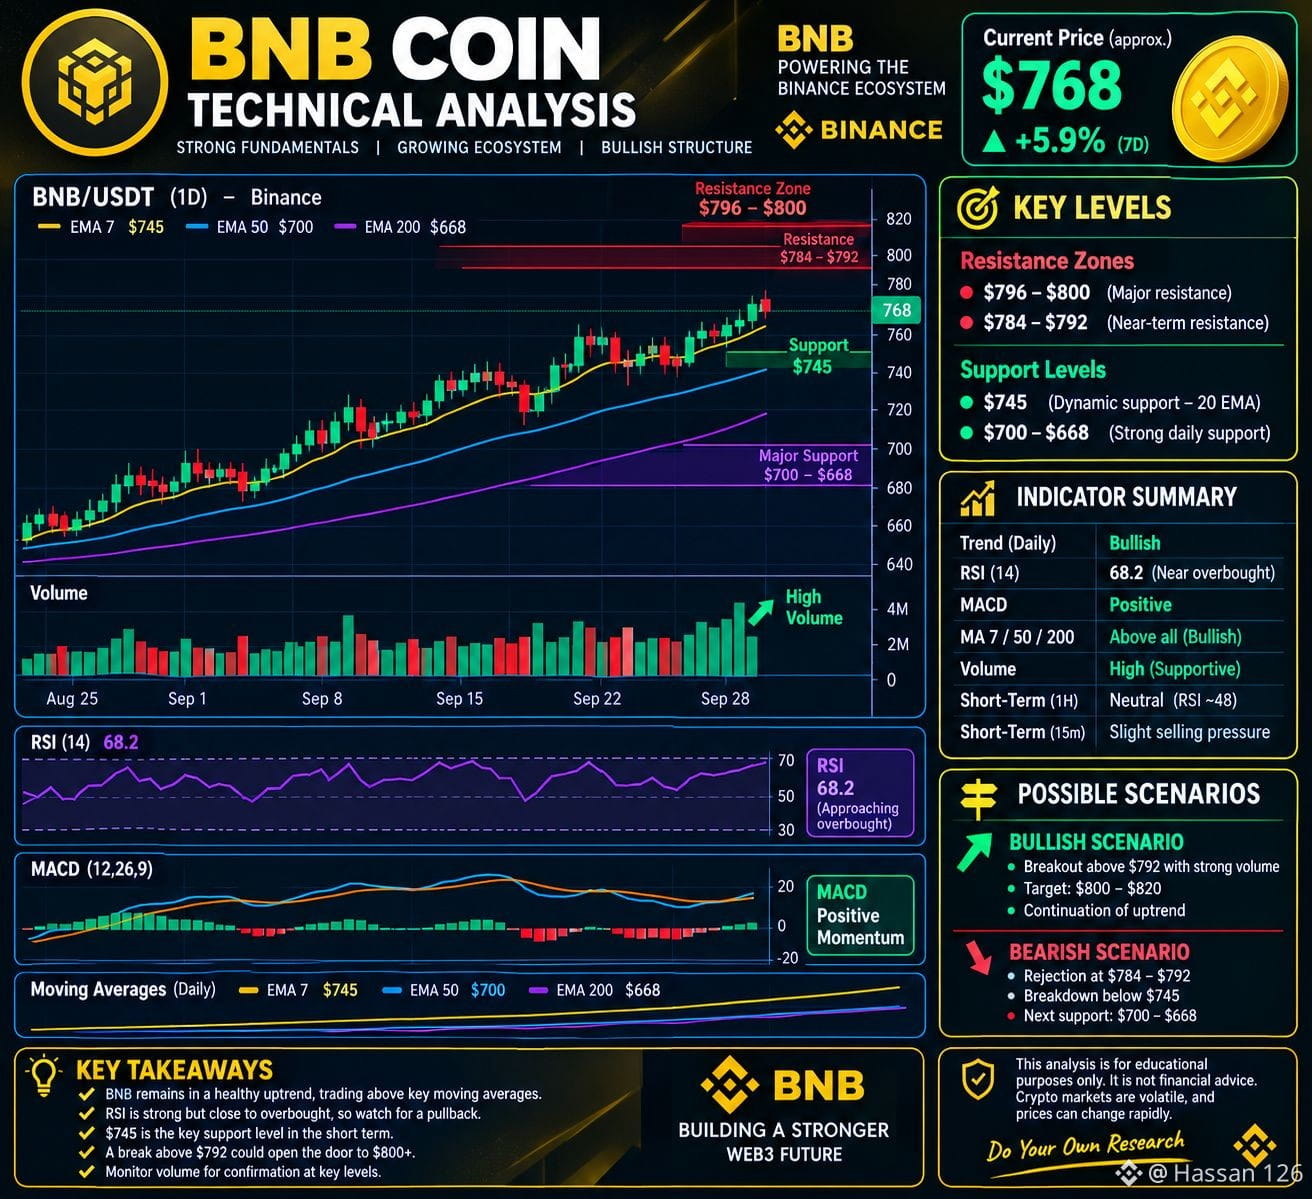
BNB is currently trading around the $768 area, after a strong recent move.
The 7-day performance remains positive at roughly +5.9%.
On the daily timeframe, BNB continues to show a bullish technical structure.
Price remains above the 20, 50 and 200-day EMA's, supporting the broader uptrend.
The 20-day EMA is around $745, providing an important dynamic support zone.
The 50-day EMA is near $700, while the 200-day EMA is around $668.
Daily RSI was recently around 68, showing strong momentum but approaching the overbought region.
MACD remained positive, indicating that medium-term momentum was still favorable.
Shorter timeframes are less decisive, with the 1-hour RSI around the neutral 48 level.
The 15-minute chart showed some short-term selling pressure and weaker momentum.
The $784–$792 area is an important near-term zone to monitor.
A sustained move above the $792 area could indicate renewed short-term strength.
The $796–$800 region represents another important resistance area from recent technical levels.
Around $784 is a notable near-term support level.
A deeper pullback could bring the $745 area into focus as a major daily support zone.
Trading volume should be monitored closely when BNB approaches major support or resistance.
Strong volume accompanying a breakout generally provides better confirmation than price movement alone.
The main bullish risk is a rejection near resistance followed by a loss of important support levels.
Overall, the daily structure remains positive while shorter-term momentum is currently mixed.
#BNB #bnblauncpool #BNBbull #BNB_Market_Update
BNB is currently trading around the $768 area, after a strong recent move.
The 7-day performance remains positive at roughly +5.9%.
On the daily timeframe, BNB continues to show a bullish technical structure.
Price remains above the 20, 50 and 200-day EMA's, supporting the broader uptrend.
The 20-day EMA is around $745, providing an important dynamic support zone.
The 50-day EMA is near $700, while the 200-day EMA is around $668.
Daily RSI was recently around 68, showing strong momentum but approaching the overbought region.
MACD remained positive, indicating that medium-term momentum was still favorable.
Shorter timeframes are less decisive, with the 1-hour RSI around the neutral 48 level.
The 15-minute chart showed some short-term selling pressure and weaker momentum.
The $784–$792 area is an important near-term zone to monitor.
A sustained move above the $792 area could indicate renewed short-term strength.
The $796–$800 region represents another important resistance area from recent technical levels.
Around $784 is a notable near-term support level.
A deeper pullback could bring the $745 area into focus as a major daily support zone.
Trading volume should be monitored closely when BNB approaches major support or resistance.
Strong volume accompanying a breakout generally provides better confirmation than price movement alone.
The main bullish risk is a rejection near resistance followed by a loss of important support levels.
Overall, the daily structure remains positive while shorter-term momentum is currently mixed.
#BNB #bnblauncpool #BNBbull #BNB_Market_Update