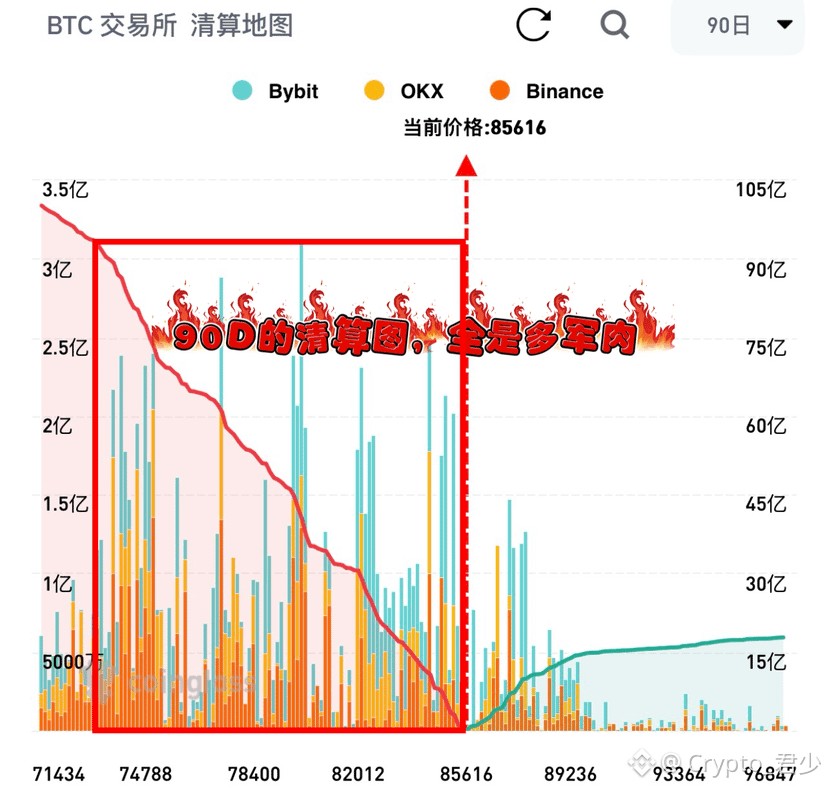

This chart is screaming: the bulls are going to die!
The near end isn’t extreme—the far end is where the money is made.
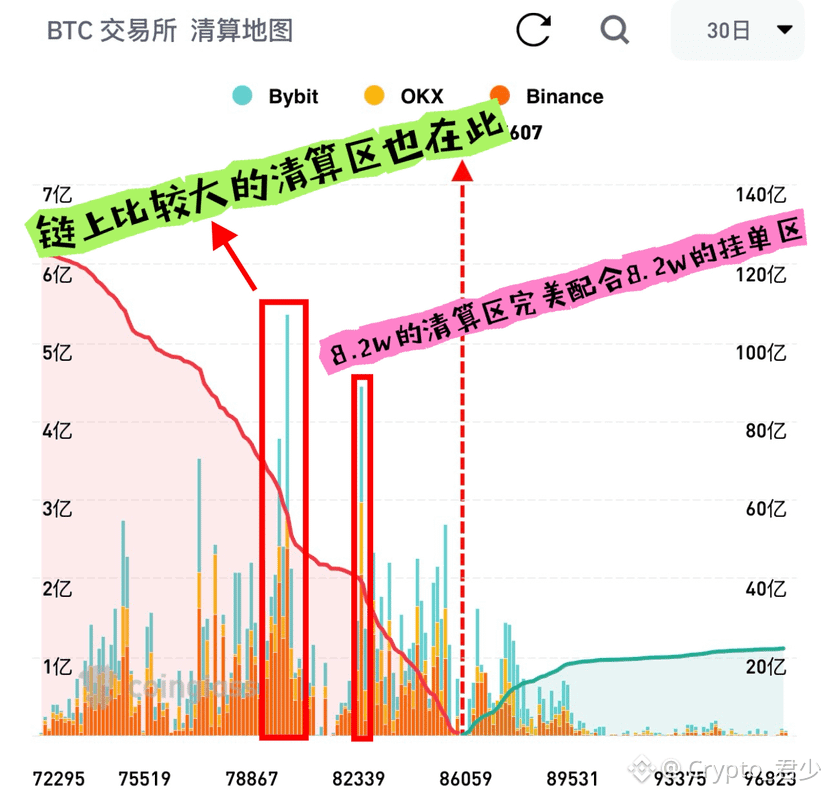
Looking at the liquidation chart, you can feel the panic in the chrysanthemums—so when are they going to smash it?
Break below 82K: major CEX bull liquidations are about 2.73 billion.
Climb above 90.7K: short liquidations are about 1.12 billion.
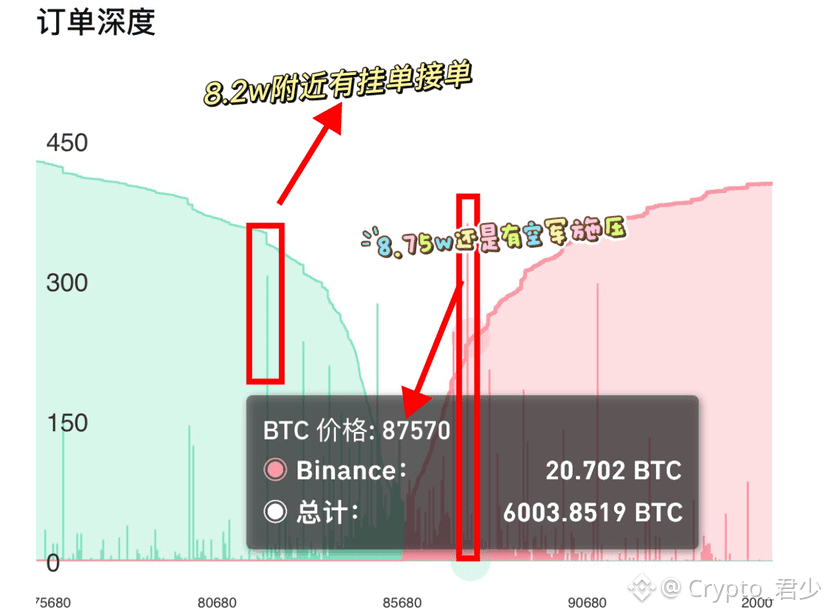
At 85.5k, one poke—that’s only a small wipeout; 82k and 78k are the big liquidation traps. The 87k above is a thin pocket for shorts; only 90–95k has enough “real” short meat.
This week, the real gravity isn’t on the liquidation chart—it’s on Friday.
BTC options expiry is about $15.7 billion, which is the biggest single ticket this year: Calls about $9.2 billion, Puts about $6.5 billion. Most max pain figures are still around 72,000–76,000, far below the current price.
If you hold 83k, the fatter meat is at 90.0–96.0k.
If it breaks below 83k: the liquidation chart is when it starts talking—first 82k (on the order of ~2.7 billion), then 78k (the biggest long-bull zone—the big pile on HL).
One last logic point: I still don’t believe the market is turning bullish. In the medium-term, after the election, Trump wants the U.S. stock market pushed up. With that amount of money, where do you think they’ll pull liquidity from to make markets in the U.S. stocks?
$BTC $ETH
The near end isn’t extreme—the far end is where the money is made.
Looking at the liquidation chart, you can feel the panic in the chrysanthemums—so when are they going to smash it?
Break below 82K: major CEX bull liquidations are about 2.73 billion.
Climb above 90.7K: short liquidations are about 1.12 billion.
At 85.5k, one poke—that’s only a small wipeout; 82k and 78k are the big liquidation traps. The 87k above is a thin pocket for shorts; only 90–95k has enough “real” short meat.
This week, the real gravity isn’t on the liquidation chart—it’s on Friday.
BTC options expiry is about $15.7 billion, which is the biggest single ticket this year: Calls about $9.2 billion, Puts about $6.5 billion. Most max pain figures are still around 72,000–76,000, far below the current price.
If you hold 83k, the fatter meat is at 90.0–96.0k.
If it breaks below 83k: the liquidation chart is when it starts talking—first 82k (on the order of ~2.7 billion), then 78k (the biggest long-bull zone—the big pile on HL).
One last logic point: I still don’t believe the market is turning bullish. In the medium-term, after the election, Trump wants the U.S. stock market pushed up. With that amount of money, where do you think they’ll pull liquidity from to make markets in the U.S. stocks?
$BTC $ETH