【 $BTC four-year cycle total cut series 72】
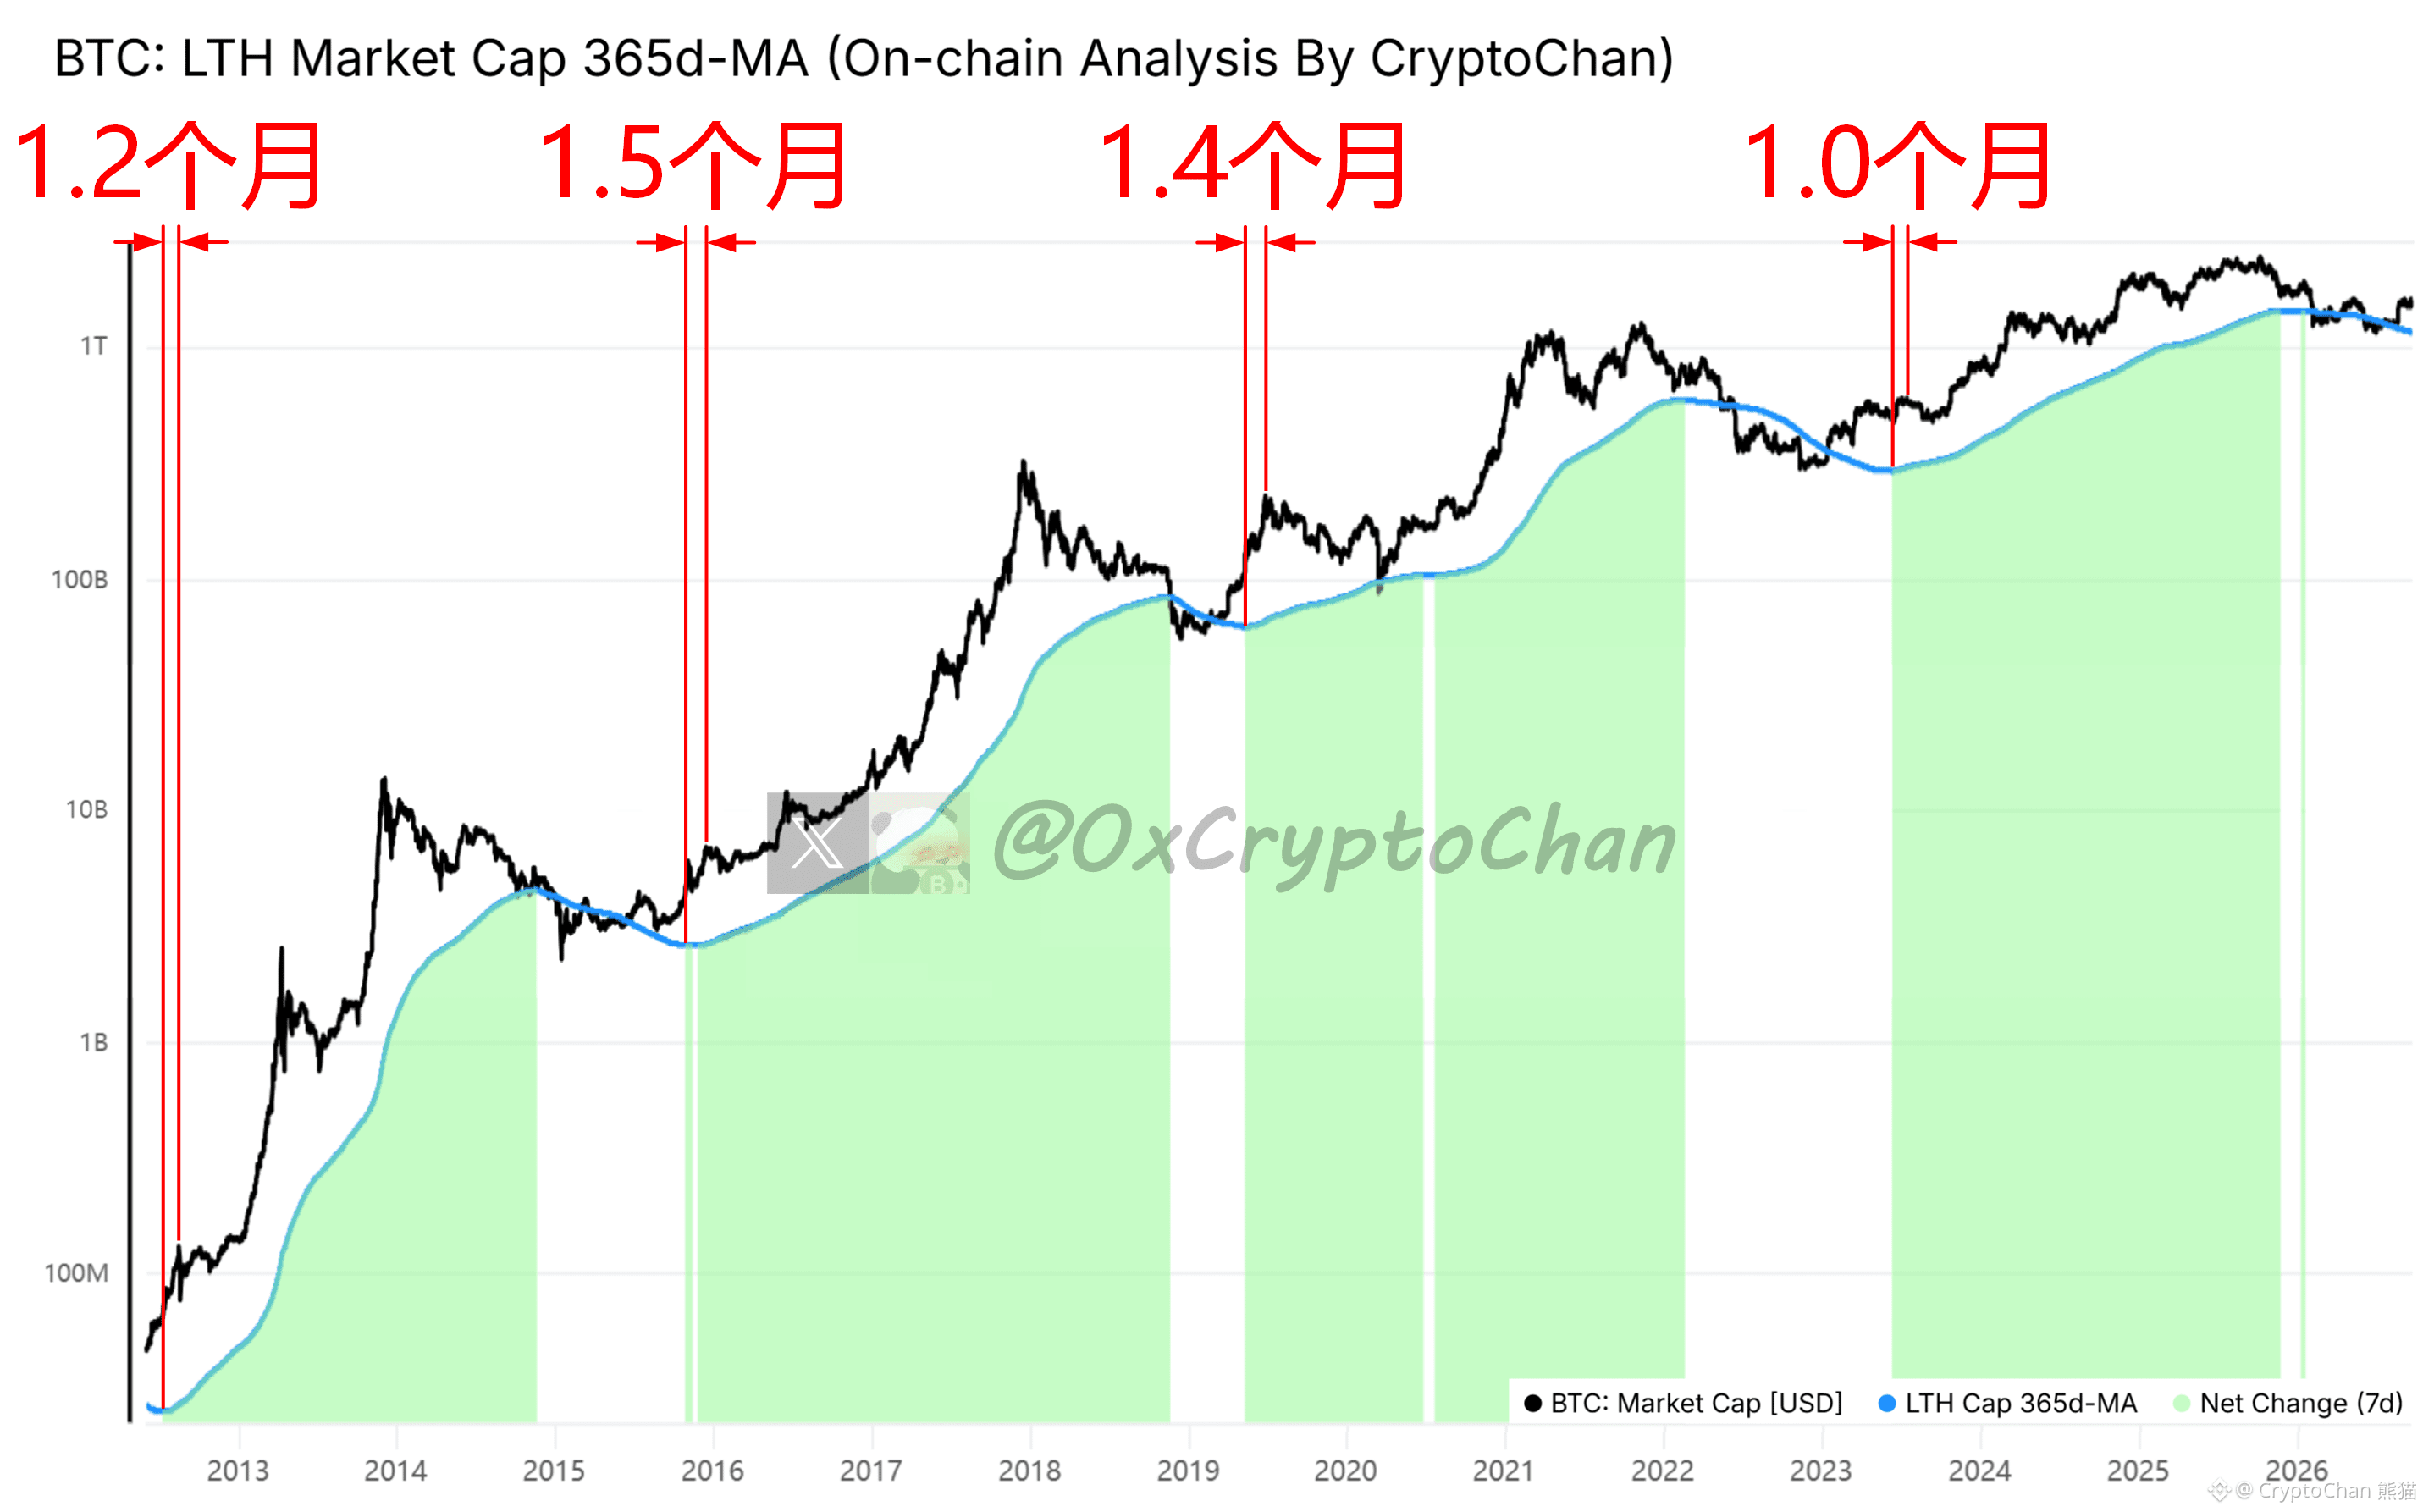
In July 2012, the blue line turns: after 1.2 months, it reaches the bull market recovery top
In November 2015, the blue line turns: after 1.5 months, it reaches the bull market recovery top
In May 2019, the blue line turns: after 1.4 months, it reaches the bull market recovery top
In June 2023, the blue line turns: after 1.0 month, it reaches the bull market recovery top
┌── Indicator Details ──┐
Black line: Bitcoin circulating market cap
Blue line: On-chain long-term holders' total coin holdings market cap 365-day MA
In July 2012, the blue line turns: after 1.2 months, it reaches the bull market recovery top
In November 2015, the blue line turns: after 1.5 months, it reaches the bull market recovery top
In May 2019, the blue line turns: after 1.4 months, it reaches the bull market recovery top
In June 2023, the blue line turns: after 1.0 month, it reaches the bull market recovery top
┌── Indicator Details ──┐
Black line: Bitcoin circulating market cap
Blue line: On-chain long-term holders' total coin holdings market cap 365-day MA