


As volume surges upward, can we confirm that the uptrend will continue?
In the previous lesson, we practiced reading charts in order.
Kong Shu’s Mini Classroom · Lesson 1: Learn Wyckoff—Step 1 is not about finding a buy point
In this lesson, Kong Shu (Short Uncle) wants to stop one common judgment first: “With such a large trading volume, the main players must be moving the stock up.”
The volume columns really have risen. But “lots of trading,” “the price advance is progressing,” and “the uptrend will continue” are three things that need to be verified separately.
(Wyckoff trading method) Chapter 1, Section 2 lays out three principles: supply and demand relationships, cause-and-effect relationships, and effort and results. The original book discusses controlling funds using “CM.” This series keeps that term, but the candlestick chart itself cannot prove the identity of an institution.
For this lesson, turn the three principles into three check questions: where will the price push? What preparations existed beforehand? After trading gets active, how much price outcome remains? These are the practice questions for this series, and you can use them in the viewing order from the previous lesson.

First, look at the evidence: what did this upside push leave behind?
Look at the following real BTC market action. We freeze the chart at 20:00 on August 27, 2026 (UTC+8), and only consider the 4-hour candles that had already closed before then. This is a post-hoc teaching example, not a real-time forecast.
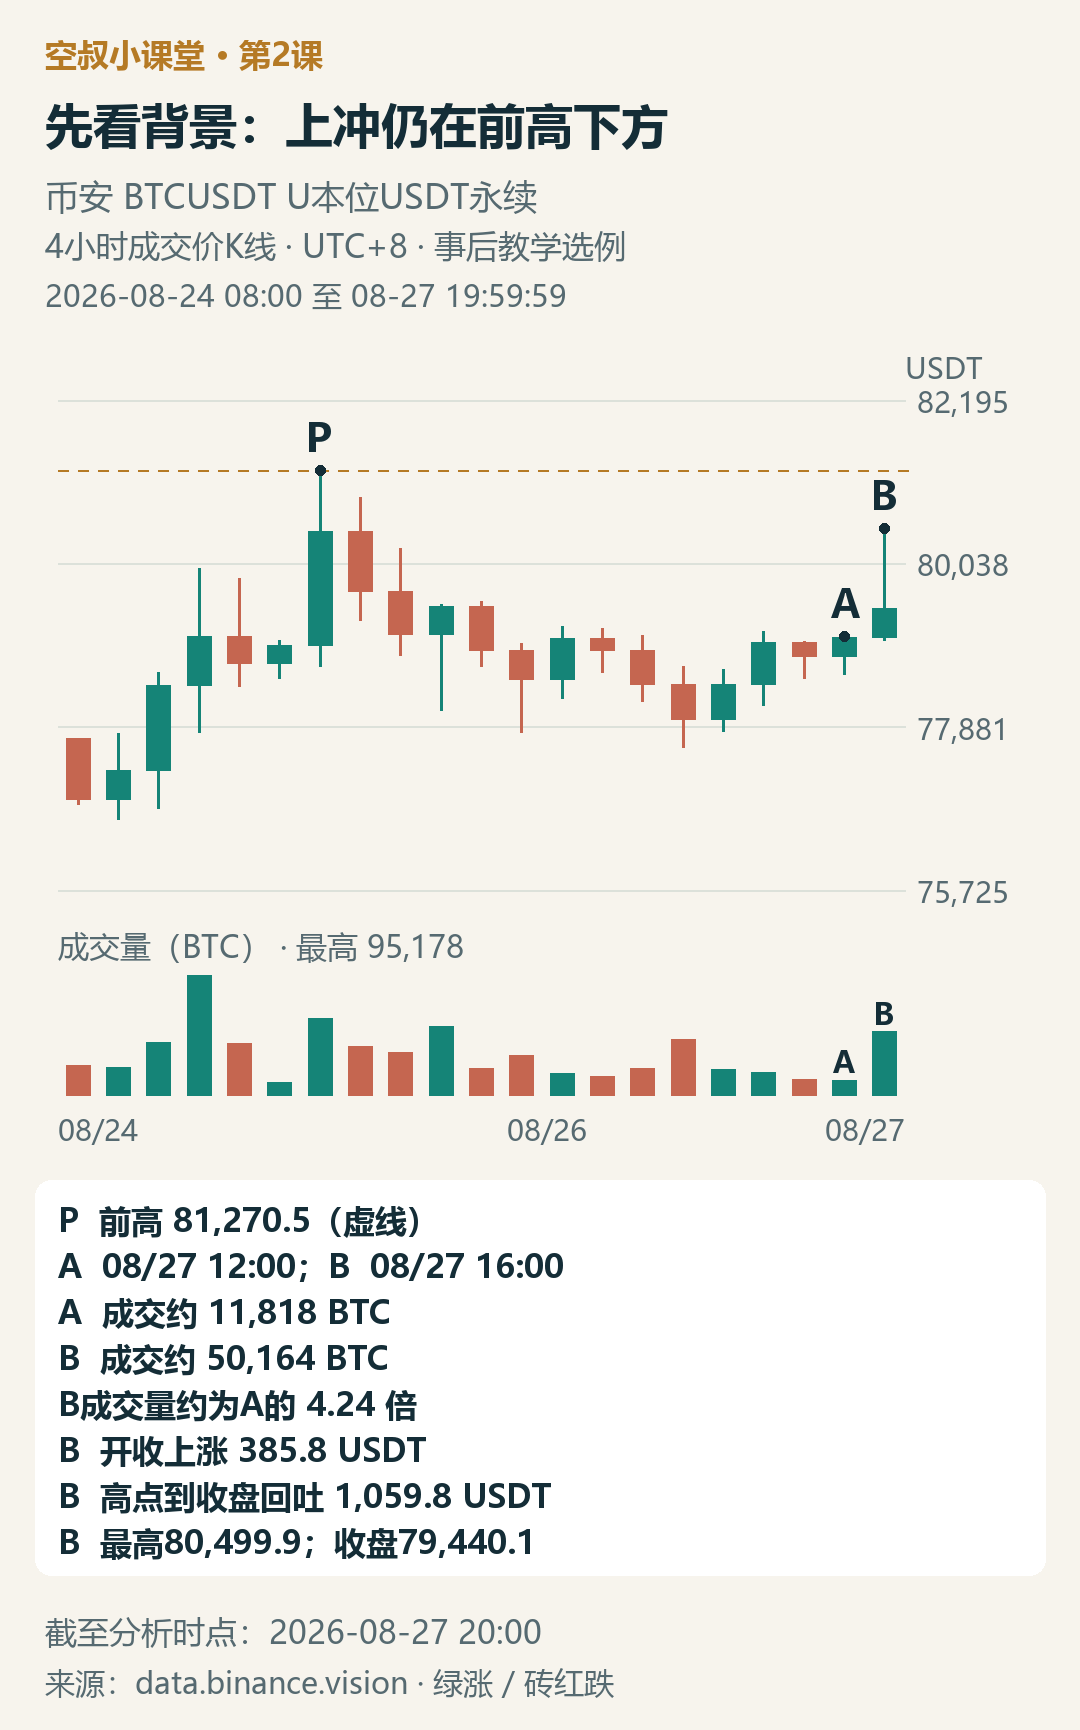
The highest price at point P is 81,270.5. B is the 4-hour candle series that started at 16:00 on August 27: it surged to 80,499.9 and closed at 79,440.1, still below P.
B成交量 is about 50,164 BTC, A about 11,818 BTC—so B’s volume is about 4.24 times A’s. It rose 385.8 USDT from the open to the close, but gave back 1,059.8 USDT from the high of this candle to the close. This shows trading was very active and the upside push did indeed happen; it’s just that not all the gains were kept.
First: supply and demand—where will the price push?
The original book emphasizes that the driving force of price action comes from imbalances in supply and demand, and you must continuously observe whether changes in supply and demand still support the original judgment.
When you zoom in on B, first find two key points: the high point and the closing point. The price pushed upward, but the close clearly left far below the high. Combine the two pieces of evidence, and you can write: This breakout achieved some progress, but before the close it clearly gave back gains; the upside push was constrained by supply. The second half is a price/volume interpretation, not an identification of who is selling.
Here, the strength or weakness of supply and demand isn’t about which side—buyers or sellers—has more. Every trade has both sides, and total volume is not the same as net capital inflow.
Second: causal relationship—what preparations were there beforehand?
In the original book, the preparation process before the main trend reversal is treated as the “cause,” and the subsequent trend is treated as the “effect,” with the risk explained by the idea that the re-accumulation (absorption) was not finished. “Re-accumulation,” in simple terms, is the process discussed in the original book in which the dominant funds gradually absorb supply.
How do you observe the preparation process? This series first gives beginners an entry point: compare whether price pushing and volume behavior change during repeated upswings and pullbacks. For example, when the price drops again in the same zone, does it fall easily to lower levels, or is volume substantial yet it still can’t keep probing lower? After a rebound, can the portion that rose be preserved? These changes are more worth recording than simply “going sideways for a few days”; the specific re-accumulation phase is left for later lessons.
Back to Figure 2: after P there is a pullback, and then B pushes upward again. This shows the market is fighting back and forth; the chart is not enough to confirm the complete preparation process. At this point you can note: you’ve seen an upside push after a pullback, but you haven’t confirmed that the re-accumulation is finished. The original book’s causal relationship reminder tells us to look for the earlier process, rather than infer that “preparation is done” from just one bounce.
Third: effort and results—how much outcome remains after the trade?
The original book uses trading volume to observe “effort,” and price progress to observe “results,” and provides an example of volume near support but a very narrow price range, explaining how the fall may be prevented.
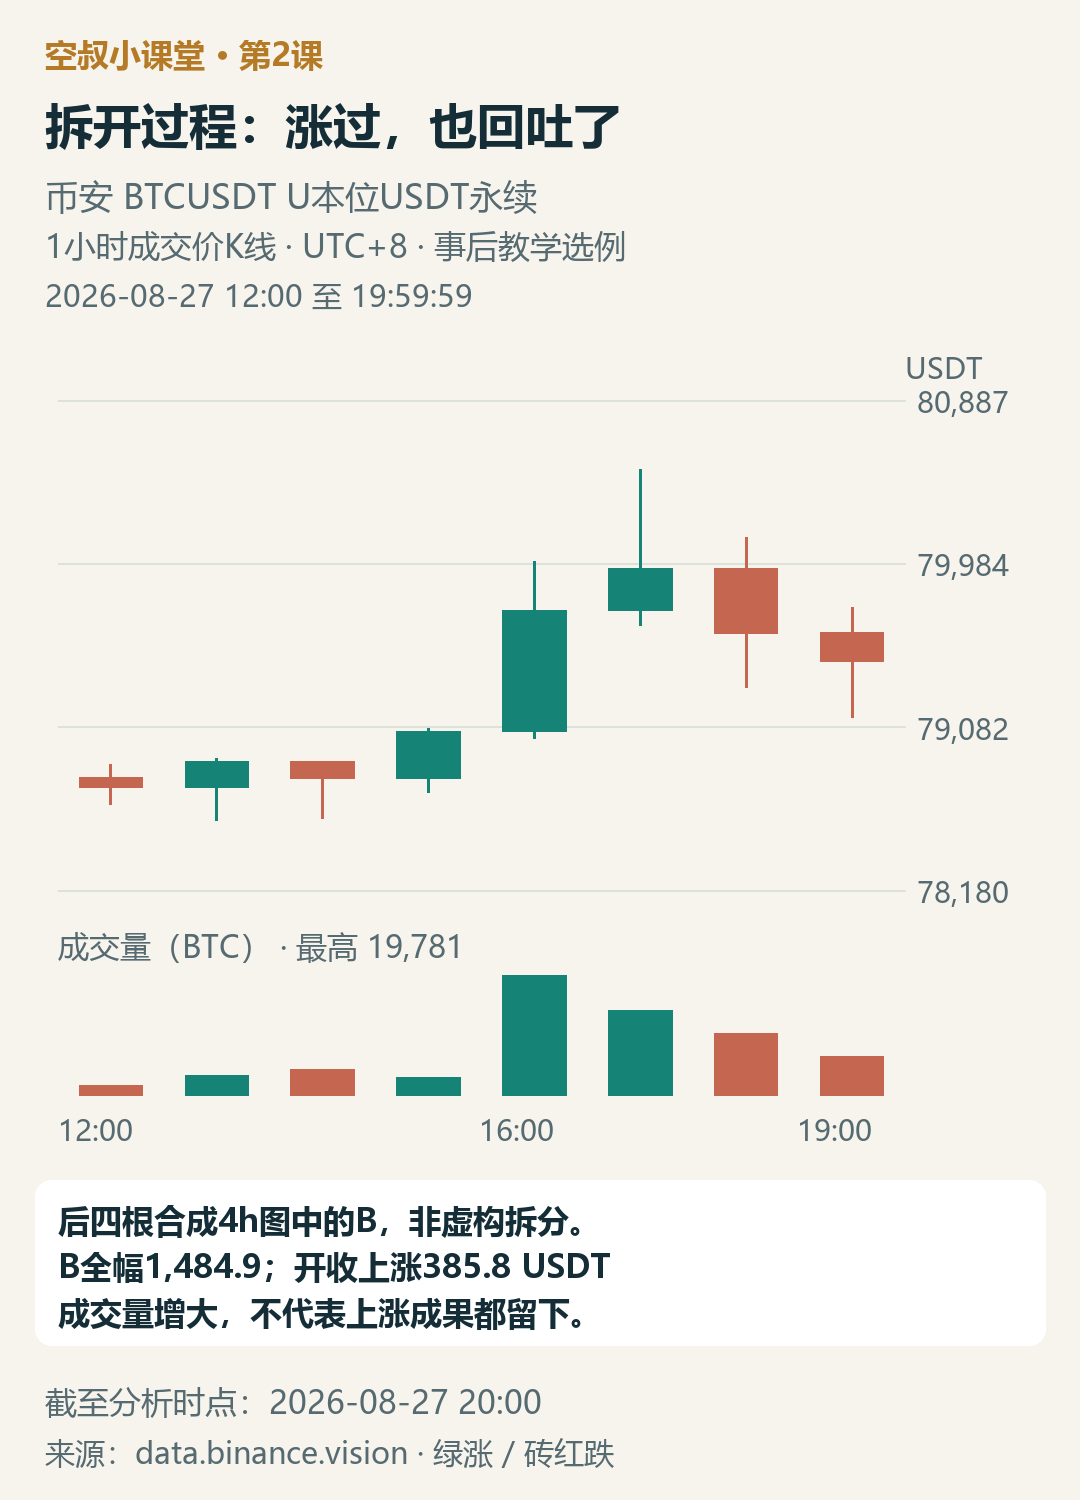
In the chart, the 16:00 and 17:00 candles first pushed upward, while the 18:00 and 19:00 candles then pulled back. So we know that the small portion of gains B left behind does not mean the price stayed unmoving throughout those four hours.
When checking the price outcome, put the three numbers together: B closed up from the open by 385.8, across the full range by 1,484.9, and gave back 1,059.8 from the high to the close. The B price range is not narrow; the real issue is that the upside gains were clearly given back. Therefore it doesn’t directly correspond to the original book’s example of “a small bullish candle with volume at support.” The 4.24x is only the volume ratio between two adjacent candles, not a buy/sell threshold.
This can be recorded as: trading was active; after the push, only part of the upward gains remained; then observe whether it can recover and continue making progress upward. This is checking the clues, and it’s still not enough to confirm a trend reversal.
Next, when you look at the chart, write three lines first: direction of the move, the preparation process, and price/volume outcomes. For each line, first write the factual observations you see, then write your temporary interpretation; when new evidence comes, check which line needs to be revised.
Leave a practice question: how should you phrase it so you don’t overstep the evidence?
Someone says: “B’s成交量 is about 4.24 times A’s, which shows CM’s re-accumulation is complete, and it will definitely go up next.” Which two items are they skipping to validate?
Welcome to write down your reasoning in the comments; I’ll add the reference analysis later in this post’s comment section.