$BTC Major Trend Analysis
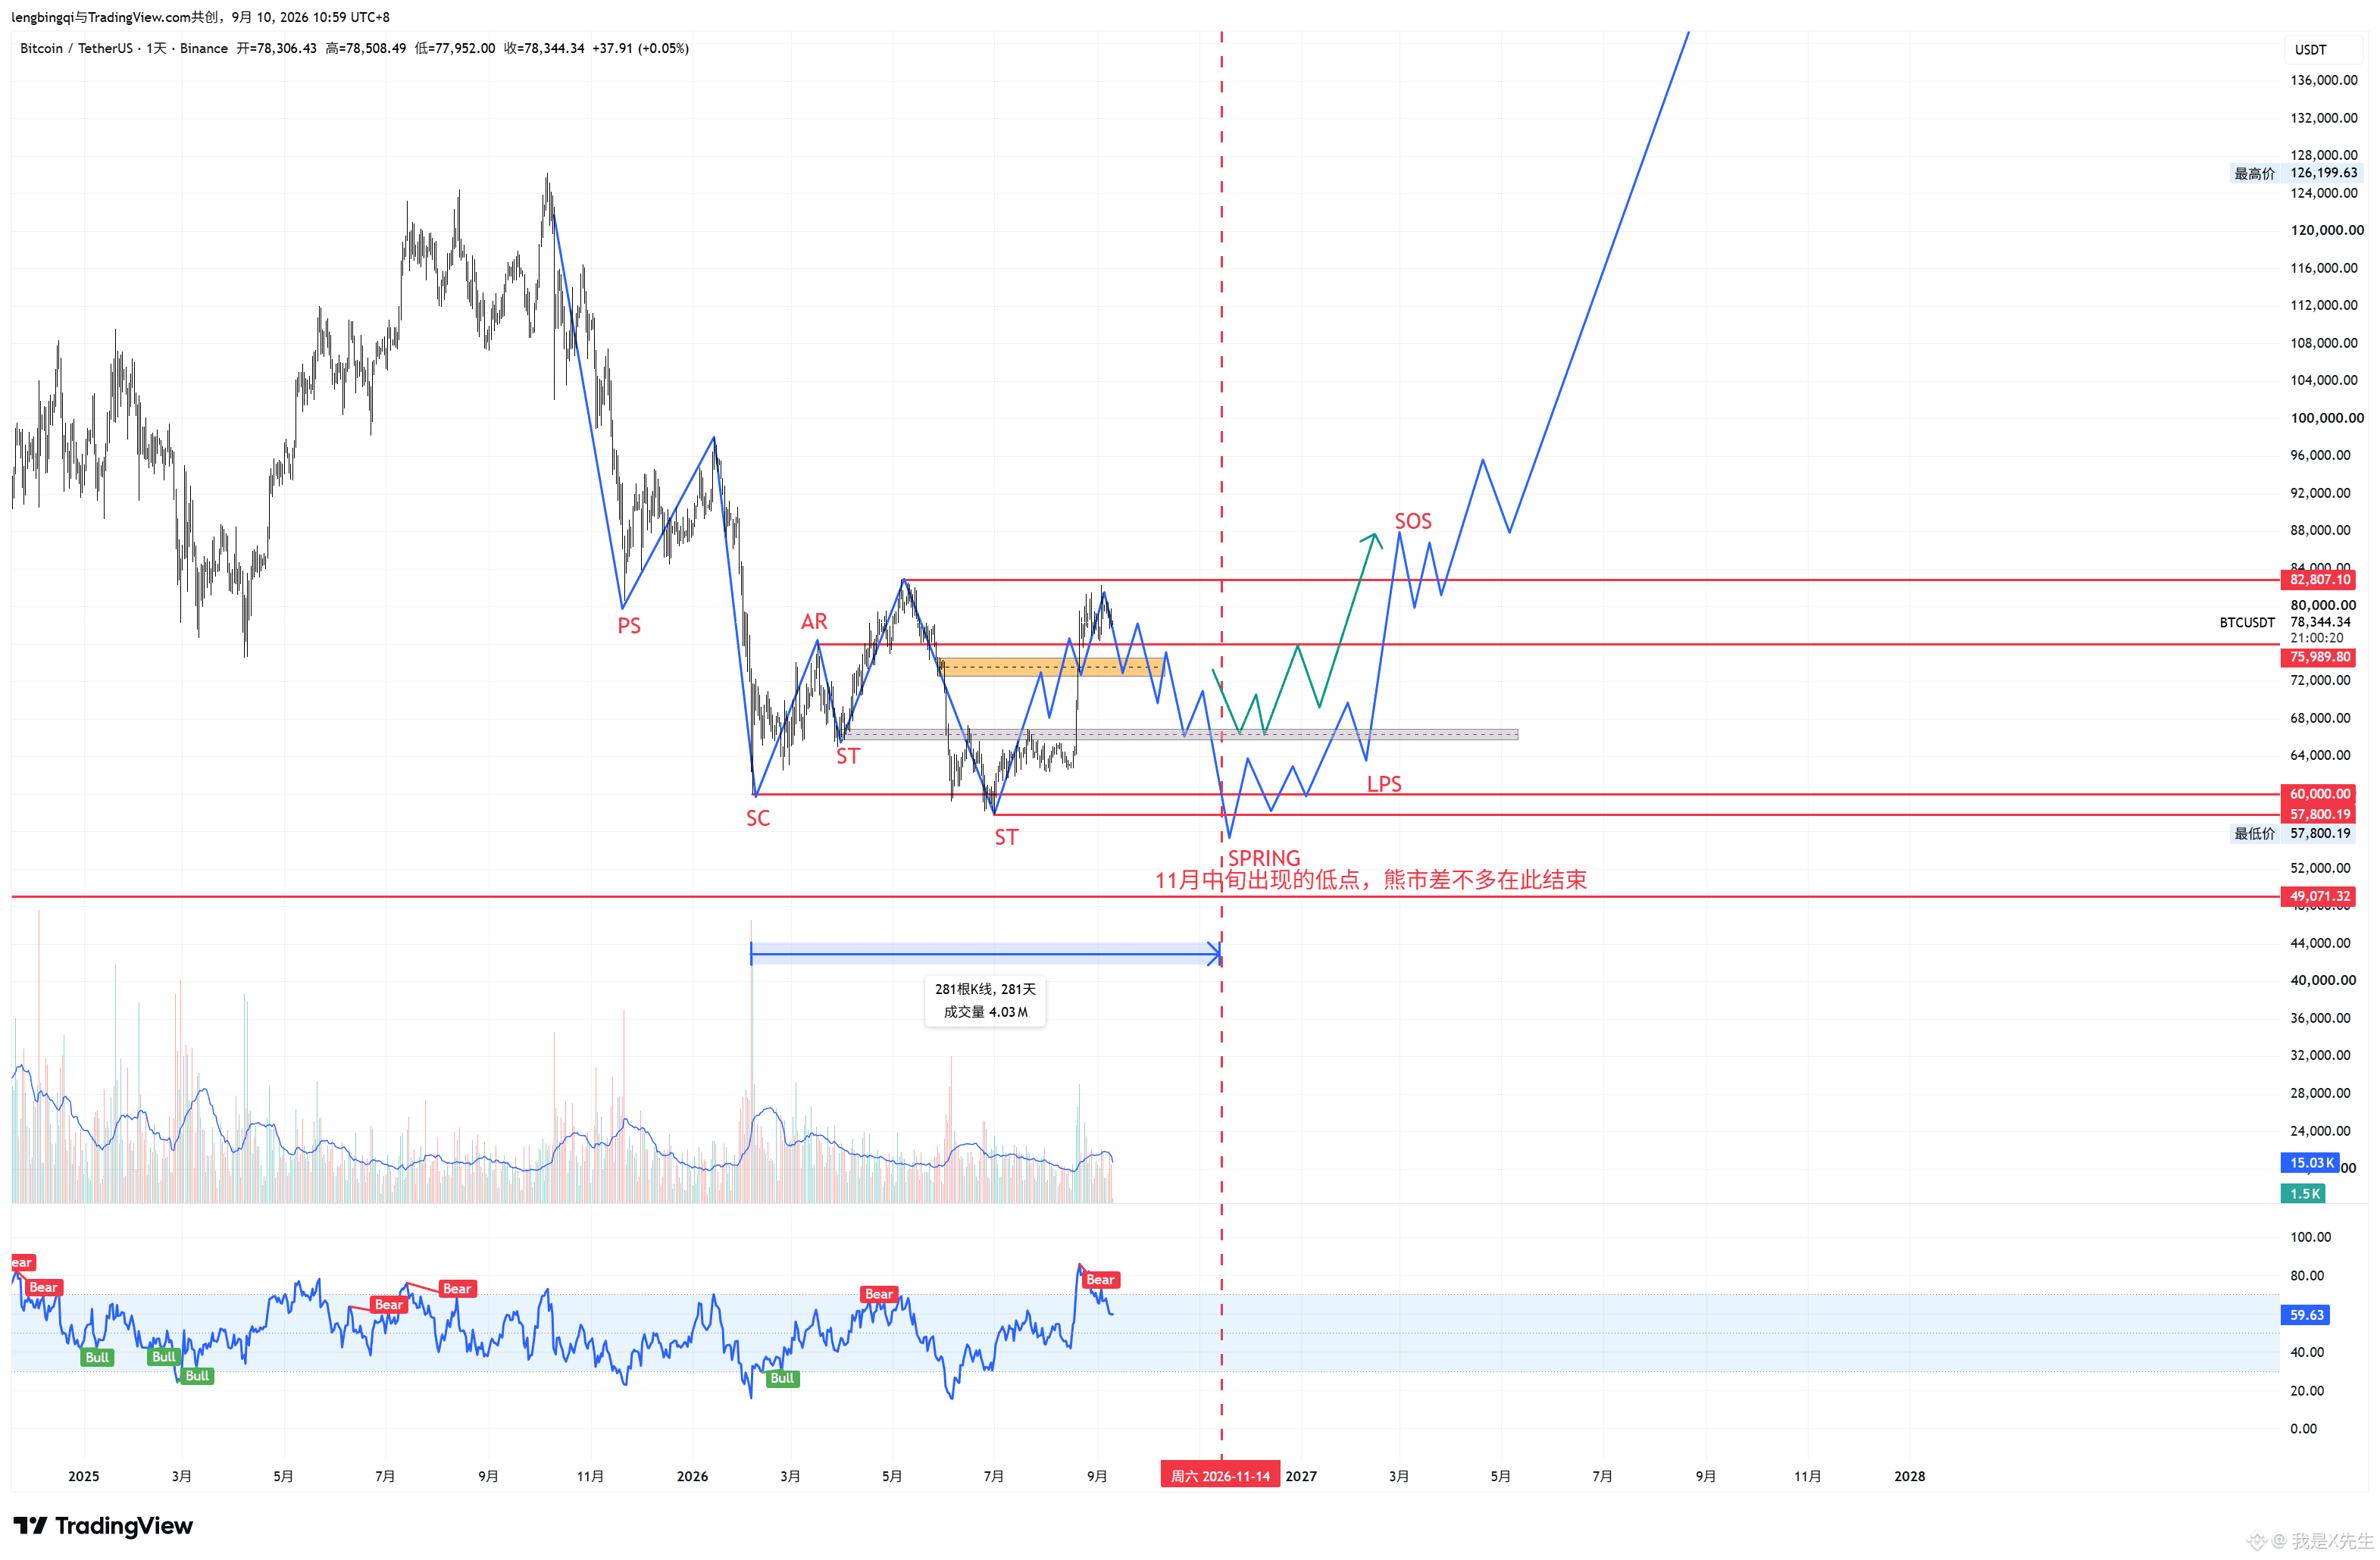
Figure 1 Daily chart: It’s still the same major trend outlook as before. This wave of上涨 has basically topped out. The main theme over the next month is decline—i.e., the “last drop” in the bear-to-bull transition. Q4 is the final buying opportunity of the coming four years. Whether it follows the green line or the blue line depends on how the timing aligns with space; once the time is right, wherever it reaches is where the move counts.
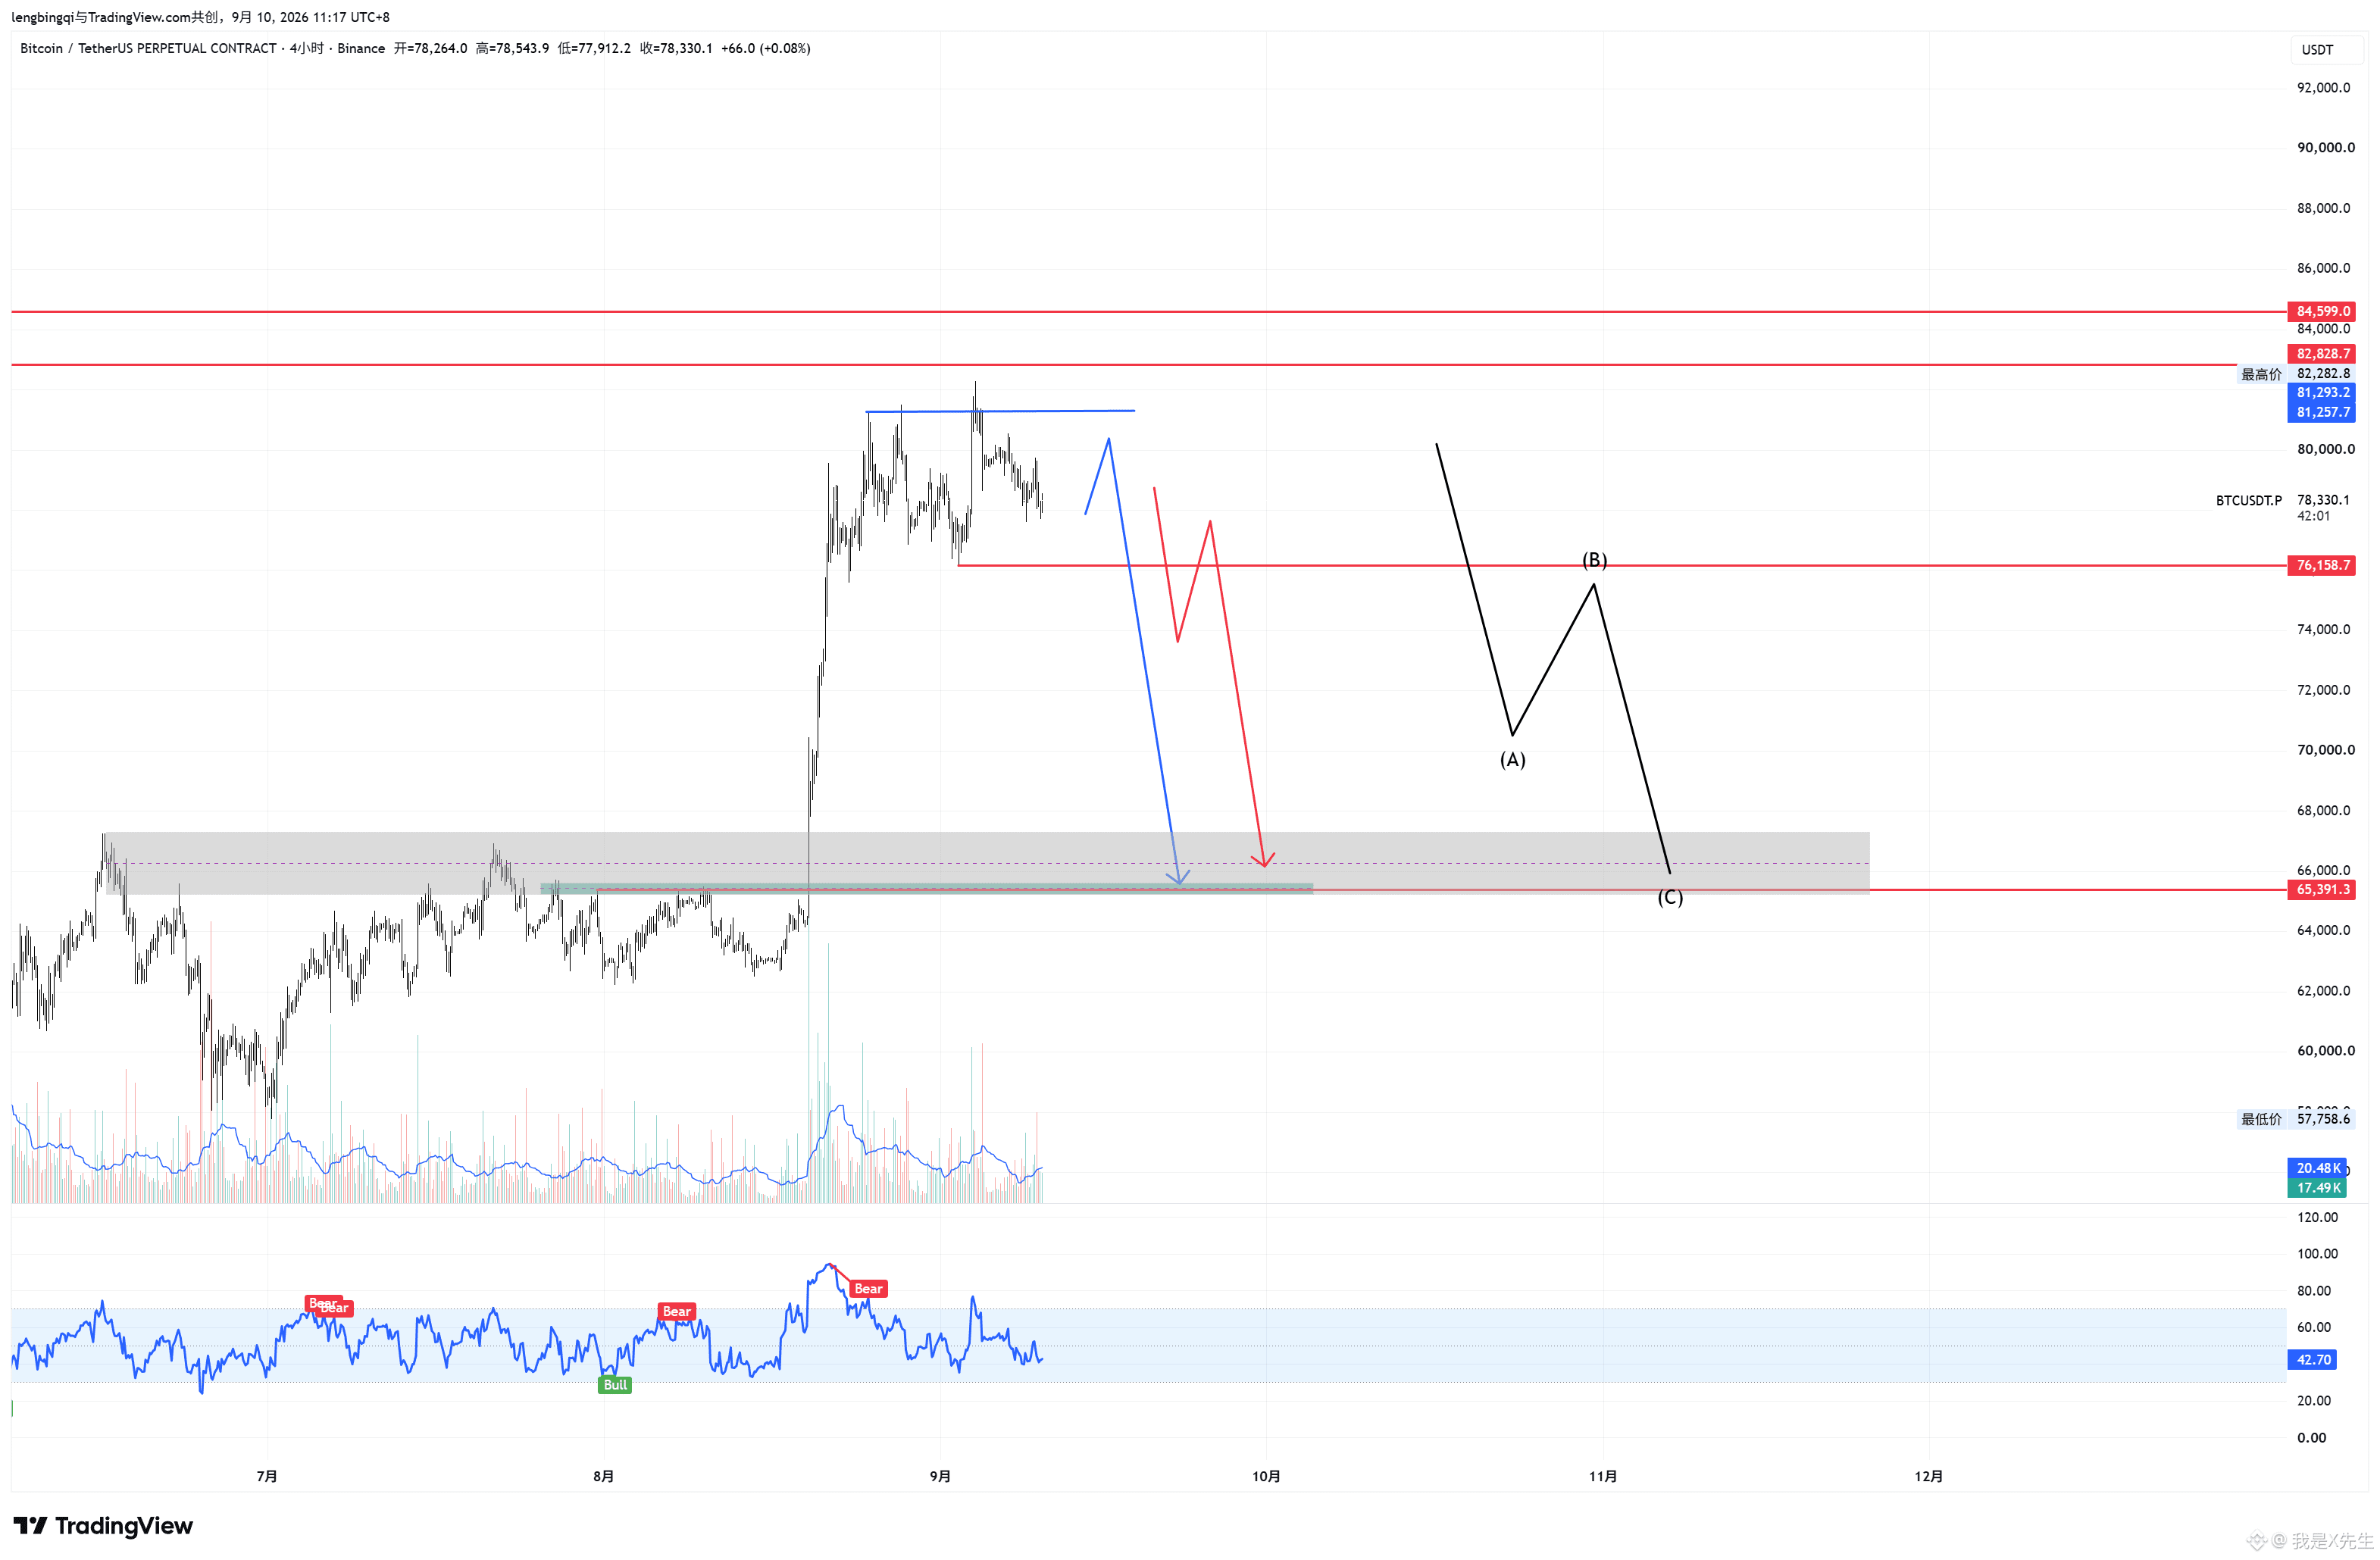
Figure 2 H4: Ahead at 812, liquidity was tapped twice, followed by a rapid drop back into the trading range. This kind of behavior basically confirms a top being formed. Below, 761 is the bulls’ lifeline. If the body breaks below it, that’s an MSB; then it’s a rebound-and-sell (red line). The aggressive short on the left side is to follow the blue line, waiting for the rebound to complete before taking the short. It may unfold as a three-leg decline; at minimum, price can be expected to reach the gray resistance zone below.
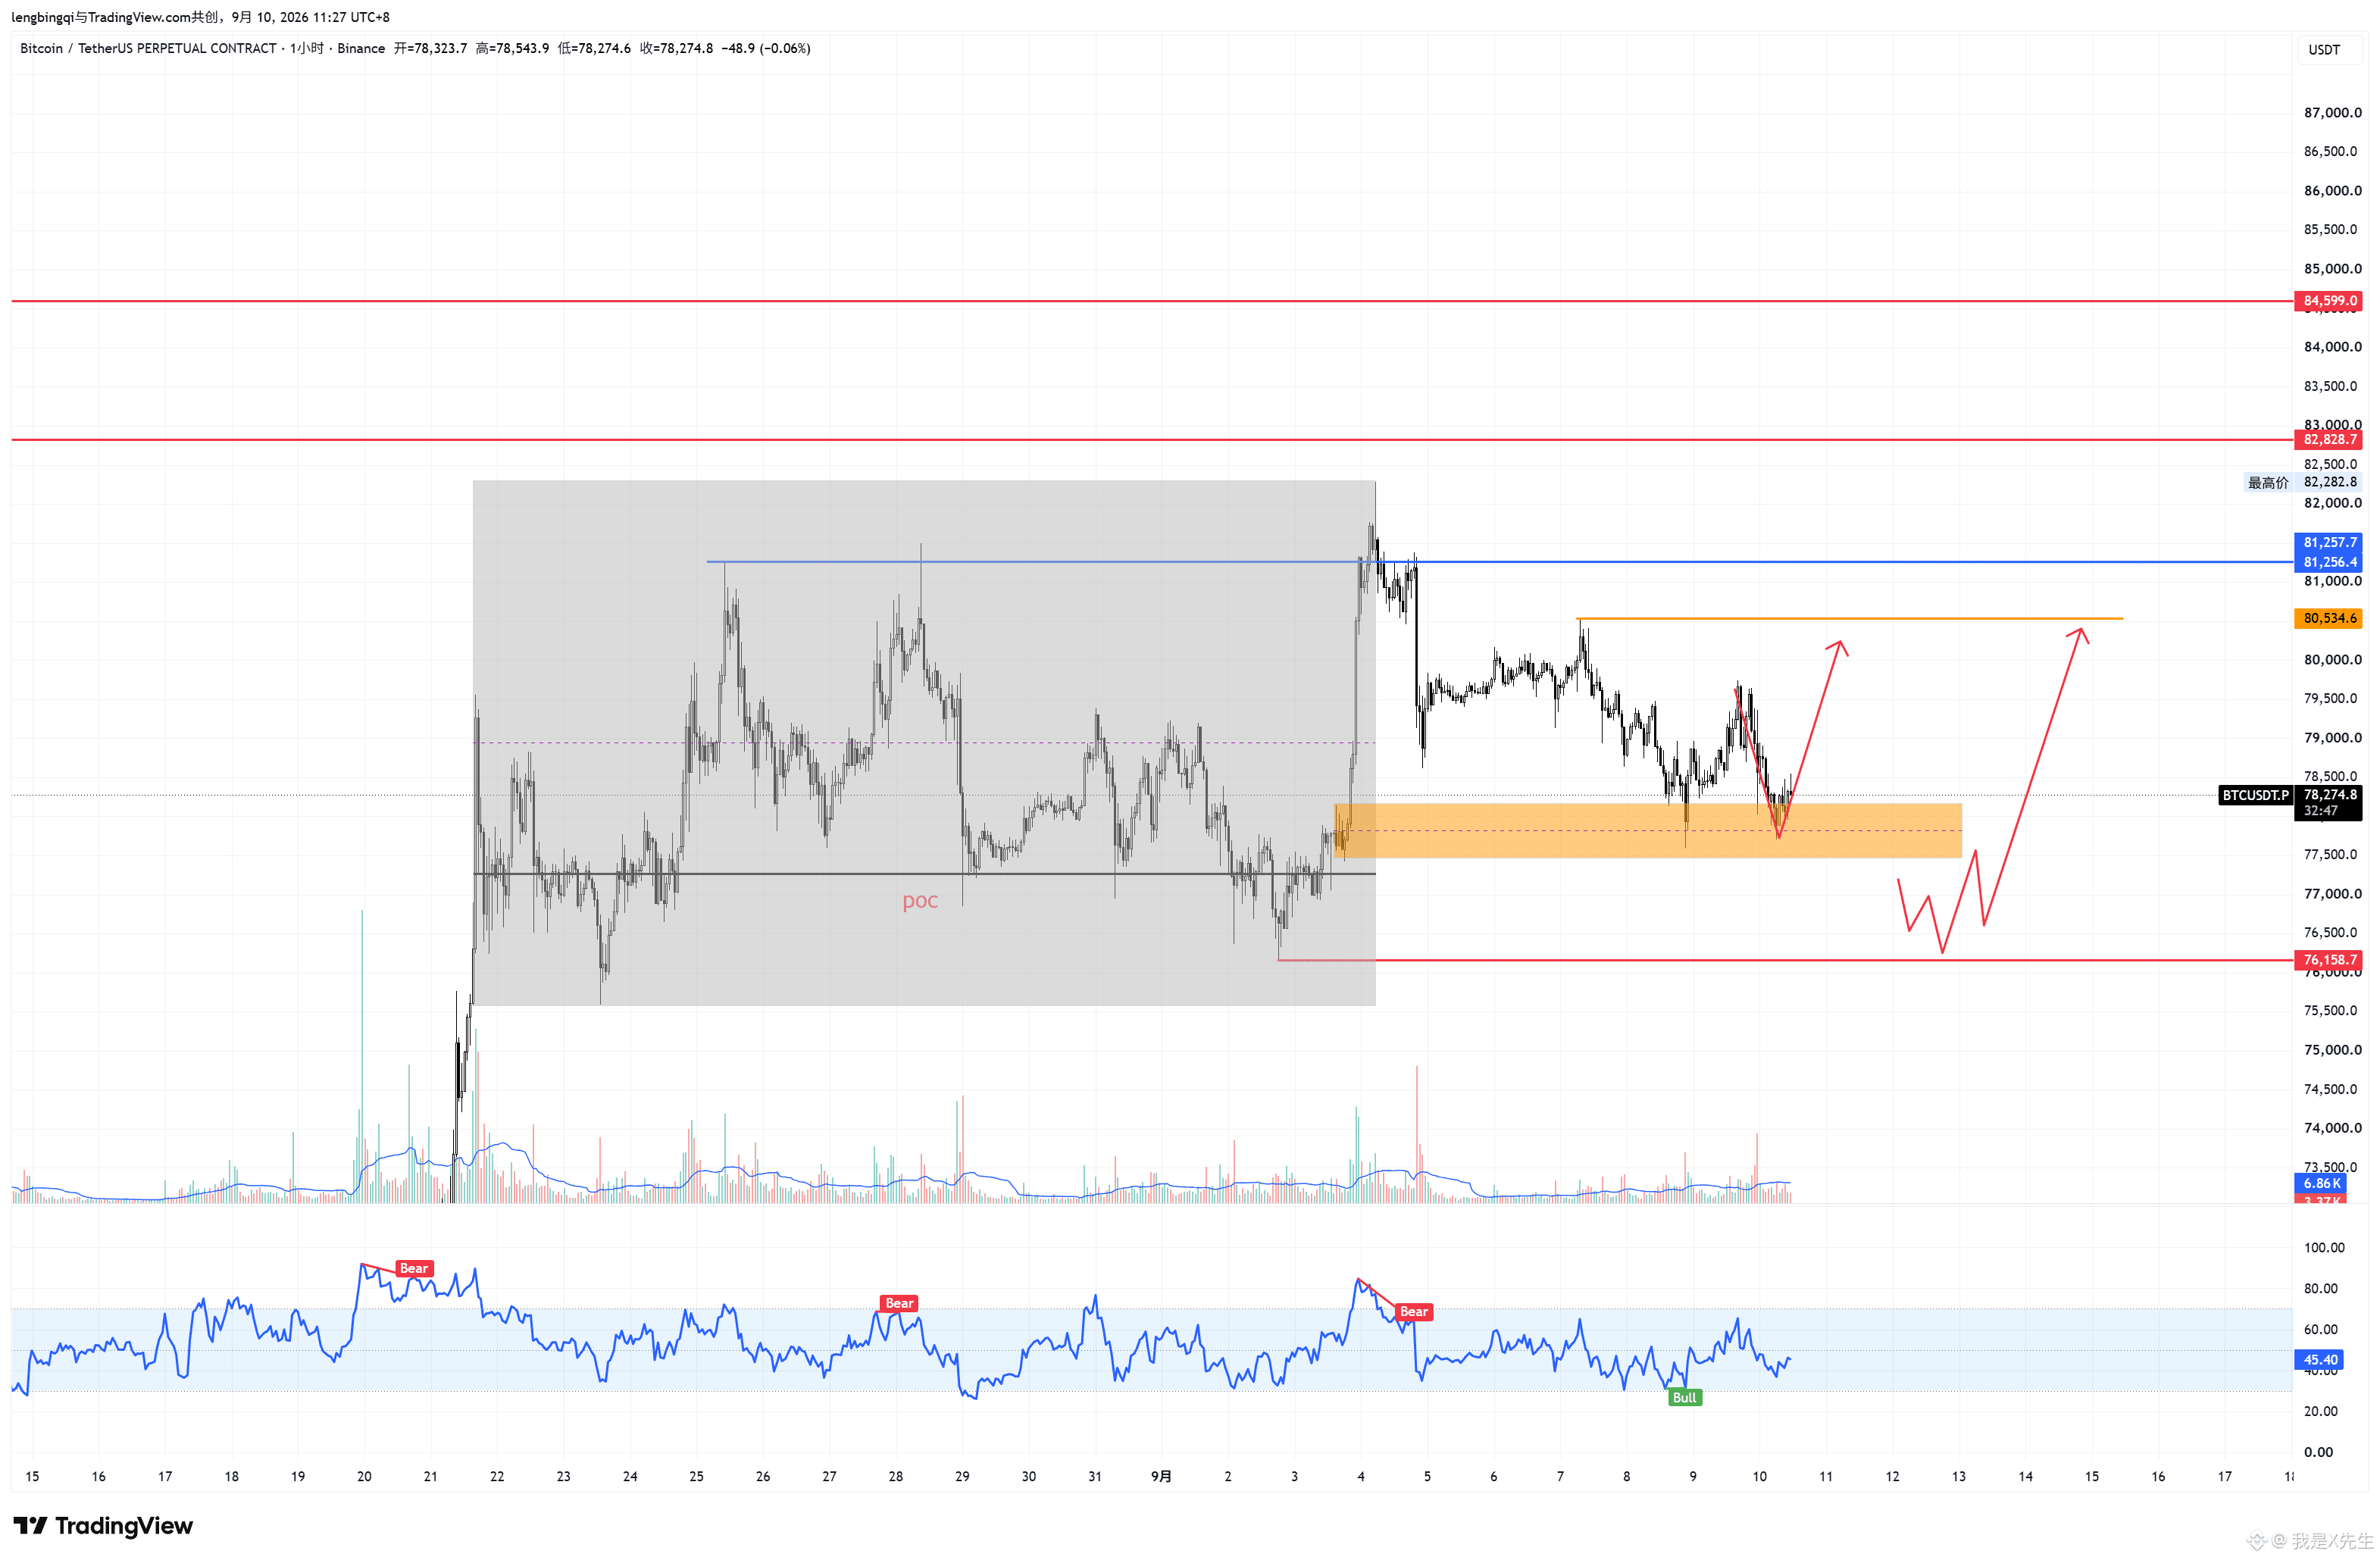
Figure 3 H1: At present, there is support above the upcoming POC area, but the rebound trading volume hasn’t kept up (spot market), indicating weakness. It’s not suitable to go long here. If it drops a bit more to H4ob, and a smaller timeframe MSB appears, you can take a short-term long to bet on the rebound. The upside target is around 805—this is only a bet on a rebound. The bigger picture remains a high-odds short!
M15 timeframe is currently quite messy; for now focus on H1.
Off-topic: How to put it… Yesterday I made one trade and won, but lost several trades. Overall I’m still profitable, but the profit drawdown is pretty painful. Right now I only have one short position: <t-2/>$SNDK . I’ll hold it; going forward, I need to be more cautious with any new trades.
Figure 1 Daily chart: It’s still the same major trend outlook as before. This wave of上涨 has basically topped out. The main theme over the next month is decline—i.e., the “last drop” in the bear-to-bull transition. Q4 is the final buying opportunity of the coming four years. Whether it follows the green line or the blue line depends on how the timing aligns with space; once the time is right, wherever it reaches is where the move counts.
Figure 2 H4: Ahead at 812, liquidity was tapped twice, followed by a rapid drop back into the trading range. This kind of behavior basically confirms a top being formed. Below, 761 is the bulls’ lifeline. If the body breaks below it, that’s an MSB; then it’s a rebound-and-sell (red line). The aggressive short on the left side is to follow the blue line, waiting for the rebound to complete before taking the short. It may unfold as a three-leg decline; at minimum, price can be expected to reach the gray resistance zone below.
Figure 3 H1: At present, there is support above the upcoming POC area, but the rebound trading volume hasn’t kept up (spot market), indicating weakness. It’s not suitable to go long here. If it drops a bit more to H4ob, and a smaller timeframe MSB appears, you can take a short-term long to bet on the rebound. The upside target is around 805—this is only a bet on a rebound. The bigger picture remains a high-odds short!
M15 timeframe is currently quite messy; for now focus on H1.
Off-topic: How to put it… Yesterday I made one trade and won, but lost several trades. Overall I’m still profitable, but the profit drawdown is pretty painful. Right now I only have one short position: <t-2/>$SNDK . I’ll hold it; going forward, I need to be more cautious with any new trades.