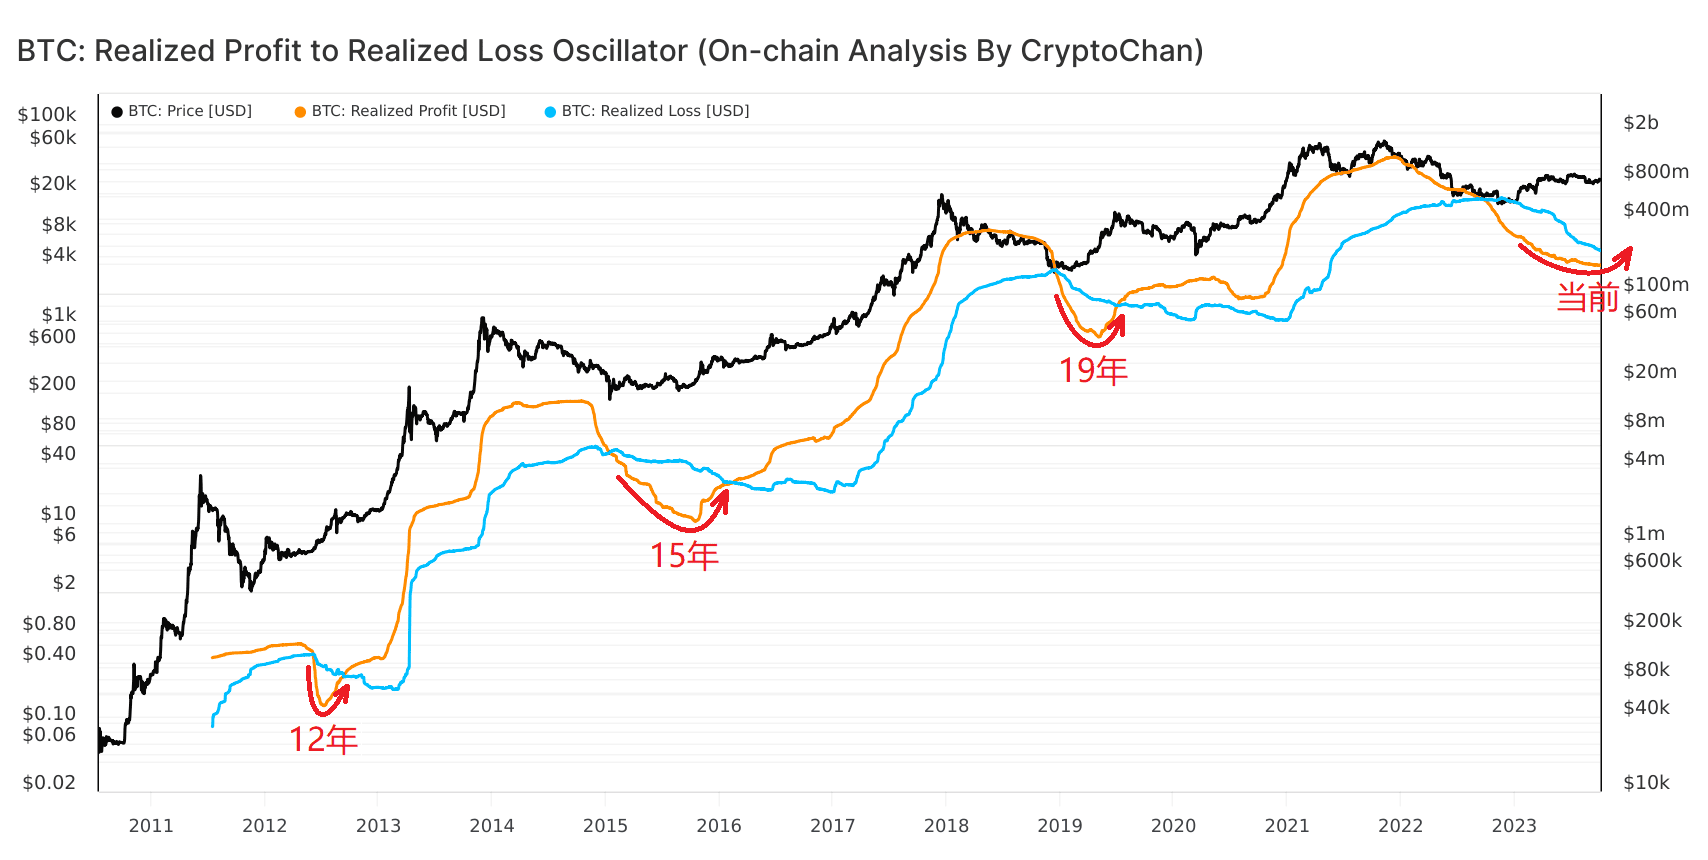
The orange line hasn't raised its head yet, the big one is at the back.
The black line indicator in the figure is the price of #BTC ; the orange line indicator is the 365-day moving average of BTC's realized profit (Realized Profit); the blue line indicator is the 365-day moving average of BTC's realized loss (Realized Loss).
Note: Realized profit (loss) refers to the total profit (loss) in US dollars of BTC that moved in a profit (loss) state among the BTC that moved on the chain within a period of time.
The black line indicator in the figure is the price of #BTC ; the orange line indicator is the 365-day moving average of BTC's realized profit (Realized Profit); the blue line indicator is the 365-day moving average of BTC's realized loss (Realized Loss).
Note: Realized profit (loss) refers to the total profit (loss) in US dollars of BTC that moved in a profit (loss) state among the BTC that moved on the chain within a period of time.