
#weeklychart
weeklychart
27,909 views
141 Discussing
Hot
Latest

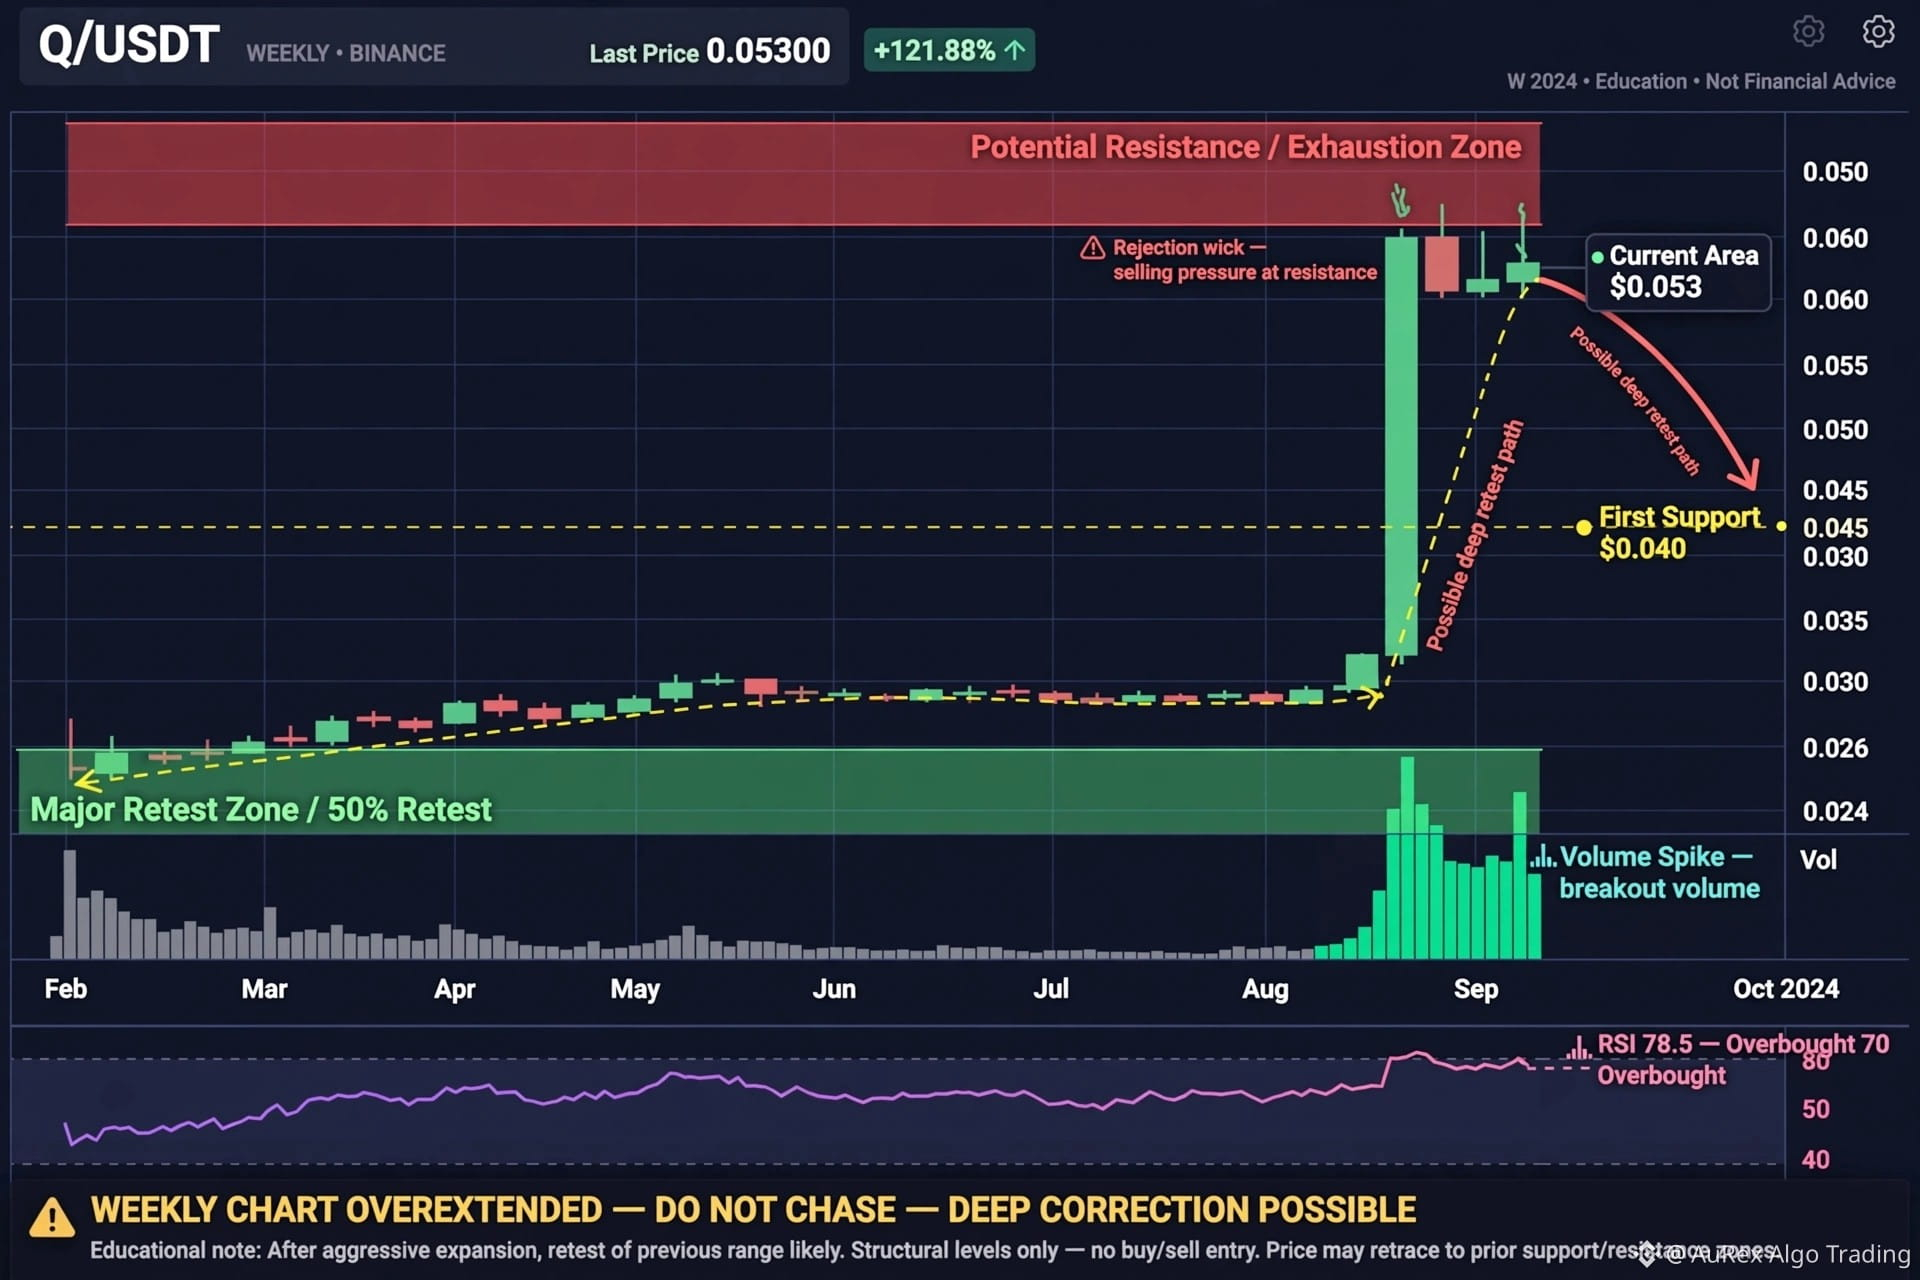
$Q WEEKLY CHART LOOKS OVEREXTENDED ... DEEP RETEST POSSIBLE*
$Q USDt has made a huge vertical move and is now trading around $0.053, well above its previous range.
After such an aggressive expansion, it’s better to wait for a major correction than to chase the pump.
Current Area: $0.053
Key Resistance: $0.055-0.060 (Exhaustion Zone)
First Support: $0.040
Major Retest Zone: $0.024-0.026
The arrow on the chart makes it clear—a deep retest from $0.053 to $0.040 and then to $0.024-0.026 is possible.
#Q #QUSDT #WeeklyChart #CryptoCorrection
$Q WEEKLY CHART LOOKS OVEREXTENDED ... DEEP RETEST POSSIBLE*
$Q USDt has made a huge vertical move and is now trading around $0.053, well above its previous range.
After such an aggressive expansion, it’s better to wait for a major correction than to chase the pump.
Current Area: $0.053
Key Resistance: $0.055-0.060 (Exhaustion Zone)
First Support: $0.040
Major Retest Zone: $0.024-0.026
The arrow on the chart makes it clear—a deep retest from $0.053 to $0.040 and then to $0.024-0.026 is possible.
#Q #QUSDT #WeeklyChart #CryptoCorrection
$Q USDt has made a huge vertical move and is now trading around $0.053, well above its previous range.
After such an aggressive expansion, it’s better to wait for a major correction than to chase the pump.
Current Area: $0.053
Key Resistance: $0.055-0.060 (Exhaustion Zone)
First Support: $0.040
Major Retest Zone: $0.024-0.026
The arrow on the chart makes it clear—a deep retest from $0.053 to $0.040 and then to $0.024-0.026 is possible.
#Q #QUSDT #WeeklyChart #CryptoCorrection
1
74

·
--
PIVX has been in a brutal downtrend for months now. From its peak of $0.4270, the price has collapsed all the way down to $0.0347 — that's a massive decline, and the weekly chart tells the whole story.
📊 Technical Snapshot:
MA(7): 0.0529
MA(25): 0.0842
MA(99): 0.1624
Current Price: 0.0347
24h High/Low: 0.0353 / 0.0318
RSI(6): 14.95 ⚠️ (Extremely Oversold)
Price is trading well below all major moving averages, which confirms the dominant bearish structure. However, RSI sitting at just 14.95 is a serious warning — this level is historically extreme and a short-term relief bounce could happen at any point.
⚡ Bounce Watch Zone: $0.0318 — $0.0347
🎯 Short-term Resistance: $0.0529 (MA7)
🛑 Invalidation / Stop Loss: Close below $0.0290
⚠️ Important: Oversold does NOT mean reversal. Trading longs in a strong downtrend carries high risk. Keep position sizes small or stay on the sidelines until a proper structure shift is confirmed on lower timeframes.$PIVX
{spot}(PIVXUSDT)
#PIVX #PIVXUSDT #Binance #CryptoSignals #AltcoinWatch #WeeklyChart
PIVX has been in a brutal downtrend for months now. From its peak of $0.4270, the price has collapsed all the way down to $0.0347 — that's a massive decline, and the weekly chart tells the whole story.
📊 Technical Snapshot:
MA(7): 0.0529
MA(25): 0.0842
MA(99): 0.1624
Current Price: 0.0347
24h High/Low: 0.0353 / 0.0318
RSI(6): 14.95 ⚠️ (Extremely Oversold)
Price is trading well below all major moving averages, which confirms the dominant bearish structure. However, RSI sitting at just 14.95 is a serious warning — this level is historically extreme and a short-term relief bounce could happen at any point.
⚡ Bounce Watch Zone: $0.0318 — $0.0347
🎯 Short-term Resistance: $0.0529 (MA7)
🛑 Invalidation / Stop Loss: Close below $0.0290
⚠️ Important: Oversold does NOT mean reversal. Trading longs in a strong downtrend carries high risk. Keep position sizes small or stay on the sidelines until a proper structure shift is confirmed on lower timeframes.$PIVX
#PIVX #PIVXUSDT #Binance #CryptoSignals #AltcoinWatch #WeeklyChart
📊 Technical Snapshot:
MA(7): 0.0529
MA(25): 0.0842
MA(99): 0.1624
Current Price: 0.0347
24h High/Low: 0.0353 / 0.0318
RSI(6): 14.95 ⚠️ (Extremely Oversold)
Price is trading well below all major moving averages, which confirms the dominant bearish structure. However, RSI sitting at just 14.95 is a serious warning — this level is historically extreme and a short-term relief bounce could happen at any point.
⚡ Bounce Watch Zone: $0.0318 — $0.0347
🎯 Short-term Resistance: $0.0529 (MA7)
🛑 Invalidation / Stop Loss: Close below $0.0290
⚠️ Important: Oversold does NOT mean reversal. Trading longs in a strong downtrend carries high risk. Keep position sizes small or stay on the sidelines until a proper structure shift is confirmed on lower timeframes.$PIVX
#PIVX #PIVXUSDT #Binance #CryptoSignals #AltcoinWatch #WeeklyChart
2
537

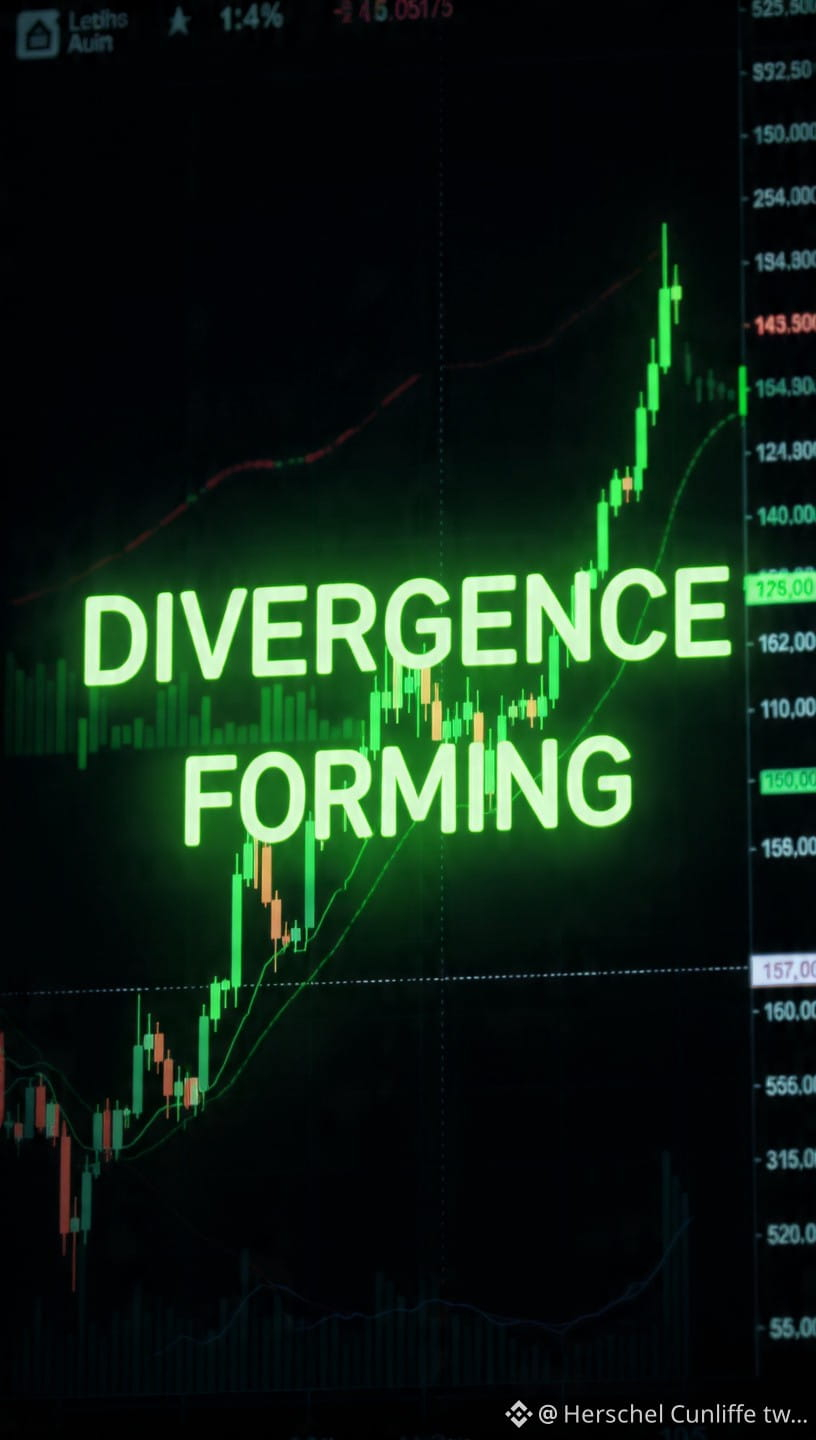
📊 $BTC — Weekly Bullish Divergence Forming. Not Confirmed Yet.
This is the signal every patient Bitcoin holder has been waiting to see.
But patience is still required. The weekly candle has not closed yet.
💡 What Is Happening Right Now
Bullish divergence is forming on the weekly timeframe — price making lower lows while momentum indicators show higher lows.
That disconnect between price and momentum is historically one of the strongest bottom signals in technical analysis.
🔍 The 2022 Parallel
Current structure is mirroring the 2022 bear market remarkably closely.
And anyone who remembers what happened after the 2022 divergence confirmed — knows exactly why this signal matters.
⏳ The Critical Window
2 days and a few hours remaining for the weekly candle to close.
Everything depends on that close. A confirmed weekly bullish divergence would be one of the strongest signals that this bear market is approaching its final bottom.
Not confirmed yet. Do not jump early.
📌 The Simple Rule$BTC
Wait for the weekly close. Let the signal confirm itself.
One more candle could change the entire market narrative. 👇
Patience here is not weakness — it is the actual edge. 🤝
#BTC #Bitcoin #BTCUSDT #CryptoTrading #BinanceSquare #CryptoAnalysis #Binance #BullishDivergence #MarketCycle #CryptoInvestor #Web3 #Blockchain #CryptoAlert #DYOR #CryptoMarket #TechnicalAnalysis #TradingStrategy #CryptoSignals #BearMarket #WeeklyChart $BTC
📊 $BTC — Weekly Bullish Divergence Forming. Not Confirmed Yet.
This is the signal every patient Bitcoin holder has been waiting to see.
But patience is still required. The weekly candle has not closed yet.
💡 What Is Happening Right Now
Bullish divergence is forming on the weekly timeframe — price making lower lows while momentum indicators show higher lows.
That disconnect between price and momentum is historically one of the strongest bottom signals in technical analysis.
🔍 The 2022 Parallel
Current structure is mirroring the 2022 bear market remarkably closely.
And anyone who remembers what happened after the 2022 divergence confirmed — knows exactly why this signal matters.
⏳ The Critical Window
2 days and a few hours remaining for the weekly candle to close.
Everything depends on that close. A confirmed weekly bullish divergence would be one of the strongest signals that this bear market is approaching its final bottom.
Not confirmed yet. Do not jump early.
📌 The Simple Rule$BTC
Wait for the weekly close. Let the signal confirm itself.
One more candle could change the entire market narrative. 👇
Patience here is not weakness — it is the actual edge. 🤝
#BTC #Bitcoin #BTCUSDT #CryptoTrading #BinanceSquare #CryptoAnalysis #Binance #BullishDivergence #MarketCycle #CryptoInvestor #Web3 #Blockchain #CryptoAlert #DYOR #CryptoMarket #TechnicalAnalysis #TradingStrategy #CryptoSignals #BearMarket #WeeklyChart $BTC
This is the signal every patient Bitcoin holder has been waiting to see.
But patience is still required. The weekly candle has not closed yet.
💡 What Is Happening Right Now
Bullish divergence is forming on the weekly timeframe — price making lower lows while momentum indicators show higher lows.
That disconnect between price and momentum is historically one of the strongest bottom signals in technical analysis.
🔍 The 2022 Parallel
Current structure is mirroring the 2022 bear market remarkably closely.
And anyone who remembers what happened after the 2022 divergence confirmed — knows exactly why this signal matters.
⏳ The Critical Window
2 days and a few hours remaining for the weekly candle to close.
Everything depends on that close. A confirmed weekly bullish divergence would be one of the strongest signals that this bear market is approaching its final bottom.
Not confirmed yet. Do not jump early.
📌 The Simple Rule$BTC
Wait for the weekly close. Let the signal confirm itself.
One more candle could change the entire market narrative. 👇
Patience here is not weakness — it is the actual edge. 🤝
#BTC #Bitcoin #BTCUSDT #CryptoTrading #BinanceSquare #CryptoAnalysis #Binance #BullishDivergence #MarketCycle #CryptoInvestor #Web3 #Blockchain #CryptoAlert #DYOR #CryptoMarket #TechnicalAnalysis #TradingStrategy #CryptoSignals #BearMarket #WeeklyChart $BTC
83

·
--
$BTC
{future}(BTCUSDT)
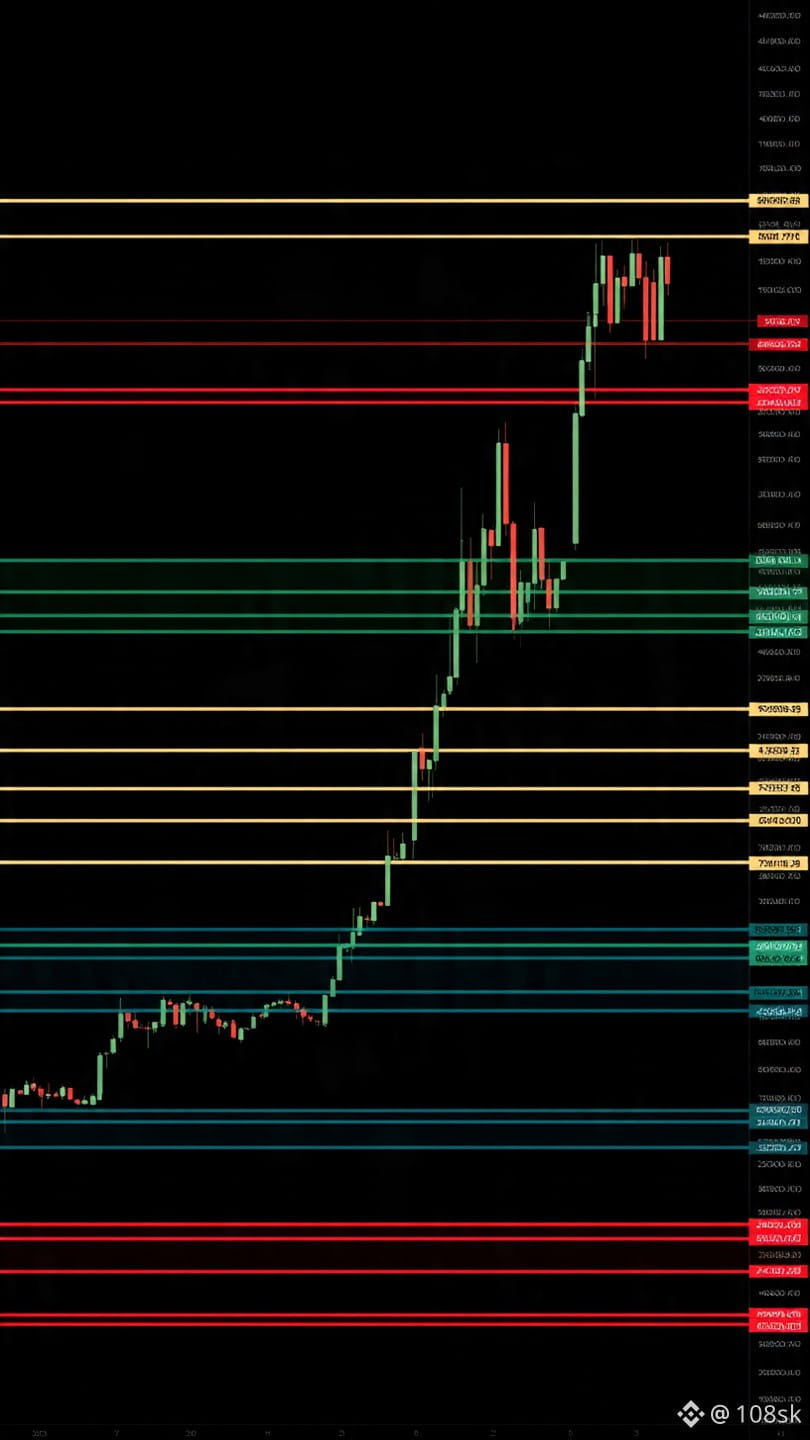
1W Chart Snapshot 📊
Current Level: 61K support zone active
Weekly timeframe: structure update
Chart Zones:
61K = current weekly support
56K = next major zone below
20K-21K = long term demand block
Mid-zone level = 40K area
1W candle abhi 61K pe decision point pe hai 📉
1W data kya bol raha? Tum chart pe kya level track kar rahe ho? 👇💬
#BTC #BinanceSquare #WeeklyChart #CryptoAnalysis
$BTC
1W Chart Snapshot 📊
Current Level: 61K support zone active
Weekly timeframe: structure update
Chart Zones:
61K = current weekly support
56K = next major zone below
20K-21K = long term demand block
Mid-zone level = 40K area
1W candle abhi 61K pe decision point pe hai 📉
1W data kya bol raha? Tum chart pe kya level track kar rahe ho? 👇💬
#BTC #BinanceSquare #WeeklyChart #CryptoAnalysis
1W Chart Snapshot 📊
Current Level: 61K support zone active
Weekly timeframe: structure update
Chart Zones:
61K = current weekly support
56K = next major zone below
20K-21K = long term demand block
Mid-zone level = 40K area
1W candle abhi 61K pe decision point pe hai 📉
1W data kya bol raha? Tum chart pe kya level track kar rahe ho? 👇💬
#BTC #BinanceSquare #WeeklyChart #CryptoAnalysis
41

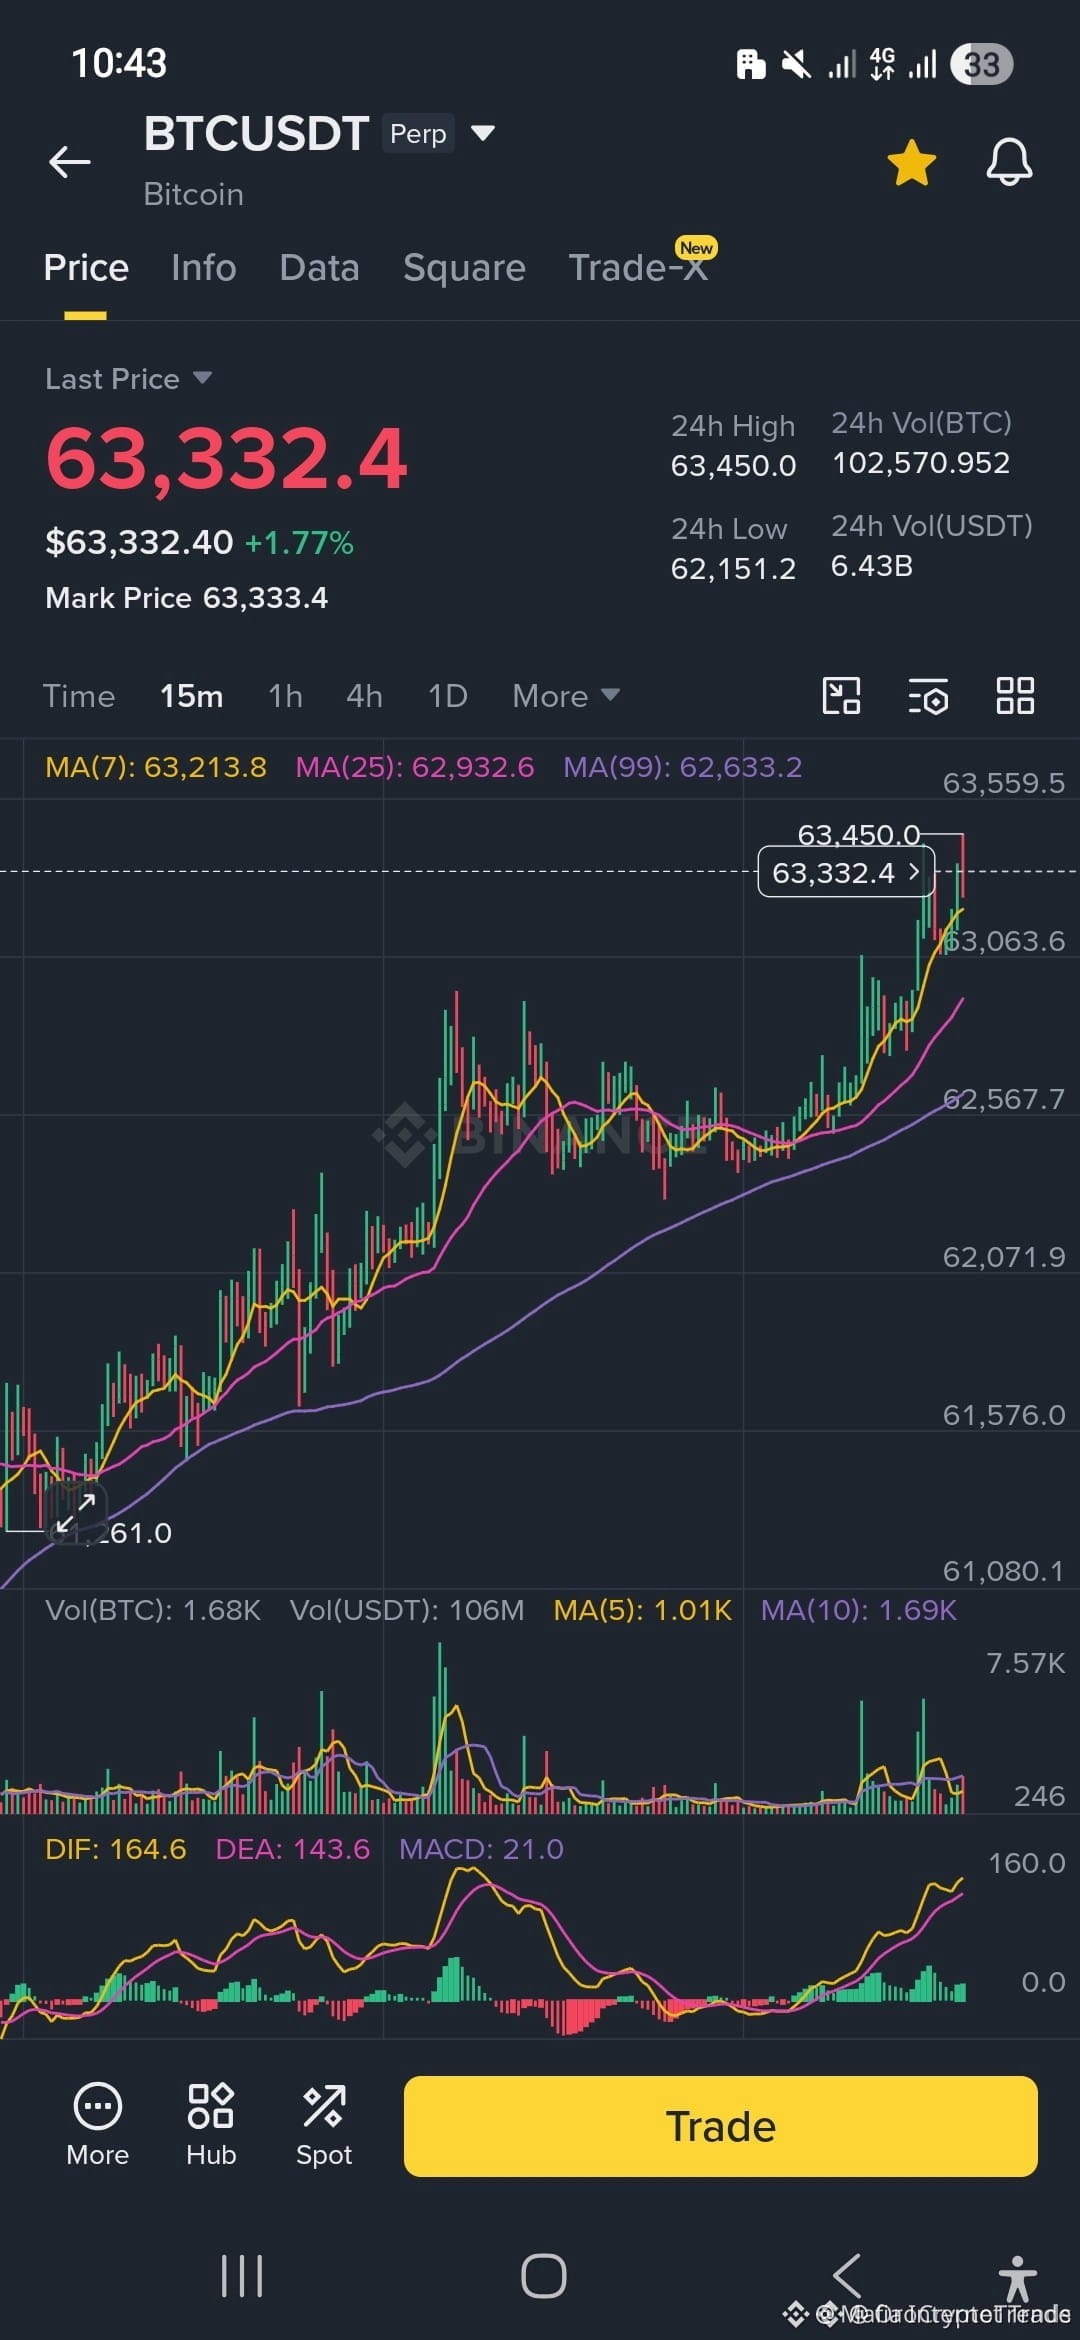
$BTC DAILY RALLY LOOKS CLEAN, BUT WEEKLY MACD IS STILL BEARISH 🔥
Price sitting at $63.3K with positive momentum on lower timeframes, short-term MAs aligned, and MACD green across daily and 4H. Feels good, I get it. But when I pulled up the weekly chart, the major moving averages are still above price and the weekly MACD remains negative. That’s a completely different story.
I’ve seen this movie before — local momentum without higher timeframe confirmation can flip hard. It doesn’t mean the rally is dead, but it means we’re not out of the woods yet. Are you buying the daily setup or waiting for the weekly to confirm?
Not financial advice. Always manage your risk.
#BTC #WeeklyChart #CryptoAnalysis #MACD
🔥
$BTC DAILY RALLY LOOKS CLEAN, BUT WEEKLY MACD IS STILL BEARISH 🔥
Price sitting at $63.3K with positive momentum on lower timeframes, short-term MAs aligned, and MACD green across daily and 4H. Feels good, I get it. But when I pulled up the weekly chart, the major moving averages are still above price and the weekly MACD remains negative. That’s a completely different story.
I’ve seen this movie before — local momentum without higher timeframe confirmation can flip hard. It doesn’t mean the rally is dead, but it means we’re not out of the woods yet. Are you buying the daily setup or waiting for the weekly to confirm?
Not financial advice. Always manage your risk.
#BTC #WeeklyChart #CryptoAnalysis #MACD
🔥
Price sitting at $63.3K with positive momentum on lower timeframes, short-term MAs aligned, and MACD green across daily and 4H. Feels good, I get it. But when I pulled up the weekly chart, the major moving averages are still above price and the weekly MACD remains negative. That’s a completely different story.
I’ve seen this movie before — local momentum without higher timeframe confirmation can flip hard. It doesn’t mean the rally is dead, but it means we’re not out of the woods yet. Are you buying the daily setup or waiting for the weekly to confirm?
Not financial advice. Always manage your risk.
#BTC #WeeklyChart #CryptoAnalysis #MACD
🔥
93

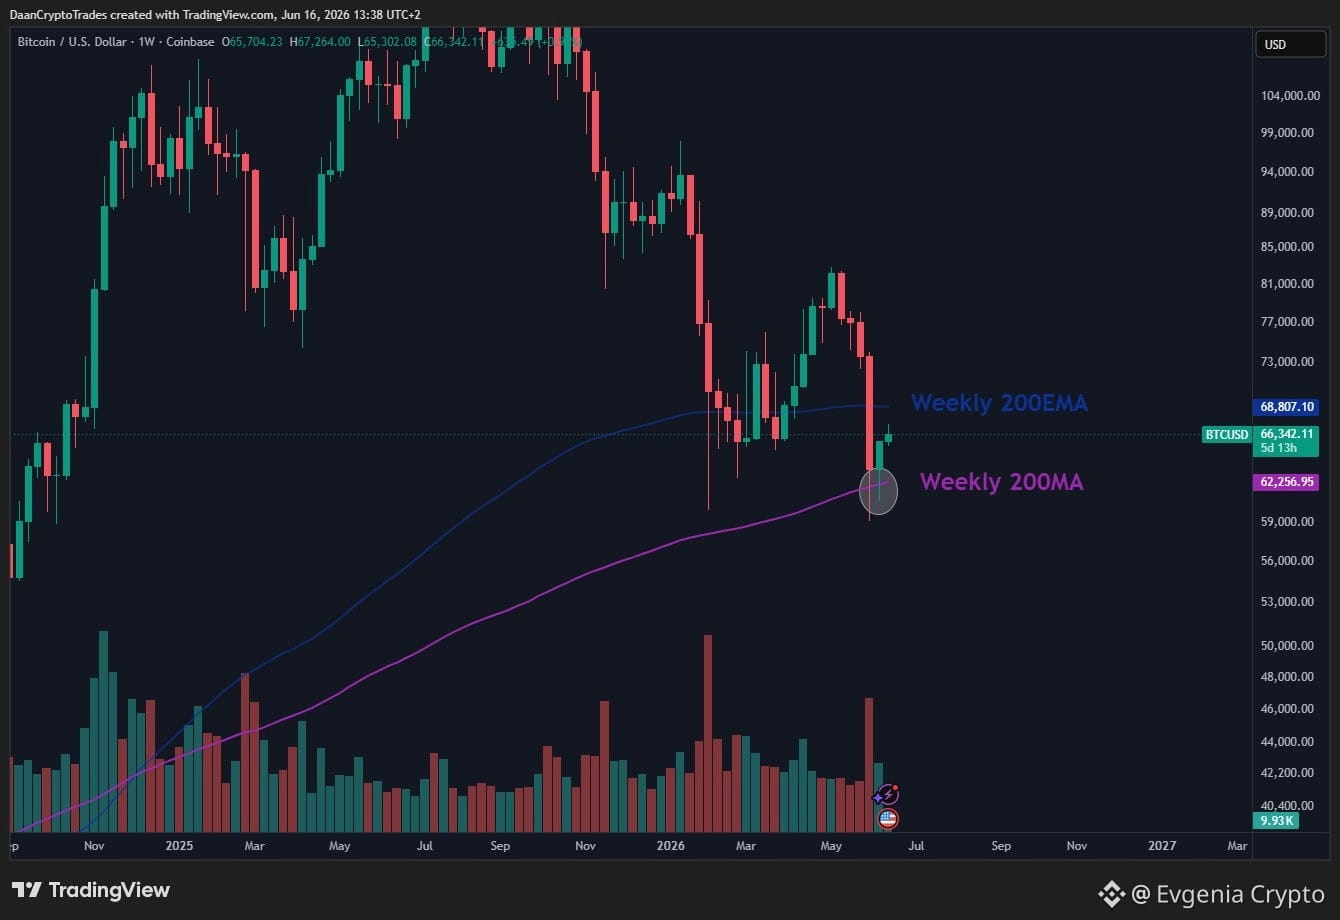
Bitcoin is consolidating between key metrics — the weekly 200MA and 200EMA.
The goal for buyers is to hold above the 200EMA, relying on the 200MA.
If this support gets broken down, the long-term trend will be shattered, and the priority will shift towards a deep dive.
Protect your capital and wait for confirmation from the market!
$BTC
{future}(BTCUSDT)
#BTC #CryptoAnalysis #WeeklyChart
Bitcoin is consolidating between key metrics — the weekly 200MA and 200EMA.
The goal for buyers is to hold above the 200EMA, relying on the 200MA.
If this support gets broken down, the long-term trend will be shattered, and the priority will shift towards a deep dive.
Protect your capital and wait for confirmation from the market!
$BTC
#BTC #CryptoAnalysis #WeeklyChart
The goal for buyers is to hold above the 200EMA, relying on the 200MA.
If this support gets broken down, the long-term trend will be shattered, and the priority will shift towards a deep dive.
Protect your capital and wait for confirmation from the market!
$BTC
#BTC #CryptoAnalysis #WeeklyChart
295


$ETC BREAKS A 1-YEAR FALLING WEDGE ON THE WEEKLY CHART! 💥 📈
Target: 25 🚀
After an agonizing full year of compression, $ETC has finally shattered its weekly falling wedge pattern with undeniable authority. 📊 The coiled spring is unwinding fast as patient accumulation converts directly into aggressive buying momentum.
Multi-month consolidation structures of this caliber rarely offer second chances once expansion begins. 💡 Order flow is aggressively lifting asks, signaling that smart capital is positioning for a full-scale macro run toward the upper expansion target.
Sellers are running out of runway while market participants rush to catch this weekly breakout before velocity accelerates. 💬 Will you ride this weekly trend shift early or end up chasing the vertical impulse near the target zone? 👇
⚠️ Not financial advice. Always manage your risk. 🛡️
🏷️ #ETC #Breakout #WeeklyChart #Altcoins #Crypto
🔥 ⚡
$ETC BREAKS A 1-YEAR FALLING WEDGE ON THE WEEKLY CHART! 💥 📈
Target: 25 🚀
After an agonizing full year of compression, $ETC has finally shattered its weekly falling wedge pattern with undeniable authority. 📊 The coiled spring is unwinding fast as patient accumulation converts directly into aggressive buying momentum.
Multi-month consolidation structures of this caliber rarely offer second chances once expansion begins. 💡 Order flow is aggressively lifting asks, signaling that smart capital is positioning for a full-scale macro run toward the upper expansion target.
Sellers are running out of runway while market participants rush to catch this weekly breakout before velocity accelerates. 💬 Will you ride this weekly trend shift early or end up chasing the vertical impulse near the target zone? 👇
⚠️ Not financial advice. Always manage your risk. 🛡️
🏷️ #ETC #Breakout #WeeklyChart #Altcoins #Crypto
🔥 ⚡
Target: 25 🚀
After an agonizing full year of compression, $ETC has finally shattered its weekly falling wedge pattern with undeniable authority. 📊 The coiled spring is unwinding fast as patient accumulation converts directly into aggressive buying momentum.
Multi-month consolidation structures of this caliber rarely offer second chances once expansion begins. 💡 Order flow is aggressively lifting asks, signaling that smart capital is positioning for a full-scale macro run toward the upper expansion target.
Sellers are running out of runway while market participants rush to catch this weekly breakout before velocity accelerates. 💬 Will you ride this weekly trend shift early or end up chasing the vertical impulse near the target zone? 👇
⚠️ Not financial advice. Always manage your risk. 🛡️
🏷️ #ETC #Breakout #WeeklyChart #Altcoins #Crypto
🔥 ⚡
13

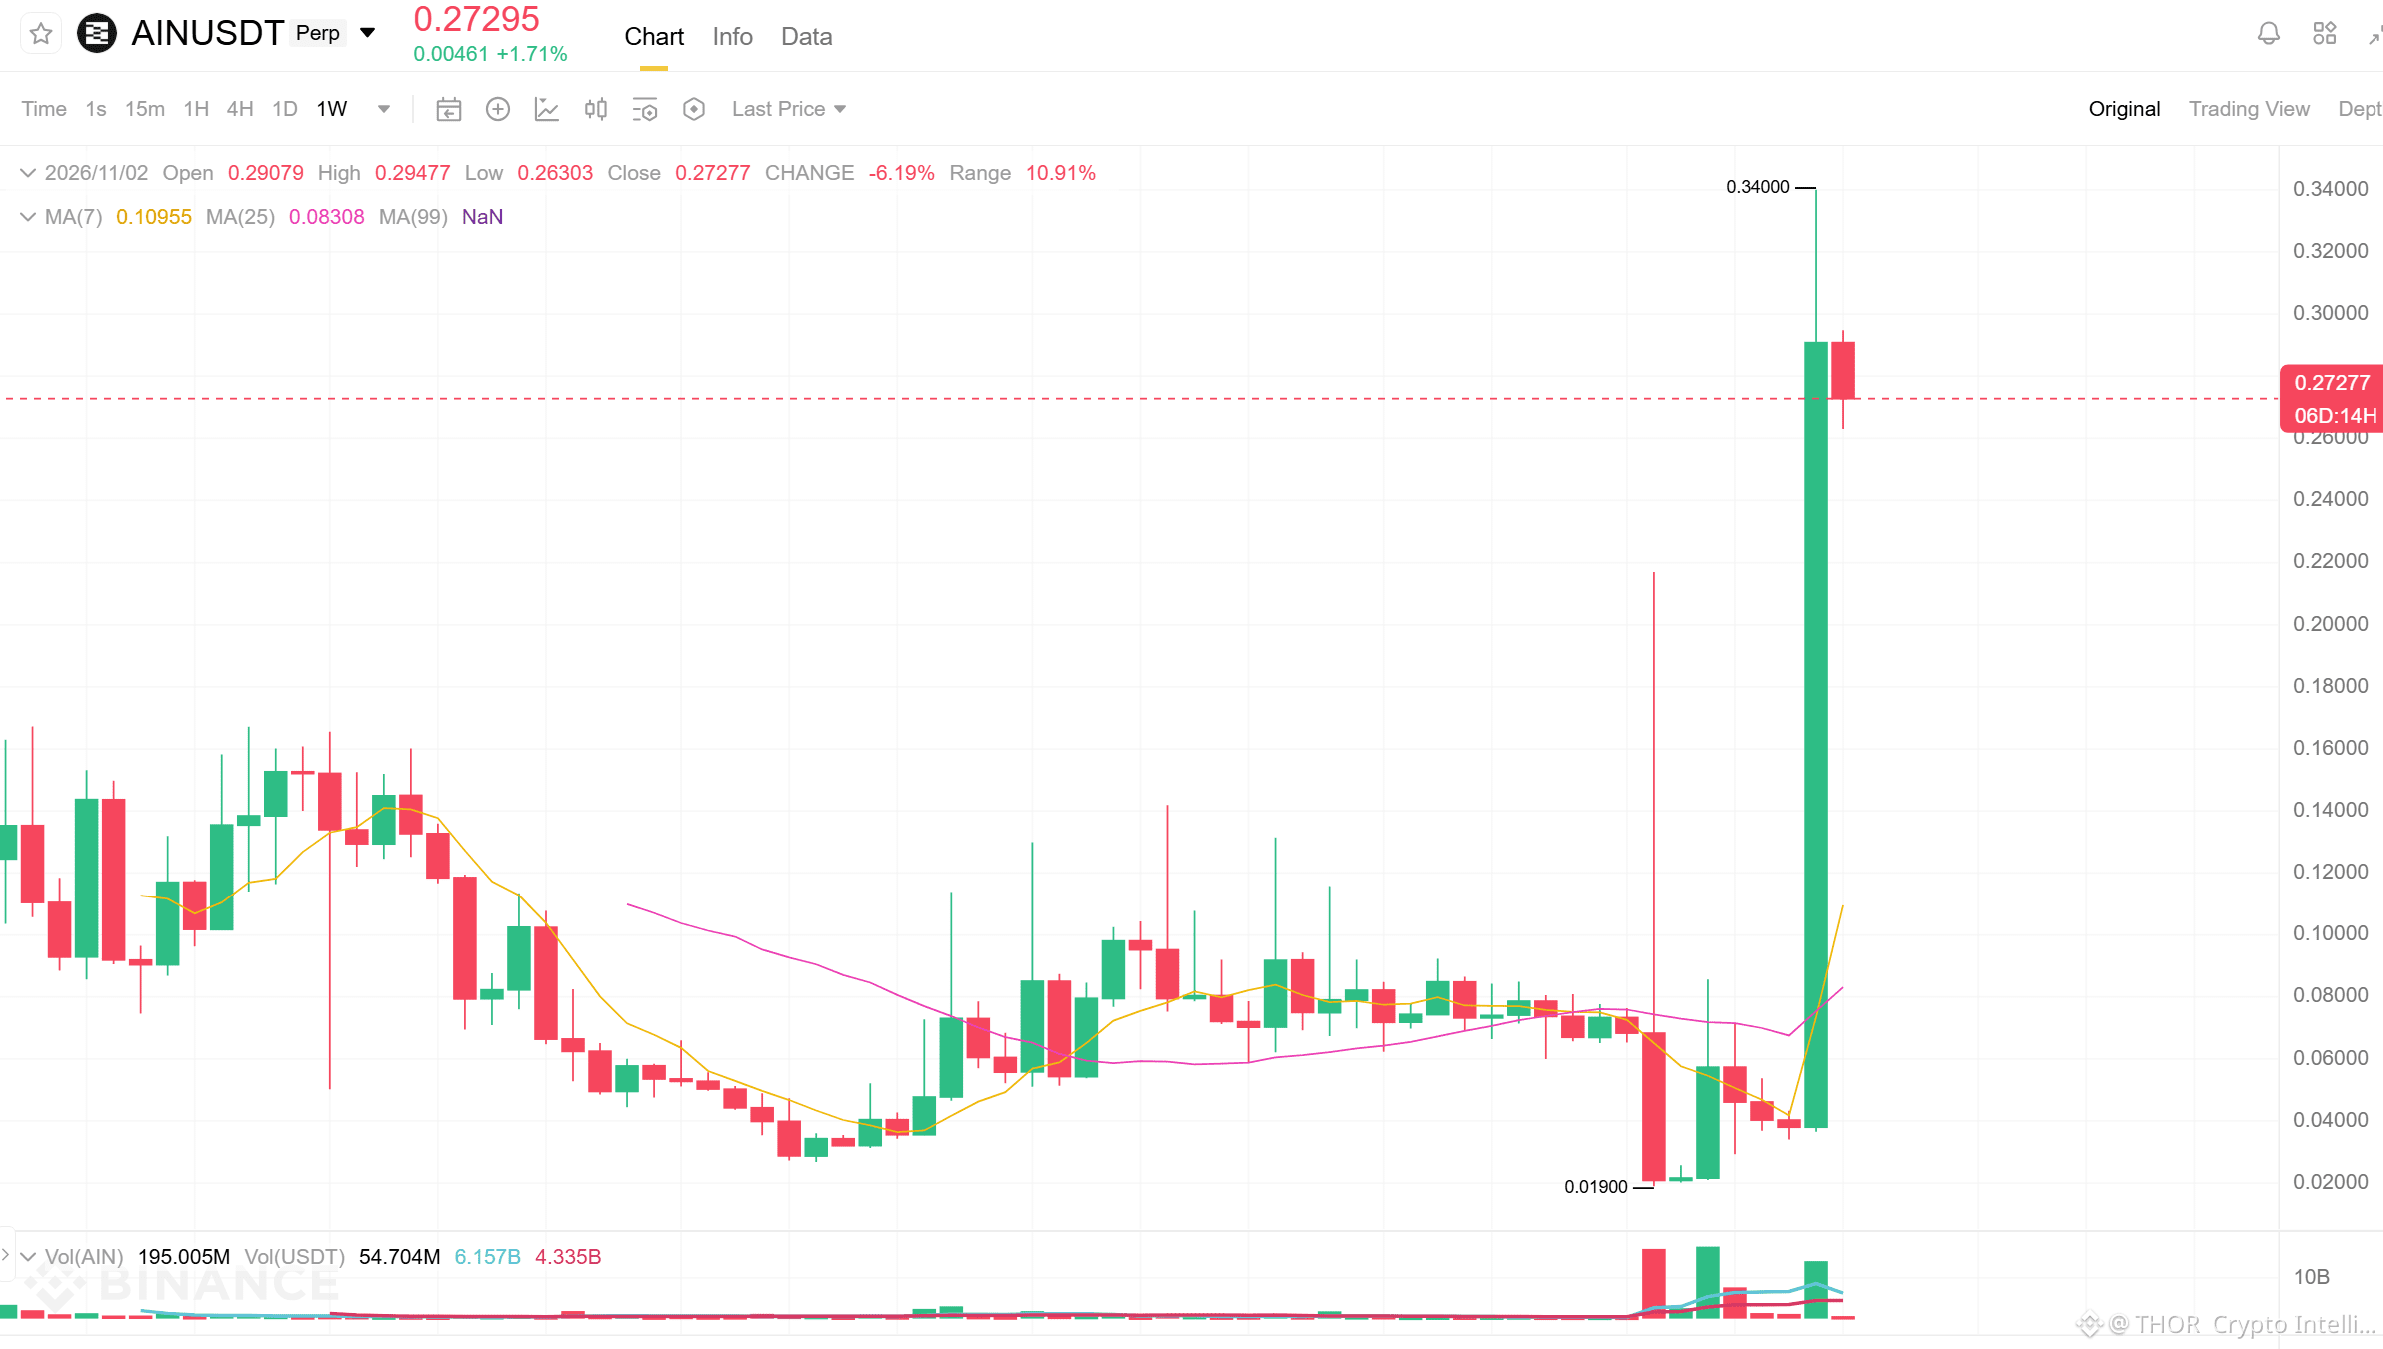
🚨 $AIN 'S MEGA RALLY HITS RESISTANCE — $0.34 IS THE NEXT TEST!
#AIN has exploded from near $0.02 to $0.34, but the weekly chart now shows its first significant rejection.
⚡ THOR Weekly Update
📍 Current: $0.2728
🔺 Weekly high: $0.3400
🔴 Immediate resistance: $0.2950
🟢 Near-term support: $0.2630
📊 MA(7): $0.1096
📊 MA(25): $0.0831
🟢 Bull case: Reclaim $0.295 and challenge $0.34.
🔴 Bear case: Lose $0.263 and risk a deeper correction.
⚠️ THOR Risk Alert:
AIN has moved vertically and is trading far above its weekly averages. Extreme volatility and profit-taking risk remain high.
⚡ THOR Signal:
Major bullish breakout, but the weekly candle needs confirmation. Don't chase blindly.
👇 What's next?
🟢 Another rally
🟡 Consolidation
🔴 Sharp correction
#EsportsTrading #IDOL #LYN #WeeklyChart
{future}(AINUSDT)
$LYN
{future}(LYNUSDT)
$IDOL
{future}(IDOLUSDT)
🚨 $AIN 'S MEGA RALLY HITS RESISTANCE — $0.34 IS THE NEXT TEST!
#AIN has exploded from near $0.02 to $0.34, but the weekly chart now shows its first significant rejection.
⚡ THOR Weekly Update
📍 Current: $0.2728
🔺 Weekly high: $0.3400
🔴 Immediate resistance: $0.2950
🟢 Near-term support: $0.2630
📊 MA(7): $0.1096
📊 MA(25): $0.0831
🟢 Bull case: Reclaim $0.295 and challenge $0.34.
🔴 Bear case: Lose $0.263 and risk a deeper correction.
⚠️ THOR Risk Alert:
AIN has moved vertically and is trading far above its weekly averages. Extreme volatility and profit-taking risk remain high.
⚡ THOR Signal:
Major bullish breakout, but the weekly candle needs confirmation. Don't chase blindly.
👇 What's next?
🟢 Another rally
🟡 Consolidation
🔴 Sharp correction
#EsportsTrading #IDOL #LYN #WeeklyChart
$LYN
$IDOL
#AIN has exploded from near $0.02 to $0.34, but the weekly chart now shows its first significant rejection.
⚡ THOR Weekly Update
📍 Current: $0.2728
🔺 Weekly high: $0.3400
🔴 Immediate resistance: $0.2950
🟢 Near-term support: $0.2630
📊 MA(7): $0.1096
📊 MA(25): $0.0831
🟢 Bull case: Reclaim $0.295 and challenge $0.34.
🔴 Bear case: Lose $0.263 and risk a deeper correction.
⚠️ THOR Risk Alert:
AIN has moved vertically and is trading far above its weekly averages. Extreme volatility and profit-taking risk remain high.
⚡ THOR Signal:
Major bullish breakout, but the weekly candle needs confirmation. Don't chase blindly.
👇 What's next?
🟢 Another rally
🟡 Consolidation
🔴 Sharp correction
#EsportsTrading #IDOL #LYN #WeeklyChart
$LYN
$IDOL
770

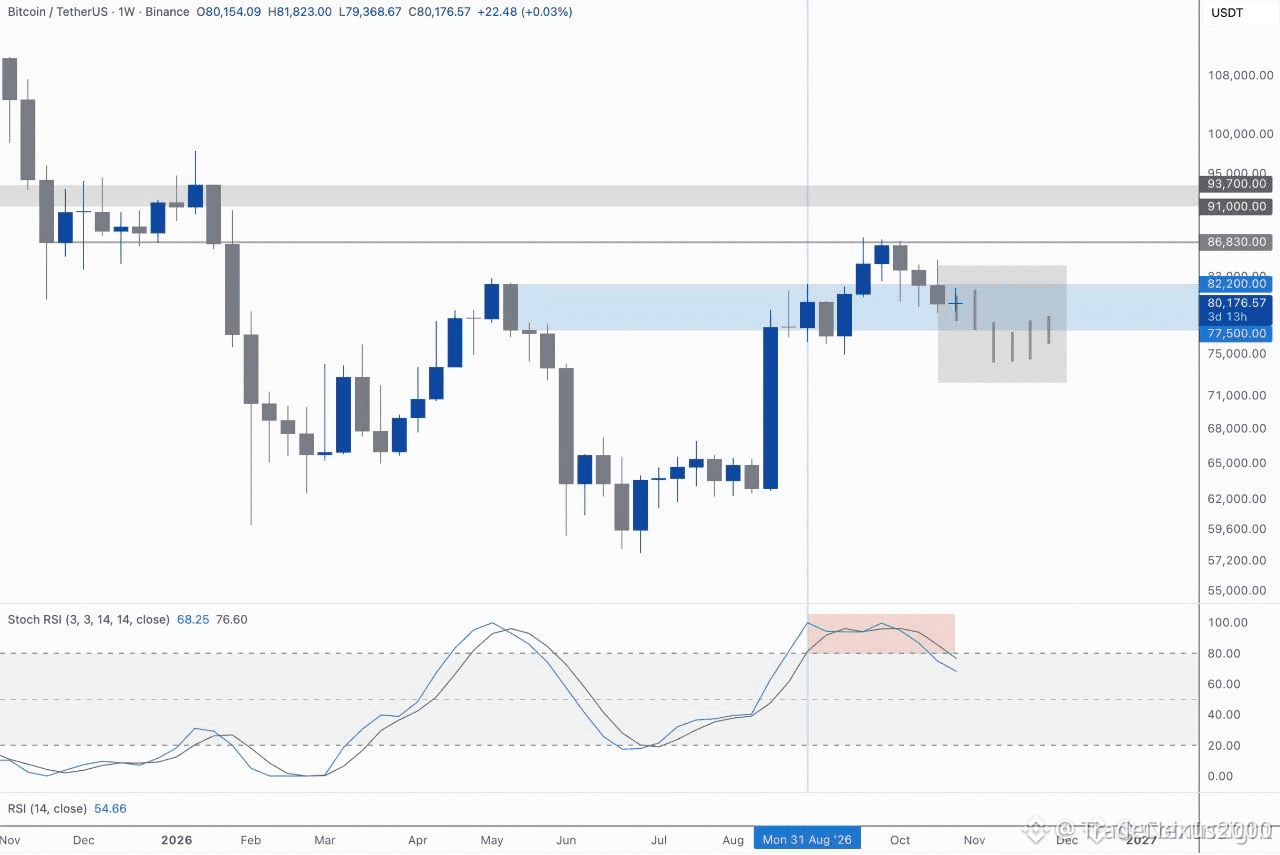
🚀 📈 $BTC STOKASTIC RSI BREAKS OVERBOUGHT ZONE – BULLS GAIN MOMENTUM
The weekly Stochastic RSI has finally escaped the overbought territory, snapping back below the 80% threshold. 📊 This divergence suggests that buying pressure remains intact while immediate sell‑off pressure is waning.
Coupled with a tepid correction that failed to breach the 30‑day moving average, the market structure stays bullish. ⚡ Smart money appears to be consolidating liquidity above the recent swing high, priming a clean upside thrust.
💬 Do you see the next leg targeting the next resistance zone, or are you waiting for a deeper pullback?
⚠️ Not financial advice. Always manage your risk. 🛡️
🏷️ #BTC #BullishSetup #StochRSI #WeeklyChart #Crypto
🔥 💎
🚀 📈 $BTC STOKASTIC RSI BREAKS OVERBOUGHT ZONE – BULLS GAIN MOMENTUM
The weekly Stochastic RSI has finally escaped the overbought territory, snapping back below the 80% threshold. 📊 This divergence suggests that buying pressure remains intact while immediate sell‑off pressure is waning.
Coupled with a tepid correction that failed to breach the 30‑day moving average, the market structure stays bullish. ⚡ Smart money appears to be consolidating liquidity above the recent swing high, priming a clean upside thrust.
💬 Do you see the next leg targeting the next resistance zone, or are you waiting for a deeper pullback?
⚠️ Not financial advice. Always manage your risk. 🛡️
🏷️ #BTC #BullishSetup #StochRSI #WeeklyChart #Crypto
🔥 💎
The weekly Stochastic RSI has finally escaped the overbought territory, snapping back below the 80% threshold. 📊 This divergence suggests that buying pressure remains intact while immediate sell‑off pressure is waning.
Coupled with a tepid correction that failed to breach the 30‑day moving average, the market structure stays bullish. ⚡ Smart money appears to be consolidating liquidity above the recent swing high, priming a clean upside thrust.
💬 Do you see the next leg targeting the next resistance zone, or are you waiting for a deeper pullback?
⚠️ Not financial advice. Always manage your risk. 🛡️
🏷️ #BTC #BullishSetup #StochRSI #WeeklyChart #Crypto
🔥 💎
3

·
--
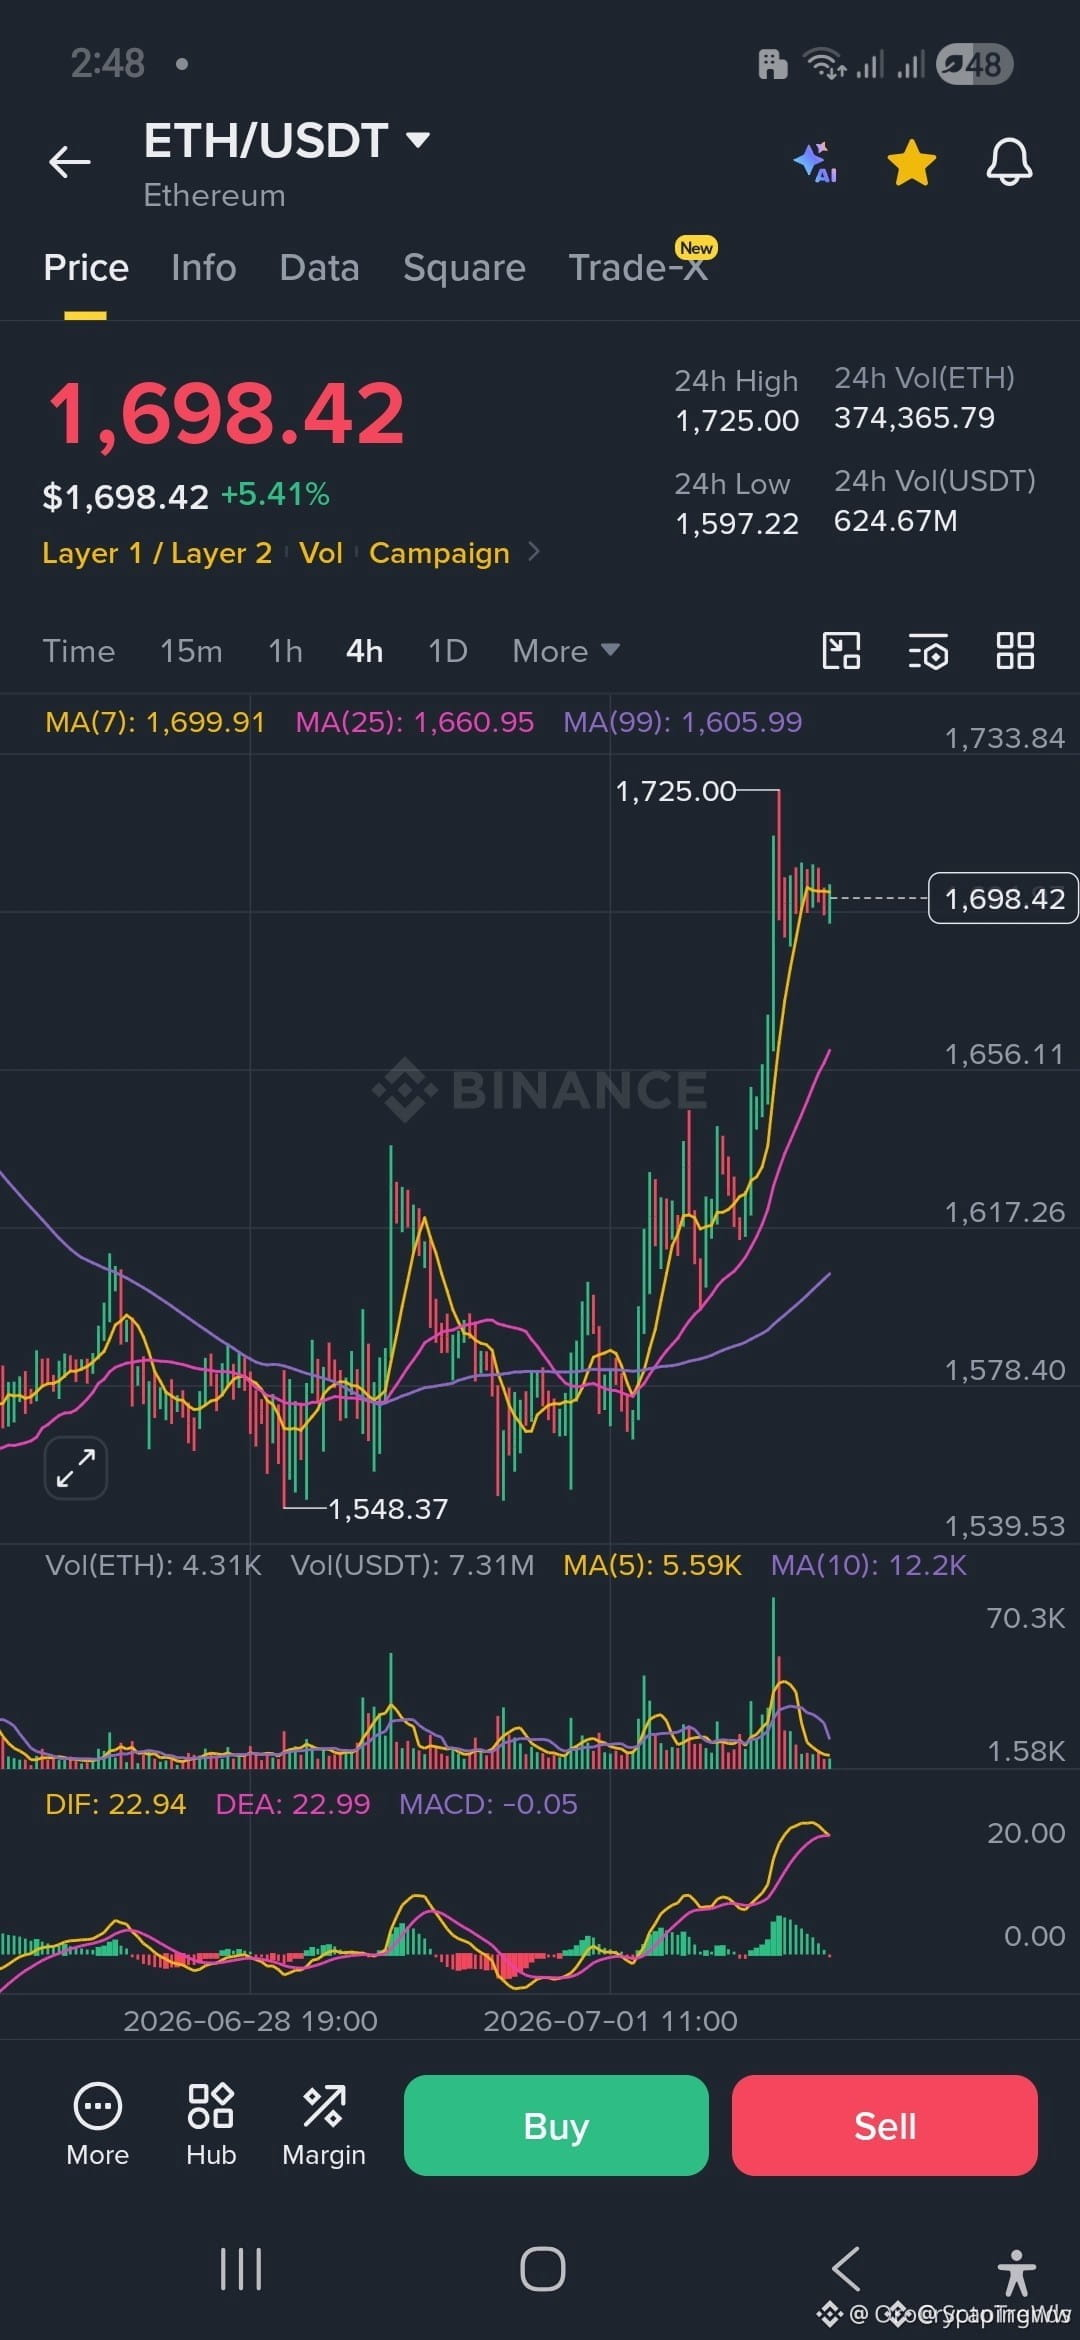
$ETH IS GREEN BUT THE WEEKLY TREND IS STILL A MILE AWAY 🔍
ETH bounced 20% from 1,512 to 1,850 and is currently sitting at 1,698 — solid green day with over 5% upside. The hourly averages just crossed bullish, so short-term momentum is there.
But the weekly average still sits near 2,800. That's a massive gap between current price and the bigger trend. This setup looks like the bounce off 1,385 that eventually faded. The 15m chart is choppy right now, showing indecision. Are you trusting this bounce or waiting for the weekly to confirm?
Not financial advice. Always manage your risk.
#ETH #Ethereum #CryptoAnalysis #WeeklyChart #Bounce
⚡
$ETH IS GREEN BUT THE WEEKLY TREND IS STILL A MILE AWAY 🔍
ETH bounced 20% from 1,512 to 1,850 and is currently sitting at 1,698 — solid green day with over 5% upside. The hourly averages just crossed bullish, so short-term momentum is there.
But the weekly average still sits near 2,800. That's a massive gap between current price and the bigger trend. This setup looks like the bounce off 1,385 that eventually faded. The 15m chart is choppy right now, showing indecision. Are you trusting this bounce or waiting for the weekly to confirm?
Not financial advice. Always manage your risk.
#ETH #Ethereum #CryptoAnalysis #WeeklyChart #Bounce
⚡
ETH bounced 20% from 1,512 to 1,850 and is currently sitting at 1,698 — solid green day with over 5% upside. The hourly averages just crossed bullish, so short-term momentum is there.
But the weekly average still sits near 2,800. That's a massive gap between current price and the bigger trend. This setup looks like the bounce off 1,385 that eventually faded. The 15m chart is choppy right now, showing indecision. Are you trusting this bounce or waiting for the weekly to confirm?
Not financial advice. Always manage your risk.
#ETH #Ethereum #CryptoAnalysis #WeeklyChart #Bounce
⚡

72

·
--

Article
Chart Patterns: Weekly Candle Closes Before Breakouts📊
Analyzing high-timeframe historical structures highlights a highly consistent technical pattern for $BTC
{spot}(BTCUSDT)
. Looking back at the historical beginnings of every major market cycle, the most explosive macro expansions have always been triggered by a clean weekly candle close above previous multi-month consolidation ranges. $BNB
{spot}(BNBUSDT)
When @bitcoin secures a definitive weekly print above heavy overhead horizontal resistance, it effectively signals the complete exhaustion of macro sell-side pressure. These high-timeframe closes serve as a green light for trend-following systematic funds, which rapidly inject massive buy-side volume into the market. Watch the weekly chart structure closely. The ultimate validation of the next major trend is determined on this critical macro timeframe. 🪙 $SOL
{spot}(SOLUSDT)
#TechnicalAnalysis #WeeklyChart #cryptotrading #BullishBreakout #chartpatterns
Chart Patterns: Weekly Candle Closes Before Breakouts
📊
Analyzing high-timeframe historical structures highlights a highly consistent technical pattern for $BTC
. Looking back at the historical beginnings of every major market cycle, the most explosive macro expansions have always been triggered by a clean weekly candle close above previous multi-month consolidation ranges. $BNB
When @Bitcoin secures a definitive weekly print above heavy overhead horizontal resistance, it effectively signals the complete exhaustion of macro sell-side pressure. These high-timeframe closes serve as a green light for trend-following systematic funds, which rapidly inject massive buy-side volume into the market. Watch the weekly chart structure closely. The ultimate validation of the next major trend is determined on this critical macro timeframe. 🪙 $SOL
#TechnicalAnalysis #WeeklyChart #cryptotrading #BullishBreakout #chartpatterns
Analyzing high-timeframe historical structures highlights a highly consistent technical pattern for $BTC
. Looking back at the historical beginnings of every major market cycle, the most explosive macro expansions have always been triggered by a clean weekly candle close above previous multi-month consolidation ranges. $BNB
When @Bitcoin secures a definitive weekly print above heavy overhead horizontal resistance, it effectively signals the complete exhaustion of macro sell-side pressure. These high-timeframe closes serve as a green light for trend-following systematic funds, which rapidly inject massive buy-side volume into the market. Watch the weekly chart structure closely. The ultimate validation of the next major trend is determined on this critical macro timeframe. 🪙 $SOL
#TechnicalAnalysis #WeeklyChart #cryptotrading #BullishBreakout #chartpatterns
47
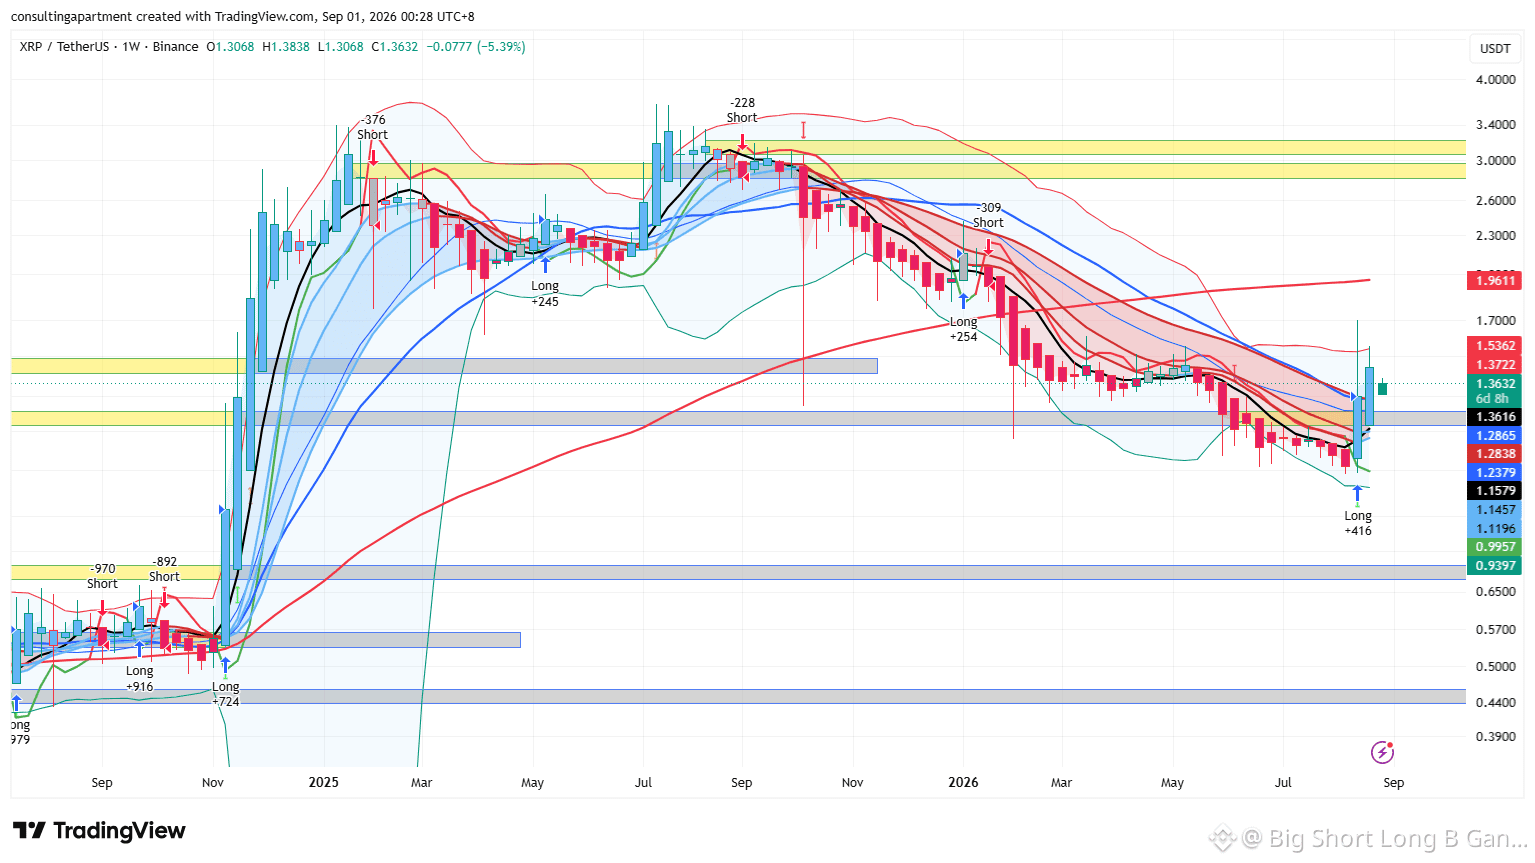
$XRP JUST HIT THE LEVEL THAT BOTTOMED THE 2021-2023 CYCLE 🚨🟢
Body
📌 A weekly chart analyst spotted it first: XRP is trading near the exact 50% midpoint of its current range, the same spot that formed a major cycle bottom in the past. Price action now mirrors the 2021–2023 structure, where that zone ignited a multi-month recovery and eventual breakout above $1.90.
💡 On the 4H, buyers are stepping in hard at $1.09–1.10, pushing the Ultimate Oscillator back above 50 and Stochastic RSI out of oversold. Momentum is shifting, but a clean break above $1.16 is needed to flip the short-term structure. If this historical fractal repeats, the stage is set for a major higher-timeframe bounce. 💬 Do you trust the 50% level to hold like it did last time, or are you waiting for confirmation above $1.16? 👇
⚠️ Not financial advice. Always manage your risk. 🛡️
🏷️ #XRP #LongSetup #CryptoAnalysis #WeeklyChart #Altcoins
🦈 🔍
$XRP JUST HIT THE LEVEL THAT BOTTOMED THE 2021-2023 CYCLE 🚨🟢
Body
📌 A weekly chart analyst spotted it first: XRP is trading near the exact 50% midpoint of its current range, the same spot that formed a major cycle bottom in the past. Price action now mirrors the 2021–2023 structure, where that zone ignited a multi-month recovery and eventual breakout above $1.90.
💡 On the 4H, buyers are stepping in hard at $1.09–1.10, pushing the Ultimate Oscillator back above 50 and Stochastic RSI out of oversold. Momentum is shifting, but a clean break above $1.16 is needed to flip the short-term structure. If this historical fractal repeats, the stage is set for a major higher-timeframe bounce. 💬 Do you trust the 50% level to hold like it did last time, or are you waiting for confirmation above $1.16? 👇
⚠️ Not financial advice. Always manage your risk. 🛡️
🏷️ #XRP #LongSetup #CryptoAnalysis #WeeklyChart #Altcoins
🦈 🔍
Body
📌 A weekly chart analyst spotted it first: XRP is trading near the exact 50% midpoint of its current range, the same spot that formed a major cycle bottom in the past. Price action now mirrors the 2021–2023 structure, where that zone ignited a multi-month recovery and eventual breakout above $1.90.
💡 On the 4H, buyers are stepping in hard at $1.09–1.10, pushing the Ultimate Oscillator back above 50 and Stochastic RSI out of oversold. Momentum is shifting, but a clean break above $1.16 is needed to flip the short-term structure. If this historical fractal repeats, the stage is set for a major higher-timeframe bounce. 💬 Do you trust the 50% level to hold like it did last time, or are you waiting for confirmation above $1.16? 👇
⚠️ Not financial advice. Always manage your risk. 🛡️
🏷️ #XRP #LongSetup #CryptoAnalysis #WeeklyChart #Altcoins
🦈 🔍
61
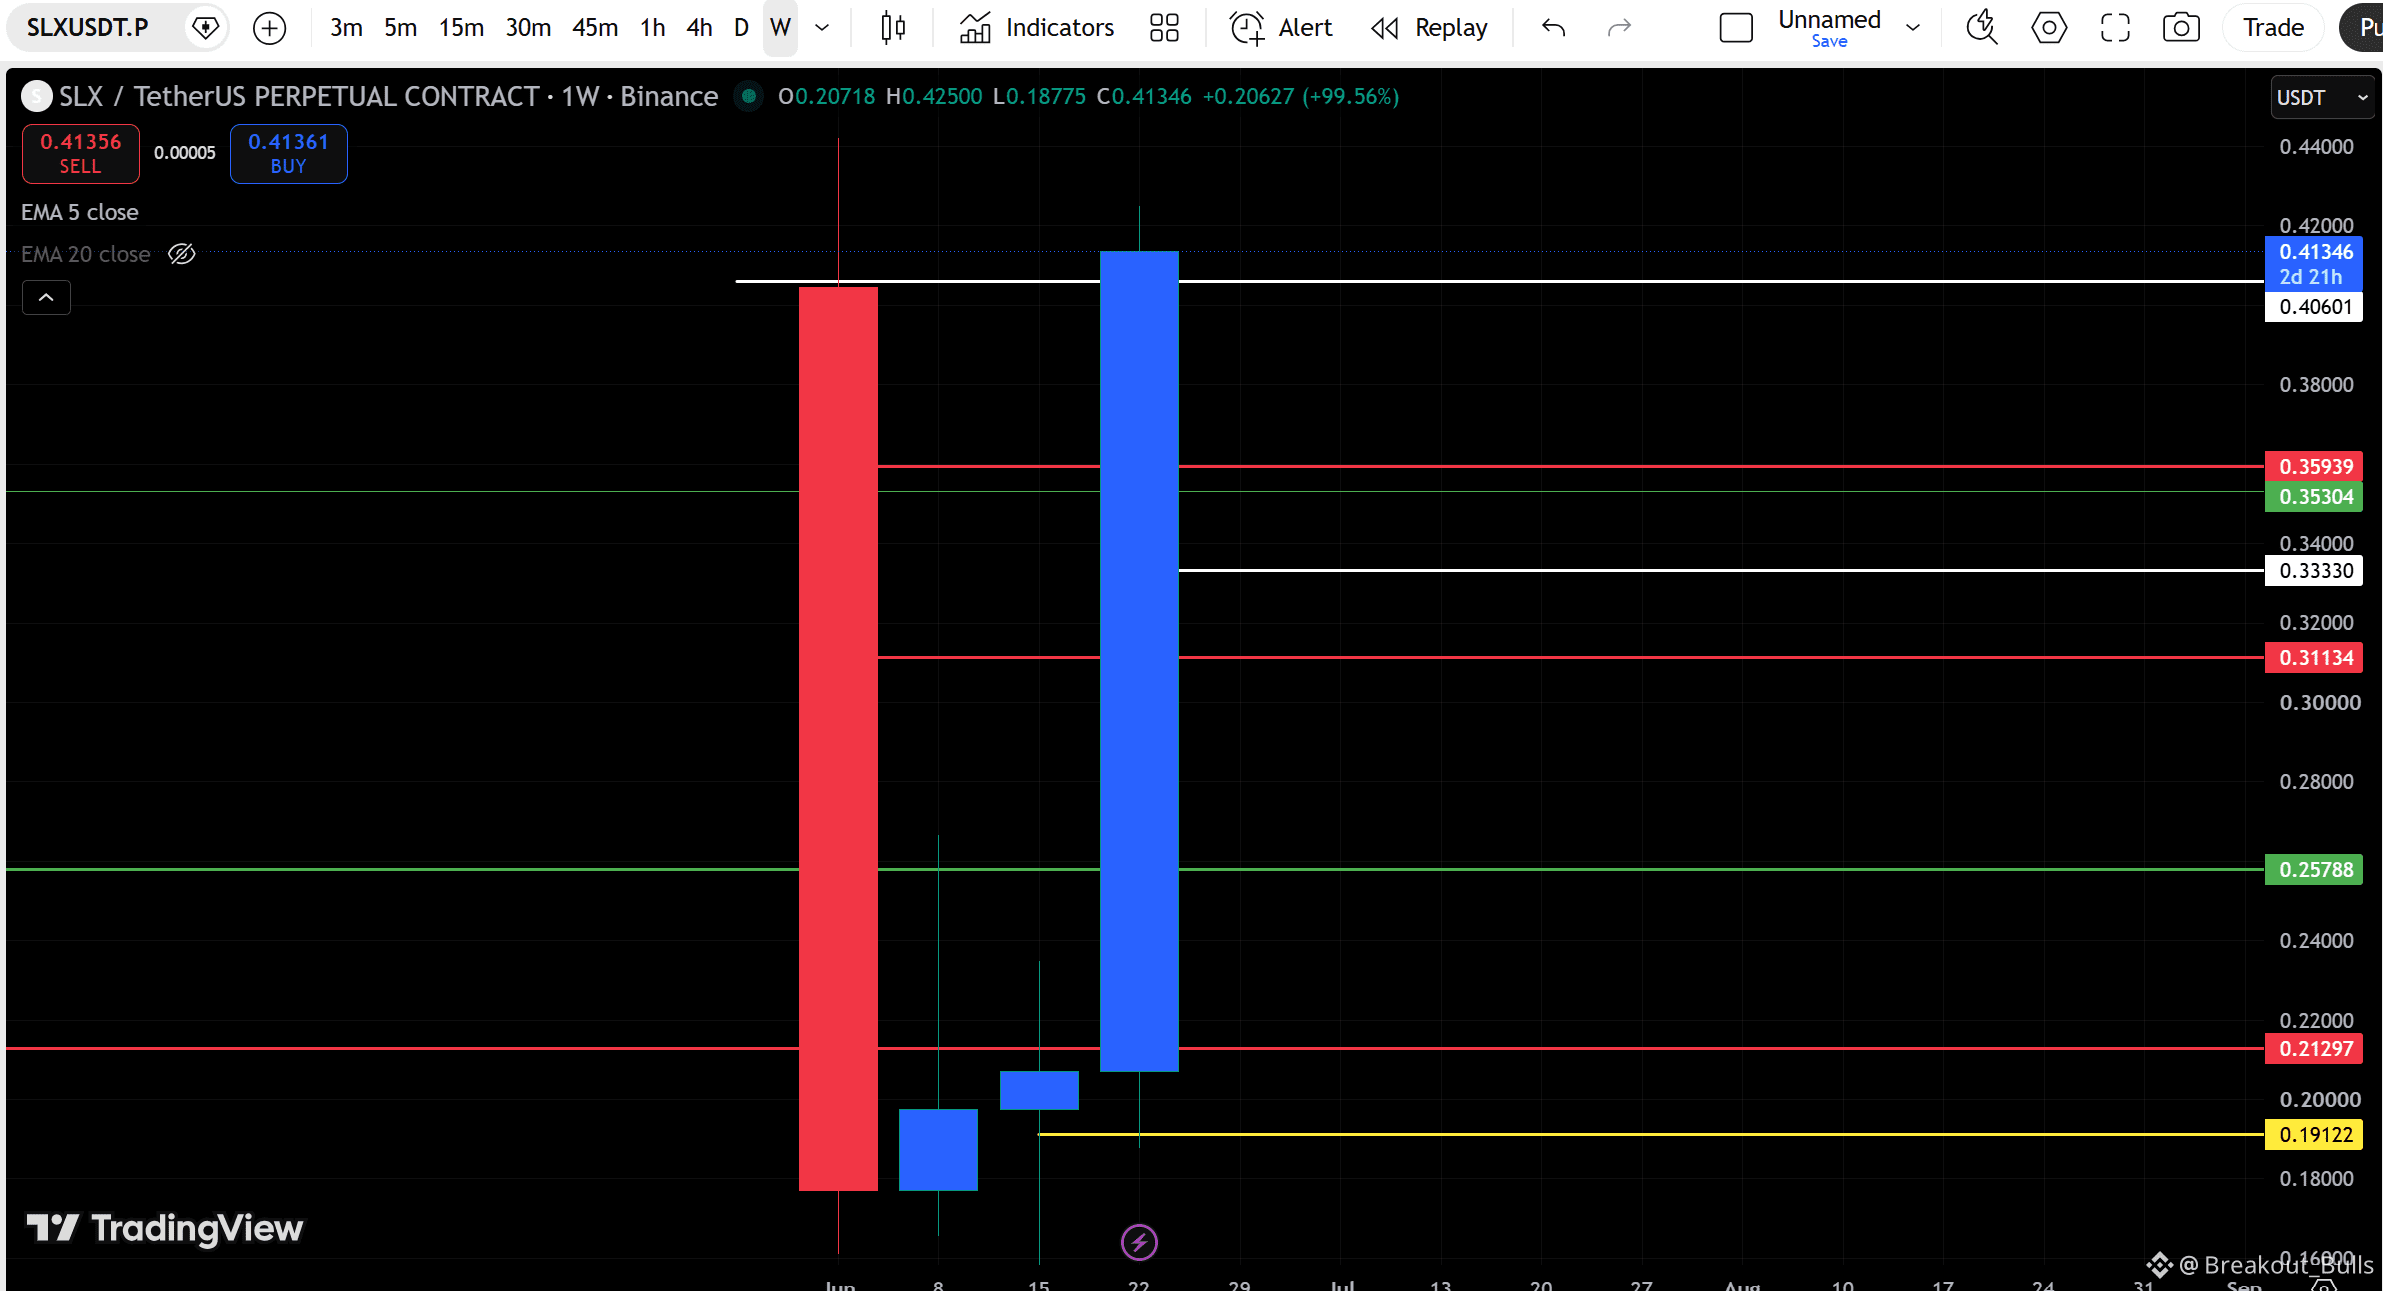
🚀 $SLX GOD CANDLE! Absolute Monster Weekly Breakout! 📈
The weekly (1W) chart for SLXUSDT.P on Binance reveals an incredible V-shaped recovery, completely erasing a massive multi-week dump with a single explosive move.
📊 The Technical Breakdown:
The Massive Pump: SLX exploded from a weekly open of 0.20718 to its current price of 0.41346, locking in an insane +99.56% gain so far this week.
Major Resistance Flipped: The bulls have officially broken above the critical white macro resistance line at 0.40601. Securing a weekly candle close above this level flips it into a strong support floor and opens the doors for further continuation.
Downside Safety Nets:
If profit-taking triggers a localized pullback, the closest horizontal support levels to watch rest at 0.35939 and 0.35304, followed by a deeper pivot at 0.33330.
This is one of the most powerful bullish engulfing candles on the weekly timeframe right now. Are you riding this momentum, or waiting for a retest of the breakout line? 👇
#SLXToken #TechnicalAnalysis #SOLSlides20%InAMonth #CryptoBreakout #WeeklyChart
{future}(SLXUSDT)
$SYN
{future}(SYNUSDT)
$LAB
{future}(LABUSDT)
🚀 $SLX GOD CANDLE! Absolute Monster Weekly Breakout! 📈
The weekly (1W) chart for SLXUSDT.P on Binance reveals an incredible V-shaped recovery, completely erasing a massive multi-week dump with a single explosive move.
📊 The Technical Breakdown:
The Massive Pump: SLX exploded from a weekly open of 0.20718 to its current price of 0.41346, locking in an insane +99.56% gain so far this week.
Major Resistance Flipped: The bulls have officially broken above the critical white macro resistance line at 0.40601. Securing a weekly candle close above this level flips it into a strong support floor and opens the doors for further continuation.
Downside Safety Nets:
If profit-taking triggers a localized pullback, the closest horizontal support levels to watch rest at 0.35939 and 0.35304, followed by a deeper pivot at 0.33330.
This is one of the most powerful bullish engulfing candles on the weekly timeframe right now. Are you riding this momentum, or waiting for a retest of the breakout line? 👇
#SLXToken #TechnicalAnalysis #SOLSlides20%InAMonth #CryptoBreakout #WeeklyChart
$SYN
$LAB
The weekly (1W) chart for SLXUSDT.P on Binance reveals an incredible V-shaped recovery, completely erasing a massive multi-week dump with a single explosive move.
📊 The Technical Breakdown:
The Massive Pump: SLX exploded from a weekly open of 0.20718 to its current price of 0.41346, locking in an insane +99.56% gain so far this week.
Major Resistance Flipped: The bulls have officially broken above the critical white macro resistance line at 0.40601. Securing a weekly candle close above this level flips it into a strong support floor and opens the doors for further continuation.
Downside Safety Nets:
If profit-taking triggers a localized pullback, the closest horizontal support levels to watch rest at 0.35939 and 0.35304, followed by a deeper pivot at 0.33330.
This is one of the most powerful bullish engulfing candles on the weekly timeframe right now. Are you riding this momentum, or waiting for a retest of the breakout line? 👇
#SLXToken #TechnicalAnalysis #SOLSlides20%InAMonth #CryptoBreakout #WeeklyChart
$SYN
$LAB
378

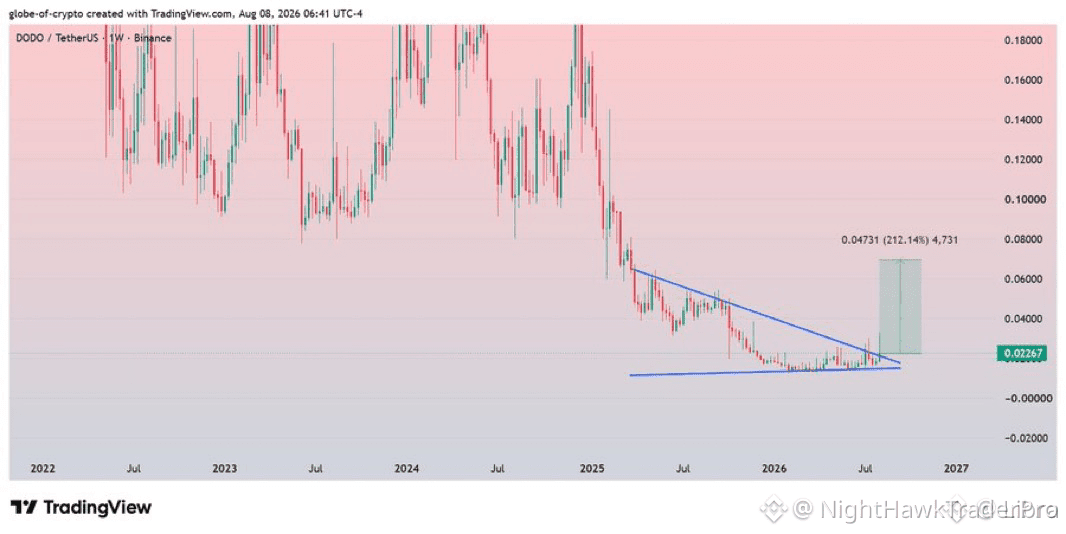
💥 $DODO BREAKS OUT OF DESCENDING TRIANGLE ON WEEKLY — 150-200% RECOVERY IN PLAY? 🐂
The weekly chart just lit up with a textbook descending triangle breakout after months of grinding lower. This pattern has a habit of sparking violent moves once the last seller steps aside, and $DODO is now leaning into that momentum. 📊
A successful breakout opens the door to a 150-200% recovery window in the weeks ahead. Volume confirmation and weekly closes above the trendline will be the tell. Watch for buyers to defend this zone like it's the last bid on the board. 🔍
💬 Is this the start of a genuine reversal, or will sellers drag it back inside the triangle for one last trap? 👇
⚠️ Not financial advice. Always manage your risk. 🛡️
🏷️ #DODO #TriangleBreakout #WeeklyChart #Crypto #Momentum
🐂 🌕
💥 $DODO BREAKS OUT OF DESCENDING TRIANGLE ON WEEKLY — 150-200% RECOVERY IN PLAY? 🐂
The weekly chart just lit up with a textbook descending triangle breakout after months of grinding lower. This pattern has a habit of sparking violent moves once the last seller steps aside, and $DODO is now leaning into that momentum. 📊
A successful breakout opens the door to a 150-200% recovery window in the weeks ahead. Volume confirmation and weekly closes above the trendline will be the tell. Watch for buyers to defend this zone like it's the last bid on the board. 🔍
💬 Is this the start of a genuine reversal, or will sellers drag it back inside the triangle for one last trap? 👇
⚠️ Not financial advice. Always manage your risk. 🛡️
🏷️ #DODO #TriangleBreakout #WeeklyChart #Crypto #Momentum
🐂 🌕
The weekly chart just lit up with a textbook descending triangle breakout after months of grinding lower. This pattern has a habit of sparking violent moves once the last seller steps aside, and $DODO is now leaning into that momentum. 📊
A successful breakout opens the door to a 150-200% recovery window in the weeks ahead. Volume confirmation and weekly closes above the trendline will be the tell. Watch for buyers to defend this zone like it's the last bid on the board. 🔍
💬 Is this the start of a genuine reversal, or will sellers drag it back inside the triangle for one last trap? 👇
⚠️ Not financial advice. Always manage your risk. 🛡️
🏷️ #DODO #TriangleBreakout #WeeklyChart #Crypto #Momentum
🐂 🌕
89

·
--
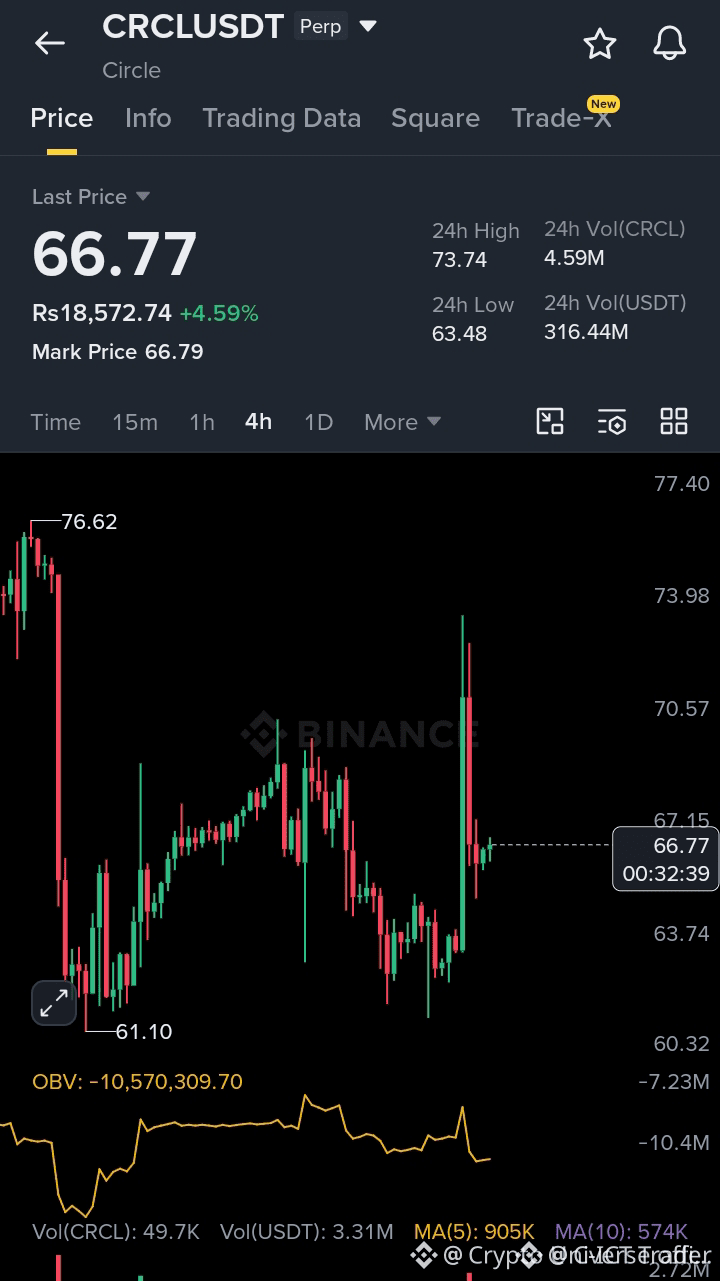
$CRCL HOLDING WEEKLY SUPPORT WITH BULLISH STRUCTURE INTACT 📊
Weekly structure remains bullish as $CRCL holds above a key support zone that has held for multiple months. Declining volume on pullbacks suggests selling pressure is fading — the same pattern that preceded the last upward leg. Until sellers reclaim this level, the path of least resistance is higher.
I'm not forcing a trade at support. Patience wins here — waiting for a deeper entry with better risk-to-reward is the disciplined move.
Do you think $CRCL will see one more rally before a deeper correction?
Not financial advice. Always manage your risk.
#CRCL #BullishSetup #Support #WeeklyChart #Crypto
🔥
$CRCL HOLDING WEEKLY SUPPORT WITH BULLISH STRUCTURE INTACT 📊
Weekly structure remains bullish as $CRCL holds above a key support zone that has held for multiple months. Declining volume on pullbacks suggests selling pressure is fading — the same pattern that preceded the last upward leg. Until sellers reclaim this level, the path of least resistance is higher.
I'm not forcing a trade at support. Patience wins here — waiting for a deeper entry with better risk-to-reward is the disciplined move.
Do you think $CRCL will see one more rally before a deeper correction?
Not financial advice. Always manage your risk.
#CRCL #BullishSetup #Support #WeeklyChart #Crypto
🔥
Weekly structure remains bullish as $CRCL holds above a key support zone that has held for multiple months. Declining volume on pullbacks suggests selling pressure is fading — the same pattern that preceded the last upward leg. Until sellers reclaim this level, the path of least resistance is higher.
I'm not forcing a trade at support. Patience wins here — waiting for a deeper entry with better risk-to-reward is the disciplined move.
Do you think $CRCL will see one more rally before a deeper correction?
Not financial advice. Always manage your risk.
#CRCL #BullishSetup #Support #WeeklyChart #Crypto
🔥
79

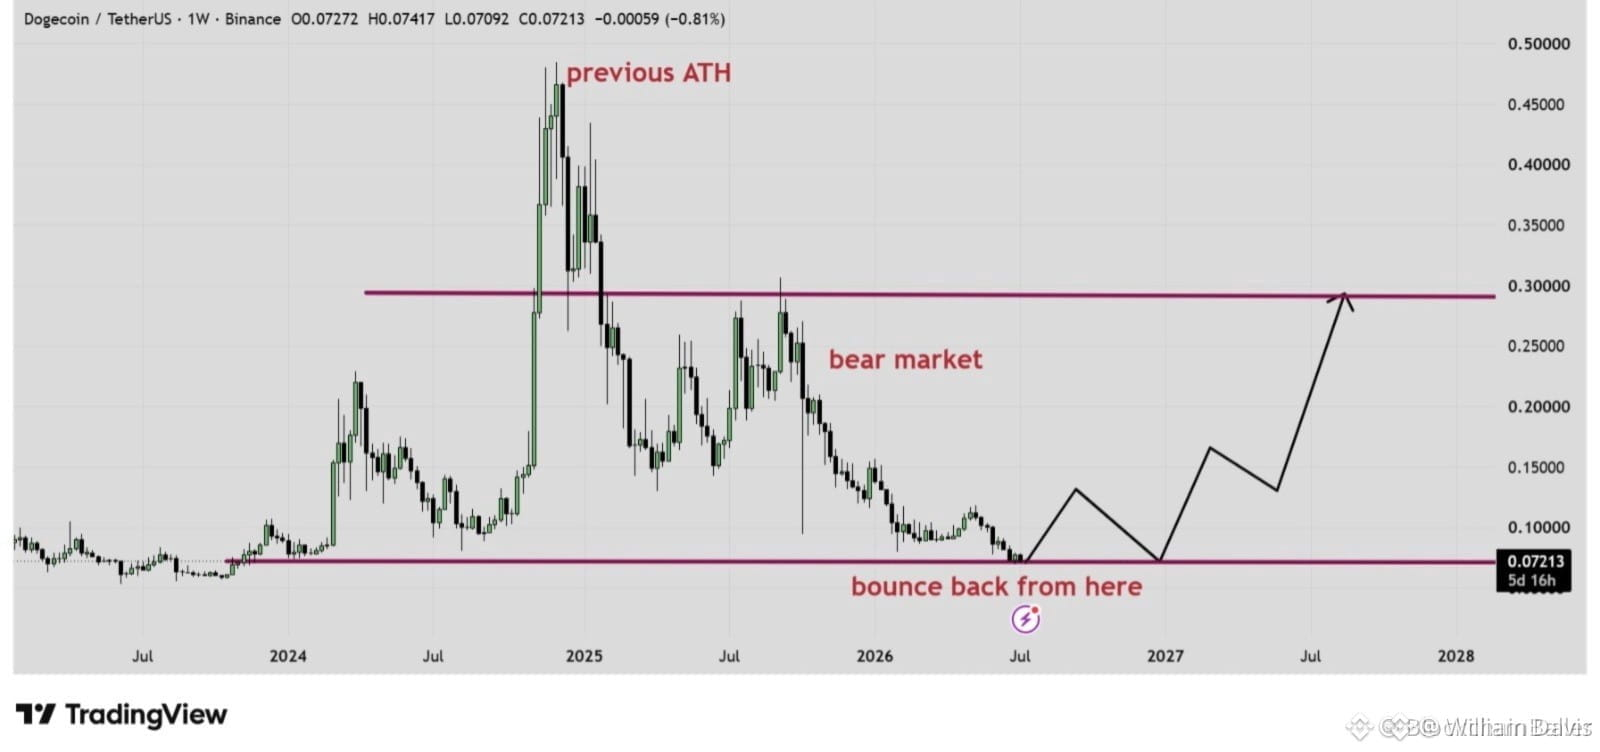
EVERYONE CALLING $DOGE DEAD BUT THIS WEEKLY CHART SAYS OTHERWISE 🔥
Entry: 0.07 🔥
Target: 0.30 🚀
This weekly structure shows $0.07 acting as a major accumulation zone — the same level that has held for months. If buyers step in from here, the path to $0.30 is a clean 4x move with minimal structural resistance. Momentum is flat on the daily, but that’s typical before a reversal from a deep value zone.
Are you buying this dip or waiting for a lower low to confirm?
Not financial advice. Always manage your risk.
#DOGE #Accumulation #SupportLevel #Crypto #WeeklyChart
🔥
EVERYONE CALLING $DOGE DEAD BUT THIS WEEKLY CHART SAYS OTHERWISE 🔥
Entry: 0.07 🔥
Target: 0.30 🚀
This weekly structure shows $0.07 acting as a major accumulation zone — the same level that has held for months. If buyers step in from here, the path to $0.30 is a clean 4x move with minimal structural resistance. Momentum is flat on the daily, but that’s typical before a reversal from a deep value zone.
Are you buying this dip or waiting for a lower low to confirm?
Not financial advice. Always manage your risk.
#DOGE #Accumulation #SupportLevel #Crypto #WeeklyChart
🔥
Entry: 0.07 🔥
Target: 0.30 🚀
This weekly structure shows $0.07 acting as a major accumulation zone — the same level that has held for months. If buyers step in from here, the path to $0.30 is a clean 4x move with minimal structural resistance. Momentum is flat on the daily, but that’s typical before a reversal from a deep value zone.
Are you buying this dip or waiting for a lower low to confirm?
Not financial advice. Always manage your risk.
#DOGE #Accumulation #SupportLevel #Crypto #WeeklyChart
🔥
38

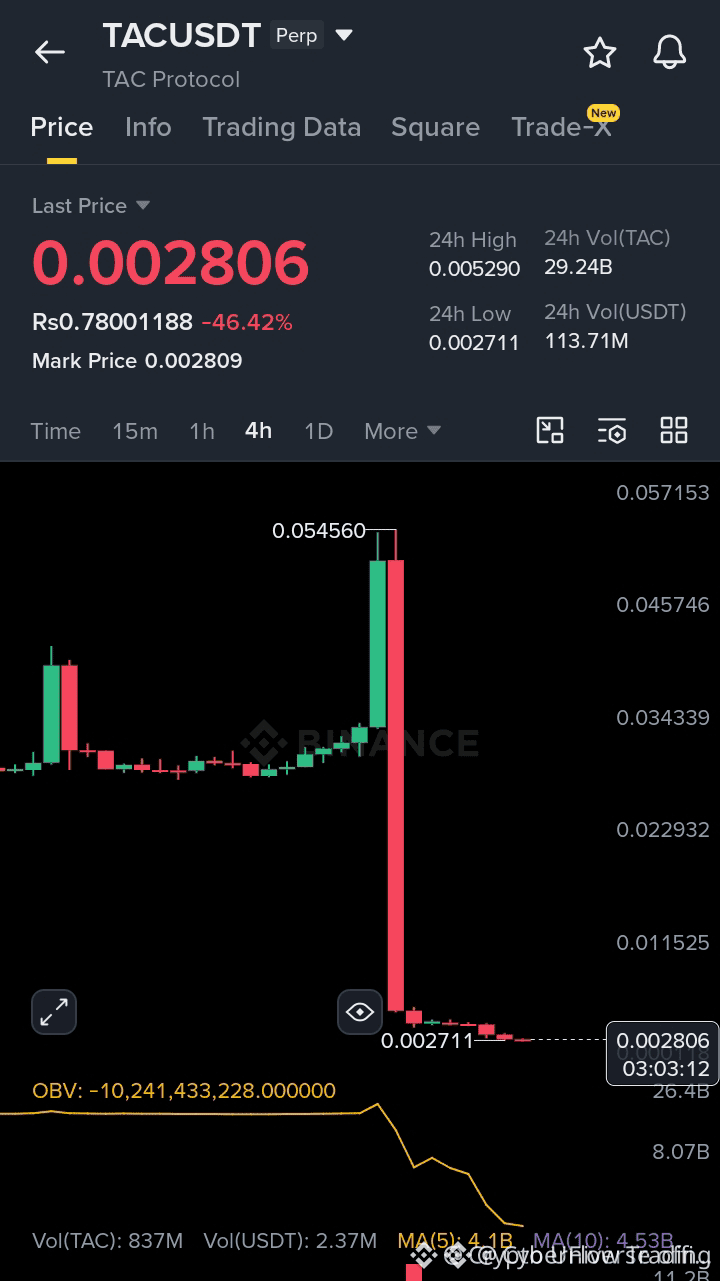
$TAC CAUTION: WAITING FOR THE RIGHT ENTRY BEFORE COMMITTING ⏳
This weekly chart on $TAC is clear — price is still pinned below a major resistance zone and the structure hasn' ;t flipped bullish yet. I' ;m not rushing into longs here because the risk-to-reward isn' ;t in my favor. Volume is thin and the RSI hasn' ;t confirmed a reversal.
I' ;d rather wait for a deeper sweep or a clean reclaim before adding size. Patience is the edge when the setup isn' ;t screaming yet. I' ;m also short $SOL and $ETH right now because the momentum favors the bears there.
Do you think $TAC needs one more deep dip before the rally, or is the move closer than most expect?
Not financial advice. Always manage your risk.
#TAC #Caution #WeeklyChart #Patience
🎯
$TAC CAUTION: WAITING FOR THE RIGHT ENTRY BEFORE COMMITTING ⏳
This weekly chart on $TAC is clear — price is still pinned below a major resistance zone and the structure hasn' ;t flipped bullish yet. I' ;m not rushing into longs here because the risk-to-reward isn' ;t in my favor. Volume is thin and the RSI hasn' ;t confirmed a reversal.
I' ;d rather wait for a deeper sweep or a clean reclaim before adding size. Patience is the edge when the setup isn' ;t screaming yet. I' ;m also short $SOL and $ETH right now because the momentum favors the bears there.
Do you think $TAC needs one more deep dip before the rally, or is the move closer than most expect?
Not financial advice. Always manage your risk.
#TAC #Caution #WeeklyChart #Patience
🎯
This weekly chart on $TAC is clear — price is still pinned below a major resistance zone and the structure hasn' ;t flipped bullish yet. I' ;m not rushing into longs here because the risk-to-reward isn' ;t in my favor. Volume is thin and the RSI hasn' ;t confirmed a reversal.
I' ;d rather wait for a deeper sweep or a clean reclaim before adding size. Patience is the edge when the setup isn' ;t screaming yet. I' ;m also short $SOL and $ETH right now because the momentum favors the bears there.
Do you think $TAC needs one more deep dip before the rally, or is the move closer than most expect?
Not financial advice. Always manage your risk.
#TAC #Caution #WeeklyChart #Patience
🎯
151

·
--
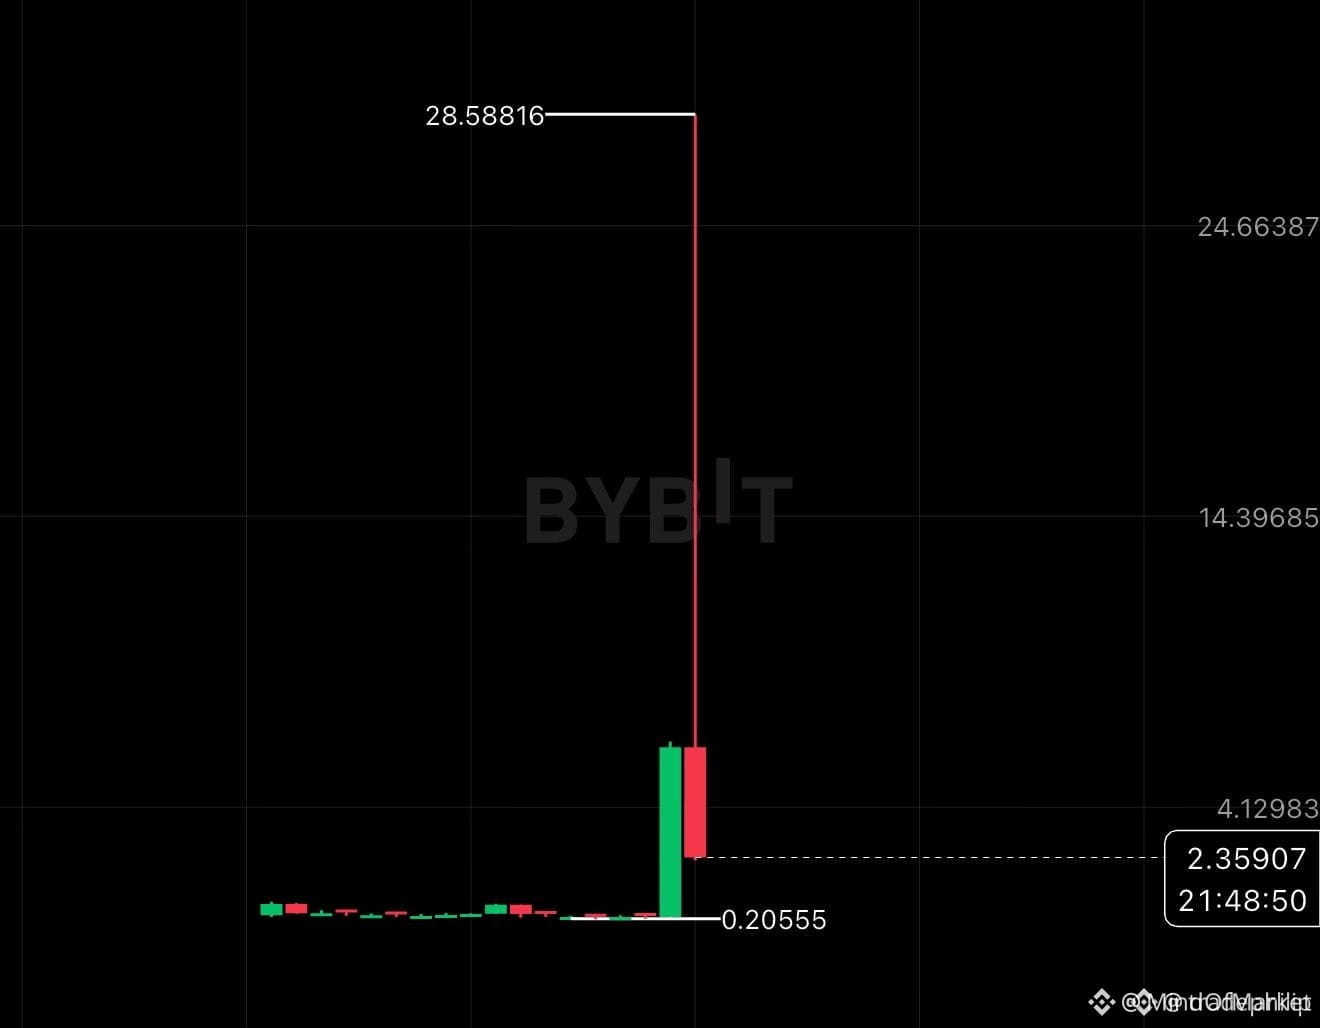
$RAVE is starting to matter on the weekly chart
On the weekly, $RAVE is the kind of setup where liquidity often shifts before the crowd notices. If price keeps holding into the next close, it usually means bigger hands are defending the move rather than letting it roll over. The real signal will be whether the market keeps absorbing supply cleanly or starts rejecting into the same zone again.
Not financial advice. Manage your risk and protect your capital.
#Crypto #Altcoins #Trading #WeeklyChart #MarketUpdate
✦
{alpha}(560x97693439ea2f0ecdeb9135881e49f354656a911c)
$RAVE is starting to matter on the weekly chart
On the weekly, $RAVE is the kind of setup where liquidity often shifts before the crowd notices. If price keeps holding into the next close, it usually means bigger hands are defending the move rather than letting it roll over. The real signal will be whether the market keeps absorbing supply cleanly or starts rejecting into the same zone again.
Not financial advice. Manage your risk and protect your capital.
#Crypto #Altcoins #Trading #WeeklyChart #MarketUpdate
✦
On the weekly, $RAVE is the kind of setup where liquidity often shifts before the crowd notices. If price keeps holding into the next close, it usually means bigger hands are defending the move rather than letting it roll over. The real signal will be whether the market keeps absorbing supply cleanly or starts rejecting into the same zone again.
Not financial advice. Manage your risk and protect your capital.
#Crypto #Altcoins #Trading #WeeklyChart #MarketUpdate
✦
1
381

·
--
Bearish
📊 DOGE COMPLETE ANALYSIS – WEEKLY + DAILY + 4H
🚨 DOGE WEEKLY CHART JUST CONFIRMED BEAR MARKET – HERE'S MY HONEST TRADE PLAN
I analyzed DOGE across ALL timeframes – weekly, daily, 4H, and order book. Here is the brutal truth.
🔥 THE WEEKLY CHART (MOST IMPORTANT)
MALevelDOGE vs MAMA(7)$0.10246BELOW ❌MA(25)$0.10321BELOW ❌MA(99)$0.18430BELOW ❌
DOGE is trading below ALL three weekly moving averages. The 99-week MA is at $0.1843 – that's 76% above current price.
This is not a dip. This is a STRUCTURAL BEAR MARKET.
📊 LOWER TIMEFRAMES (DAILY + 4H)
Time frame vs MA7 vs MA25 vs MA 99 Bias
Daily BELOW BELOW ABOVE Bearish
4-Hour ABOVE BELOW BELOW Bearish Order Book Support at $0.10465–0.10472Neutral
The hierarchy: Weekly wins. When weekly is bearish, all bounces are selling opportunities.
🎯 MY HONEST TRADE PLAN
Scenario Action
1. Why Long now at $0.1047❌ NO Bear market don't catch falling knives
2. Long at $0.0979⚠️ Scalp only Daily MA99 support – tight stop Long for investment❌ NO Weekly chart says BEAR MARKET
3. Short at $0.1079–0.1098✅ BEST SETUP Daily MA7/MA25 resistance
4. Short at $0.1150+✅ AGGRESSIVE Would be a gift
What I am doing: WAITING to short higher bear markets always give better entry prices.
📉 THE BOTTOM LINE
Timeframe Bias Confidence
Weekly EXTREME BEARISH -> HIGH
Next few weeks DOWN -> HIGH
The highest probability trade: Wait for a rally to 0.1079–0.1079–0.1098 and SHORT with stop at 0.1110, targeting 0.1110, targeting 0.1045 → 0.1025 → 0.1025 → 0.0980.
Right now at $0.1047? No trade. Watch. Wait for a better short entry.
👇 Are you waiting to short higher or betting on a reversal?
#DOGE #Dogecoin #WeeklyChart #bearmarket #TechnicalAnalysis $DOGE
📊 DOGE COMPLETE ANALYSIS – WEEKLY + DAILY + 4H
🚨 DOGE WEEKLY CHART JUST CONFIRMED BEAR MARKET – HERE'S MY HONEST TRADE PLAN
I analyzed DOGE across ALL timeframes – weekly, daily, 4H, and order book. Here is the brutal truth.
🔥 THE WEEKLY CHART (MOST IMPORTANT)
MALevelDOGE vs MAMA(7)$0.10246BELOW ❌MA(25)$0.10321BELOW ❌MA(99)$0.18430BELOW ❌
DOGE is trading below ALL three weekly moving averages. The 99-week MA is at $0.1843 – that's 76% above current price.
This is not a dip. This is a STRUCTURAL BEAR MARKET.
📊 LOWER TIMEFRAMES (DAILY + 4H)
Time frame vs MA7 vs MA25 vs MA 99 Bias
Daily BELOW BELOW ABOVE Bearish
4-Hour ABOVE BELOW BELOW Bearish Order Book Support at $0.10465–0.10472Neutral
The hierarchy: Weekly wins. When weekly is bearish, all bounces are selling opportunities.
🎯 MY HONEST TRADE PLAN
Scenario Action
1. Why Long now at $0.1047❌ NO Bear market don't catch falling knives
2. Long at $0.0979⚠️ Scalp only Daily MA99 support – tight stop Long for investment❌ NO Weekly chart says BEAR MARKET
3. Short at $0.1079–0.1098✅ BEST SETUP Daily MA7/MA25 resistance
4. Short at $0.1150+✅ AGGRESSIVE Would be a gift
What I am doing: WAITING to short higher bear markets always give better entry prices.
📉 THE BOTTOM LINE
Timeframe Bias Confidence
Weekly EXTREME BEARISH -> HIGH
Next few weeks DOWN -> HIGH
The highest probability trade: Wait for a rally to 0.1079–0.1079–0.1098 and SHORT with stop at 0.1110, targeting 0.1110, targeting 0.1045 → 0.1025 → 0.1025 → 0.0980.
Right now at $0.1047? No trade. Watch. Wait for a better short entry.
👇 Are you waiting to short higher or betting on a reversal?
#DOGE #Dogecoin #WeeklyChart #bearmarket #TechnicalAnalysis $DOGE
🚨 DOGE WEEKLY CHART JUST CONFIRMED BEAR MARKET – HERE'S MY HONEST TRADE PLAN
I analyzed DOGE across ALL timeframes – weekly, daily, 4H, and order book. Here is the brutal truth.
🔥 THE WEEKLY CHART (MOST IMPORTANT)
MALevelDOGE vs MAMA(7)$0.10246BELOW ❌MA(25)$0.10321BELOW ❌MA(99)$0.18430BELOW ❌
DOGE is trading below ALL three weekly moving averages. The 99-week MA is at $0.1843 – that's 76% above current price.
This is not a dip. This is a STRUCTURAL BEAR MARKET.
📊 LOWER TIMEFRAMES (DAILY + 4H)
Time frame vs MA7 vs MA25 vs MA 99 Bias
Daily BELOW BELOW ABOVE Bearish
4-Hour ABOVE BELOW BELOW Bearish Order Book Support at $0.10465–0.10472Neutral
The hierarchy: Weekly wins. When weekly is bearish, all bounces are selling opportunities.
🎯 MY HONEST TRADE PLAN
Scenario Action
1. Why Long now at $0.1047❌ NO Bear market don't catch falling knives
2. Long at $0.0979⚠️ Scalp only Daily MA99 support – tight stop Long for investment❌ NO Weekly chart says BEAR MARKET
3. Short at $0.1079–0.1098✅ BEST SETUP Daily MA7/MA25 resistance
4. Short at $0.1150+✅ AGGRESSIVE Would be a gift
What I am doing: WAITING to short higher bear markets always give better entry prices.
📉 THE BOTTOM LINE
Timeframe Bias Confidence
Weekly EXTREME BEARISH -> HIGH
Next few weeks DOWN -> HIGH
The highest probability trade: Wait for a rally to 0.1079–0.1079–0.1098 and SHORT with stop at 0.1110, targeting 0.1110, targeting 0.1045 → 0.1025 → 0.1025 → 0.0980.
Right now at $0.1047? No trade. Watch. Wait for a better short entry.
👇 Are you waiting to short higher or betting on a reversal?
#DOGE #Dogecoin #WeeklyChart #bearmarket #TechnicalAnalysis $DOGE
74
Log in to explore more content
Join global crypto users on Binance Square
⚡️ Get latest and useful information about crypto.
💬 Trusted by the world’s largest crypto exchange.
👍 Discover real insights from verified creators.
Email / Phone number
Trending Topics
1
#HotCPIDecemberHikePriced
340,516 views
3,300 Discussing
2
#ZcashFallsBelow$1000ForFirstTimeSinceSeptember
11,594 views
65 Discussing
3
#StrategyFaces$2.8BSelloffRiskFromMSCIRemoval
22,116 views
143 Discussing
4
#AnthropicRejectsIPODelayValuationinQuestion
369,319 views
3,235 Discussing
5
#BitcoinETFsLose$1.6BInNovember
9,617 views
49 Discussing
6
#AnthropicDisclosesOver$10BNewComputeDeals
1,958 views
31 Discussing
7
#CoreWeaveJumps10%On168%RevenueGrowth
24,524 views
476 Discussing
8
#CanNvidiaEarningsEaseMarketConcerns?
112,211 views
1,409 Discussing
9
#BarclaysRaisesBlackRockBitcoinETFStake48%
21,074 views
354 Discussing
10
#BitmineReports$6.3BFiscal2026Loss
7,796 views
24 Discussing