
#vrt
vrt
6,325 views
113 Discussing
Hot
Latest

·
--
$VRT 24 The price dropped 6.965% over the past 24 hours, and the funding rate has just reset to exactly zero. This combination is uncommon. The price moved one-sided down, but neither longs nor shorts paid—looks like the leveraged crowd collectively fell asleep.
An old dog checked the open interest: 3,280.73 contracts, roughly the same as yesterday. Trading volume was 724,800 units—not particularly high. On the semiconductor/AI chain, $VRT has only average liquidity. The open interest didn’t shrink along with the price drop. That could mean someone is locking positions at the bottom, or the market simply hasn’t reacted yet. The angle is M2_semi. For peers like MU, NVDA, and AMD, I don’t have data, so I can’t make blind comparisons. But from funding and OI, $VRT looks a bit isolated in its movement. A funding rate of 0 is a neutral signal: longs and shorts aren’t crowded. The steady open interest suggests leveraged positions haven’t blown up, and no one is adding. Usually that means spot selling pressure is driving things, while leveraged capital is just watching.
My take: $VRT is in a weak equilibrium right now—no clear direction. Funding rate is zero, so there’s no crowding risk, but there’s also no fuel for a rebound. I lack data on where we are in the semiconductor industry cycle, but on this equity-influenced chain (U.S. stocks side), $VRT ’s走势 depends more on internal liquidity. With open interest flat, price down 6.965%, and volume not spiking—if this persists, arb capital will gradually withdraw and rotate into other, more volatile instruments.
The strongest counterpoint is: the price has already fallen by nearly 7%, so perhaps an oversold rebound is imminent. But the funding rate isn’t giving direction. Without leverage pushing, the rebound lacks momentum, and the strength of spot buy orders is questionable. Second-order effects: if $VRT keeps ranging, long-position holders have to bear time costs, but right now there’s no funding expense; shorts didn’t build positions, so the probability of a near-term squeeze is low. If the market ignores this neutral signal and assumes that “funding rate is zero” automatically means safety, they might miss the subsequent change in direction.
Invalidation conditions are clear: if the funding rate deviates from zero—say +0.01% or -0.01%—my neutral view must be withdrawn. If open interest suddenly doubles or halves, liquidity conditions need to be reassessed. On price: 230 is the key support; a break below could accelerate the selloff. 245 is resistance; if price breaks above it, the trend would strengthen. These levels come from current price projections—once broken, they no longer hold.
Action: don’t touch it. Funding rate is zero, OI is stable, and the price is drifting lower. All three signals are neutral—there’s no reason to take a position.
Trading tag: #BinanceFutures #TradFi #USDⓈM #VRT #VRTUSDT $VRT
$VRT 24 The price dropped 6.965% over the past 24 hours, and the funding rate has just reset to exactly zero. This combination is uncommon. The price moved one-sided down, but neither longs nor shorts paid—looks like the leveraged crowd collectively fell asleep.
An old dog checked the open interest: 3,280.73 contracts, roughly the same as yesterday. Trading volume was 724,800 units—not particularly high. On the semiconductor/AI chain, $VRT has only average liquidity. The open interest didn’t shrink along with the price drop. That could mean someone is locking positions at the bottom, or the market simply hasn’t reacted yet. The angle is M2_semi. For peers like MU, NVDA, and AMD, I don’t have data, so I can’t make blind comparisons. But from funding and OI, $VRT looks a bit isolated in its movement. A funding rate of 0 is a neutral signal: longs and shorts aren’t crowded. The steady open interest suggests leveraged positions haven’t blown up, and no one is adding. Usually that means spot selling pressure is driving things, while leveraged capital is just watching.
My take: $VRT is in a weak equilibrium right now—no clear direction. Funding rate is zero, so there’s no crowding risk, but there’s also no fuel for a rebound. I lack data on where we are in the semiconductor industry cycle, but on this equity-influenced chain (U.S. stocks side), $VRT ’s走势 depends more on internal liquidity. With open interest flat, price down 6.965%, and volume not spiking—if this persists, arb capital will gradually withdraw and rotate into other, more volatile instruments.
The strongest counterpoint is: the price has already fallen by nearly 7%, so perhaps an oversold rebound is imminent. But the funding rate isn’t giving direction. Without leverage pushing, the rebound lacks momentum, and the strength of spot buy orders is questionable. Second-order effects: if $VRT keeps ranging, long-position holders have to bear time costs, but right now there’s no funding expense; shorts didn’t build positions, so the probability of a near-term squeeze is low. If the market ignores this neutral signal and assumes that “funding rate is zero” automatically means safety, they might miss the subsequent change in direction.
Invalidation conditions are clear: if the funding rate deviates from zero—say +0.01% or -0.01%—my neutral view must be withdrawn. If open interest suddenly doubles or halves, liquidity conditions need to be reassessed. On price: 230 is the key support; a break below could accelerate the selloff. 245 is resistance; if price breaks above it, the trend would strengthen. These levels come from current price projections—once broken, they no longer hold.
Action: don’t touch it. Funding rate is zero, OI is stable, and the price is drifting lower. All three signals are neutral—there’s no reason to take a position.
Trading tag: #BinanceFutures #TradFi #USDⓈM #VRT #VRTUSDT $VRT
An old dog checked the open interest: 3,280.73 contracts, roughly the same as yesterday. Trading volume was 724,800 units—not particularly high. On the semiconductor/AI chain, $VRT has only average liquidity. The open interest didn’t shrink along with the price drop. That could mean someone is locking positions at the bottom, or the market simply hasn’t reacted yet. The angle is M2_semi. For peers like MU, NVDA, and AMD, I don’t have data, so I can’t make blind comparisons. But from funding and OI, $VRT looks a bit isolated in its movement. A funding rate of 0 is a neutral signal: longs and shorts aren’t crowded. The steady open interest suggests leveraged positions haven’t blown up, and no one is adding. Usually that means spot selling pressure is driving things, while leveraged capital is just watching.
My take: $VRT is in a weak equilibrium right now—no clear direction. Funding rate is zero, so there’s no crowding risk, but there’s also no fuel for a rebound. I lack data on where we are in the semiconductor industry cycle, but on this equity-influenced chain (U.S. stocks side), $VRT ’s走势 depends more on internal liquidity. With open interest flat, price down 6.965%, and volume not spiking—if this persists, arb capital will gradually withdraw and rotate into other, more volatile instruments.
The strongest counterpoint is: the price has already fallen by nearly 7%, so perhaps an oversold rebound is imminent. But the funding rate isn’t giving direction. Without leverage pushing, the rebound lacks momentum, and the strength of spot buy orders is questionable. Second-order effects: if $VRT keeps ranging, long-position holders have to bear time costs, but right now there’s no funding expense; shorts didn’t build positions, so the probability of a near-term squeeze is low. If the market ignores this neutral signal and assumes that “funding rate is zero” automatically means safety, they might miss the subsequent change in direction.
Invalidation conditions are clear: if the funding rate deviates from zero—say +0.01% or -0.01%—my neutral view must be withdrawn. If open interest suddenly doubles or halves, liquidity conditions need to be reassessed. On price: 230 is the key support; a break below could accelerate the selloff. 245 is resistance; if price breaks above it, the trend would strengthen. These levels come from current price projections—once broken, they no longer hold.
Action: don’t touch it. Funding rate is zero, OI is stable, and the price is drifting lower. All three signals are neutral—there’s no reason to take a position.
Trading tag: #BinanceFutures #TradFi #USDⓈM #VRT #VRTUSDT $VRT
40

·
--
$VRT dropped 3.764% over the past 24 hours; current price: 246.45. On its own, a drawdown of this magnitude isn’t that shocking in the futures market, but when you factor in the funding rate of 0.00096605, the picture changes. Prices are falling, yet the funding rate is still positive—which means longs are watching their unrealized losses widen while they continue paying fees to shorts. This is a typical structure where longs get trapped and then try to add more to dilute their costs—or simply put, positions are being held through sheer stubbornness.
Core judgment: $VRT is currently in a dangerous phase where downward price action coexists with a positive funding rate. Longs’ position costs are being accumulated continuously, and there’s no direct catalyst for a reversal.
The evidence chain comes from two dimensions. In terms of price: a 24-hour drop of 3.764%, with the trend pointing downward. In terms of funding: fundingRate > 0, meaning longs pay shorts. Put together, this means longs are paying while prices decline—amplifying the negative return of the positions via funding. The position size at 3207.91 doesn’t provide more directional info here, but it confirms there are still chips in play inside the market. This is a dual-signal judgment based on both price and funding rate.
The strongest counterargument: If macro political and military tensions (e.g., an escalation of regional conflicts) trigger wild volatility in traditional financial markets, funding may seek short-term safe haven or hedging. As an on-chain U.S. stock futures contract underlying, the trading volume and attention for $VRT could be passively boosted, attracting speculative buys and turning the decline. This kind of external shock can’t be predicted from the current data.
The second-order effect is very direct: if the price continues to drift lower and the funding rate remains positive, longs are bleeding every minute. The longer they hold, the stronger their willingness to close positions becomes. Once a certain level sees clustered stop-losses or liquidations, the price could accelerate downward. The cost is borne by the hard-pressed longs, while liquidity providers (shorts), while collecting funding fees, may be waiting for a liquidity grab.
When would my judgment fail? If $VRT’s price quickly rallies back above 250 and the funding rate also rapidly flips negative (meaning shorts start paying), then the “shorts overcrowded and squeezed” scenario could play out, and the current short-side logic would no longer hold. The 250 level is a vague observation zone derived from the current 246.45, not an exact calculated value.
So the action is very clear: it’s not time to chase longs now—wait or step back. I will put $VRT on my watchlist and wait for the price to stabilize and for the funding-rate structure to show a reversal signal.
Trading tag: #TradFi #链上美股 #VRT
Where do you think this set of judgments is most likely to be wrong?
$VRT dropped 3.764% over the past 24 hours; current price: 246.45. On its own, a drawdown of this magnitude isn’t that shocking in the futures market, but when you factor in the funding rate of 0.00096605, the picture changes. Prices are falling, yet the funding rate is still positive—which means longs are watching their unrealized losses widen while they continue paying fees to shorts. This is a typical structure where longs get trapped and then try to add more to dilute their costs—or simply put, positions are being held through sheer stubbornness.
Core judgment: $VRT is currently in a dangerous phase where downward price action coexists with a positive funding rate. Longs’ position costs are being accumulated continuously, and there’s no direct catalyst for a reversal.
The evidence chain comes from two dimensions. In terms of price: a 24-hour drop of 3.764%, with the trend pointing downward. In terms of funding: fundingRate > 0, meaning longs pay shorts. Put together, this means longs are paying while prices decline—amplifying the negative return of the positions via funding. The position size at 3207.91 doesn’t provide more directional info here, but it confirms there are still chips in play inside the market. This is a dual-signal judgment based on both price and funding rate.
The strongest counterargument: If macro political and military tensions (e.g., an escalation of regional conflicts) trigger wild volatility in traditional financial markets, funding may seek short-term safe haven or hedging. As an on-chain U.S. stock futures contract underlying, the trading volume and attention for $VRT could be passively boosted, attracting speculative buys and turning the decline. This kind of external shock can’t be predicted from the current data.
The second-order effect is very direct: if the price continues to drift lower and the funding rate remains positive, longs are bleeding every minute. The longer they hold, the stronger their willingness to close positions becomes. Once a certain level sees clustered stop-losses or liquidations, the price could accelerate downward. The cost is borne by the hard-pressed longs, while liquidity providers (shorts), while collecting funding fees, may be waiting for a liquidity grab.
When would my judgment fail? If $VRT ’s price quickly rallies back above 250 and the funding rate also rapidly flips negative (meaning shorts start paying), then the “shorts overcrowded and squeezed” scenario could play out, and the current short-side logic would no longer hold. The 250 level is a vague observation zone derived from the current 246.45, not an exact calculated value.
So the action is very clear: it’s not time to chase longs now—wait or step back. I will put $VRT on my watchlist and wait for the price to stabilize and for the funding-rate structure to show a reversal signal.
Trading tag: #TradFi #链上美股 #VRT
Where do you think this set of judgments is most likely to be wrong?
Core judgment: $VRT is currently in a dangerous phase where downward price action coexists with a positive funding rate. Longs’ position costs are being accumulated continuously, and there’s no direct catalyst for a reversal.
The evidence chain comes from two dimensions. In terms of price: a 24-hour drop of 3.764%, with the trend pointing downward. In terms of funding: fundingRate > 0, meaning longs pay shorts. Put together, this means longs are paying while prices decline—amplifying the negative return of the positions via funding. The position size at 3207.91 doesn’t provide more directional info here, but it confirms there are still chips in play inside the market. This is a dual-signal judgment based on both price and funding rate.
The strongest counterargument: If macro political and military tensions (e.g., an escalation of regional conflicts) trigger wild volatility in traditional financial markets, funding may seek short-term safe haven or hedging. As an on-chain U.S. stock futures contract underlying, the trading volume and attention for $VRT could be passively boosted, attracting speculative buys and turning the decline. This kind of external shock can’t be predicted from the current data.
The second-order effect is very direct: if the price continues to drift lower and the funding rate remains positive, longs are bleeding every minute. The longer they hold, the stronger their willingness to close positions becomes. Once a certain level sees clustered stop-losses or liquidations, the price could accelerate downward. The cost is borne by the hard-pressed longs, while liquidity providers (shorts), while collecting funding fees, may be waiting for a liquidity grab.
When would my judgment fail? If $VRT ’s price quickly rallies back above 250 and the funding rate also rapidly flips negative (meaning shorts start paying), then the “shorts overcrowded and squeezed” scenario could play out, and the current short-side logic would no longer hold. The 250 level is a vague observation zone derived from the current 246.45, not an exact calculated value.
So the action is very clear: it’s not time to chase longs now—wait or step back. I will put $VRT on my watchlist and wait for the price to stabilize and for the funding-rate structure to show a reversal signal.
Trading tag: #TradFi #链上美股 #VRT
Where do you think this set of judgments is most likely to be wrong?
36

·
--
📈 Trend Continuation Setup: $VRT Buyers Stepping In
📊 Market Context & Thesis:
The 4-hour market structure remains firmly bullish above the 200 EMA. Following a healthy retracement into the 50 EMA on the 1-hour chart, buyers printed a strong rejection candle with increasing volume, confirming defense of support.
• Funding: 0.0004% (Neutral) • Next: 7h 49m
• 24h Volume: $1.40M
• 24h Range: 246.83 — 259.25 (+2.9%)
🎯 Entry: 258.3300
🛑 Stop-Loss: 254.2532 (-1.58%)
✅ Take-Profit: 266.4836 (+3.16%)
⚖️ Risk/Reward: 1:2.0
🚫 Invalidation Rule: If a 1-hour candle closes below $254.2532 (-1.58%), this bullish thesis is invalidated. Exit trade without holding into drawdowns.
⚖️ Risk Note: Moderate leverage recommended (3x–5x on Futures). Never risk more than 1–2% of total portfolio capital on a single setup.
💬 What is your personal invalidation level on $VRT? Let's hear your plan 👇
#VRT #CryptoSignals #TechnicalAnalysis #BinanceSquare
⚠️ Not financial advice. Always manage your risk.
📈 Trend Continuation Setup: $VRT Buyers Stepping In
📊 Market Context & Thesis:
The 4-hour market structure remains firmly bullish above the 200 EMA. Following a healthy retracement into the 50 EMA on the 1-hour chart, buyers printed a strong rejection candle with increasing volume, confirming defense of support.
• Funding: 0.0004% (Neutral) • Next: 7h 49m
• 24h Volume: $1.40M
• 24h Range: 246.83 — 259.25 (+2.9%)
🎯 Entry: 258.3300
🛑 Stop-Loss: 254.2532 (-1.58%)
✅ Take-Profit: 266.4836 (+3.16%)
⚖️ Risk/Reward: 1:2.0
🚫 Invalidation Rule: If a 1-hour candle closes below $254.2532 (-1.58%), this bullish thesis is invalidated. Exit trade without holding into drawdowns.
⚖️ Risk Note: Moderate leverage recommended (3x–5x on Futures). Never risk more than 1–2% of total portfolio capital on a single setup.
💬 What is your personal invalidation level on $VRT ? Let's hear your plan 👇
#VRT #CryptoSignals #TechnicalAnalysis #BinanceSquare
⚠️ Not financial advice. Always manage your risk.
📊 Market Context & Thesis:
The 4-hour market structure remains firmly bullish above the 200 EMA. Following a healthy retracement into the 50 EMA on the 1-hour chart, buyers printed a strong rejection candle with increasing volume, confirming defense of support.
• Funding: 0.0004% (Neutral) • Next: 7h 49m
• 24h Volume: $1.40M
• 24h Range: 246.83 — 259.25 (+2.9%)
🎯 Entry: 258.3300
🛑 Stop-Loss: 254.2532 (-1.58%)
✅ Take-Profit: 266.4836 (+3.16%)
⚖️ Risk/Reward: 1:2.0
🚫 Invalidation Rule: If a 1-hour candle closes below $254.2532 (-1.58%), this bullish thesis is invalidated. Exit trade without holding into drawdowns.
⚖️ Risk Note: Moderate leverage recommended (3x–5x on Futures). Never risk more than 1–2% of total portfolio capital on a single setup.
💬 What is your personal invalidation level on $VRT ? Let's hear your plan 👇
#VRT #CryptoSignals #TechnicalAnalysis #BinanceSquare
⚠️ Not financial advice. Always manage your risk.
25

It dropped 4.76% in 24 hours. $VRT is now at 249.67. The funding rate is still stuck at a high level of 0.00096882, and the open interest is only a little over 3340. This structure clearly shows longs are hard-absorbing.
While the price is falling, the funding rate is still positive—what does that mean? The crowd that chased longs earlier is still paying money to shorts. They’re holding positions through the pressure; the longer they hold, the higher the cost becomes. Open interest hasn’t risen, and the price hasn’t stabilized. There’s no fresh capital stepping in to take the position—this is a classic “longs trapped” setup. Off-exchange funds simply don’t want to reach into this level.
My view is that next $VRT will continue to grind lower, until that batch of longs who are holding through the pressure gets liquidated or cuts losses. They’ll become the biggest source of sell pressure. A high funding rate at the current level will keep wearing down their margin. If the price probes a bit further down, a chain liquidation can easily happen. The strongest counter-argument would be a sudden positive catalyst that pulls the price back above 250, or a sudden rebound in the overall market risk appetite. But given the current open-interest structure and funding rate, the probability of such an exogenous good news showing up is low.
So my action is very clear: I’m going short.
Direction: Short
Leverage: 5x
Stop loss: 255.5
Take profit: 238
Position size: 15% of total position
If price strongly breaks above 255.5, it would suggest longs may have new reinforcements. In that case, I’ll admit I’m wrong and exit at the stop loss. If price drops to around 238, I’ll first close half the position, and move the stop loss on the remaining position up to the break-even level, to see if I can catch a longer downside leg.
Others see a drop of more than 4 points and think it’s oversold and due for a rebound. I think they’re ignoring the detail that the funding rate is still positive. With open interest this low, it means there’s basically no consensus—any rebound is just a bull-trap.
Trading tag: #TradFi #链上美股 #VRT
Where do you think this thesis is most likely to be wrong?
It dropped 4.76% in 24 hours. $VRT is now at 249.67. The funding rate is still stuck at a high level of 0.00096882, and the open interest is only a little over 3340. This structure clearly shows longs are hard-absorbing.
While the price is falling, the funding rate is still positive—what does that mean? The crowd that chased longs earlier is still paying money to shorts. They’re holding positions through the pressure; the longer they hold, the higher the cost becomes. Open interest hasn’t risen, and the price hasn’t stabilized. There’s no fresh capital stepping in to take the position—this is a classic “longs trapped” setup. Off-exchange funds simply don’t want to reach into this level.
My view is that next $VRT will continue to grind lower, until that batch of longs who are holding through the pressure gets liquidated or cuts losses. They’ll become the biggest source of sell pressure. A high funding rate at the current level will keep wearing down their margin. If the price probes a bit further down, a chain liquidation can easily happen. The strongest counter-argument would be a sudden positive catalyst that pulls the price back above 250, or a sudden rebound in the overall market risk appetite. But given the current open-interest structure and funding rate, the probability of such an exogenous good news showing up is low.
So my action is very clear: I’m going short.
Direction: Short
Leverage: 5x
Stop loss: 255.5
Take profit: 238
Position size: 15% of total position
If price strongly breaks above 255.5, it would suggest longs may have new reinforcements. In that case, I’ll admit I’m wrong and exit at the stop loss. If price drops to around 238, I’ll first close half the position, and move the stop loss on the remaining position up to the break-even level, to see if I can catch a longer downside leg.
Others see a drop of more than 4 points and think it’s oversold and due for a rebound. I think they’re ignoring the detail that the funding rate is still positive. With open interest this low, it means there’s basically no consensus—any rebound is just a bull-trap.
Trading tag: #TradFi #链上美股 #VRT
Where do you think this thesis is most likely to be wrong?
While the price is falling, the funding rate is still positive—what does that mean? The crowd that chased longs earlier is still paying money to shorts. They’re holding positions through the pressure; the longer they hold, the higher the cost becomes. Open interest hasn’t risen, and the price hasn’t stabilized. There’s no fresh capital stepping in to take the position—this is a classic “longs trapped” setup. Off-exchange funds simply don’t want to reach into this level.
My view is that next $VRT will continue to grind lower, until that batch of longs who are holding through the pressure gets liquidated or cuts losses. They’ll become the biggest source of sell pressure. A high funding rate at the current level will keep wearing down their margin. If the price probes a bit further down, a chain liquidation can easily happen. The strongest counter-argument would be a sudden positive catalyst that pulls the price back above 250, or a sudden rebound in the overall market risk appetite. But given the current open-interest structure and funding rate, the probability of such an exogenous good news showing up is low.
So my action is very clear: I’m going short.
Direction: Short
Leverage: 5x
Stop loss: 255.5
Take profit: 238
Position size: 15% of total position
If price strongly breaks above 255.5, it would suggest longs may have new reinforcements. In that case, I’ll admit I’m wrong and exit at the stop loss. If price drops to around 238, I’ll first close half the position, and move the stop loss on the remaining position up to the break-even level, to see if I can catch a longer downside leg.
Others see a drop of more than 4 points and think it’s oversold and due for a rebound. I think they’re ignoring the detail that the funding rate is still positive. With open interest this low, it means there’s basically no consensus—any rebound is just a bull-trap.
Trading tag: #TradFi #链上美股 #VRT
Where do you think this thesis is most likely to be wrong?
22
$VRT fell 4.761% over the past 24 hours, with the price at 249.67 and the funding rate at 0.00096882. Judging from this data alone, my conclusion is straightforward: short-term bearish, ready to short. This call is based on a signal chain: price is falling but funding remains positive, a classic structure where longs are trapped and adding to positions, and liquidation pressure will only grow from here.
Why do I say that? The price dropped 4.761% while funding is still positive, which means longs are still paying shorts, yet the price failed to hold up. The last time this combination appeared in similar small-cap contracts, longs were unable to withstand the pressure and closed out, triggering a sharp selloff. Right now, $VRT has open interest of 3340.68 and volume of around 1.7 million. If the unit is contract count, liquidity is not that deep, so once longs unwind in a cluster, the price can easily plunge. Funding at 0.00096882 annualizes to a fairly high rate, meaning longs are bleeding every day; if the price does not rise, it becomes a slow death.
What is the strongest counterargument? If there is suddenly a political event or Trump posts a tweet that benefits small-cap stocks, or if overall market risk appetite rebounds, $VRT could rebound instantly and funding could fall quickly. But there is no such signal right now, so I can only act on the current data. The second-order effect is: if the price keeps falling, long liquidations will become a source of sell pressure. Shorts are collecting funding, but they also need to watch for a reversal, because a high funding rate can itself attract arbitrage capital.
My plan is clear: short $VRT with 5x leverage, set stop loss at 255, take profit at 240, and allocate 30% of total capital. The stop at 255 is just above a recent minor resistance level, and the take-profit at 240 is based on another roughly 4% drop from the current price. The invalidation condition is simple: if the price gets back above 255, or if funding suddenly turns negative, I will close the position immediately and exit, because that would mean the balance of power between longs and shorts has reversed.
Aggressive traders can short now, conservative traders can wait for a break below 248 before entering, and risk-averse traders should stay out of this one and wait until funding returns to around zero. The whole market is betting on a small-cap rebound, but from $VRT’s structure, the longs are hanging on by force and will eventually have to admit defeat.
Trading tag: #TradFi #链上美股 #VRT
Where do you think this whole judgment is most likely to be wrong?
$VRT fell 4.761% over the past 24 hours, with the price at 249.67 and the funding rate at 0.00096882. Judging from this data alone, my conclusion is straightforward: short-term bearish, ready to short. This call is based on a signal chain: price is falling but funding remains positive, a classic structure where longs are trapped and adding to positions, and liquidation pressure will only grow from here.
Why do I say that? The price dropped 4.761% while funding is still positive, which means longs are still paying shorts, yet the price failed to hold up. The last time this combination appeared in similar small-cap contracts, longs were unable to withstand the pressure and closed out, triggering a sharp selloff. Right now, $VRT has open interest of 3340.68 and volume of around 1.7 million. If the unit is contract count, liquidity is not that deep, so once longs unwind in a cluster, the price can easily plunge. Funding at 0.00096882 annualizes to a fairly high rate, meaning longs are bleeding every day; if the price does not rise, it becomes a slow death.
What is the strongest counterargument? If there is suddenly a political event or Trump posts a tweet that benefits small-cap stocks, or if overall market risk appetite rebounds, $VRT could rebound instantly and funding could fall quickly. But there is no such signal right now, so I can only act on the current data. The second-order effect is: if the price keeps falling, long liquidations will become a source of sell pressure. Shorts are collecting funding, but they also need to watch for a reversal, because a high funding rate can itself attract arbitrage capital.
My plan is clear: short $VRT with 5x leverage, set stop loss at 255, take profit at 240, and allocate 30% of total capital. The stop at 255 is just above a recent minor resistance level, and the take-profit at 240 is based on another roughly 4% drop from the current price. The invalidation condition is simple: if the price gets back above 255, or if funding suddenly turns negative, I will close the position immediately and exit, because that would mean the balance of power between longs and shorts has reversed.
Aggressive traders can short now, conservative traders can wait for a break below 248 before entering, and risk-averse traders should stay out of this one and wait until funding returns to around zero. The whole market is betting on a small-cap rebound, but from $VRT ’s structure, the longs are hanging on by force and will eventually have to admit defeat.
Trading tag: #TradFi #链上美股 #VRT
Where do you think this whole judgment is most likely to be wrong?
Why do I say that? The price dropped 4.761% while funding is still positive, which means longs are still paying shorts, yet the price failed to hold up. The last time this combination appeared in similar small-cap contracts, longs were unable to withstand the pressure and closed out, triggering a sharp selloff. Right now, $VRT has open interest of 3340.68 and volume of around 1.7 million. If the unit is contract count, liquidity is not that deep, so once longs unwind in a cluster, the price can easily plunge. Funding at 0.00096882 annualizes to a fairly high rate, meaning longs are bleeding every day; if the price does not rise, it becomes a slow death.
What is the strongest counterargument? If there is suddenly a political event or Trump posts a tweet that benefits small-cap stocks, or if overall market risk appetite rebounds, $VRT could rebound instantly and funding could fall quickly. But there is no such signal right now, so I can only act on the current data. The second-order effect is: if the price keeps falling, long liquidations will become a source of sell pressure. Shorts are collecting funding, but they also need to watch for a reversal, because a high funding rate can itself attract arbitrage capital.
My plan is clear: short $VRT with 5x leverage, set stop loss at 255, take profit at 240, and allocate 30% of total capital. The stop at 255 is just above a recent minor resistance level, and the take-profit at 240 is based on another roughly 4% drop from the current price. The invalidation condition is simple: if the price gets back above 255, or if funding suddenly turns negative, I will close the position immediately and exit, because that would mean the balance of power between longs and shorts has reversed.
Aggressive traders can short now, conservative traders can wait for a break below 248 before entering, and risk-averse traders should stay out of this one and wait until funding returns to around zero. The whole market is betting on a small-cap rebound, but from $VRT ’s structure, the longs are hanging on by force and will eventually have to admit defeat.
Trading tag: #TradFi #链上美股 #VRT
Where do you think this whole judgment is most likely to be wrong?
36
·
--
[M1_mag7]
$VRT Single-day drop of nearly 10%, down 9.825% over the past 24 hours; the current price is stuck around 259.09. Old dog glanced at its perpetual contract data: the funding rate is dead flat at zero, and the open interest is only 2671.95. This position size is so small it’s nowhere near even the fractional part of the trading value. With such thin liquidity, the price can get “out of whack” after just a few large orders.
The angle is M1_mag7—basically, it’s about how it moves in relation to the U.S. stock market index. But on-chain, this contract market simply can’t compare with the kind of institutional capital flow you see in SPY or QQQ. A funding rate of zero is the first signal: there’s neither long-side premium nor short-side discount, and the market is in a sort of stand-by vacuum. The second signal is that the OI number is extremely low, meaning there isn’t much capital at all actively trading the contract. If a target can’t even attract interest in the futures market, then you can’t really talk about “sector beta” or any liquidity premium. Its drop looks more like exposure of the contract market’s own structural fragility, not a deep adjustment following the broader market.
My take: this is a passive decline under a liquidity vacuum, not the start of a trend. The biggest problem is: nobody’s playing. Until funding fees turn positive and remain stable, this contract market lacks upward fuel. Zero fees mean positions have no cost; anyone can easily come in to dump or pump. But the OI shows that basically nobody is doing it. The so-called “correlation with the overall market” is a false premise right now, because the pool of on-chain contracts is too shallow. Even a little selling pressure could punch through it. If the U.S. stock market were to rebound strongly at this moment, the contract market for $VRT likely wouldn’t be able to supply enough synchronized liquidity and position depth to move up in tandem.
Where could this assessment be most likely wrong? It would be if a sudden surge of capital rushes in, driving up both OI and funding at the same time. If, in subsequent data, open interest doubles while the funding rate turns clearly positive, that would prove new longs are actively building positions and accumulating, and my “liquidity vacuum” judgment would be invalid. Before that, old dog’s move is to stay on the sidelines. With such a shallow pool and zero-fee pricing, I’d rather wait for a right-side signal—i.e., when both OI and price can hold steady above the current level—before taking action. Reaching in now to catch it is likely to get hurt by sudden volatility caused by insufficient liquidity.
Trading tag: #BinanceFutures #TradFi #USDⓈM #VRT #VRTUSDT $VRT
[M1_mag7]
$VRT Single-day drop of nearly 10%, down 9.825% over the past 24 hours; the current price is stuck around 259.09. Old dog glanced at its perpetual contract data: the funding rate is dead flat at zero, and the open interest is only 2671.95. This position size is so small it’s nowhere near even the fractional part of the trading value. With such thin liquidity, the price can get “out of whack” after just a few large orders.
The angle is M1_mag7—basically, it’s about how it moves in relation to the U.S. stock market index. But on-chain, this contract market simply can’t compare with the kind of institutional capital flow you see in SPY or QQQ. A funding rate of zero is the first signal: there’s neither long-side premium nor short-side discount, and the market is in a sort of stand-by vacuum. The second signal is that the OI number is extremely low, meaning there isn’t much capital at all actively trading the contract. If a target can’t even attract interest in the futures market, then you can’t really talk about “sector beta” or any liquidity premium. Its drop looks more like exposure of the contract market’s own structural fragility, not a deep adjustment following the broader market.
My take: this is a passive decline under a liquidity vacuum, not the start of a trend. The biggest problem is: nobody’s playing. Until funding fees turn positive and remain stable, this contract market lacks upward fuel. Zero fees mean positions have no cost; anyone can easily come in to dump or pump. But the OI shows that basically nobody is doing it. The so-called “correlation with the overall market” is a false premise right now, because the pool of on-chain contracts is too shallow. Even a little selling pressure could punch through it. If the U.S. stock market were to rebound strongly at this moment, the contract market for $VRT likely wouldn’t be able to supply enough synchronized liquidity and position depth to move up in tandem.
Where could this assessment be most likely wrong? It would be if a sudden surge of capital rushes in, driving up both OI and funding at the same time. If, in subsequent data, open interest doubles while the funding rate turns clearly positive, that would prove new longs are actively building positions and accumulating, and my “liquidity vacuum” judgment would be invalid. Before that, old dog’s move is to stay on the sidelines. With such a shallow pool and zero-fee pricing, I’d rather wait for a right-side signal—i.e., when both OI and price can hold steady above the current level—before taking action. Reaching in now to catch it is likely to get hurt by sudden volatility caused by insufficient liquidity.
Trading tag: #BinanceFutures #TradFi #USDⓈM #VRT #VRTUSDT $VRT
$VRT Single-day drop of nearly 10%, down 9.825% over the past 24 hours; the current price is stuck around 259.09. Old dog glanced at its perpetual contract data: the funding rate is dead flat at zero, and the open interest is only 2671.95. This position size is so small it’s nowhere near even the fractional part of the trading value. With such thin liquidity, the price can get “out of whack” after just a few large orders.
The angle is M1_mag7—basically, it’s about how it moves in relation to the U.S. stock market index. But on-chain, this contract market simply can’t compare with the kind of institutional capital flow you see in SPY or QQQ. A funding rate of zero is the first signal: there’s neither long-side premium nor short-side discount, and the market is in a sort of stand-by vacuum. The second signal is that the OI number is extremely low, meaning there isn’t much capital at all actively trading the contract. If a target can’t even attract interest in the futures market, then you can’t really talk about “sector beta” or any liquidity premium. Its drop looks more like exposure of the contract market’s own structural fragility, not a deep adjustment following the broader market.
My take: this is a passive decline under a liquidity vacuum, not the start of a trend. The biggest problem is: nobody’s playing. Until funding fees turn positive and remain stable, this contract market lacks upward fuel. Zero fees mean positions have no cost; anyone can easily come in to dump or pump. But the OI shows that basically nobody is doing it. The so-called “correlation with the overall market” is a false premise right now, because the pool of on-chain contracts is too shallow. Even a little selling pressure could punch through it. If the U.S. stock market were to rebound strongly at this moment, the contract market for $VRT likely wouldn’t be able to supply enough synchronized liquidity and position depth to move up in tandem.
Where could this assessment be most likely wrong? It would be if a sudden surge of capital rushes in, driving up both OI and funding at the same time. If, in subsequent data, open interest doubles while the funding rate turns clearly positive, that would prove new longs are actively building positions and accumulating, and my “liquidity vacuum” judgment would be invalid. Before that, old dog’s move is to stay on the sidelines. With such a shallow pool and zero-fee pricing, I’d rather wait for a right-side signal—i.e., when both OI and price can hold steady above the current level—before taking action. Reaching in now to catch it is likely to get hurt by sudden volatility caused by insufficient liquidity.
Trading tag: #BinanceFutures #TradFi #USDⓈM #VRT #VRTUSDT $VRT
61
·
--
The old dog glanced at the $VRT batch of money. In 24 hours it dropped by almost 10%, reporting 262.82. The numbers are right there—not small. But then look at its funding rate: 0.00134099. That rate isn’t low. A clear negative price move paired with a positive funding rate—by iron law, that’s the classic long-squeeze where longs get trapped and add positions. It means that when prices fall, the longs don’t concede; instead, they pay the shorts while trying to catch the bottom. This often extends the decline or sets up an even bigger wave of liquidations.
So why say the setup hasn’t changed? Look at the change in the open interest (OI). In absolute terms, OI is 2731.29. Combined with the price of 262.82, you can roughly convert it into the notional value of the contracts. But the key isn’t the absolute number—it’s the relative change. In a backdrop where the price has crashed by nearly 10%, if OI hasn’t shrunk drastically at the same time, what does that indicate? It indicates that the leveraged longs haven’t been cleared out. They’re still in the game, enduring by continuously paying the positive funding rate, betting on a V-shaped rebound. This kind of “holding on” behavior is itself a setup for further downside, because every tick of upward movement can become an exit for these trapped longs.
My view is that in the short term there may be a technical rebound—after all, the drop was too violent. But I don’t see any signs that the trend has stabilized. What is the market ignoring? It’s ignoring the fact that the cost of the longs’ stubborn holding is accumulating. A funding rate of 0.00134 can’t last many days in a crash environment. The longs either have to put up more capital to add margin, or wait for the price to rally to get out of the trap—otherwise they’ll be blown up by liquidations. Now the price is not far from 262.82, the current price. Unless there’s strong buying that lifts the price back to a higher level in one go, so this batch of longs can safely exit, they’re basically a Damocles’ sword hanging overhead.
So my move is very clear: wait. Don’t rush to bottom-fish. If you enter at this spot, it’s very easy to get buried by longs being forced into a stampede. The conditions I’m watching are two: either the price rapidly breaks down below the current price with heavy volume, triggering another round of liquidation, which could be a signal of a panic bottom; or the funding rate rapidly falls—possibly turning negative—meaning the most stubborn longs have surrendered and the market structure has fundamentally changed. Until these signals appear, control your hands.
Where is this judgment most likely to be wrong?
Trading tags: #BinanceFutures #TradFi #USDⓈM #VRT #VRTUSDT $VRT
The old dog glanced at the $VRT batch of money. In 24 hours it dropped by almost 10%, reporting 262.82. The numbers are right there—not small. But then look at its funding rate: 0.00134099. That rate isn’t low. A clear negative price move paired with a positive funding rate—by iron law, that’s the classic long-squeeze where longs get trapped and add positions. It means that when prices fall, the longs don’t concede; instead, they pay the shorts while trying to catch the bottom. This often extends the decline or sets up an even bigger wave of liquidations.
So why say the setup hasn’t changed? Look at the change in the open interest (OI). In absolute terms, OI is 2731.29. Combined with the price of 262.82, you can roughly convert it into the notional value of the contracts. But the key isn’t the absolute number—it’s the relative change. In a backdrop where the price has crashed by nearly 10%, if OI hasn’t shrunk drastically at the same time, what does that indicate? It indicates that the leveraged longs haven’t been cleared out. They’re still in the game, enduring by continuously paying the positive funding rate, betting on a V-shaped rebound. This kind of “holding on” behavior is itself a setup for further downside, because every tick of upward movement can become an exit for these trapped longs.
My view is that in the short term there may be a technical rebound—after all, the drop was too violent. But I don’t see any signs that the trend has stabilized. What is the market ignoring? It’s ignoring the fact that the cost of the longs’ stubborn holding is accumulating. A funding rate of 0.00134 can’t last many days in a crash environment. The longs either have to put up more capital to add margin, or wait for the price to rally to get out of the trap—otherwise they’ll be blown up by liquidations. Now the price is not far from 262.82, the current price. Unless there’s strong buying that lifts the price back to a higher level in one go, so this batch of longs can safely exit, they’re basically a Damocles’ sword hanging overhead.
So my move is very clear: wait. Don’t rush to bottom-fish. If you enter at this spot, it’s very easy to get buried by longs being forced into a stampede. The conditions I’m watching are two: either the price rapidly breaks down below the current price with heavy volume, triggering another round of liquidation, which could be a signal of a panic bottom; or the funding rate rapidly falls—possibly turning negative—meaning the most stubborn longs have surrendered and the market structure has fundamentally changed. Until these signals appear, control your hands.
Where is this judgment most likely to be wrong?
Trading tags: #BinanceFutures #TradFi #USDⓈM #VRT #VRTUSDT $VRT
So why say the setup hasn’t changed? Look at the change in the open interest (OI). In absolute terms, OI is 2731.29. Combined with the price of 262.82, you can roughly convert it into the notional value of the contracts. But the key isn’t the absolute number—it’s the relative change. In a backdrop where the price has crashed by nearly 10%, if OI hasn’t shrunk drastically at the same time, what does that indicate? It indicates that the leveraged longs haven’t been cleared out. They’re still in the game, enduring by continuously paying the positive funding rate, betting on a V-shaped rebound. This kind of “holding on” behavior is itself a setup for further downside, because every tick of upward movement can become an exit for these trapped longs.
My view is that in the short term there may be a technical rebound—after all, the drop was too violent. But I don’t see any signs that the trend has stabilized. What is the market ignoring? It’s ignoring the fact that the cost of the longs’ stubborn holding is accumulating. A funding rate of 0.00134 can’t last many days in a crash environment. The longs either have to put up more capital to add margin, or wait for the price to rally to get out of the trap—otherwise they’ll be blown up by liquidations. Now the price is not far from 262.82, the current price. Unless there’s strong buying that lifts the price back to a higher level in one go, so this batch of longs can safely exit, they’re basically a Damocles’ sword hanging overhead.
So my move is very clear: wait. Don’t rush to bottom-fish. If you enter at this spot, it’s very easy to get buried by longs being forced into a stampede. The conditions I’m watching are two: either the price rapidly breaks down below the current price with heavy volume, triggering another round of liquidation, which could be a signal of a panic bottom; or the funding rate rapidly falls—possibly turning negative—meaning the most stubborn longs have surrendered and the market structure has fundamentally changed. Until these signals appear, control your hands.
Where is this judgment most likely to be wrong?
Trading tags: #BinanceFutures #TradFi #USDⓈM #VRT #VRTUSDT $VRT
1

·
--
$VRT fell 9.82% over the past 24 hours, quoted at 263.6, but the funding rate is still positive at 0.0015.
This is a typical adjustment during the fade-out of “Trump trades” expectations, and a positive funding rate provides fuel for that correction. The market previously paid a premium for policy tailwinds; now that price is dropping, that premium is being drained. A positive funding rate means there are still longs holding positions—even adding to them. They are bearing the cost of this round of adjustment. When price moves downward and longs are still paying funding, their holding costs are passively pushed higher, which forces some participants out via stop-losses. This process often drives the move lower with momentum.
The core logic behind “Trump trades” is betting that his policies will boost specific sectors or overall risk appetite. $VRT, as an on-chain U.S. equities contract underlying, is influenced by such macro narratives. The current price decline combined with a positive funding rate reflects a reality: the market’s immediate reaction to the relevant favorable policy has already been realized—perhaps even overdone—and we are now in the phase of testing reality. If subsequent policy signals are not stronger and more specific, there will be little to support an upward repair.
The strongest counterevidence is this: if Trump were to suddenly announce a major new policy platform that clearly points toward traditional finance or the U.S. equities direction associated with $VRT, shorts could quickly cover and the price might rebound sharply. But my view is that in the absence of such clear signals, the path of least resistance is to look for support on the downside. When price falls and the funding rate does not turn negative, it means longs haven’t capitulated, and the drop likely isn’t finished.
The second-order effect is that if the long positions decide to “hold hard,” they must keep paying funding continuously, which steadily erodes their margin. Meanwhile, capital that is waiting on the sidelines, seeing this divergence structure of falling price and positive funding rates, will tend to wait—either until the funding rate turns negative to signal that short pressure has exhausted, or until the price falls further to present a clearer “cheap” signal. Liquidity shrinks amid indecision.
My assessment fails under these conditions: Trump shows clear, stronger-than-expected positive policy measures, and the $VRT price breaks out on increased volume and holds above the current price level. Otherwise, the current technical correction is still ongoing.
In terms of execution, I’m not chasing shorts, but waiting. If price keeps slipping and the funding rate starts to fall quickly, I’ll consider looking for short-long opportunities after stabilization below. Right now—this phase of falling price with positive funding rates—is “garbage time” where neither side feels good, and entering tends to get hit from both directions.
Trading tag: #TradFi #链上美股 #VRT
Where do you think this set of judgments is most likely to be wrong?
$VRT fell 9.82% over the past 24 hours, quoted at 263.6, but the funding rate is still positive at 0.0015.
This is a typical adjustment during the fade-out of “Trump trades” expectations, and a positive funding rate provides fuel for that correction. The market previously paid a premium for policy tailwinds; now that price is dropping, that premium is being drained. A positive funding rate means there are still longs holding positions—even adding to them. They are bearing the cost of this round of adjustment. When price moves downward and longs are still paying funding, their holding costs are passively pushed higher, which forces some participants out via stop-losses. This process often drives the move lower with momentum.
The core logic behind “Trump trades” is betting that his policies will boost specific sectors or overall risk appetite. $VRT , as an on-chain U.S. equities contract underlying, is influenced by such macro narratives. The current price decline combined with a positive funding rate reflects a reality: the market’s immediate reaction to the relevant favorable policy has already been realized—perhaps even overdone—and we are now in the phase of testing reality. If subsequent policy signals are not stronger and more specific, there will be little to support an upward repair.
The strongest counterevidence is this: if Trump were to suddenly announce a major new policy platform that clearly points toward traditional finance or the U.S. equities direction associated with $VRT , shorts could quickly cover and the price might rebound sharply. But my view is that in the absence of such clear signals, the path of least resistance is to look for support on the downside. When price falls and the funding rate does not turn negative, it means longs haven’t capitulated, and the drop likely isn’t finished.
The second-order effect is that if the long positions decide to “hold hard,” they must keep paying funding continuously, which steadily erodes their margin. Meanwhile, capital that is waiting on the sidelines, seeing this divergence structure of falling price and positive funding rates, will tend to wait—either until the funding rate turns negative to signal that short pressure has exhausted, or until the price falls further to present a clearer “cheap” signal. Liquidity shrinks amid indecision.
My assessment fails under these conditions: Trump shows clear, stronger-than-expected positive policy measures, and the $VRT price breaks out on increased volume and holds above the current price level. Otherwise, the current technical correction is still ongoing.
In terms of execution, I’m not chasing shorts, but waiting. If price keeps slipping and the funding rate starts to fall quickly, I’ll consider looking for short-long opportunities after stabilization below. Right now—this phase of falling price with positive funding rates—is “garbage time” where neither side feels good, and entering tends to get hit from both directions.
Trading tag: #TradFi #链上美股 #VRT
Where do you think this set of judgments is most likely to be wrong?
This is a typical adjustment during the fade-out of “Trump trades” expectations, and a positive funding rate provides fuel for that correction. The market previously paid a premium for policy tailwinds; now that price is dropping, that premium is being drained. A positive funding rate means there are still longs holding positions—even adding to them. They are bearing the cost of this round of adjustment. When price moves downward and longs are still paying funding, their holding costs are passively pushed higher, which forces some participants out via stop-losses. This process often drives the move lower with momentum.
The core logic behind “Trump trades” is betting that his policies will boost specific sectors or overall risk appetite. $VRT , as an on-chain U.S. equities contract underlying, is influenced by such macro narratives. The current price decline combined with a positive funding rate reflects a reality: the market’s immediate reaction to the relevant favorable policy has already been realized—perhaps even overdone—and we are now in the phase of testing reality. If subsequent policy signals are not stronger and more specific, there will be little to support an upward repair.
The strongest counterevidence is this: if Trump were to suddenly announce a major new policy platform that clearly points toward traditional finance or the U.S. equities direction associated with $VRT , shorts could quickly cover and the price might rebound sharply. But my view is that in the absence of such clear signals, the path of least resistance is to look for support on the downside. When price falls and the funding rate does not turn negative, it means longs haven’t capitulated, and the drop likely isn’t finished.
The second-order effect is that if the long positions decide to “hold hard,” they must keep paying funding continuously, which steadily erodes their margin. Meanwhile, capital that is waiting on the sidelines, seeing this divergence structure of falling price and positive funding rates, will tend to wait—either until the funding rate turns negative to signal that short pressure has exhausted, or until the price falls further to present a clearer “cheap” signal. Liquidity shrinks amid indecision.
My assessment fails under these conditions: Trump shows clear, stronger-than-expected positive policy measures, and the $VRT price breaks out on increased volume and holds above the current price level. Otherwise, the current technical correction is still ongoing.
In terms of execution, I’m not chasing shorts, but waiting. If price keeps slipping and the funding rate starts to fall quickly, I’ll consider looking for short-long opportunities after stabilization below. Right now—this phase of falling price with positive funding rates—is “garbage time” where neither side feels good, and entering tends to get hit from both directions.
Trading tag: #TradFi #链上美股 #VRT
Where do you think this set of judgments is most likely to be wrong?
27
·
--
$VRT 24 hours—straight drop and it slammed down 10.55%, but the old dog glanced at the funding rate and it’s still positive at 0.0013. Price is falling, yet the funding rate hasn’t flipped negative—this combo has something.
From the M2_semi angle: in this round of broad selloff across the semiconductor chain, leaders like NVDA and AMD are also trending down, so $VRT naturally can’t hold up. But the problem lies in the funding rate: after a move like this, longs are still paying shorts. What does that mean? During the drop, longs not only didn’t run—they’re still adding in against the trend, hard holding. The opposite of the market’s consensus shows up here: people say a brutal selloff will squeeze out longs, but the funding rate suggests long positions haven’t collapsed yet, and crowding is still not low. This typically isn’t a bottom signal; if anything, it means the short squeeze hasn’t been squeezed out fully.
So my takeaway is clear: it’s not the time to catch a falling knife. The trapped-long positions are still quite thick, and any rebound during the downside could be used to liquidate those positions and get smashed. I’ll stay on the sidelines unless two signals appear: first, the funding rate quickly turns negative—meaning longs have effectively surrendered and the shorts start getting crowded, which gives fuel for a bounce; second, the price can hold around its current level (near 261.84) for at least 24 hours without breaking new lows. For now, it looks like only the first signal has any hint.
Trading tags: #BinanceFutures #TradFi #USDⓈM #VRT #VRTUSDT $VRT
$VRT 24 hours—straight drop and it slammed down 10.55%, but the old dog glanced at the funding rate and it’s still positive at 0.0013. Price is falling, yet the funding rate hasn’t flipped negative—this combo has something.
From the M2_semi angle: in this round of broad selloff across the semiconductor chain, leaders like NVDA and AMD are also trending down, so $VRT naturally can’t hold up. But the problem lies in the funding rate: after a move like this, longs are still paying shorts. What does that mean? During the drop, longs not only didn’t run—they’re still adding in against the trend, hard holding. The opposite of the market’s consensus shows up here: people say a brutal selloff will squeeze out longs, but the funding rate suggests long positions haven’t collapsed yet, and crowding is still not low. This typically isn’t a bottom signal; if anything, it means the short squeeze hasn’t been squeezed out fully.
So my takeaway is clear: it’s not the time to catch a falling knife. The trapped-long positions are still quite thick, and any rebound during the downside could be used to liquidate those positions and get smashed. I’ll stay on the sidelines unless two signals appear: first, the funding rate quickly turns negative—meaning longs have effectively surrendered and the shorts start getting crowded, which gives fuel for a bounce; second, the price can hold around its current level (near 261.84) for at least 24 hours without breaking new lows. For now, it looks like only the first signal has any hint.
Trading tags: #BinanceFutures #TradFi #USDⓈM #VRT #VRTUSDT $VRT
From the M2_semi angle: in this round of broad selloff across the semiconductor chain, leaders like NVDA and AMD are also trending down, so $VRT naturally can’t hold up. But the problem lies in the funding rate: after a move like this, longs are still paying shorts. What does that mean? During the drop, longs not only didn’t run—they’re still adding in against the trend, hard holding. The opposite of the market’s consensus shows up here: people say a brutal selloff will squeeze out longs, but the funding rate suggests long positions haven’t collapsed yet, and crowding is still not low. This typically isn’t a bottom signal; if anything, it means the short squeeze hasn’t been squeezed out fully.
So my takeaway is clear: it’s not the time to catch a falling knife. The trapped-long positions are still quite thick, and any rebound during the downside could be used to liquidate those positions and get smashed. I’ll stay on the sidelines unless two signals appear: first, the funding rate quickly turns negative—meaning longs have effectively surrendered and the shorts start getting crowded, which gives fuel for a bounce; second, the price can hold around its current level (near 261.84) for at least 24 hours without breaking new lows. For now, it looks like only the first signal has any hint.
Trading tags: #BinanceFutures #TradFi #USDⓈM #VRT #VRTUSDT $VRT
50


·
--
Bullish
🔥 $VRT USDT SHORT ALERT 🔥
I’m watching VRT for a bearish continuation after the sharp rejection from the $294 area.
📉 TRADE: SHORT
🎯 Entry: $275.00 – $278.00
🛑 SL: $284.50
💰 TP1: $272.00
💰 TP2: $268.00
💰 TP3: $262.00
💰 TP4: $255.00
⚠️ If price reclaims $284.50 with strong volume, the short setup is invalidated.
Bears are pressing hard — I’m watching the $272 → $268 zone closely. 🔥
#VRT #Binance #cryptotrading #Write2Earn
$CROSS
{future}(CROSSUSDT)
$MAGMA
{future}(MAGMAUSDT)
{future}(VRTUSDT)
🔥 $VRT USDT SHORT ALERT 🔥
I’m watching VRT for a bearish continuation after the sharp rejection from the $294 area.
📉 TRADE: SHORT
🎯 Entry: $275.00 – $278.00
🛑 SL: $284.50
💰 TP1: $272.00
💰 TP2: $268.00
💰 TP3: $262.00
💰 TP4: $255.00
⚠️ If price reclaims $284.50 with strong volume, the short setup is invalidated.
Bears are pressing hard — I’m watching the $272 → $268 zone closely. 🔥
#VRT #Binance #cryptotrading #Write2Earn
$CROSS
$MAGMA
I’m watching VRT for a bearish continuation after the sharp rejection from the $294 area.
📉 TRADE: SHORT
🎯 Entry: $275.00 – $278.00
🛑 SL: $284.50
💰 TP1: $272.00
💰 TP2: $268.00
💰 TP3: $262.00
💰 TP4: $255.00
⚠️ If price reclaims $284.50 with strong volume, the short setup is invalidated.
Bears are pressing hard — I’m watching the $272 → $268 zone closely. 🔥
#VRT #Binance #cryptotrading #Write2Earn
$CROSS
$MAGMA

6
337

·
--
🟢 LONG $VRT USDT (⏱️ Timeframe: 15m-1H)
📍 Entry: 275.50 - 276.50
🛑 SL: 272.50
🎯 TP1: 282.20
🎯 TP2: 288.50
🎯 TP3: 294.50
Price aggressively rejected the 24H high at $294.67, sweeping down to find a solid base right at the $275.00 low. The chart structure currently shows a perfect reclamation attempt off the daily support zone, with price compressing after a sharp sell-off. With volume beginning to taper off, the path of least resistance points toward a liquidity grab into the $282 region and a potential retest of the high timeframe supply around $288-$294. A clean reclaim above $276 confirms the market is absorbing the selling pressure, setting up a favorable risk-to-reward for a bounce back toward the highs.
Trade Here 👉
{future}(VRTUSDT)
$ZEC
{future}(ZECUSDT)
$USELESS
{future}(USELESSUSDT)
#VRT #TradeSetup #TechnicalAnalysis #WriteToEarnUpgrade #Write2Earn
⚠️ Not financial advice. Always manage your risk.
🟢 LONG $VRT USDT (⏱️ Timeframe: 15m-1H)
📍 Entry: 275.50 - 276.50
🛑 SL: 272.50
🎯 TP1: 282.20
🎯 TP2: 288.50
🎯 TP3: 294.50
Price aggressively rejected the 24H high at $294.67, sweeping down to find a solid base right at the $275.00 low. The chart structure currently shows a perfect reclamation attempt off the daily support zone, with price compressing after a sharp sell-off. With volume beginning to taper off, the path of least resistance points toward a liquidity grab into the $282 region and a potential retest of the high timeframe supply around $288-$294. A clean reclaim above $276 confirms the market is absorbing the selling pressure, setting up a favorable risk-to-reward for a bounce back toward the highs.
Trade Here 👉
$ZEC
$USELESS
#VRT #TradeSetup #TechnicalAnalysis #WriteToEarnUpgrade #Write2Earn
⚠️ Not financial advice. Always manage your risk.
📍 Entry: 275.50 - 276.50
🛑 SL: 272.50
🎯 TP1: 282.20
🎯 TP2: 288.50
🎯 TP3: 294.50
Price aggressively rejected the 24H high at $294.67, sweeping down to find a solid base right at the $275.00 low. The chart structure currently shows a perfect reclamation attempt off the daily support zone, with price compressing after a sharp sell-off. With volume beginning to taper off, the path of least resistance points toward a liquidity grab into the $282 region and a potential retest of the high timeframe supply around $288-$294. A clean reclaim above $276 confirms the market is absorbing the selling pressure, setting up a favorable risk-to-reward for a bounce back toward the highs.
Trade Here 👉
$ZEC
$USELESS
#VRT #TradeSetup #TechnicalAnalysis #WriteToEarnUpgrade #Write2Earn
⚠️ Not financial advice. Always manage your risk.

1
525

·
--
📈 Naise Strategy Sharing
━━━━━━━━━━━━━━━━
💰 Coin: VRTUSDT
🟢 Direction: Long
📊 Signal: Buy
⭐ Confidence: 80%
📈 Trend: Uptrend
━━━━━━━━━━━━━━━━
💎 Current Price: 263.64
🔴 Resistance Levels: [294.67, 298.206176]
🟢 Support Levels: [268.196824, 249.74]
━━━━━━━━━━━━━━━━
📝 Analysis: The drop is -10.2% + RSI is low + near the lower Bollinger Band—high probability of a rebound
━━━━━━━━━━━━━━━━
📅 2026.09.10 02:23 | For reference only and does not constitute investment advice
#VRT #加密货币 #合约交易 #奈斯哥 #Quant Trading
📈 Naise Strategy Sharing
━━━━━━━━━━━━━━━━
💰 Coin: VRTUSDT
🟢 Direction: Long
📊 Signal: Buy
⭐ Confidence: 80%
📈 Trend: Uptrend
━━━━━━━━━━━━━━━━
💎 Current Price: 263.64
🔴 Resistance Levels: [294.67, 298.206176]
🟢 Support Levels: [268.196824, 249.74]
━━━━━━━━━━━━━━━━
📝 Analysis: The drop is -10.2% + RSI is low + near the lower Bollinger Band—high probability of a rebound
━━━━━━━━━━━━━━━━
📅 2026.09.10 02:23 | For reference only and does not constitute investment advice
#VRT #加密货币 #合约交易 #奈斯哥 #Quant Trading
━━━━━━━━━━━━━━━━
💰 Coin: VRTUSDT
🟢 Direction: Long
📊 Signal: Buy
⭐ Confidence: 80%
📈 Trend: Uptrend
━━━━━━━━━━━━━━━━
💎 Current Price: 263.64
🔴 Resistance Levels: [294.67, 298.206176]
🟢 Support Levels: [268.196824, 249.74]
━━━━━━━━━━━━━━━━
📝 Analysis: The drop is -10.2% + RSI is low + near the lower Bollinger Band—high probability of a rebound
━━━━━━━━━━━━━━━━
📅 2026.09.10 02:23 | For reference only and does not constitute investment advice
#VRT #加密货币 #合约交易 #奈斯哥 #Quant Trading
4

·
--
$VRT has fallen 8.9% over the past 24 hours, and the price is now 267.49. The funding rate is still positive at 0.00125, which means longs are paying shorts.
Price is down but the funding rate is positive, which suggests many long positions are still in place and are passively bearing the funding cost. Open interest (OI) is 2562.46 and has not declined significantly, which confirms this point. Longs are currently trapped, and the ongoing funding payments are increasing their cost.
Under this structure, if the price keeps breaking lower, it may trigger long stop-losses or liquidations, causing the decline to accelerate.
Trading tag: #TradFi #链上美股 #VRT
Where do you think this line of reasoning is most likely wrong?
$VRT has fallen 8.9% over the past 24 hours, and the price is now 267.49. The funding rate is still positive at 0.00125, which means longs are paying shorts.
Price is down but the funding rate is positive, which suggests many long positions are still in place and are passively bearing the funding cost. Open interest (OI) is 2562.46 and has not declined significantly, which confirms this point. Longs are currently trapped, and the ongoing funding payments are increasing their cost.
Under this structure, if the price keeps breaking lower, it may trigger long stop-losses or liquidations, causing the decline to accelerate.
Trading tag: #TradFi #链上美股 #VRT
Where do you think this line of reasoning is most likely wrong?
Price is down but the funding rate is positive, which suggests many long positions are still in place and are passively bearing the funding cost. Open interest (OI) is 2562.46 and has not declined significantly, which confirms this point. Longs are currently trapped, and the ongoing funding payments are increasing their cost.
Under this structure, if the price keeps breaking lower, it may trigger long stop-losses or liquidations, causing the decline to accelerate.
Trading tag: #TradFi #链上美股 #VRT
Where do you think this line of reasoning is most likely wrong?
75
·
--
$VRT In the past 24 hours, it fell 8.936%, with the price at 267.49, but the funding rate is still positive at 0.00125. When the price drops while the funding rate remains positive, it indicates that long positions’ costs are accumulating and it’s easy to trigger forced liquidation of longs. This is a single-signal judgment; when macro sentiment is weak, the risk of this structure is higher. The strongest counter-evidence is: if the overall market risk appetite rebounds, buy-side orders may step in and reverse the downtrend. I tend to wait and see, not chase longs. Invalidation condition: if the funding rate rapidly turns negative, it suggests the shorts are starting to concede; then reassess.
Trading tag: #TradFi #链上美股 #VRT
Where do you think this set of judgment is most likely to be wrong?
$VRT In the past 24 hours, it fell 8.936%, with the price at 267.49, but the funding rate is still positive at 0.00125. When the price drops while the funding rate remains positive, it indicates that long positions’ costs are accumulating and it’s easy to trigger forced liquidation of longs. This is a single-signal judgment; when macro sentiment is weak, the risk of this structure is higher. The strongest counter-evidence is: if the overall market risk appetite rebounds, buy-side orders may step in and reverse the downtrend. I tend to wait and see, not chase longs. Invalidation condition: if the funding rate rapidly turns negative, it suggests the shorts are starting to concede; then reassess.
Trading tag: #TradFi #链上美股 #VRT
Where do you think this set of judgment is most likely to be wrong?
Trading tag: #TradFi #链上美股 #VRT
Where do you think this set of judgment is most likely to be wrong?
28
·
--
$VRT fell 8.94% over the past 24 hours, yet the funding rate remains positive at 0.00125. Price declines combined with a positive funding rate is a typical long-position trapped-and-adding structure.
This means longs are bearing the funding costs against the trend and trying to average down losses, but the price is still drifting lower. From the perspective of macro risk appetite, this suggests that some funds still have a stubborn attachment to on-chain U.S.-stock–type assets, but selling pressure in the market is heavier. The position size of 2562 isn’t high, indicating that this drop wasn’t triggered by large-scale liquidation of longs; it’s more like slow bleeding caused by insufficient liquidity.
Trading tag: #TradFi #链上美股 #VRT
Where do you think this assessment is most likely wrong?
$VRT fell 8.94% over the past 24 hours, yet the funding rate remains positive at 0.00125. Price declines combined with a positive funding rate is a typical long-position trapped-and-adding structure.
This means longs are bearing the funding costs against the trend and trying to average down losses, but the price is still drifting lower. From the perspective of macro risk appetite, this suggests that some funds still have a stubborn attachment to on-chain U.S.-stock–type assets, but selling pressure in the market is heavier. The position size of 2562 isn’t high, indicating that this drop wasn’t triggered by large-scale liquidation of longs; it’s more like slow bleeding caused by insufficient liquidity.
Trading tag: #TradFi #链上美股 #VRT
Where do you think this assessment is most likely wrong?
This means longs are bearing the funding costs against the trend and trying to average down losses, but the price is still drifting lower. From the perspective of macro risk appetite, this suggests that some funds still have a stubborn attachment to on-chain U.S.-stock–type assets, but selling pressure in the market is heavier. The position size of 2562 isn’t high, indicating that this drop wasn’t triggered by large-scale liquidation of longs; it’s more like slow bleeding caused by insufficient liquidity.
Trading tag: #TradFi #链上美股 #VRT
Where do you think this assessment is most likely wrong?
22

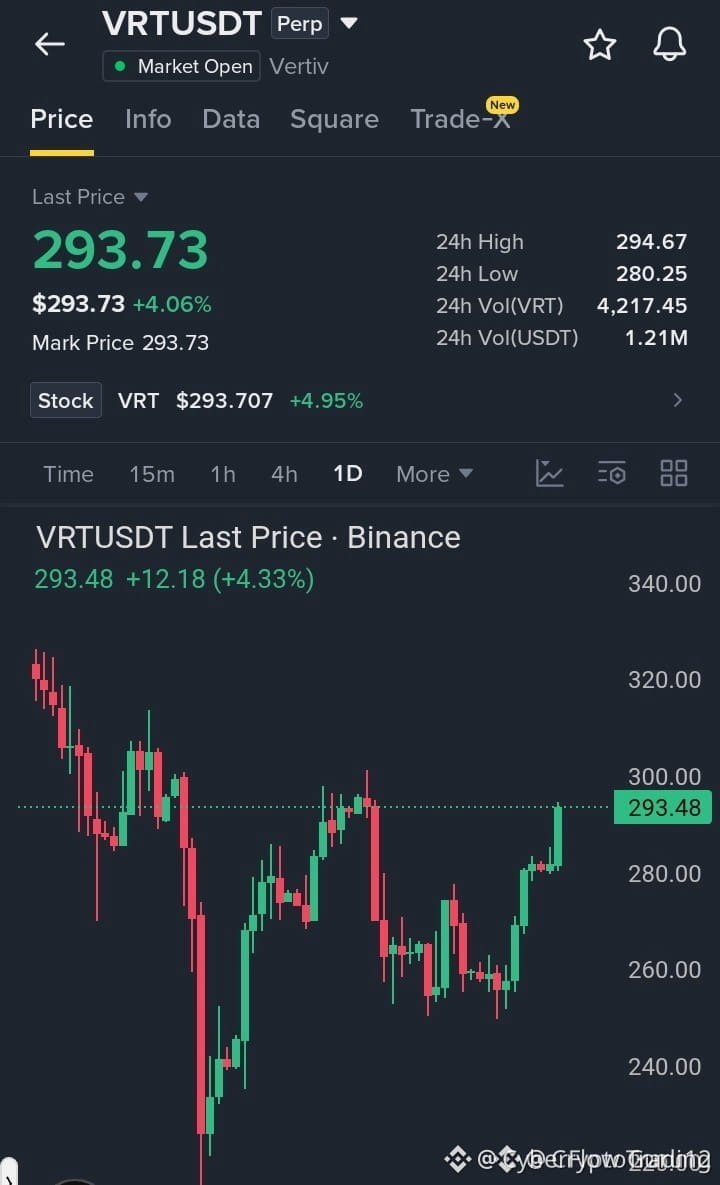
🚀 $VRT SURGES TOWARD 300 BREAKOUT ZONE! 🟢
Entry: 289-294 ⚡
Target: 300/305/310 🚀
Stop Loss: 284 ⚠️
Buyers are hammering the $VRT chart, punching through the 289‑294 zone and eyeing the 300 resistance like a fresh order block. 📊 The recent recovery has cleared the sell wall, and volume is ticking up, signaling smart‑money aggression. 🦈
A clean break above 300 could unleash a cascade to 305 and 310, adding fresh upside momentum. ⚡ Keep your risk tight; the stop at 284 caps the downside while the risk‑reward stays juicy. 💬 Are you ready to ride this push or waiting for the next liquidity sweep?
⚠️ Not financial advice. Always manage your risk. 🛡️
🏷️ #VRT #LongSetup #Breakout #Crypto
🚀 💎
🚀 $VRT SURGES TOWARD 300 BREAKOUT ZONE! 🟢
Entry: 289-294 ⚡
Target: 300/305/310 🚀
Stop Loss: 284 ⚠️
Buyers are hammering the $VRT chart, punching through the 289‑294 zone and eyeing the 300 resistance like a fresh order block. 📊 The recent recovery has cleared the sell wall, and volume is ticking up, signaling smart‑money aggression. 🦈
A clean break above 300 could unleash a cascade to 305 and 310, adding fresh upside momentum. ⚡ Keep your risk tight; the stop at 284 caps the downside while the risk‑reward stays juicy. 💬 Are you ready to ride this push or waiting for the next liquidity sweep?
⚠️ Not financial advice. Always manage your risk. 🛡️
🏷️ #VRT #LongSetup #Breakout #Crypto
🚀 💎
Entry: 289-294 ⚡
Target: 300/305/310 🚀
Stop Loss: 284 ⚠️
Buyers are hammering the $VRT chart, punching through the 289‑294 zone and eyeing the 300 resistance like a fresh order block. 📊 The recent recovery has cleared the sell wall, and volume is ticking up, signaling smart‑money aggression. 🦈
A clean break above 300 could unleash a cascade to 305 and 310, adding fresh upside momentum. ⚡ Keep your risk tight; the stop at 284 caps the downside while the risk‑reward stays juicy. 💬 Are you ready to ride this push or waiting for the next liquidity sweep?
⚠️ Not financial advice. Always manage your risk. 🛡️
🏷️ #VRT #LongSetup #Breakout #Crypto
🚀 💎
21

·
--
🚨 $VRT SURFING THROUGH RESISTANCE TO TARGET 310 🚀
Entry: 289-294 ⚡
Target: 300 🚀
Target: 305 🚀
Target: 310 🚀
Stop Loss: 284 ⚠️
📊 The order block around 289‑294 has been repeatedly defended, indicating smart‑money accumulation. A clean break above the 300 ceiling ignites a fresh liquidity sweep, and volume on the 4H is expanding like a tide. 💡 With each bullish retest, the market flips the prior resistance into a robust demand zone, setting the stage for a multi‑target upside swing. 🦈
💬 Do you see the next liquidity grab beyond 310, or will the market pause for a corrective pullback? 👇
⚠️ Not financial advice. Always manage your risk. 🛡️
🏷️ #VRT #LongSetup #Liquidity #Crypto
🔥 💎
🚨 $VRT SURFING THROUGH RESISTANCE TO TARGET 310 🚀
Entry: 289-294 ⚡
Target: 300 🚀
Target: 305 🚀
Target: 310 🚀
Stop Loss: 284 ⚠️
📊 The order block around 289‑294 has been repeatedly defended, indicating smart‑money accumulation. A clean break above the 300 ceiling ignites a fresh liquidity sweep, and volume on the 4H is expanding like a tide. 💡 With each bullish retest, the market flips the prior resistance into a robust demand zone, setting the stage for a multi‑target upside swing. 🦈
💬 Do you see the next liquidity grab beyond 310, or will the market pause for a corrective pullback? 👇
⚠️ Not financial advice. Always manage your risk. 🛡️
🏷️ #VRT #LongSetup #Liquidity #Crypto
🔥 💎
Entry: 289-294 ⚡
Target: 300 🚀
Target: 305 🚀
Target: 310 🚀
Stop Loss: 284 ⚠️
📊 The order block around 289‑294 has been repeatedly defended, indicating smart‑money accumulation. A clean break above the 300 ceiling ignites a fresh liquidity sweep, and volume on the 4H is expanding like a tide. 💡 With each bullish retest, the market flips the prior resistance into a robust demand zone, setting the stage for a multi‑target upside swing. 🦈
💬 Do you see the next liquidity grab beyond 310, or will the market pause for a corrective pullback? 👇
⚠️ Not financial advice. Always manage your risk. 🛡️
🏷️ #VRT #LongSetup #Liquidity #Crypto
🔥 💎
11

·
--
Bullish
$VRT ... Buyers Are Pressing Into Resistance
#VRT is holding strong after a steady recovery, with buyers pushing price back toward the 300 area. A clean break above the recent resistance could open the way for another upside move.
Entry: 289 – 294
Targets: 300 / 305 / 310
SL: 284
Long
{future}(VRTUSDT)
with proper risk management.
$SOPH
{future}(SOPHUSDT)
$ZEC
{future}(ZECUSDT)
$VRT ... Buyers Are Pressing Into Resistance
#VRT is holding strong after a steady recovery, with buyers pushing price back toward the 300 area. A clean break above the recent resistance could open the way for another upside move.
Entry: 289 – 294
Targets: 300 / 305 / 310
SL: 284
Long
with proper risk management.
$SOPH
$ZEC
#VRT is holding strong after a steady recovery, with buyers pushing price back toward the 300 area. A clean break above the recent resistance could open the way for another upside move.
Entry: 289 – 294
Targets: 300 / 305 / 310
SL: 284
Long
with proper risk management.
$SOPH
$ZEC
1
326

·
--
🚨 $VRT RECLAIMS UPPER RANGE, LOOKING TO FLIP $284 RESISTANCE 💥
Entry: 282.8-284.0 ⚡
Target: 285.4 / 287.0 / 288.5 🚀
Stop Loss: 281.2 ⚠️
📊 The price has defended the $280‑$281 corridor three times, signaling a strong institutional demand block. 🦈 With the upper intraday range now retaken, the $284 barrier is primed to flip into support, turning the last liquidity pocket into a springboard. ⚡ A clean break above $285.4 would cascade momentum toward the $287‑$288.5 zone, offering layered upside for disciplined longs.
💬 Do you see the $284 flip as the catalyst for a multi‑target rally? 👇
⚠️ Not financial advice. Always manage your risk. 🛡️
🏷️ #VRT #LongSetup #Liquidity #Crypto
🔥 💎
🚨 $VRT RECLAIMS UPPER RANGE, LOOKING TO FLIP $284 RESISTANCE 💥
Entry: 282.8-284.0 ⚡
Target: 285.4 / 287.0 / 288.5 🚀
Stop Loss: 281.2 ⚠️
📊 The price has defended the $280‑$281 corridor three times, signaling a strong institutional demand block. 🦈 With the upper intraday range now retaken, the $284 barrier is primed to flip into support, turning the last liquidity pocket into a springboard. ⚡ A clean break above $285.4 would cascade momentum toward the $287‑$288.5 zone, offering layered upside for disciplined longs.
💬 Do you see the $284 flip as the catalyst for a multi‑target rally? 👇
⚠️ Not financial advice. Always manage your risk. 🛡️
🏷️ #VRT #LongSetup #Liquidity #Crypto
🔥 💎
Entry: 282.8-284.0 ⚡
Target: 285.4 / 287.0 / 288.5 🚀
Stop Loss: 281.2 ⚠️
📊 The price has defended the $280‑$281 corridor three times, signaling a strong institutional demand block. 🦈 With the upper intraday range now retaken, the $284 barrier is primed to flip into support, turning the last liquidity pocket into a springboard. ⚡ A clean break above $285.4 would cascade momentum toward the $287‑$288.5 zone, offering layered upside for disciplined longs.
💬 Do you see the $284 flip as the catalyst for a multi‑target rally? 👇
⚠️ Not financial advice. Always manage your risk. 🛡️
🏷️ #VRT #LongSetup #Liquidity #Crypto
🔥 💎
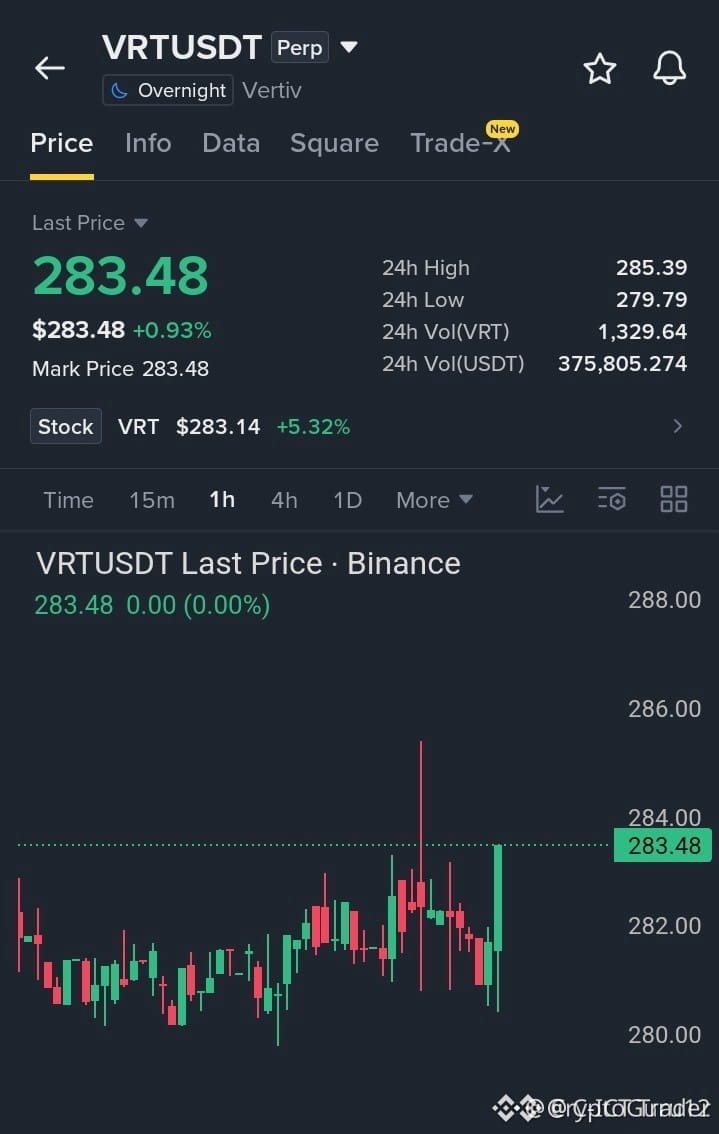
57

·
--
🚀 $VRT RECLAIMS UPPER RANGE, SETTING STAGE FOR BREAKOUT 🚨
Entry: 282.8-284.0 ⚡
Target: 285.4/287.0/288.5 🚀
Stop Loss: 281.2 ⚠️
📊 The $280‑$281 demand wall held firm, forcing price to sprint toward the $284 ceiling. Once that resistance flips, liquidity floods back, turning the ceiling into fresh support. 🌊 A clean breach above $285.4 unlocks the next $287‑$288.5 zone, where smart‑money order blocks sit ready. ⚡ Buyers are already stacking bids, and volume is humming on the 15‑minute chart.
💬 Do you see the flip turning this range into a launchpad, or are you waiting for a deeper test? 👇
⚠️ Not financial advice. Always manage your risk. 🛡️
🏷️ #VRT #LongSetup #Breakout #Crypto
🚀 💎
🚀 $VRT RECLAIMS UPPER RANGE, SETTING STAGE FOR BREAKOUT 🚨
Entry: 282.8-284.0 ⚡
Target: 285.4/287.0/288.5 🚀
Stop Loss: 281.2 ⚠️
📊 The $280‑$281 demand wall held firm, forcing price to sprint toward the $284 ceiling. Once that resistance flips, liquidity floods back, turning the ceiling into fresh support. 🌊 A clean breach above $285.4 unlocks the next $287‑$288.5 zone, where smart‑money order blocks sit ready. ⚡ Buyers are already stacking bids, and volume is humming on the 15‑minute chart.
💬 Do you see the flip turning this range into a launchpad, or are you waiting for a deeper test? 👇
⚠️ Not financial advice. Always manage your risk. 🛡️
🏷️ #VRT #LongSetup #Breakout #Crypto
🚀 💎
Entry: 282.8-284.0 ⚡
Target: 285.4/287.0/288.5 🚀
Stop Loss: 281.2 ⚠️
📊 The $280‑$281 demand wall held firm, forcing price to sprint toward the $284 ceiling. Once that resistance flips, liquidity floods back, turning the ceiling into fresh support. 🌊 A clean breach above $285.4 unlocks the next $287‑$288.5 zone, where smart‑money order blocks sit ready. ⚡ Buyers are already stacking bids, and volume is humming on the 15‑minute chart.
💬 Do you see the flip turning this range into a launchpad, or are you waiting for a deeper test? 👇
⚠️ Not financial advice. Always manage your risk. 🛡️
🏷️ #VRT #LongSetup #Breakout #Crypto
🚀 💎
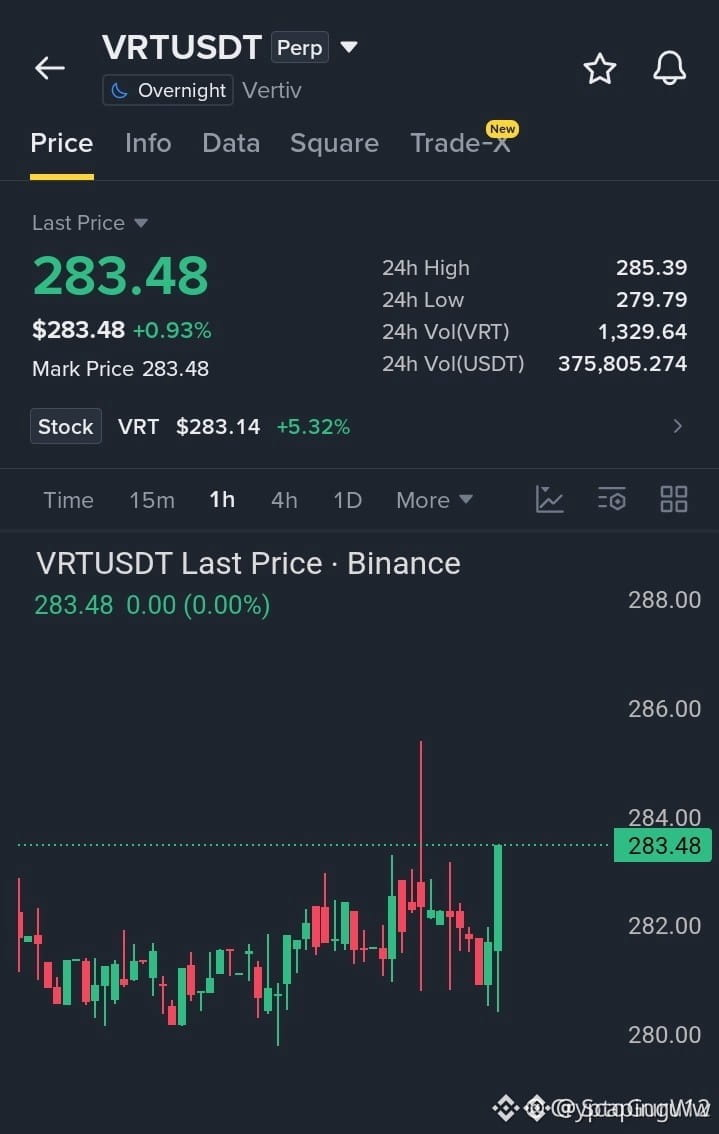
22
Log in to explore more content
Join global crypto users on Binance Square
⚡️ Get latest and useful information about crypto.
💬 Trusted by the world’s largest crypto exchange.
👍 Discover real insights from verified creators.
Email / Phone number
Trending Topics
1
#BitcoinSpotETFsNetInflow$159M
0 views
21 Discussing
2
#HKMAPlansWholesaleCBDCByYearEnd
2,730 views
202 Discussing
3
#NEARSurges26%Past$3.45
7,627 views
92 Discussing
4
#BOJHikesRatesTo31YearHigh
19,797 views
566 Discussing
5
#EvernorthRaises$30MToBuyXRP
46 views
11 Discussing
6
#ChainlinkPowersBottomlinePaymentPlatform
22,675 views
541 Discussing
7
#DtcpayCompletes$25MSeriesA
678 views
23 Discussing
8
#InjectiveLaunchesINJOnSolana
3,440 views
114 Discussing
9
#StellarActivatesProtocol28At211TPS
29,018 views
651 Discussing
10
#SECGrantsInnovationExemptionForTokenizedStocks
23,954 views
494 Discussing