

#volumeanalysis
volumeanalysis
129,651 views
1,391 Discussing
Hot
Latest

Most traders stare at price. Smart traders stare at volume. Here is why.
$BTC is sitting at $80,632.6, down just -0.3% in 24h. Nothing crazy on the surface. But the 24h volume tells a deeper story at $1,134M.
Volume is the fuel behind every move. When price drops but volume is low, selling pressure is weak. It often signals exhaustion rather than a true trend shift. But if that same price drop came with a massive volume spike, it would mean strong hands are distributing and a deeper correction is likely coming.
The lesson: never trade a chart in isolation. A price move without volume confirmation is like a car without gas. It will stall.
What is the last trade you took where volume saved you from a bad entry?
We post every algo signal's real result openly and the full live track record plus a free preview channel are in our bio/profile.
#TradingEducation #VolumeAnalysis $BTC
Most traders stare at price. Smart traders stare at volume. Here is why.
$BTC is sitting at $80,632.6, down just -0.3% in 24h. Nothing crazy on the surface. But the 24h volume tells a deeper story at $1,134M.
Volume is the fuel behind every move. When price drops but volume is low, selling pressure is weak. It often signals exhaustion rather than a true trend shift. But if that same price drop came with a massive volume spike, it would mean strong hands are distributing and a deeper correction is likely coming.
The lesson: never trade a chart in isolation. A price move without volume confirmation is like a car without gas. It will stall.
What is the last trade you took where volume saved you from a bad entry?
We post every algo signal's real result openly and the full live track record plus a free preview channel are in our bio/profile.
#TradingEducation #VolumeAnalysis $BTC
$BTC is sitting at $80,632.6, down just -0.3% in 24h. Nothing crazy on the surface. But the 24h volume tells a deeper story at $1,134M.
Volume is the fuel behind every move. When price drops but volume is low, selling pressure is weak. It often signals exhaustion rather than a true trend shift. But if that same price drop came with a massive volume spike, it would mean strong hands are distributing and a deeper correction is likely coming.
The lesson: never trade a chart in isolation. A price move without volume confirmation is like a car without gas. It will stall.
What is the last trade you took where volume saved you from a bad entry?
We post every algo signal's real result openly and the full live track record plus a free preview channel are in our bio/profile.
#TradingEducation #VolumeAnalysis $BTC
26

$SHELL | Understanding Low-Volume Consolidation
Recent market snapshots placed $SHELL near the $0.021–0.023 range, with reported 24-hour trading volume varying from roughly 2.5 million to 5 million across tracking platforms. The difference between sources matters, but the broader picture is relatively consistent: price has been moving within a narrow band without a clearly confirmed breakout.
What does low-volume consolidation actually tell us?
Consolidation occurs when buying and selling pressure temporarily balance out. When trading volume is subdued, it can indicate that participants are waiting for new information or that neither side is willing to commit aggressively. However, low volume alone does not prove that a major move is approaching. Markets can remain range-bound for longer than traders expect.
The more useful question is what happens when price approaches the boundaries of the range. If price moves above resistance but volume remains weak, the breakout may lack participation. If price closes beyond resistance with a meaningful increase in volume, the move deserves closer attention. The same principle applies to a breakdown below support.
For now, the reported range provides context, not a guaranteed trading signal. A confirmed change in structure requires evidence beyond a single candle.
#MyShell #PriceAction #VolumeAnalysis CryptoEducation MarketStructure
$SHELL | Understanding Low-Volume Consolidation
Recent market snapshots placed $SHELL near the $0.021–0.023 range, with reported 24-hour trading volume varying from roughly 2.5 million to 5 million across tracking platforms. The difference between sources matters, but the broader picture is relatively consistent: price has been moving within a narrow band without a clearly confirmed breakout.
What does low-volume consolidation actually tell us?
Consolidation occurs when buying and selling pressure temporarily balance out. When trading volume is subdued, it can indicate that participants are waiting for new information or that neither side is willing to commit aggressively. However, low volume alone does not prove that a major move is approaching. Markets can remain range-bound for longer than traders expect.
The more useful question is what happens when price approaches the boundaries of the range. If price moves above resistance but volume remains weak, the breakout may lack participation. If price closes beyond resistance with a meaningful increase in volume, the move deserves closer attention. The same principle applies to a breakdown below support.
For now, the reported range provides context, not a guaranteed trading signal. A confirmed change in structure requires evidence beyond a single candle.
#MyShell #PriceAction #VolumeAnalysis CryptoEducation MarketStructure
Recent market snapshots placed $SHELL near the $0.021–0.023 range, with reported 24-hour trading volume varying from roughly 2.5 million to 5 million across tracking platforms. The difference between sources matters, but the broader picture is relatively consistent: price has been moving within a narrow band without a clearly confirmed breakout.
What does low-volume consolidation actually tell us?
Consolidation occurs when buying and selling pressure temporarily balance out. When trading volume is subdued, it can indicate that participants are waiting for new information or that neither side is willing to commit aggressively. However, low volume alone does not prove that a major move is approaching. Markets can remain range-bound for longer than traders expect.
The more useful question is what happens when price approaches the boundaries of the range. If price moves above resistance but volume remains weak, the breakout may lack participation. If price closes beyond resistance with a meaningful increase in volume, the move deserves closer attention. The same principle applies to a breakdown below support.
For now, the reported range provides context, not a guaranteed trading signal. A confirmed change in structure requires evidence beyond a single candle.
#MyShell #PriceAction #VolumeAnalysis CryptoEducation MarketStructure

93

[Decoding Wyckoff Accumulation: Why Candle Spreads Compress at Support]
The transition from sharp markdowns to horizontal trading ranges marks the initial development of an accumulation base.
During consolidation, monitor the spread between daily highs and lows. Tightening spreads indicate that limit bids at the floor are absorbing aggressive seller liquidation.
This structural baseline serves as our invalidation reference. As long as daily closes hold above the floor on declining volume, the structural accumulation thesis remains intact.
#WyckoffMethod #BinanceSpot #VolumeAnalysis
#BinanceSpot
[Decoding Wyckoff Accumulation: Why Candle Spreads Compress at Support]
The transition from sharp markdowns to horizontal trading ranges marks the initial development of an accumulation base.
During consolidation, monitor the spread between daily highs and lows. Tightening spreads indicate that limit bids at the floor are absorbing aggressive seller liquidation.
This structural baseline serves as our invalidation reference. As long as daily closes hold above the floor on declining volume, the structural accumulation thesis remains intact.
#WyckoffMethod #BinanceSpot #VolumeAnalysis
#BinanceSpot
The transition from sharp markdowns to horizontal trading ranges marks the initial development of an accumulation base.
During consolidation, monitor the spread between daily highs and lows. Tightening spreads indicate that limit bids at the floor are absorbing aggressive seller liquidation.
This structural baseline serves as our invalidation reference. As long as daily closes hold above the floor on declining volume, the structural accumulation thesis remains intact.
#WyckoffMethod #BinanceSpot #VolumeAnalysis
#BinanceSpot

·
--
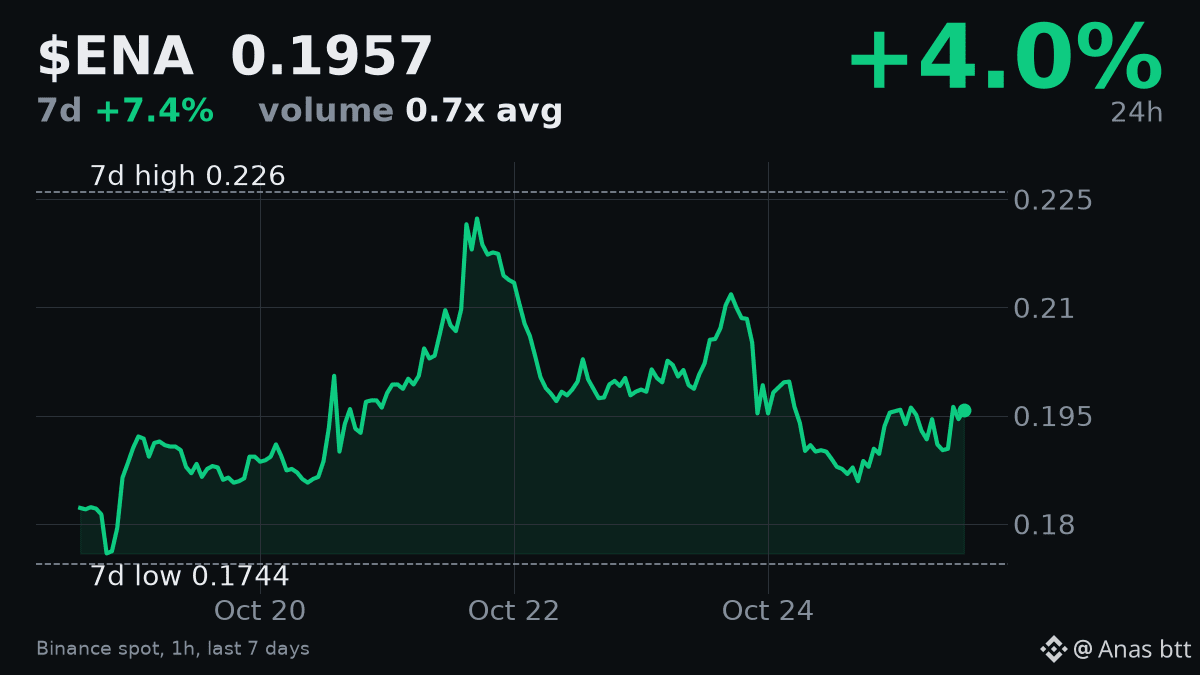
$ENA is up 7.409% in seven days, currently trading at $0.1957. It is still 13.407% below its 7-day high of $0.226. The 24-hour trading volume for $ENA is low today, at $25.46 million, which is only 0.65 times its 7-day average. This suggests weak interest despite the weekly gain.
RSI is neutral at 54.7, and $BTC is slightly down 0.41% in the last 24 hours. My view is neutral for now. The 7-day gain lacks strong volume confirmation, and the price is well off its weekly high. A decisive move above $0.226 with increased volume would change my outlook to more bullish. I will be watching for any significant price action to be confirmed by volume.
#ENA #VolumeAnalysis
$ENA is up 7.409% in seven days, currently trading at $0.1957. It is still 13.407% below its 7-day high of $0.226. The 24-hour trading volume for $ENA is low today, at $25.46 million, which is only 0.65 times its 7-day average. This suggests weak interest despite the weekly gain.
RSI is neutral at 54.7, and $BTC is slightly down 0.41% in the last 24 hours. My view is neutral for now. The 7-day gain lacks strong volume confirmation, and the price is well off its weekly high. A decisive move above $0.226 with increased volume would change my outlook to more bullish. I will be watching for any significant price action to be confirmed by volume.
#ENA #VolumeAnalysis
RSI is neutral at 54.7, and $BTC is slightly down 0.41% in the last 24 hours. My view is neutral for now. The 7-day gain lacks strong volume confirmation, and the price is well off its weekly high. A decisive move above $0.226 with increased volume would change my outlook to more bullish. I will be watching for any significant price action to be confirmed by volume.
#ENA #VolumeAnalysis
58

👀 $NEAR
{spot}(NEARUSDT)
EAR: PRICE UP, VOLUME DOWN?
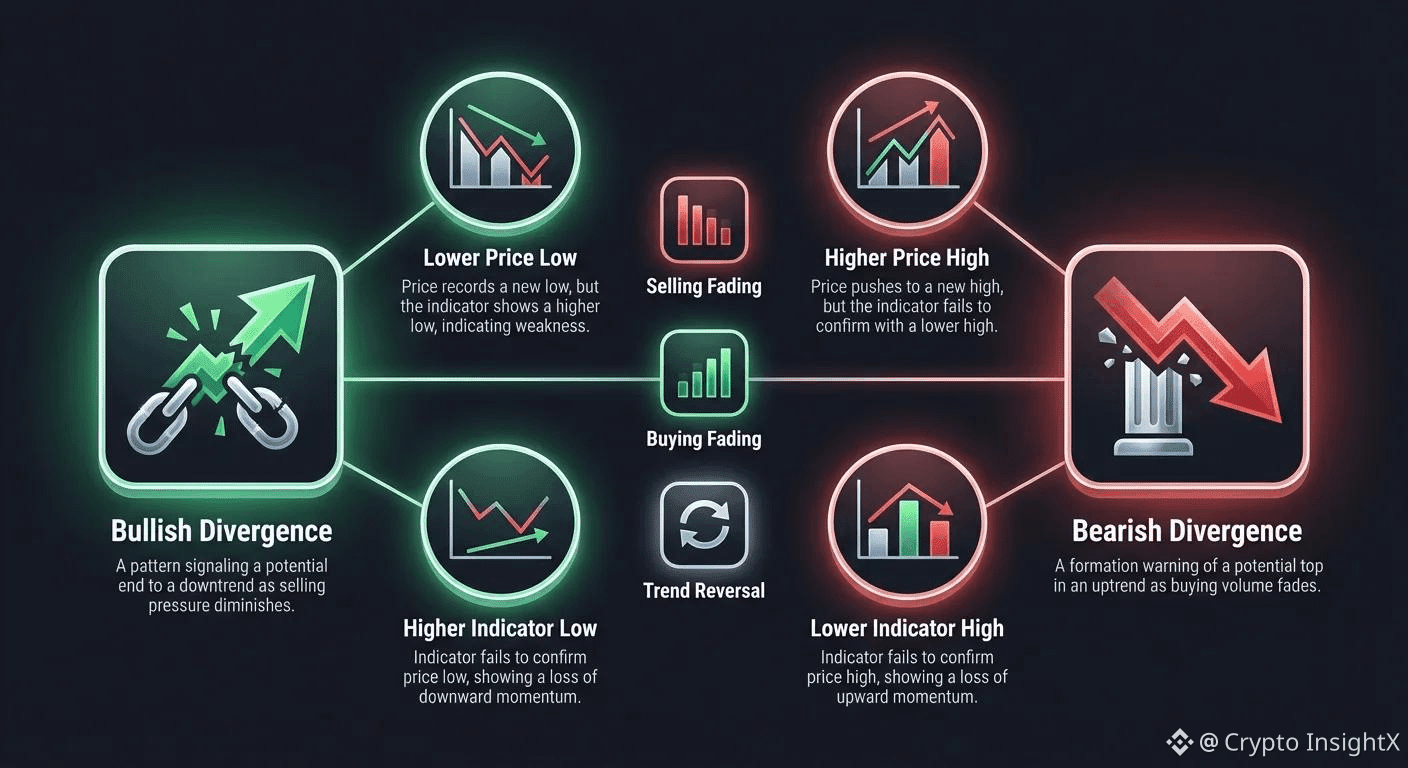
A price bounce can look bullish, but weaker volume may suggest buyers lack conviction.
📈 Rising price + rising volume can support a move.
⚠️ Rising price + falling volume calls for caution.
Volume alone cannot confirm a reversal, so watch price action too.
💬 Would you trust this bounce or wait for stronger volume?
#NEAR #VolumeAnalysis #Altcoins
👀 $NEAR
EAR: PRICE UP, VOLUME DOWN?
A price bounce can look bullish, but weaker volume may suggest buyers lack conviction.
📈 Rising price + rising volume can support a move.
⚠️ Rising price + falling volume calls for caution.
Volume alone cannot confirm a reversal, so watch price action too.
💬 Would you trust this bounce or wait for stronger volume?
#NEAR #VolumeAnalysis #Altcoins
EAR: PRICE UP, VOLUME DOWN?
A price bounce can look bullish, but weaker volume may suggest buyers lack conviction.
📈 Rising price + rising volume can support a move.
⚠️ Rising price + falling volume calls for caution.
Volume alone cannot confirm a reversal, so watch price action too.
💬 Would you trust this bounce or wait for stronger volume?
#NEAR #VolumeAnalysis #Altcoins
77
$SHELL | Understanding Low-Volume Sideways Trading
Recent market data in reports places the price of $SHELL around $0.021–$0.023. The 24-hour trading volume recorded by tracking platforms ranges from $2.5 million to $5 million. Differences between sources are worth noting, but the overall picture shows the price moving within a relatively narrow range, with no clear breakout signal yet.
So, what does a low-volume sideways period really tell us?
Sideways movement is a temporary balance between buying and selling pressure. When trading volume is low, the market may be waiting for new information, or neither side may be ready to trade aggressively. However, low volume does not mean a sharp rise or fall is imminent. The market may continue moving sideways longer than expected.
What is more important to watch is how the price reacts as it approaches either boundary of the range. If the price moves above resistance while volume remains weak, the breakout may lack broad market participation. Conversely, if the price closes above resistance alongside a significant increase in volume, that signal deserves more attention. The same principle applies when the price breaks below the support zone.
For now, the reported price range provides analytical context, not a definitive trading signal. Confirming a change in market structure requires more evidence than a single candlestick.
#MyShell #PriceAction #VolumeAnalysis CryptoEducation MarketStructure
$SHELL | Understanding Low-Volume Sideways Trading
Recent market data in reports places the price of $SHELL around $0.021–$0.023. The 24-hour trading volume recorded by tracking platforms ranges from $2.5 million to $5 million. Differences between sources are worth noting, but the overall picture shows the price moving within a relatively narrow range, with no clear breakout signal yet.
So, what does a low-volume sideways period really tell us?
Sideways movement is a temporary balance between buying and selling pressure. When trading volume is low, the market may be waiting for new information, or neither side may be ready to trade aggressively. However, low volume does not mean a sharp rise or fall is imminent. The market may continue moving sideways longer than expected.
What is more important to watch is how the price reacts as it approaches either boundary of the range. If the price moves above resistance while volume remains weak, the breakout may lack broad market participation. Conversely, if the price closes above resistance alongside a significant increase in volume, that signal deserves more attention. The same principle applies when the price breaks below the support zone.
For now, the reported price range provides analytical context, not a definitive trading signal. Confirming a change in market structure requires more evidence than a single candlestick.
#MyShell #PriceAction #VolumeAnalysis CryptoEducation MarketStructure
Recent market data in reports places the price of $SHELL around $0.021–$0.023. The 24-hour trading volume recorded by tracking platforms ranges from $2.5 million to $5 million. Differences between sources are worth noting, but the overall picture shows the price moving within a relatively narrow range, with no clear breakout signal yet.
So, what does a low-volume sideways period really tell us?
Sideways movement is a temporary balance between buying and selling pressure. When trading volume is low, the market may be waiting for new information, or neither side may be ready to trade aggressively. However, low volume does not mean a sharp rise or fall is imminent. The market may continue moving sideways longer than expected.
What is more important to watch is how the price reacts as it approaches either boundary of the range. If the price moves above resistance while volume remains weak, the breakout may lack broad market participation. Conversely, if the price closes above resistance alongside a significant increase in volume, that signal deserves more attention. The same principle applies when the price breaks below the support zone.
For now, the reported price range provides analytical context, not a definitive trading signal. Confirming a change in market structure requires more evidence than a single candlestick.
#MyShell #PriceAction #VolumeAnalysis CryptoEducation MarketStructure

9
Volume tells you whether a move has conviction. Here's how to read it using today's $ZEC action.
Right now Zcash is trading at $1240.89, up +0.4% in 24h with a volume of $168M. That volume figure is your lie detector.
When price drifts on low volume, the move is often driven by a lack of sellers, not genuine buying pressure. But when you see price tick higher alongside expanding volume, it confirms real capital is entering the market.
Think of volume as fuel. A price breakout without volume is like a car going uphill on an empty tank. It stalls. But when volume surges alongside a move, that fuel supports continuation.
For $ZEC, watch whether that $168M grows or shrinks over the next 24 hours. Rising volume at this level signals strength; fading volume warns the bounce may be exhausted.
What volume threshold would make you trust a move here?
#CryptoTrading #VolumeAnalysis
We post every algo signal's real result openly and the full live track record plus a free preview channel are in our bio/profile.
Volume tells you whether a move has conviction. Here's how to read it using today's $ZEC action.
Right now Zcash is trading at $1240.89, up +0.4% in 24h with a volume of $168M. That volume figure is your lie detector.
When price drifts on low volume, the move is often driven by a lack of sellers, not genuine buying pressure. But when you see price tick higher alongside expanding volume, it confirms real capital is entering the market.
Think of volume as fuel. A price breakout without volume is like a car going uphill on an empty tank. It stalls. But when volume surges alongside a move, that fuel supports continuation.
For $ZEC , watch whether that $168M grows or shrinks over the next 24 hours. Rising volume at this level signals strength; fading volume warns the bounce may be exhausted.
What volume threshold would make you trust a move here?
#CryptoTrading #VolumeAnalysis
We post every algo signal's real result openly and the full live track record plus a free preview channel are in our bio/profile.
Right now Zcash is trading at $1240.89, up +0.4% in 24h with a volume of $168M. That volume figure is your lie detector.
When price drifts on low volume, the move is often driven by a lack of sellers, not genuine buying pressure. But when you see price tick higher alongside expanding volume, it confirms real capital is entering the market.
Think of volume as fuel. A price breakout without volume is like a car going uphill on an empty tank. It stalls. But when volume surges alongside a move, that fuel supports continuation.
For $ZEC , watch whether that $168M grows or shrinks over the next 24 hours. Rising volume at this level signals strength; fading volume warns the bounce may be exhausted.
What volume threshold would make you trust a move here?
#CryptoTrading #VolumeAnalysis
We post every algo signal's real result openly and the full live track record plus a free preview channel are in our bio/profile.
4
Ever noticed how price drops feel scarier when volume spikes? That's not coincidence — it's market mechanics.
Right now $ZEC is down -10.4% at $1217.31, and its 24h volume sits at $282M. Here's the teaching moment:
Volume CONFIRMS the strength of a move. When price drops on rising volume, sellers are aggressive and the move has conviction. When price drops on LOW volume, it often means exhaustion — fewer participants are driving it down, and a reversal becomes more likely.
So the question every trader should ask right now: Is $ZEC's $282M volume high relative to its recent average? If yes, the sell-off has fuel. If it's actually below average, the drop might be running on fumes.
Volume is your truth-teller. Price lies. Volume rarely does.
What's your go-to volume signal when deciding whether to fade a drop or wait it out? Drop your approach below 👇
#VolumeAnalysis #TradingEducation
We post every algo signal's REAL result openly and the full live track record + a free preview channel are in our bio/profile.
Ever noticed how price drops feel scarier when volume spikes? That's not coincidence — it's market mechanics.
Right now $ZEC is down -10.4% at $1217.31, and its 24h volume sits at $282M. Here's the teaching moment:
Volume CONFIRMS the strength of a move. When price drops on rising volume, sellers are aggressive and the move has conviction. When price drops on LOW volume, it often means exhaustion — fewer participants are driving it down, and a reversal becomes more likely.
So the question every trader should ask right now: Is $ZEC 's $282M volume high relative to its recent average? If yes, the sell-off has fuel. If it's actually below average, the drop might be running on fumes.
Volume is your truth-teller. Price lies. Volume rarely does.
What's your go-to volume signal when deciding whether to fade a drop or wait it out? Drop your approach below 👇
#VolumeAnalysis #TradingEducation
We post every algo signal's REAL result openly and the full live track record + a free preview channel are in our bio/profile.
Right now $ZEC is down -10.4% at $1217.31, and its 24h volume sits at $282M. Here's the teaching moment:
Volume CONFIRMS the strength of a move. When price drops on rising volume, sellers are aggressive and the move has conviction. When price drops on LOW volume, it often means exhaustion — fewer participants are driving it down, and a reversal becomes more likely.
So the question every trader should ask right now: Is $ZEC 's $282M volume high relative to its recent average? If yes, the sell-off has fuel. If it's actually below average, the drop might be running on fumes.
Volume is your truth-teller. Price lies. Volume rarely does.
What's your go-to volume signal when deciding whether to fade a drop or wait it out? Drop your approach below 👇
#VolumeAnalysis #TradingEducation
We post every algo signal's REAL result openly and the full live track record + a free preview channel are in our bio/profile.
Why did $ENA tumble 10% even as $50 M flooded the market in the last 24 h?
When price drops sharply but volume spikes, it’s a classic **volume confirmation** signal. The market is saying “many hands are exiting,” which adds weight to the price move. In $ENA’s case the coin slid to $0.1988, down ‑10.2% in a day, while on‑chain activity surged past $50 M. That surge tells us sellers are aggressive, and the downside is likely to continue until buying pressure re‑enters.
Traders use this mismatch to avoid false breakouts: if price falls on low volume, it could be a temporary dip; high volume confirms the trend’s strength.
So, when you spot a price dip paired with a volume explosion, what next step do you take? #CryptoEducation #VolumeAnalysis
We post every algo signal’s REAL result openly and the full live track record + a free preview channel are in our bio/profile. $ENA
Why did $ENA tumble 10% even as $50 M flooded the market in the last 24 h?
When price drops sharply but volume spikes, it’s a classic **volume confirmation** signal. The market is saying “many hands are exiting,” which adds weight to the price move. In $ENA ’s case the coin slid to $0.1988, down ‑10.2% in a day, while on‑chain activity surged past $50 M. That surge tells us sellers are aggressive, and the downside is likely to continue until buying pressure re‑enters.
Traders use this mismatch to avoid false breakouts: if price falls on low volume, it could be a temporary dip; high volume confirms the trend’s strength.
So, when you spot a price dip paired with a volume explosion, what next step do you take? #CryptoEducation #VolumeAnalysis
We post every algo signal’s REAL result openly and the full live track record + a free preview channel are in our bio/profile. $ENA
When price drops sharply but volume spikes, it’s a classic **volume confirmation** signal. The market is saying “many hands are exiting,” which adds weight to the price move. In $ENA ’s case the coin slid to $0.1988, down ‑10.2% in a day, while on‑chain activity surged past $50 M. That surge tells us sellers are aggressive, and the downside is likely to continue until buying pressure re‑enters.
Traders use this mismatch to avoid false breakouts: if price falls on low volume, it could be a temporary dip; high volume confirms the trend’s strength.
So, when you spot a price dip paired with a volume explosion, what next step do you take? #CryptoEducation #VolumeAnalysis
We post every algo signal’s REAL result openly and the full live track record + a free preview channel are in our bio/profile. $ENA
10

"Is $NEAR's 24-hour change hiding a breakout, or just more consolidation?"
$NEAR is sitting right in the middle of its 24-hour range, but the 24-hour change is hiding a story. The current price is right where most traders are focusing, but the real action might be in the volume patterns. If the 24-hour change is positive, it could signal a breakout. If negative, it might suggest more consolidation.
What traders should watch next is the volume spikes. If volume increases significantly, it could confirm a breakout. If not, we might see more range-bound action.
What are you watching on $NEAR right now?
$NEAR — on my screen today.
Price alerts on NEAR/USDT beat guessing the tape.
#near #cryptotrading #breakout #volumeanalysis
"Is $NEAR 's 24-hour change hiding a breakout, or just more consolidation?"
$NEAR is sitting right in the middle of its 24-hour range, but the 24-hour change is hiding a story. The current price is right where most traders are focusing, but the real action might be in the volume patterns. If the 24-hour change is positive, it could signal a breakout. If negative, it might suggest more consolidation.
What traders should watch next is the volume spikes. If volume increases significantly, it could confirm a breakout. If not, we might see more range-bound action.
What are you watching on $NEAR right now?
$NEAR — on my screen today.
Price alerts on NEAR/USDT beat guessing the tape.
#near #cryptotrading #breakout #volumeanalysis
$NEAR is sitting right in the middle of its 24-hour range, but the 24-hour change is hiding a story. The current price is right where most traders are focusing, but the real action might be in the volume patterns. If the 24-hour change is positive, it could signal a breakout. If negative, it might suggest more consolidation.
What traders should watch next is the volume spikes. If volume increases significantly, it could confirm a breakout. If not, we might see more range-bound action.
What are you watching on $NEAR right now?
$NEAR — on my screen today.
Price alerts on NEAR/USDT beat guessing the tape.
#near #cryptotrading #breakout #volumeanalysis
68
$UNI just popped +5.2% in 24 hours – but is it a confirmed move or just noise? Let's talk about volume confirmation.
When a price makes a significant move, like $UNI's recent jump to $7.504, traders look at volume to gauge the strength and conviction behind it. High volume accompanying a price increase suggests strong buying interest and a higher probability that the move will continue. Conversely, a price increase on low volume might indicate a lack of conviction, making it more susceptible to a quick reversal.
For $UNI, with its 24h volume at $51M, we'd compare this to its average daily volume. If $51M is significantly higher than usual, it adds weight to the +5.2% rally. If it's average or below, the move might be less sustainable. Always cross-reference price action with volume to get a clearer picture of market sentiment.
What other indicators do you combine with volume to confirm a trend?
$UNI #CryptoTrading #VolumeAnalysis
We post every algo signal's REAL result openly and the full live track record + a free preview channel are in our bio.
$UNI just popped +5.2% in 24 hours – but is it a confirmed move or just noise? Let's talk about volume confirmation.
When a price makes a significant move, like $UNI 's recent jump to $7.504, traders look at volume to gauge the strength and conviction behind it. High volume accompanying a price increase suggests strong buying interest and a higher probability that the move will continue. Conversely, a price increase on low volume might indicate a lack of conviction, making it more susceptible to a quick reversal.
For $UNI , with its 24h volume at $51M, we'd compare this to its average daily volume. If $51M is significantly higher than usual, it adds weight to the +5.2% rally. If it's average or below, the move might be less sustainable. Always cross-reference price action with volume to get a clearer picture of market sentiment.
What other indicators do you combine with volume to confirm a trend?
$UNI #CryptoTrading #VolumeAnalysis
We post every algo signal's REAL result openly and the full live track record + a free preview channel are in our bio.
When a price makes a significant move, like $UNI 's recent jump to $7.504, traders look at volume to gauge the strength and conviction behind it. High volume accompanying a price increase suggests strong buying interest and a higher probability that the move will continue. Conversely, a price increase on low volume might indicate a lack of conviction, making it more susceptible to a quick reversal.
For $UNI , with its 24h volume at $51M, we'd compare this to its average daily volume. If $51M is significantly higher than usual, it adds weight to the +5.2% rally. If it's average or below, the move might be less sustainable. Always cross-reference price action with volume to get a clearer picture of market sentiment.
What other indicators do you combine with volume to confirm a trend?
$UNI #CryptoTrading #VolumeAnalysis
We post every algo signal's REAL result openly and the full live track record + a free preview channel are in our bio.
29
$WLD is up 6.3% today, but what does its $60M volume tell us beyond just price action?
Today, let's talk about Volume Confirmation. When a cryptocurrency like $WLD makes a significant price move, many traders immediately look at the volume accompanying it. High volume during a price surge, like we're seeing with $WLD today, generally confirms the strength and conviction behind that move. It suggests broad participation and genuine interest, rather than just a few large players manipulating the price.
Conversely, if $WLD were to jump 6% on very low volume, it would be a "red flag" for many. Low volume on a price move often indicates a lack of conviction, making the move potentially unsustainable or easily reversible. It's like a car trying to go uphill with an empty fuel tank – it might get a little way, but it won't last.
Volume confirmation helps traders gauge the reliability of a price trend. High volume on an uptrend suggests the trend is strong and likely to continue, while high volume on a downtrend confirms selling pressure. It's a crucial piece of the puzzle for understanding market sentiment.
How do you typically use volume in your own trading decisions?
#CryptoTrading #VolumeAnalysis
We post every algo signal's REAL result openly and the full live track record + a free preview channel are in our bio/profile.
$WLD is up 6.3% today, but what does its $60M volume tell us beyond just price action?
Today, let's talk about Volume Confirmation. When a cryptocurrency like $WLD makes a significant price move, many traders immediately look at the volume accompanying it. High volume during a price surge, like we're seeing with $WLD today, generally confirms the strength and conviction behind that move. It suggests broad participation and genuine interest, rather than just a few large players manipulating the price.
Conversely, if $WLD were to jump 6% on very low volume, it would be a "red flag" for many. Low volume on a price move often indicates a lack of conviction, making the move potentially unsustainable or easily reversible. It's like a car trying to go uphill with an empty fuel tank – it might get a little way, but it won't last.
Volume confirmation helps traders gauge the reliability of a price trend. High volume on an uptrend suggests the trend is strong and likely to continue, while high volume on a downtrend confirms selling pressure. It's a crucial piece of the puzzle for understanding market sentiment.
How do you typically use volume in your own trading decisions?
#CryptoTrading #VolumeAnalysis
We post every algo signal's REAL result openly and the full live track record + a free preview channel are in our bio/profile.
Today, let's talk about Volume Confirmation. When a cryptocurrency like $WLD makes a significant price move, many traders immediately look at the volume accompanying it. High volume during a price surge, like we're seeing with $WLD today, generally confirms the strength and conviction behind that move. It suggests broad participation and genuine interest, rather than just a few large players manipulating the price.
Conversely, if $WLD were to jump 6% on very low volume, it would be a "red flag" for many. Low volume on a price move often indicates a lack of conviction, making the move potentially unsustainable or easily reversible. It's like a car trying to go uphill with an empty fuel tank – it might get a little way, but it won't last.
Volume confirmation helps traders gauge the reliability of a price trend. High volume on an uptrend suggests the trend is strong and likely to continue, while high volume on a downtrend confirms selling pressure. It's a crucial piece of the puzzle for understanding market sentiment.
How do you typically use volume in your own trading decisions?
#CryptoTrading #VolumeAnalysis
We post every algo signal's REAL result openly and the full live track record + a free preview channel are in our bio/profile.
58
Most traders stare at price. Smart traders stare at volume. Let's use $USD1 as a live case study.
Right now it's trading at $1.00019, down 0.0% over 24h. Flat price action, right? But look at the $104M in 24h volume.
Here's the concept: volume confirms intent. When price barely moves but volume stays massive, institutions are quietly accumulating and distributing at equilibrium. This is how major positions get built before a real move.
If price breaks above that tight range on HIGH volume, the breakout is confirmed. If it breaks on LOW volume, it's likely a fakeout designed to trap retail traders.
Always ask: does the volume support the move?
What's the last chart you traded where volume warned you before price did?
We post every algo signal's REAL result openly and the full live track record + a free preview channel are in our bio/profile.
#VolumeAnalysis
Most traders stare at price. Smart traders stare at volume. Let's use $USD1 as a live case study.
Right now it's trading at $1.00019, down 0.0% over 24h. Flat price action, right? But look at the $104M in 24h volume.
Here's the concept: volume confirms intent. When price barely moves but volume stays massive, institutions are quietly accumulating and distributing at equilibrium. This is how major positions get built before a real move.
If price breaks above that tight range on HIGH volume, the breakout is confirmed. If it breaks on LOW volume, it's likely a fakeout designed to trap retail traders.
Always ask: does the volume support the move?
What's the last chart you traded where volume warned you before price did?
We post every algo signal's REAL result openly and the full live track record + a free preview channel are in our bio/profile.
#VolumeAnalysis
Right now it's trading at $1.00019, down 0.0% over 24h. Flat price action, right? But look at the $104M in 24h volume.
Here's the concept: volume confirms intent. When price barely moves but volume stays massive, institutions are quietly accumulating and distributing at equilibrium. This is how major positions get built before a real move.
If price breaks above that tight range on HIGH volume, the breakout is confirmed. If it breaks on LOW volume, it's likely a fakeout designed to trap retail traders.
Always ask: does the volume support the move?
What's the last chart you traded where volume warned you before price did?
We post every algo signal's REAL result openly and the full live track record + a free preview channel are in our bio/profile.
#VolumeAnalysis
5
Most traders stare at price. Smart traders stare at volume. Here's why.
$ZEC is down -5.0% today at $1085.6. But the real story is the $177M volume bar. When price drops on RISING volume, it signals strong seller conviction. When price drops on FALLING volume, the move is often exhausted and a reversal becomes likely.
Think of volume as fuel. A big red candle with thin volume is a car running on fumes. A small red candle with massive volume means real distribution is happening under the hood.
Rule of thumb: always confirm the trend with volume. Price lies. Volume doesn't.
What's your go-to volume signal — spike or fade? Drop it below. 👇
We post every algo signal's real result openly and the full live track record plus a free preview channel are in our bio/profile.
#TradingTips #VolumeAnalysis
Most traders stare at price. Smart traders stare at volume. Here's why.
$ZEC is down -5.0% today at $1085.6. But the real story is the $177M volume bar. When price drops on RISING volume, it signals strong seller conviction. When price drops on FALLING volume, the move is often exhausted and a reversal becomes likely.
Think of volume as fuel. A big red candle with thin volume is a car running on fumes. A small red candle with massive volume means real distribution is happening under the hood.
Rule of thumb: always confirm the trend with volume. Price lies. Volume doesn't.
What's your go-to volume signal — spike or fade? Drop it below. 👇
We post every algo signal's real result openly and the full live track record plus a free preview channel are in our bio/profile.
#TradingTips #VolumeAnalysis
$ZEC is down -5.0% today at $1085.6. But the real story is the $177M volume bar. When price drops on RISING volume, it signals strong seller conviction. When price drops on FALLING volume, the move is often exhausted and a reversal becomes likely.
Think of volume as fuel. A big red candle with thin volume is a car running on fumes. A small red candle with massive volume means real distribution is happening under the hood.
Rule of thumb: always confirm the trend with volume. Price lies. Volume doesn't.
What's your go-to volume signal — spike or fade? Drop it below. 👇
We post every algo signal's real result openly and the full live track record plus a free preview channel are in our bio/profile.
#TradingTips #VolumeAnalysis
36
🚀 Why does a sudden spike in volume matter more than price alone?
$ZEC is down 1.4% over the past 24 hours, trading around $1,123, but its 24‑hour volume surged to $141 M. This mismatch signals that traders are actively repositioning—either taking profits or loading up for the next move. When price drifts sideways while volume climbs, it often foreshadows a breakout or a reversal because the market is “charging” for the next direction.
In practice, compare the current $ZEC volume to its 7‑day average (≈$90 M). The 57% increase tells us that new capital is entering the market, which can push the price beyond the recent support at $1,080 or break the resistance near $1,150. Ignoring volume would leave you blind to this hidden pressure.
📊 So, before you act on a price dip, check if volume is confirming the move—high volume = stronger conviction, low volume = possible false signal.
What’s the last time you caught a breakout by watching volume first?
#CryptoEducation #VolumeAnalysis
we post every algo signal's REAL result openly and the full live track record + a free preview channel are in our bio/profile.
🚀 Why does a sudden spike in volume matter more than price alone?
$ZEC is down 1.4% over the past 24 hours, trading around $1,123, but its 24‑hour volume surged to $141 M. This mismatch signals that traders are actively repositioning—either taking profits or loading up for the next move. When price drifts sideways while volume climbs, it often foreshadows a breakout or a reversal because the market is “charging” for the next direction.
In practice, compare the current $ZEC volume to its 7‑day average (≈$90 M). The 57% increase tells us that new capital is entering the market, which can push the price beyond the recent support at $1,080 or break the resistance near $1,150. Ignoring volume would leave you blind to this hidden pressure.
📊 So, before you act on a price dip, check if volume is confirming the move—high volume = stronger conviction, low volume = possible false signal.
What’s the last time you caught a breakout by watching volume first?
#CryptoEducation #VolumeAnalysis
we post every algo signal's REAL result openly and the full live track record + a free preview channel are in our bio/profile.
$ZEC is down 1.4% over the past 24 hours, trading around $1,123, but its 24‑hour volume surged to $141 M. This mismatch signals that traders are actively repositioning—either taking profits or loading up for the next move. When price drifts sideways while volume climbs, it often foreshadows a breakout or a reversal because the market is “charging” for the next direction.
In practice, compare the current $ZEC volume to its 7‑day average (≈$90 M). The 57% increase tells us that new capital is entering the market, which can push the price beyond the recent support at $1,080 or break the resistance near $1,150. Ignoring volume would leave you blind to this hidden pressure.
📊 So, before you act on a price dip, check if volume is confirming the move—high volume = stronger conviction, low volume = possible false signal.
What’s the last time you caught a breakout by watching volume first?
#CryptoEducation #VolumeAnalysis
we post every algo signal's REAL result openly and the full live track record + a free preview channel are in our bio/profile.
5
Why does a price dip paired with shrinking volume often signal a weak move? 🤔
Today $ETH slipped 1.4% to $2,424.2 while 24‑hour volume dropped to $394 M, well below its typical $600‑$800 M range. Low volume means fewer hands are backing the price change, so the sell pressure lacks conviction. If the next candle shows a bounce on higher volume—say $700 M+—that would confirm buyers are stepping in and the dip could be a short‑term pullback, not a new downtrend.
Conversely, a continued decline with volume staying low often foreshadows a quick reversal once stronger participants re‑enter.
What volume clues do you look for before deciding if a move is real or a false alarm? $ETH
#CryptoEducation #VolumeAnalysis
We post every algo signal's REAL result openly and the full live track record + a free preview channel are in our bio/profile.
Why does a price dip paired with shrinking volume often signal a weak move? 🤔
Today $ETH slipped 1.4% to $2,424.2 while 24‑hour volume dropped to $394 M, well below its typical $600‑$800 M range. Low volume means fewer hands are backing the price change, so the sell pressure lacks conviction. If the next candle shows a bounce on higher volume—say $700 M+—that would confirm buyers are stepping in and the dip could be a short‑term pullback, not a new downtrend.
Conversely, a continued decline with volume staying low often foreshadows a quick reversal once stronger participants re‑enter.
What volume clues do you look for before deciding if a move is real or a false alarm? $ETH
#CryptoEducation #VolumeAnalysis
We post every algo signal's REAL result openly and the full live track record + a free preview channel are in our bio/profile.
Today $ETH slipped 1.4% to $2,424.2 while 24‑hour volume dropped to $394 M, well below its typical $600‑$800 M range. Low volume means fewer hands are backing the price change, so the sell pressure lacks conviction. If the next candle shows a bounce on higher volume—say $700 M+—that would confirm buyers are stepping in and the dip could be a short‑term pullback, not a new downtrend.
Conversely, a continued decline with volume staying low often foreshadows a quick reversal once stronger participants re‑enter.
What volume clues do you look for before deciding if a move is real or a false alarm? $ETH
#CryptoEducation #VolumeAnalysis
We post every algo signal's REAL result openly and the full live track record + a free preview channel are in our bio/profile.
29

·
--
Ever wondered why trading volume matters in crypto? 🤔 It's key! 🚀 Volume shows how much of an asset is traded. High volume means lots of activity and strong interest. 💪
If a price rises on low volume, it might not last. 📉 But if it rockets with huge volume, that's a strong signal of real buying pressure and a confirmed uptrend! 📈 High selling volume confirms downtrends. 🔴
High volume means better liquidity. You can easily buy or sell without big price impact. ⚡️ Low volume leads to bigger swings and difficult trades. ⚠️ It confirms breakouts, making them more reliable. Always check volume before decisions! 💎 What's volume's role in your strategy? Share below! 👇
#CryptoTrading #VolumeAnalysis #MarketSignals #BeginnerTips
Not financial advice. DYOR.
Ever wondered why trading volume matters in crypto? 🤔 It's key! 🚀 Volume shows how much of an asset is traded. High volume means lots of activity and strong interest. 💪
If a price rises on low volume, it might not last. 📉 But if it rockets with huge volume, that's a strong signal of real buying pressure and a confirmed uptrend! 📈 High selling volume confirms downtrends. 🔴
High volume means better liquidity. You can easily buy or sell without big price impact. ⚡️ Low volume leads to bigger swings and difficult trades. ⚠️ It confirms breakouts, making them more reliable. Always check volume before decisions! 💎 What's volume's role in your strategy? Share below! 👇
#CryptoTrading #VolumeAnalysis #MarketSignals #BeginnerTips
Not financial advice. DYOR.
If a price rises on low volume, it might not last. 📉 But if it rockets with huge volume, that's a strong signal of real buying pressure and a confirmed uptrend! 📈 High selling volume confirms downtrends. 🔴
High volume means better liquidity. You can easily buy or sell without big price impact. ⚡️ Low volume leads to bigger swings and difficult trades. ⚠️ It confirms breakouts, making them more reliable. Always check volume before decisions! 💎 What's volume's role in your strategy? Share below! 👇
#CryptoTrading #VolumeAnalysis #MarketSignals #BeginnerTips
Not financial advice. DYOR.
5
Daily Volume for $SHELL rose sharply during the 16/10 session.
Reference point: the 16/10/2026 daily candle on Binance USDⓈ-M Futures, using the UTC trading day.
The 16/10 daily candle recorded a volume of approximately 162.76 million SHELL, significantly higher than the approximately 62.69 million SHELL recorded by the 15/10 daily candle in the same Futures data.
The 16/10 daily candle closed at 0.02288 USDT, above its opening price of 0.02179 USDT. The rise in volume coincided with a positive-closing candle, but is not enough to confirm a longer-term uptrend.
The following candles should be monitored to assess how sustained trading activity is.
#DailyVolume #VolumeAnalysis #AltcoinMarket
Daily Volume for $SHELL rose sharply during the 16/10 session.
Reference point: the 16/10/2026 daily candle on Binance USDⓈ-M Futures, using the UTC trading day.
The 16/10 daily candle recorded a volume of approximately 162.76 million SHELL, significantly higher than the approximately 62.69 million SHELL recorded by the 15/10 daily candle in the same Futures data.
The 16/10 daily candle closed at 0.02288 USDT, above its opening price of 0.02179 USDT. The rise in volume coincided with a positive-closing candle, but is not enough to confirm a longer-term uptrend.
The following candles should be monitored to assess how sustained trading activity is.
#DailyVolume #VolumeAnalysis #AltcoinMarket
Reference point: the 16/10/2026 daily candle on Binance USDⓈ-M Futures, using the UTC trading day.
The 16/10 daily candle recorded a volume of approximately 162.76 million SHELL, significantly higher than the approximately 62.69 million SHELL recorded by the 15/10 daily candle in the same Futures data.
The 16/10 daily candle closed at 0.02288 USDT, above its opening price of 0.02179 USDT. The rise in volume coincided with a positive-closing candle, but is not enough to confirm a longer-term uptrend.
The following candles should be monitored to assess how sustained trading activity is.
#DailyVolume #VolumeAnalysis #AltcoinMarket

9
·
--
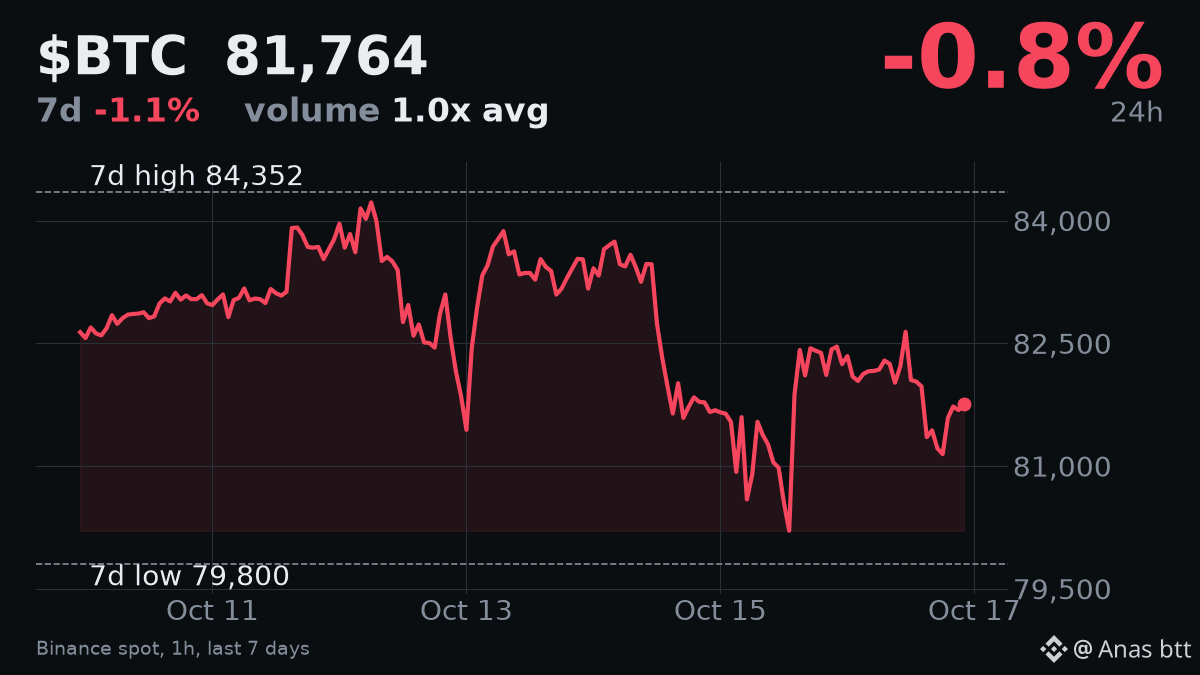
When $BTC is trading at $81,763, its 24-hour volume is $1.23 billion. This volume is 3.5% higher than its 7-day average. Volume shows how much an asset is traded.
When price makes a big move, especially breaking above a resistance level or to a new high, strong volume is important. High volume confirms that many traders are participating in the move, giving it more strength. If $BTC were to break past its 7-day high of $84,352 on low or average volume, it would be a warning sign. Such moves often fail because there is not enough conviction from buyers. Conversely, a price drop on very high volume can suggest strong selling pressure.
Always look for volume to confirm price action when key levels are tested. 📈
#VolumeAnalysis #TradingBasics
When $BTC is trading at $81,763, its 24-hour volume is $1.23 billion. This volume is 3.5% higher than its 7-day average. Volume shows how much an asset is traded.
When price makes a big move, especially breaking above a resistance level or to a new high, strong volume is important. High volume confirms that many traders are participating in the move, giving it more strength. If $BTC were to break past its 7-day high of $84,352 on low or average volume, it would be a warning sign. Such moves often fail because there is not enough conviction from buyers. Conversely, a price drop on very high volume can suggest strong selling pressure.
Always look for volume to confirm price action when key levels are tested. 📈
#VolumeAnalysis #TradingBasics
When price makes a big move, especially breaking above a resistance level or to a new high, strong volume is important. High volume confirms that many traders are participating in the move, giving it more strength. If $BTC were to break past its 7-day high of $84,352 on low or average volume, it would be a warning sign. Such moves often fail because there is not enough conviction from buyers. Conversely, a price drop on very high volume can suggest strong selling pressure.
Always look for volume to confirm price action when key levels are tested. 📈
#VolumeAnalysis #TradingBasics
52
Did you know a sudden surge in volume can validate a price breakout?
$ZEC is up +11.2% in the last 24 hours, trading around $1,226.92 with a 24h volume of $227 M. The price jump alone could be a false signal, but the massive volume confirms strong buying interest—meaning the move is less likely to be a short‑term pump and more likely to sustain. When volume spikes alongside price, it shows that real market participants are behind the action, reducing the risk of a rapid reversal.
What other clues do you check before riding a breakout?
We post every algo signal's REAL result openly and the full live track record + a free preview channel are in our bio/profile. #CryptoEducation #VolumeAnalysis
Did you know a sudden surge in volume can validate a price breakout?
$ZEC is up +11.2% in the last 24 hours, trading around $1,226.92 with a 24h volume of $227 M. The price jump alone could be a false signal, but the massive volume confirms strong buying interest—meaning the move is less likely to be a short‑term pump and more likely to sustain. When volume spikes alongside price, it shows that real market participants are behind the action, reducing the risk of a rapid reversal.
What other clues do you check before riding a breakout?
We post every algo signal's REAL result openly and the full live track record + a free preview channel are in our bio/profile. #CryptoEducation #VolumeAnalysis
$ZEC is up +11.2% in the last 24 hours, trading around $1,226.92 with a 24h volume of $227 M. The price jump alone could be a false signal, but the massive volume confirms strong buying interest—meaning the move is less likely to be a short‑term pump and more likely to sustain. When volume spikes alongside price, it shows that real market participants are behind the action, reducing the risk of a rapid reversal.
What other clues do you check before riding a breakout?
We post every algo signal's REAL result openly and the full live track record + a free preview channel are in our bio/profile. #CryptoEducation #VolumeAnalysis
74
Log in to explore more content
Join global crypto users on Binance Square
⚡️ Get latest and useful information about crypto.
💬 Trusted by the world’s largest crypto exchange.
👍 Discover real insights from verified creators.
Email / Phone number
Trending Topics
1
#BinancePick
2.9M views
150,602 Discussing
2
#EarningsSeason
5.2M views
25,662 Discussing
3
#AnthropicTTMRevenueGrewAbout1200%
12,328 views
288 Discussing
4
#AnthropicS1ExpectedToday
15,393 views
266 Discussing
5
#SouthKoreaReportedlyWeighsFourthCryptoTaxDelay
22,213 views
394 Discussing
6
#FranklinTempletonFilesForTwoDividendToBitcoinETFs
29,506 views
488 Discussing
7
#StrategyMSTRSurpassesNasdaqInMarketCap
22,916 views
354 Discussing
8
#CanadaProposesStablecoinRedemptionWithin3BusinessDays
1,060 views
34 Discussing
9
#ElectrumWalletBugLetRogueServersStealFunds
25,201 views
438 Discussing
10
#ArgentineCourtDismissesLIBRACaseAgainstMilei
38,395 views
540 Discussing