
#tradingperformance
tradingperformance
10,780 views
36 Discussing
Hot
Latest

·
--
Bullish
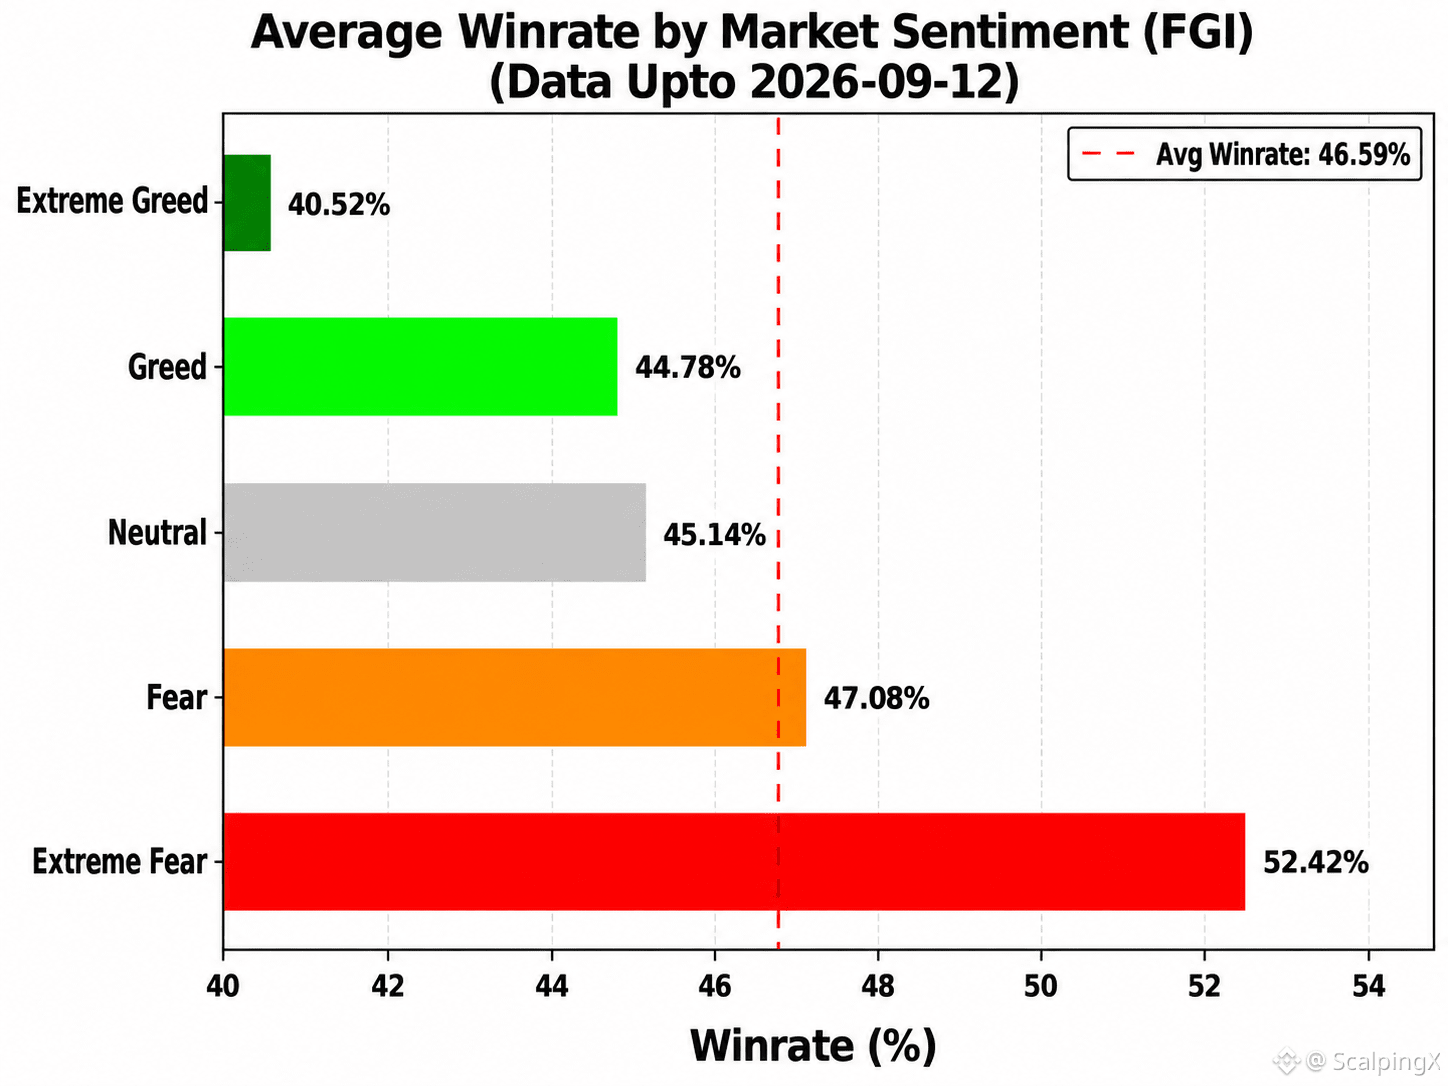
📊 TRADING PERFORMANCE & MARKET SENTIMENT INDEX (FGI) REPORT – UPDATED 12/09/2026
The latest statistical data shows that the correlation between the FGI and Win Rate remains weak and continues to lean negative, at approximately r ≈ -0.293. This suggests that FGI is not suitable as a standalone tool for determining order entries, but it still provides value for risk assessment. Trading performance generally tends to weaken as market sentiment moves into extreme optimism, making FGI more useful as an early risk-warning indicator rather than a signal for expanding profit targets.
Below is a summary of Win Rate (WR), minimum breakeven R:R, and number of recorded days (n) across sentiment zones for reference:
🤑 Extreme Greed (≥80): WR 40.5% • R:R=1:1.47 • n=25
🤤 Greed (60–80): WR 44.8% • R:R=1:1.23 • n=238
😐 Neutral (40–60): WR 45.1% • R:R=1:1.22 • n=153
😰 Fear (20–40): WR 47.1% • R:R=1:1.12 • n=271
😱 Extreme Fear (<20): WR 52.4% • R:R=1:0.91 • n=115
Share of days with performance above the overall average of 46.59% by sentiment zone:
🤑 Extreme Greed: 8.0%
🤤 Greed: 35.7%
😐 Neutral: 38.6%
😰 Fear: 55.0%
😱 Extreme Fear: 67.8%
➤ Scalpers can use FGI as a guideline to adjust expected profit targets when entering trades:
📈 When FGI is high, higher profit targets may be needed to maintain a sufficiently large R:R and compensate for the decline in win rate.
📉 When FGI is low, lower profit targets may be appropriate to increase capital turnover and make profit realization easier.
#TradingPerformance $ONE
📊 TRADING PERFORMANCE & MARKET SENTIMENT INDEX (FGI) REPORT – UPDATED 12/09/2026
The latest statistical data shows that the correlation between the FGI and Win Rate remains weak and continues to lean negative, at approximately r ≈ -0.293. This suggests that FGI is not suitable as a standalone tool for determining order entries, but it still provides value for risk assessment. Trading performance generally tends to weaken as market sentiment moves into extreme optimism, making FGI more useful as an early risk-warning indicator rather than a signal for expanding profit targets.
Below is a summary of Win Rate (WR), minimum breakeven R:R, and number of recorded days (n) across sentiment zones for reference:
🤑 Extreme Greed (≥80): WR 40.5% • R:R=1:1.47 • n=25
🤤 Greed (60–80): WR 44.8% • R:R=1:1.23 • n=238
😐 Neutral (40–60): WR 45.1% • R:R=1:1.22 • n=153
😰 Fear (20–40): WR 47.1% • R:R=1:1.12 • n=271
😱 Extreme Fear (<20): WR 52.4% • R:R=1:0.91 • n=115
Share of days with performance above the overall average of 46.59% by sentiment zone:
🤑 Extreme Greed: 8.0%
🤤 Greed: 35.7%
😐 Neutral: 38.6%
😰 Fear: 55.0%
😱 Extreme Fear: 67.8%
➤ Scalpers can use FGI as a guideline to adjust expected profit targets when entering trades:
📈 When FGI is high, higher profit targets may be needed to maintain a sufficiently large R:R and compensate for the decline in win rate.
📉 When FGI is low, lower profit targets may be appropriate to increase capital turnover and make profit realization easier.
#TradingPerformance $ONE
The latest statistical data shows that the correlation between the FGI and Win Rate remains weak and continues to lean negative, at approximately r ≈ -0.293. This suggests that FGI is not suitable as a standalone tool for determining order entries, but it still provides value for risk assessment. Trading performance generally tends to weaken as market sentiment moves into extreme optimism, making FGI more useful as an early risk-warning indicator rather than a signal for expanding profit targets.
Below is a summary of Win Rate (WR), minimum breakeven R:R, and number of recorded days (n) across sentiment zones for reference:
🤑 Extreme Greed (≥80): WR 40.5% • R:R=1:1.47 • n=25
🤤 Greed (60–80): WR 44.8% • R:R=1:1.23 • n=238
😐 Neutral (40–60): WR 45.1% • R:R=1:1.22 • n=153
😰 Fear (20–40): WR 47.1% • R:R=1:1.12 • n=271
😱 Extreme Fear (<20): WR 52.4% • R:R=1:0.91 • n=115
Share of days with performance above the overall average of 46.59% by sentiment zone:
🤑 Extreme Greed: 8.0%
🤤 Greed: 35.7%
😐 Neutral: 38.6%
😰 Fear: 55.0%
😱 Extreme Fear: 67.8%
➤ Scalpers can use FGI as a guideline to adjust expected profit targets when entering trades:
📈 When FGI is high, higher profit targets may be needed to maintain a sufficiently large R:R and compensate for the decline in win rate.
📉 When FGI is low, lower profit targets may be appropriate to increase capital turnover and make profit realization easier.
#TradingPerformance $ONE
22
·
--
Bullish
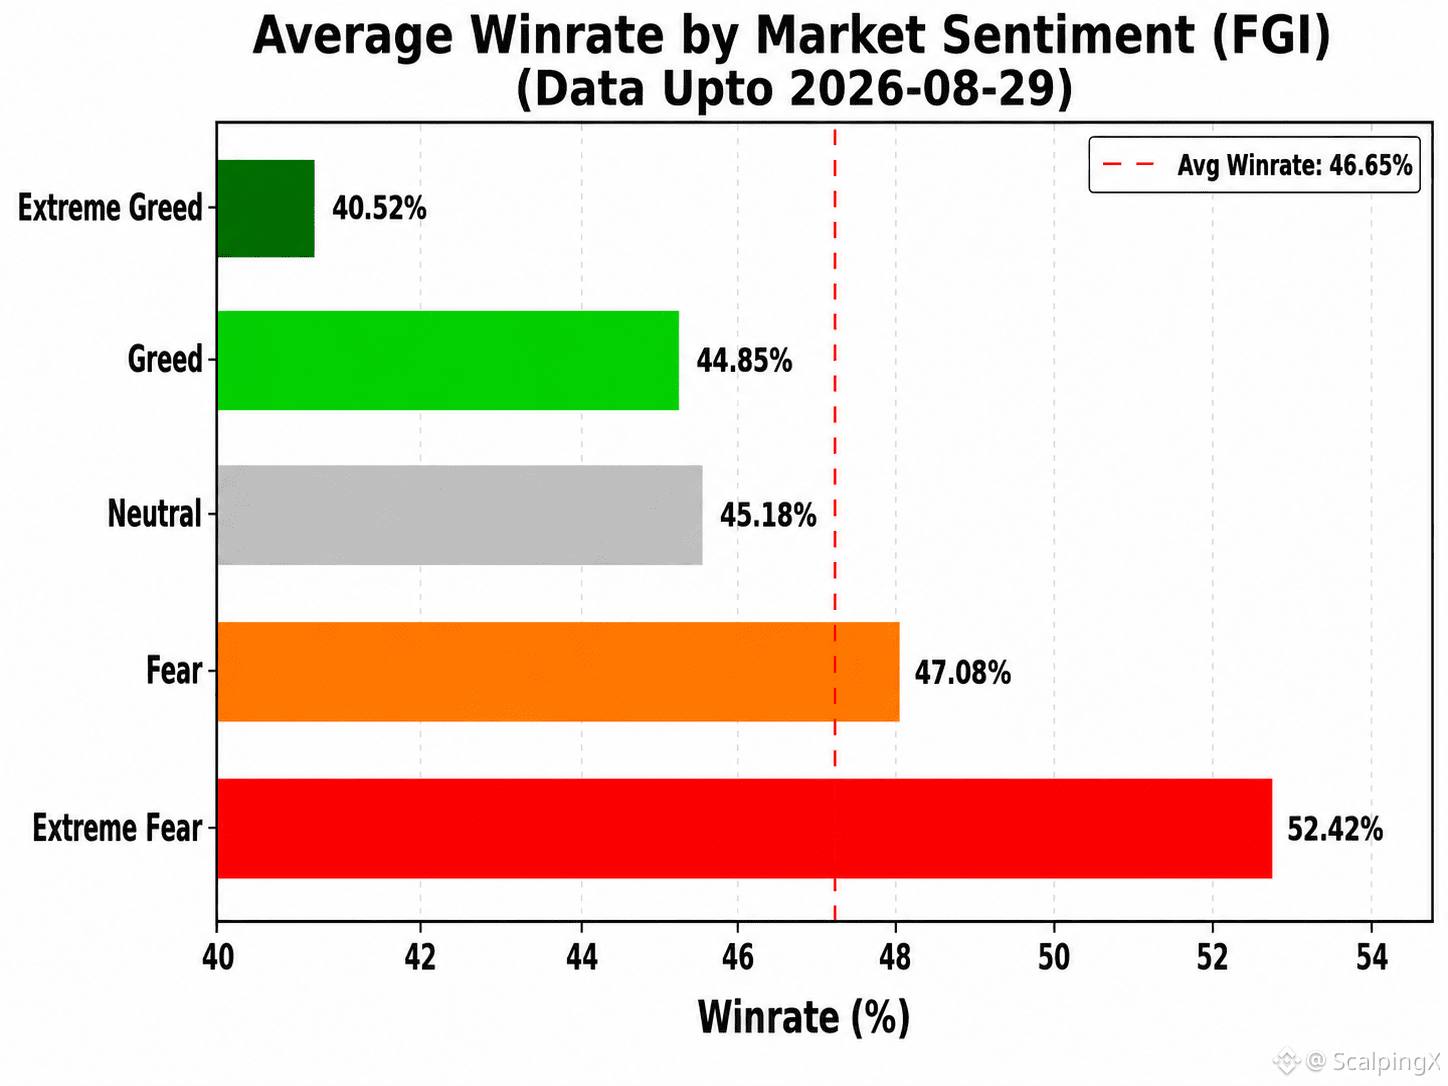
📊 TRADING PERFORMANCE & MARKET SENTIMENT INDEX (FGI) REPORT – UPDATED 2026-08-29
The latest statistics show that the correlation between the FGI and Win Rate remains weak and continues to lean negative, at approximately r ≈ -0.290. This suggests that FGI is not suitable as a standalone tool for determining order entries, but it still provides value for risk assessment. Trading performance generally tends to weaken as market sentiment moves into extreme euphoria, making FGI more useful as an early risk-warning indicator than as a signal for expanding profit targets.
Below is a summary of Win Rate (WR), minimum breakeven R:R, and number of recorded days (n) across sentiment zones:
🤑 Extreme Greed (≥80): WR 40.5% • R:R=1:1.47 • n=25
🤤 Greed (60–80): WR 44.9% • R:R=1:1.23 • n=225
😐 Neutral (40–60): WR 45.2% • R:R=1:1.21 • n=152
😰 Fear (20–40): WR 47.1% • R:R=1:1.12 • n=271
😱 Extreme Fear (<20): WR 52.4% • R:R=1:0.91 • n=115
Share of days with performance above the overall average of 46.65% by sentiment zone:
🤑 Extreme Greed: 8.0%
🤤 Greed: 35.6%
😐 Neutral: 38.8%
😰 Fear: 55.0%
😱 Extreme Fear: 67.8%
➤ Scalpers can use FGI as a guide to adjust expected profit targets when entering trades:
📈 When FGI is high, traders may need to raise profit expectations to maintain a sufficiently large R:R ratio, helping offset the risk associated with a lower win rate.
📉 When FGI is low, traders may reduce profit expectations to increase capital turnover and make profit realization easier.
#TradingPerformance $BTC $ETH $SOL
📊 TRADING PERFORMANCE & MARKET SENTIMENT INDEX (FGI) REPORT – UPDATED 2026-08-29
The latest statistics show that the correlation between the FGI and Win Rate remains weak and continues to lean negative, at approximately r ≈ -0.290. This suggests that FGI is not suitable as a standalone tool for determining order entries, but it still provides value for risk assessment. Trading performance generally tends to weaken as market sentiment moves into extreme euphoria, making FGI more useful as an early risk-warning indicator than as a signal for expanding profit targets.
Below is a summary of Win Rate (WR), minimum breakeven R:R, and number of recorded days (n) across sentiment zones:
🤑 Extreme Greed (≥80): WR 40.5% • R:R=1:1.47 • n=25
🤤 Greed (60–80): WR 44.9% • R:R=1:1.23 • n=225
😐 Neutral (40–60): WR 45.2% • R:R=1:1.21 • n=152
😰 Fear (20–40): WR 47.1% • R:R=1:1.12 • n=271
😱 Extreme Fear (<20): WR 52.4% • R:R=1:0.91 • n=115
Share of days with performance above the overall average of 46.65% by sentiment zone:
🤑 Extreme Greed: 8.0%
🤤 Greed: 35.6%
😐 Neutral: 38.8%
😰 Fear: 55.0%
😱 Extreme Fear: 67.8%
➤ Scalpers can use FGI as a guide to adjust expected profit targets when entering trades:
📈 When FGI is high, traders may need to raise profit expectations to maintain a sufficiently large R:R ratio, helping offset the risk associated with a lower win rate.
📉 When FGI is low, traders may reduce profit expectations to increase capital turnover and make profit realization easier.
#TradingPerformance $BTC $ETH $SOL
The latest statistics show that the correlation between the FGI and Win Rate remains weak and continues to lean negative, at approximately r ≈ -0.290. This suggests that FGI is not suitable as a standalone tool for determining order entries, but it still provides value for risk assessment. Trading performance generally tends to weaken as market sentiment moves into extreme euphoria, making FGI more useful as an early risk-warning indicator than as a signal for expanding profit targets.
Below is a summary of Win Rate (WR), minimum breakeven R:R, and number of recorded days (n) across sentiment zones:
🤑 Extreme Greed (≥80): WR 40.5% • R:R=1:1.47 • n=25
🤤 Greed (60–80): WR 44.9% • R:R=1:1.23 • n=225
😐 Neutral (40–60): WR 45.2% • R:R=1:1.21 • n=152
😰 Fear (20–40): WR 47.1% • R:R=1:1.12 • n=271
😱 Extreme Fear (<20): WR 52.4% • R:R=1:0.91 • n=115
Share of days with performance above the overall average of 46.65% by sentiment zone:
🤑 Extreme Greed: 8.0%
🤤 Greed: 35.6%
😐 Neutral: 38.8%
😰 Fear: 55.0%
😱 Extreme Fear: 67.8%
➤ Scalpers can use FGI as a guide to adjust expected profit targets when entering trades:
📈 When FGI is high, traders may need to raise profit expectations to maintain a sufficiently large R:R ratio, helping offset the risk associated with a lower win rate.
📉 When FGI is low, traders may reduce profit expectations to increase capital turnover and make profit realization easier.
#TradingPerformance $BTC $ETH $SOL
55
·
--
Bullish
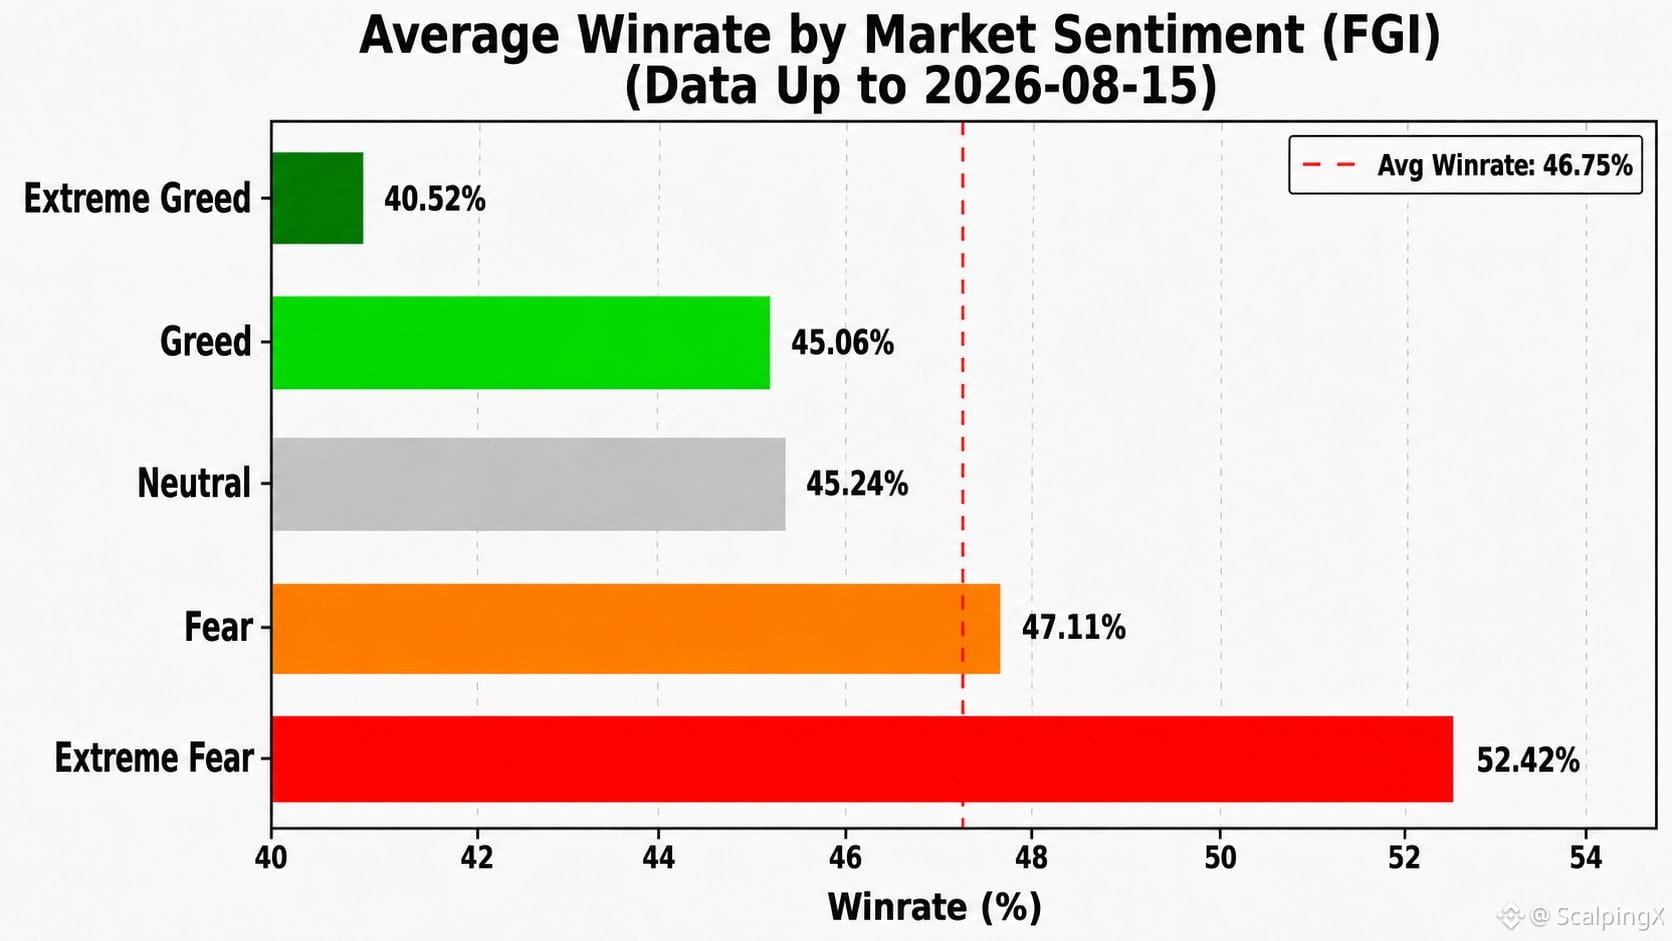
📊 TRADING PERFORMANCE & FEAR AND GREED INDEX (FGI) REPORT – UPDATED 15/08/2026
The latest statistical data shows that the correlation between FGI and Win Rate remains weak and continues to lean negative, with r ≈ -0.285. This suggests that FGI is not suitable as a standalone tool for determining order entries, but it can still be useful for quantifying risk. Trading performance generally tends to deteriorate as market sentiment moves into extreme optimism, making FGI more appropriate as an early risk-warning indicator rather than a signal for expanding profit expectations.
Below is a summary of Win Rate (WR), minimum breakeven R:R, and the number of recorded days (n) across different sentiment zones:
🤑 Extreme Greed (≥80): WR 40.5% • R:R=1:1.47 • n=25
🤤 Greed (60–80): WR 45.1% • R:R=1:1.22 • n=215
😐 Neutral (40–60): WR 45.2% • R:R=1:1.21 • n=150
😰 Fear (20–40): WR 47.1% • R:R=1:1.12 • n=269
😱 Extreme Fear (<20): WR 52.4% • R:R=1:0.91 • n=115
The percentage of days with performance above the overall average win rate of 46.75% by sentiment zone:
🤑 Extreme Greed: 8.0%
🤤 Greed: 36.3%
😐 Neutral: 38.0%
😰 Fear: 53.9%
😱 Extreme Fear: 67.8%
➤ Short-term traders can use FGI as a guide for adjusting expected profit targets when entering trades:
📈 When FGI is high, higher profit expectations may be required to maintain a sufficiently favorable R:R ratio and compensate for the lower win rate.
📉 When FGI is low, profit expectations can be reduced to increase capital turnover and make profit realization easier.
#TradingPerformance $GRAM $NVDAB $AAPLB
📊 TRADING PERFORMANCE & FEAR AND GREED INDEX (FGI) REPORT – UPDATED 15/08/2026
The latest statistical data shows that the correlation between FGI and Win Rate remains weak and continues to lean negative, with r ≈ -0.285. This suggests that FGI is not suitable as a standalone tool for determining order entries, but it can still be useful for quantifying risk. Trading performance generally tends to deteriorate as market sentiment moves into extreme optimism, making FGI more appropriate as an early risk-warning indicator rather than a signal for expanding profit expectations.
Below is a summary of Win Rate (WR), minimum breakeven R:R, and the number of recorded days (n) across different sentiment zones:
🤑 Extreme Greed (≥80): WR 40.5% • R:R=1:1.47 • n=25
🤤 Greed (60–80): WR 45.1% • R:R=1:1.22 • n=215
😐 Neutral (40–60): WR 45.2% • R:R=1:1.21 • n=150
😰 Fear (20–40): WR 47.1% • R:R=1:1.12 • n=269
😱 Extreme Fear (<20): WR 52.4% • R:R=1:0.91 • n=115
The percentage of days with performance above the overall average win rate of 46.75% by sentiment zone:
🤑 Extreme Greed: 8.0%
🤤 Greed: 36.3%
😐 Neutral: 38.0%
😰 Fear: 53.9%
😱 Extreme Fear: 67.8%
➤ Short-term traders can use FGI as a guide for adjusting expected profit targets when entering trades:
📈 When FGI is high, higher profit expectations may be required to maintain a sufficiently favorable R:R ratio and compensate for the lower win rate.
📉 When FGI is low, profit expectations can be reduced to increase capital turnover and make profit realization easier.
#TradingPerformance $GRAM $NVDAB $AAPLB
The latest statistical data shows that the correlation between FGI and Win Rate remains weak and continues to lean negative, with r ≈ -0.285. This suggests that FGI is not suitable as a standalone tool for determining order entries, but it can still be useful for quantifying risk. Trading performance generally tends to deteriorate as market sentiment moves into extreme optimism, making FGI more appropriate as an early risk-warning indicator rather than a signal for expanding profit expectations.
Below is a summary of Win Rate (WR), minimum breakeven R:R, and the number of recorded days (n) across different sentiment zones:
🤑 Extreme Greed (≥80): WR 40.5% • R:R=1:1.47 • n=25
🤤 Greed (60–80): WR 45.1% • R:R=1:1.22 • n=215
😐 Neutral (40–60): WR 45.2% • R:R=1:1.21 • n=150
😰 Fear (20–40): WR 47.1% • R:R=1:1.12 • n=269
😱 Extreme Fear (<20): WR 52.4% • R:R=1:0.91 • n=115
The percentage of days with performance above the overall average win rate of 46.75% by sentiment zone:
🤑 Extreme Greed: 8.0%
🤤 Greed: 36.3%
😐 Neutral: 38.0%
😰 Fear: 53.9%
😱 Extreme Fear: 67.8%
➤ Short-term traders can use FGI as a guide for adjusting expected profit targets when entering trades:
📈 When FGI is high, higher profit expectations may be required to maintain a sufficiently favorable R:R ratio and compensate for the lower win rate.
📉 When FGI is low, profit expectations can be reduced to increase capital turnover and make profit realization easier.
#TradingPerformance $GRAM $NVDAB $AAPLB
99
·
--
Bullish
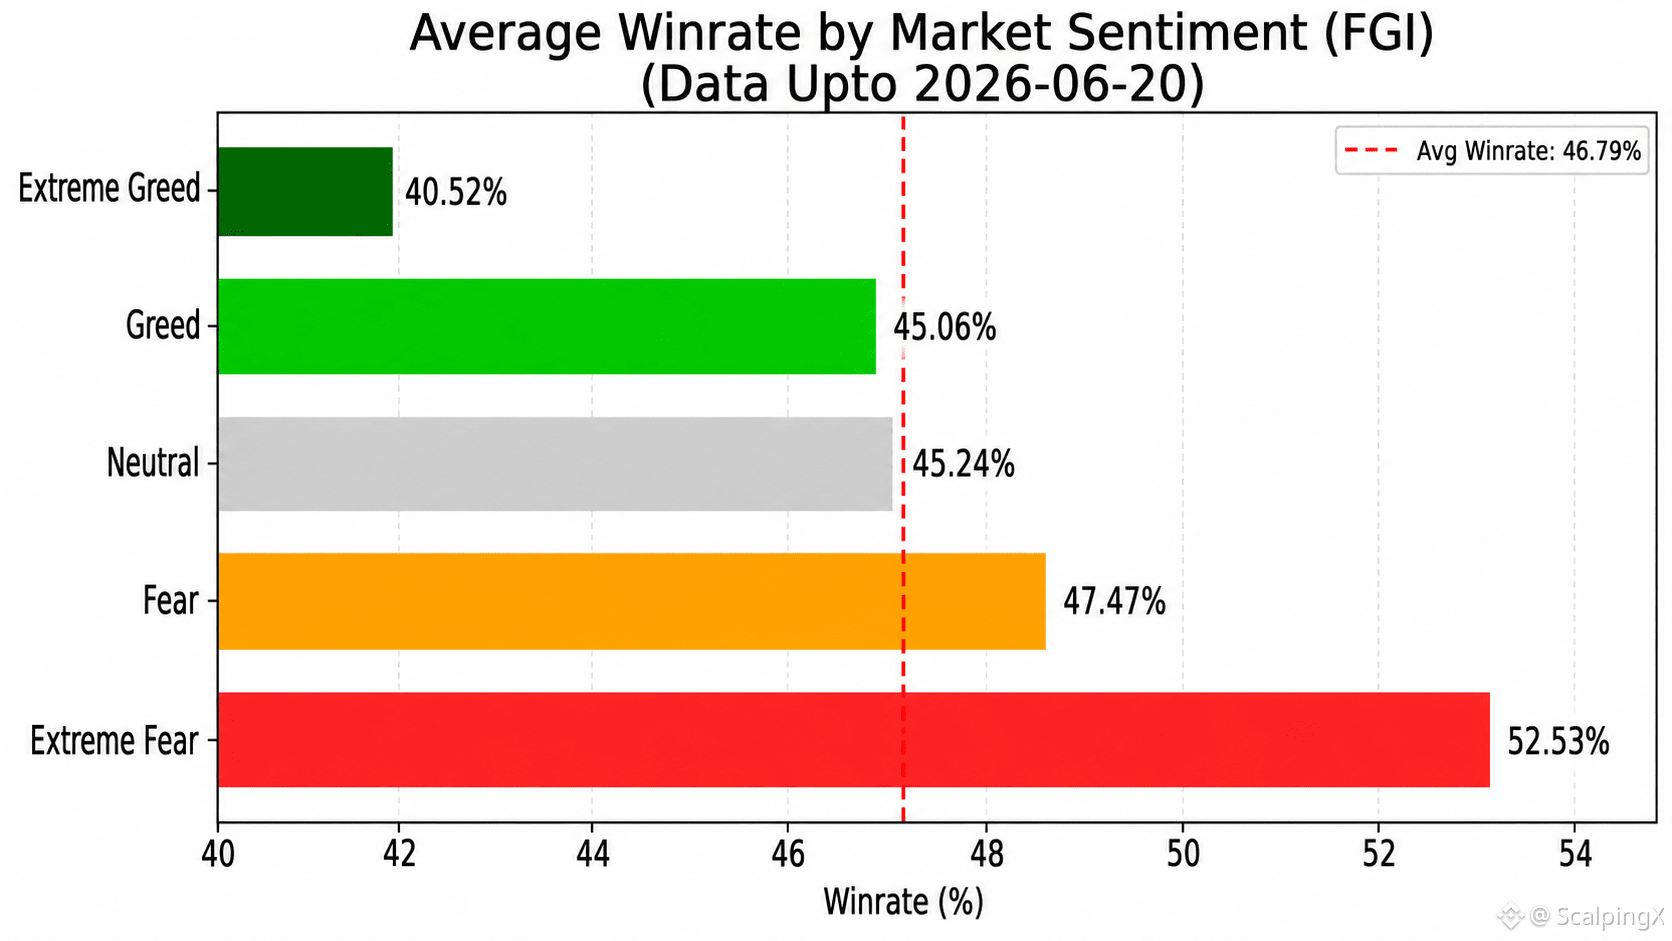
📊 TRADING PERFORMANCE & MARKET SENTIMENT INDEX (FGI) REPORT – UPDATED 20/06/2026
The latest statistical data shows that the correlation between the FGI and Winrate remains low and continues to lean negative (r ~ -0.309). This further reinforces that FGI is not suitable as a tool for predicting price trends or identifying trade entries, but it still has practical value in quantifying position risk. In general, trading performance tends to weaken when market sentiment moves into extreme euphoria, making FGI more useful as an early risk-warning signal rather than a signal to expand profit expectations.
Below is a summary of Winrate (WR), minimum breakeven R:R, and the number of recorded days (n) across sentiment zones for reference:
🤑 Extreme Greed (≥80): WR 40.5% • R:R=1:1.47 • n=25
🤤 Greed (60–80): WR 45.1% • R:R=1:1.22 • n=215
😐 Neutral (40–60): WR 45.2% • R:R=1:1.21 • n=150
😨 Fear (20–40): WR 47.5% • R:R=1:1.11 • n=222
😱 Extreme Fear (<20): WR 52.5% • R:R=1:0.90 • n=106
The percentage of days with performance above the average level of 46.79% by sentiment zone:
🤑 Extreme Greed: 8.0%
🤤 Greed: 36.3%
😐 Neutral: 38.0%
😨 Fear: 54.1%
😱 Extreme Fear: 69.8%
➤ Scalpers can use FGI as a guide to adjust expected profit targets when entering trades:
📈 When FGI is high, expected profit targets should be raised to ensure the R:R is large enough to compensate for the decline in win rate.
📉 When FGI is low, expected profit targets can be reduced to improve capital turnover speed and make profit-taking easier.
#TradingPerformance $NVDAB $MUB $TSLAB
📊 TRADING PERFORMANCE & MARKET SENTIMENT INDEX (FGI) REPORT – UPDATED 20/06/2026
The latest statistical data shows that the correlation between the FGI and Winrate remains low and continues to lean negative (r ~ -0.309). This further reinforces that FGI is not suitable as a tool for predicting price trends or identifying trade entries, but it still has practical value in quantifying position risk. In general, trading performance tends to weaken when market sentiment moves into extreme euphoria, making FGI more useful as an early risk-warning signal rather than a signal to expand profit expectations.
Below is a summary of Winrate (WR), minimum breakeven R:R, and the number of recorded days (n) across sentiment zones for reference:
🤑 Extreme Greed (≥80): WR 40.5% • R:R=1:1.47 • n=25
🤤 Greed (60–80): WR 45.1% • R:R=1:1.22 • n=215
😐 Neutral (40–60): WR 45.2% • R:R=1:1.21 • n=150
😨 Fear (20–40): WR 47.5% • R:R=1:1.11 • n=222
😱 Extreme Fear (<20): WR 52.5% • R:R=1:0.90 • n=106
The percentage of days with performance above the average level of 46.79% by sentiment zone:
🤑 Extreme Greed: 8.0%
🤤 Greed: 36.3%
😐 Neutral: 38.0%
😨 Fear: 54.1%
😱 Extreme Fear: 69.8%
➤ Scalpers can use FGI as a guide to adjust expected profit targets when entering trades:
📈 When FGI is high, expected profit targets should be raised to ensure the R:R is large enough to compensate for the decline in win rate.
📉 When FGI is low, expected profit targets can be reduced to improve capital turnover speed and make profit-taking easier.
#TradingPerformance $NVDAB $MUB $TSLAB
The latest statistical data shows that the correlation between the FGI and Winrate remains low and continues to lean negative (r ~ -0.309). This further reinforces that FGI is not suitable as a tool for predicting price trends or identifying trade entries, but it still has practical value in quantifying position risk. In general, trading performance tends to weaken when market sentiment moves into extreme euphoria, making FGI more useful as an early risk-warning signal rather than a signal to expand profit expectations.
Below is a summary of Winrate (WR), minimum breakeven R:R, and the number of recorded days (n) across sentiment zones for reference:
🤑 Extreme Greed (≥80): WR 40.5% • R:R=1:1.47 • n=25
🤤 Greed (60–80): WR 45.1% • R:R=1:1.22 • n=215
😐 Neutral (40–60): WR 45.2% • R:R=1:1.21 • n=150
😨 Fear (20–40): WR 47.5% • R:R=1:1.11 • n=222
😱 Extreme Fear (<20): WR 52.5% • R:R=1:0.90 • n=106
The percentage of days with performance above the average level of 46.79% by sentiment zone:
🤑 Extreme Greed: 8.0%
🤤 Greed: 36.3%
😐 Neutral: 38.0%
😨 Fear: 54.1%
😱 Extreme Fear: 69.8%
➤ Scalpers can use FGI as a guide to adjust expected profit targets when entering trades:
📈 When FGI is high, expected profit targets should be raised to ensure the R:R is large enough to compensate for the decline in win rate.
📉 When FGI is low, expected profit targets can be reduced to improve capital turnover speed and make profit-taking easier.
#TradingPerformance $NVDAB $MUB $TSLAB
2
5.5k
·
--
Bullish
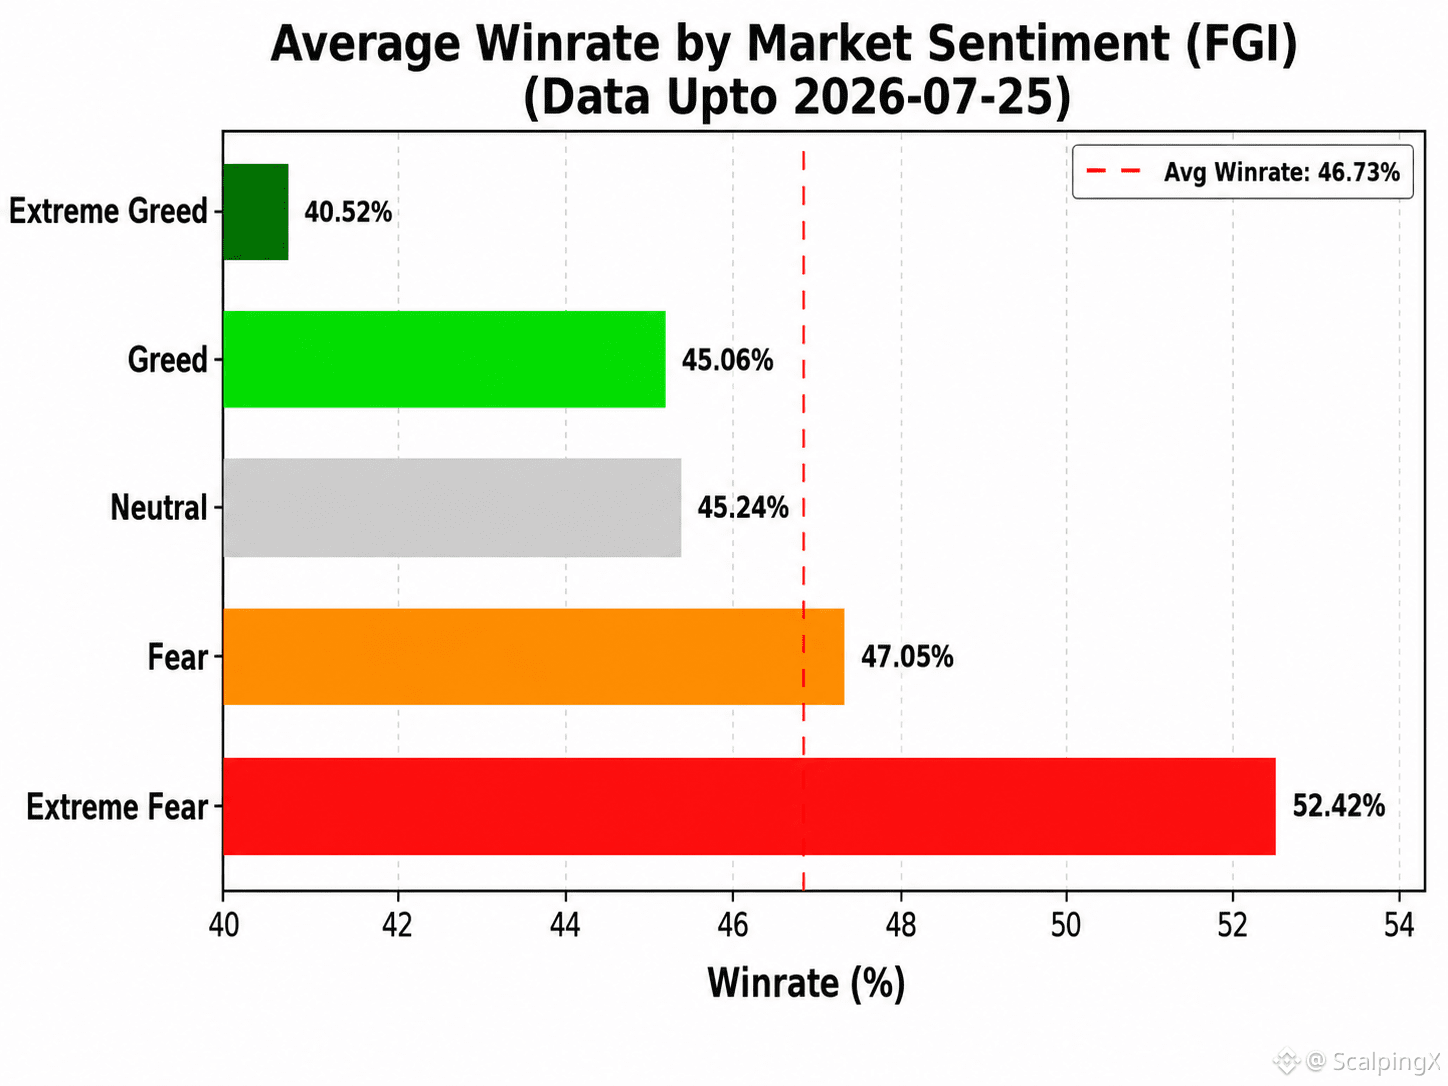
📊 TRADING PERFORMANCE & MARKET SENTIMENT INDEX (FGI) REPORT – UPDATED 25/07/2026
The latest statistics show that the correlation between the FGI and Win Rate remains weak and continues to be negative (r ≈ -0.289). This further supports the view that the FGI is not suitable for predicting price direction or determining entry points. However, it still has practical value for quantifying order risk.
Overall trading performance tends to decline as market sentiment moves into extreme optimism. Therefore, the FGI is better used as an early risk-warning indicator rather than a signal for increasing profit expectations.
Below is a summary of Win Rate (WR), minimum breakeven R:R, and the number of recorded days (n) across each sentiment zone:
🤑 Extreme Greed (≥80): WR 40.5% • R:R = 1:1.47 • n = 25
🤤 Greed (60–80): WR 45.1% • R:R = 1:1.22 • n = 215
😐 Neutral (40–60): WR 45.2% • R:R = 1:1.21 • n = 150
😨 Fear (20–40): WR 47.0% • R:R = 1:1.13 • n = 248
😱 Extreme Fear (<20): WR 52.4% • R:R = 1:0.91 • n = 115
The percentage of days with performance above the overall average of 46.73% in each sentiment zone:
🤑 Extreme Greed: 8.0%
🤤 Greed: 36.3%
😐 Neutral: 38.0%
😨 Fear: 53.2%
😱 Extreme Fear: 67.8%
➤ Short-term traders can use the FGI as a reference for adjusting expected profit targets when entering trades:
📈 When the FGI is high, traders should increase their expected profit target to maintain a sufficiently large R:R and compensate for the lower win rate.
📉 When the FGI is low, traders may reduce their expected profit target to accelerate capital turnover and realize profits more easily.
#TradingPerformance $BNB $SOL $ROBO
📊 TRADING PERFORMANCE & MARKET SENTIMENT INDEX (FGI) REPORT – UPDATED 25/07/2026
The latest statistics show that the correlation between the FGI and Win Rate remains weak and continues to be negative (r ≈ -0.289). This further supports the view that the FGI is not suitable for predicting price direction or determining entry points. However, it still has practical value for quantifying order risk.
Overall trading performance tends to decline as market sentiment moves into extreme optimism. Therefore, the FGI is better used as an early risk-warning indicator rather than a signal for increasing profit expectations.
Below is a summary of Win Rate (WR), minimum breakeven R:R, and the number of recorded days (n) across each sentiment zone:
🤑 Extreme Greed (≥80): WR 40.5% • R:R = 1:1.47 • n = 25
🤤 Greed (60–80): WR 45.1% • R:R = 1:1.22 • n = 215
😐 Neutral (40–60): WR 45.2% • R:R = 1:1.21 • n = 150
😨 Fear (20–40): WR 47.0% • R:R = 1:1.13 • n = 248
😱 Extreme Fear (<20): WR 52.4% • R:R = 1:0.91 • n = 115
The percentage of days with performance above the overall average of 46.73% in each sentiment zone:
🤑 Extreme Greed: 8.0%
🤤 Greed: 36.3%
😐 Neutral: 38.0%
😨 Fear: 53.2%
😱 Extreme Fear: 67.8%
➤ Short-term traders can use the FGI as a reference for adjusting expected profit targets when entering trades:
📈 When the FGI is high, traders should increase their expected profit target to maintain a sufficiently large R:R and compensate for the lower win rate.
📉 When the FGI is low, traders may reduce their expected profit target to accelerate capital turnover and realize profits more easily.
#TradingPerformance $BNB $SOL $ROBO
The latest statistics show that the correlation between the FGI and Win Rate remains weak and continues to be negative (r ≈ -0.289). This further supports the view that the FGI is not suitable for predicting price direction or determining entry points. However, it still has practical value for quantifying order risk.
Overall trading performance tends to decline as market sentiment moves into extreme optimism. Therefore, the FGI is better used as an early risk-warning indicator rather than a signal for increasing profit expectations.
Below is a summary of Win Rate (WR), minimum breakeven R:R, and the number of recorded days (n) across each sentiment zone:
🤑 Extreme Greed (≥80): WR 40.5% • R:R = 1:1.47 • n = 25
🤤 Greed (60–80): WR 45.1% • R:R = 1:1.22 • n = 215
😐 Neutral (40–60): WR 45.2% • R:R = 1:1.21 • n = 150
😨 Fear (20–40): WR 47.0% • R:R = 1:1.13 • n = 248
😱 Extreme Fear (<20): WR 52.4% • R:R = 1:0.91 • n = 115
The percentage of days with performance above the overall average of 46.73% in each sentiment zone:
🤑 Extreme Greed: 8.0%
🤤 Greed: 36.3%
😐 Neutral: 38.0%
😨 Fear: 53.2%
😱 Extreme Fear: 67.8%
➤ Short-term traders can use the FGI as a reference for adjusting expected profit targets when entering trades:
📈 When the FGI is high, traders should increase their expected profit target to maintain a sufficiently large R:R and compensate for the lower win rate.
📉 When the FGI is low, traders may reduce their expected profit target to accelerate capital turnover and realize profits more easily.
#TradingPerformance $BNB $SOL $ROBO
235
·
--
Bullish
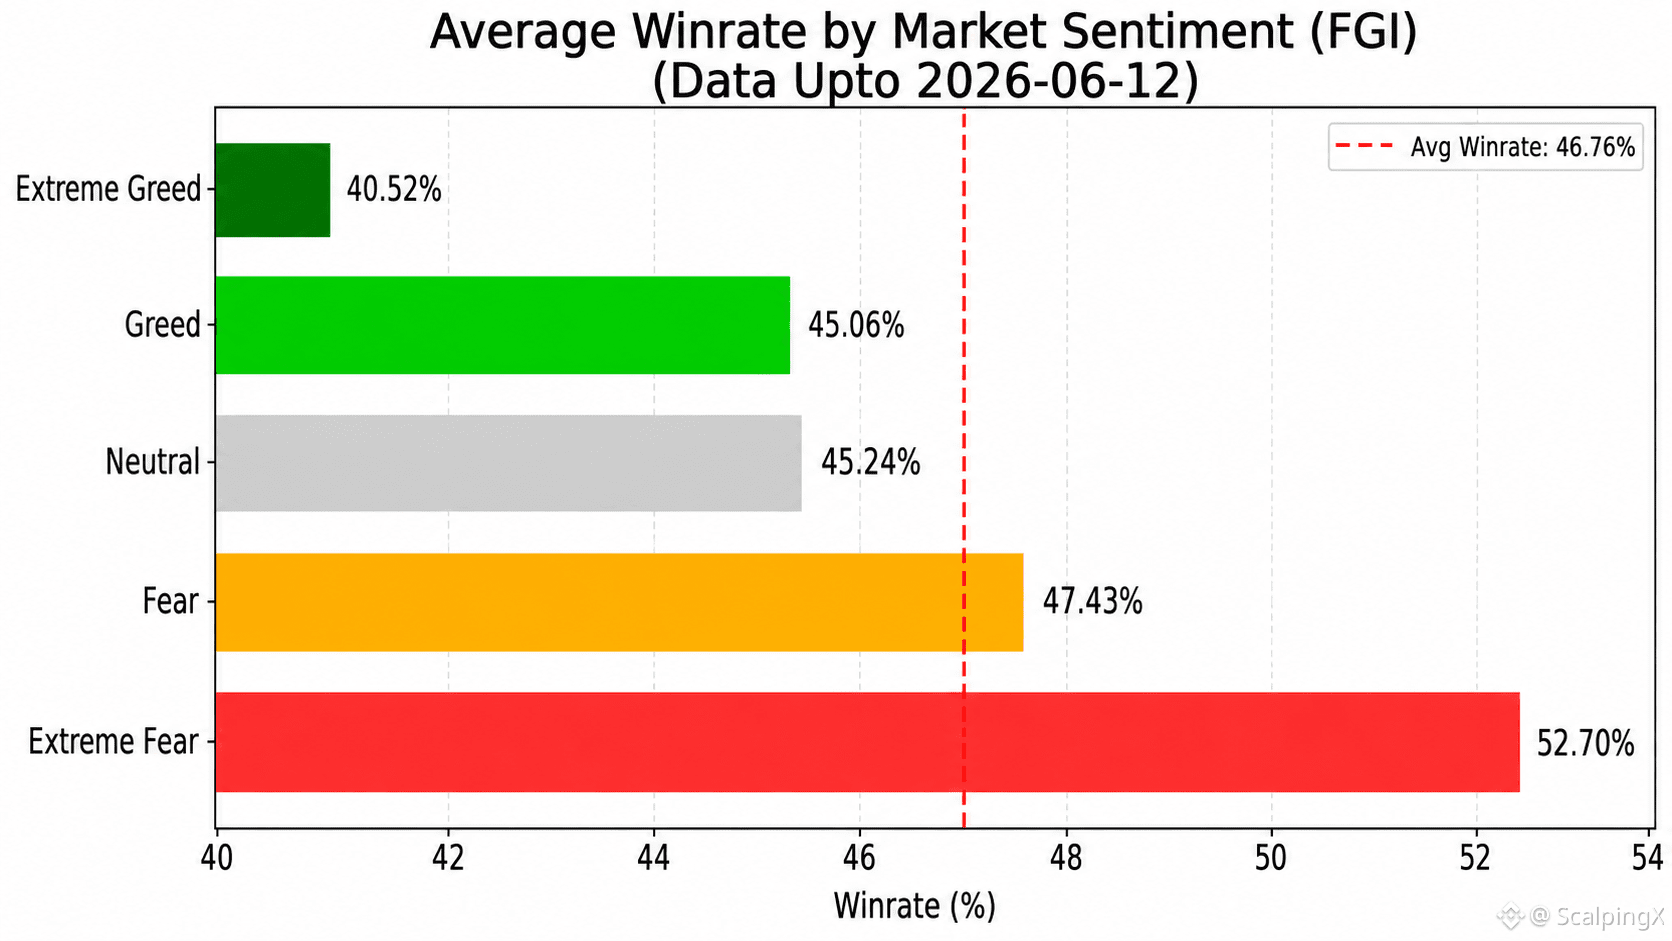
📊 TRADING PERFORMANCE & MARKET SENTIMENT INDEX (FGI) REPORT – UPDATED 2026-06-12
The latest statistics show that the correlation between FGI and Winrate remains low and continues to lean negative (r ~ -0.312). This further supports the view that FGI is not suitable as a tool for predicting price trends or identifying trade entries, but it still has practical value in quantifying position risk. In particular, trading performance generally tends to weaken when market sentiment moves into extreme excitement, so FGI is better used as an early risk-warning signal rather than a signal to expand profit expectations.
Below is a summary of Winrate (WR), minimum breakeven R:R, and the number of recorded days (n) across sentiment zones:
🤑 Extreme Greed (≥80): WR 40.5% • R:R=1:1.47 • n=25
🤤 Greed (60–80): WR 45.1% • R:R=1:1.22 • n=215
😐 Neutral (40–60): WR 45.2% • R:R=1:1.21 • n=150
😨 Fear (20–40): WR 47.4% • R:R=1:1.11 • n=218
😱 Extreme Fear (<20): WR 52.7% • R:R=1:0.90 • n=102
Share of days with performance above the average level of 46.76% by sentiment zone:
🤑 Extreme Greed: 8.0%
🤤 Greed: 36.3%
😐 Neutral: 38.0%
😨 Fear: 53.7%
😱 Extreme Fear: 70.6%
➤ Scalpers can use FGI as a guide to adjust expected profit targets when entering trades:
📈 When FGI is high, profit expectations need to be raised to maintain a sufficient R:R ratio, helping offset the risk of a lower win rate.
📉 When FGI is low, profit expectations can be reduced to improve capital turnover speed and make profit realization easier.
#TradingPerformance #MarketSentiment $BTC $NVDAB $SPCXB
📊 TRADING PERFORMANCE & MARKET SENTIMENT INDEX (FGI) REPORT – UPDATED 2026-06-12
The latest statistics show that the correlation between FGI and Winrate remains low and continues to lean negative (r ~ -0.312). This further supports the view that FGI is not suitable as a tool for predicting price trends or identifying trade entries, but it still has practical value in quantifying position risk. In particular, trading performance generally tends to weaken when market sentiment moves into extreme excitement, so FGI is better used as an early risk-warning signal rather than a signal to expand profit expectations.
Below is a summary of Winrate (WR), minimum breakeven R:R, and the number of recorded days (n) across sentiment zones:
🤑 Extreme Greed (≥80): WR 40.5% • R:R=1:1.47 • n=25
🤤 Greed (60–80): WR 45.1% • R:R=1:1.22 • n=215
😐 Neutral (40–60): WR 45.2% • R:R=1:1.21 • n=150
😨 Fear (20–40): WR 47.4% • R:R=1:1.11 • n=218
😱 Extreme Fear (<20): WR 52.7% • R:R=1:0.90 • n=102
Share of days with performance above the average level of 46.76% by sentiment zone:
🤑 Extreme Greed: 8.0%
🤤 Greed: 36.3%
😐 Neutral: 38.0%
😨 Fear: 53.7%
😱 Extreme Fear: 70.6%
➤ Scalpers can use FGI as a guide to adjust expected profit targets when entering trades:
📈 When FGI is high, profit expectations need to be raised to maintain a sufficient R:R ratio, helping offset the risk of a lower win rate.
📉 When FGI is low, profit expectations can be reduced to improve capital turnover speed and make profit realization easier.
#TradingPerformance #MarketSentiment $BTC $NVDAB $SPCXB
The latest statistics show that the correlation between FGI and Winrate remains low and continues to lean negative (r ~ -0.312). This further supports the view that FGI is not suitable as a tool for predicting price trends or identifying trade entries, but it still has practical value in quantifying position risk. In particular, trading performance generally tends to weaken when market sentiment moves into extreme excitement, so FGI is better used as an early risk-warning signal rather than a signal to expand profit expectations.
Below is a summary of Winrate (WR), minimum breakeven R:R, and the number of recorded days (n) across sentiment zones:
🤑 Extreme Greed (≥80): WR 40.5% • R:R=1:1.47 • n=25
🤤 Greed (60–80): WR 45.1% • R:R=1:1.22 • n=215
😐 Neutral (40–60): WR 45.2% • R:R=1:1.21 • n=150
😨 Fear (20–40): WR 47.4% • R:R=1:1.11 • n=218
😱 Extreme Fear (<20): WR 52.7% • R:R=1:0.90 • n=102
Share of days with performance above the average level of 46.76% by sentiment zone:
🤑 Extreme Greed: 8.0%
🤤 Greed: 36.3%
😐 Neutral: 38.0%
😨 Fear: 53.7%
😱 Extreme Fear: 70.6%
➤ Scalpers can use FGI as a guide to adjust expected profit targets when entering trades:
📈 When FGI is high, profit expectations need to be raised to maintain a sufficient R:R ratio, helping offset the risk of a lower win rate.
📉 When FGI is low, profit expectations can be reduced to improve capital turnover speed and make profit realization easier.
#TradingPerformance #MarketSentiment $BTC $NVDAB $SPCXB
71
·
--
Bullish
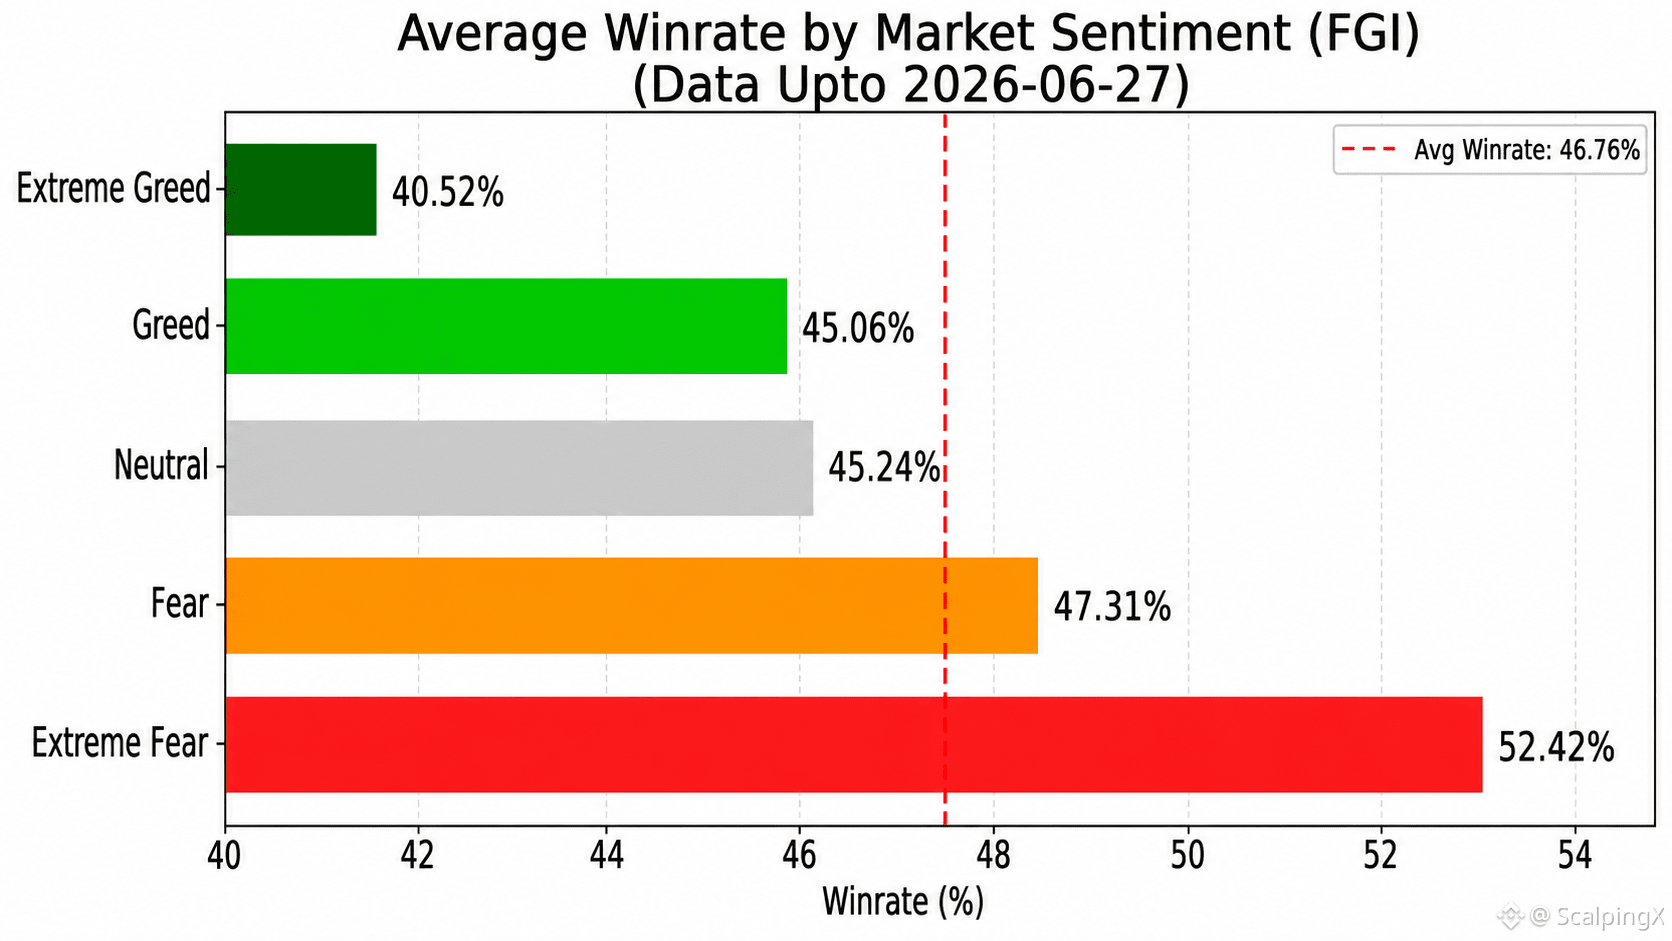
📊 TRADING PERFORMANCE & FEAR AND GREED INDEX (FGI) REPORT – UPDATED 27/06/2026
The latest statistical data shows that the correlation between FGI and Winrate remains low and continues to lean negative (r ~ -0.299). This reinforces the view that FGI is not suitable as a tool for forecasting price direction or identifying entry points, but it still has practical value in measuring position risk. In general, trading performance tends to decline when market sentiment enters extreme euphoria, making FGI more useful as an early risk-warning signal rather than a signal for expanding profit expectations.
Below is a summary of Winrate (WR), minimum breakeven R:R, and number of recorded days (n) across sentiment zones:
🤑 Extreme Greed (≥80): WR 40.5% • R:R=1:1.47 • n=25
🤤 Greed (60–80): WR 45.1% • R:R=1:1.22 • n=215
😐 Neutral (40–60): WR 45.2% • R:R=1:1.21 • n=150
😨 Fear (20–40): WR 47.3% • R:R=1:1.11 • n=225
😱 Extreme Fear (<20): WR 52.4% • R:R=1:0.91 • n=110
Percentage of days with performance above the average level (46.76%) by sentiment zone:
🤑 Extreme Greed: 8.0%
🤤 Greed: 36.3%
😐 Neutral: 38.0%
😨 Fear: 53.8%
😱 Extreme Fear: 68.2%
➤ Scalpers can use FGI as a guide to adjust expected profit targets when entering trades:
📈 When FGI is high, traders should require a higher profit target to maintain a sufficient R:R and offset the risk of a lower win rate.
📉 When FGI is low, traders may lower profit expectations to improve capital rotation speed and make profit realization easier.
#TradingPerformance $BTC $ETH $SOL
📊 TRADING PERFORMANCE & FEAR AND GREED INDEX (FGI) REPORT – UPDATED 27/06/2026
The latest statistical data shows that the correlation between FGI and Winrate remains low and continues to lean negative (r ~ -0.299). This reinforces the view that FGI is not suitable as a tool for forecasting price direction or identifying entry points, but it still has practical value in measuring position risk. In general, trading performance tends to decline when market sentiment enters extreme euphoria, making FGI more useful as an early risk-warning signal rather than a signal for expanding profit expectations.
Below is a summary of Winrate (WR), minimum breakeven R:R, and number of recorded days (n) across sentiment zones:
🤑 Extreme Greed (≥80): WR 40.5% • R:R=1:1.47 • n=25
🤤 Greed (60–80): WR 45.1% • R:R=1:1.22 • n=215
😐 Neutral (40–60): WR 45.2% • R:R=1:1.21 • n=150
😨 Fear (20–40): WR 47.3% • R:R=1:1.11 • n=225
😱 Extreme Fear (<20): WR 52.4% • R:R=1:0.91 • n=110
Percentage of days with performance above the average level (46.76%) by sentiment zone:
🤑 Extreme Greed: 8.0%
🤤 Greed: 36.3%
😐 Neutral: 38.0%
😨 Fear: 53.8%
😱 Extreme Fear: 68.2%
➤ Scalpers can use FGI as a guide to adjust expected profit targets when entering trades:
📈 When FGI is high, traders should require a higher profit target to maintain a sufficient R:R and offset the risk of a lower win rate.
📉 When FGI is low, traders may lower profit expectations to improve capital rotation speed and make profit realization easier.
#TradingPerformance $BTC $ETH $SOL
The latest statistical data shows that the correlation between FGI and Winrate remains low and continues to lean negative (r ~ -0.299). This reinforces the view that FGI is not suitable as a tool for forecasting price direction or identifying entry points, but it still has practical value in measuring position risk. In general, trading performance tends to decline when market sentiment enters extreme euphoria, making FGI more useful as an early risk-warning signal rather than a signal for expanding profit expectations.
Below is a summary of Winrate (WR), minimum breakeven R:R, and number of recorded days (n) across sentiment zones:
🤑 Extreme Greed (≥80): WR 40.5% • R:R=1:1.47 • n=25
🤤 Greed (60–80): WR 45.1% • R:R=1:1.22 • n=215
😐 Neutral (40–60): WR 45.2% • R:R=1:1.21 • n=150
😨 Fear (20–40): WR 47.3% • R:R=1:1.11 • n=225
😱 Extreme Fear (<20): WR 52.4% • R:R=1:0.91 • n=110
Percentage of days with performance above the average level (46.76%) by sentiment zone:
🤑 Extreme Greed: 8.0%
🤤 Greed: 36.3%
😐 Neutral: 38.0%
😨 Fear: 53.8%
😱 Extreme Fear: 68.2%
➤ Scalpers can use FGI as a guide to adjust expected profit targets when entering trades:
📈 When FGI is high, traders should require a higher profit target to maintain a sufficient R:R and offset the risk of a lower win rate.
📉 When FGI is low, traders may lower profit expectations to improve capital rotation speed and make profit realization easier.
#TradingPerformance $BTC $ETH $SOL
126
·
--
Bullish
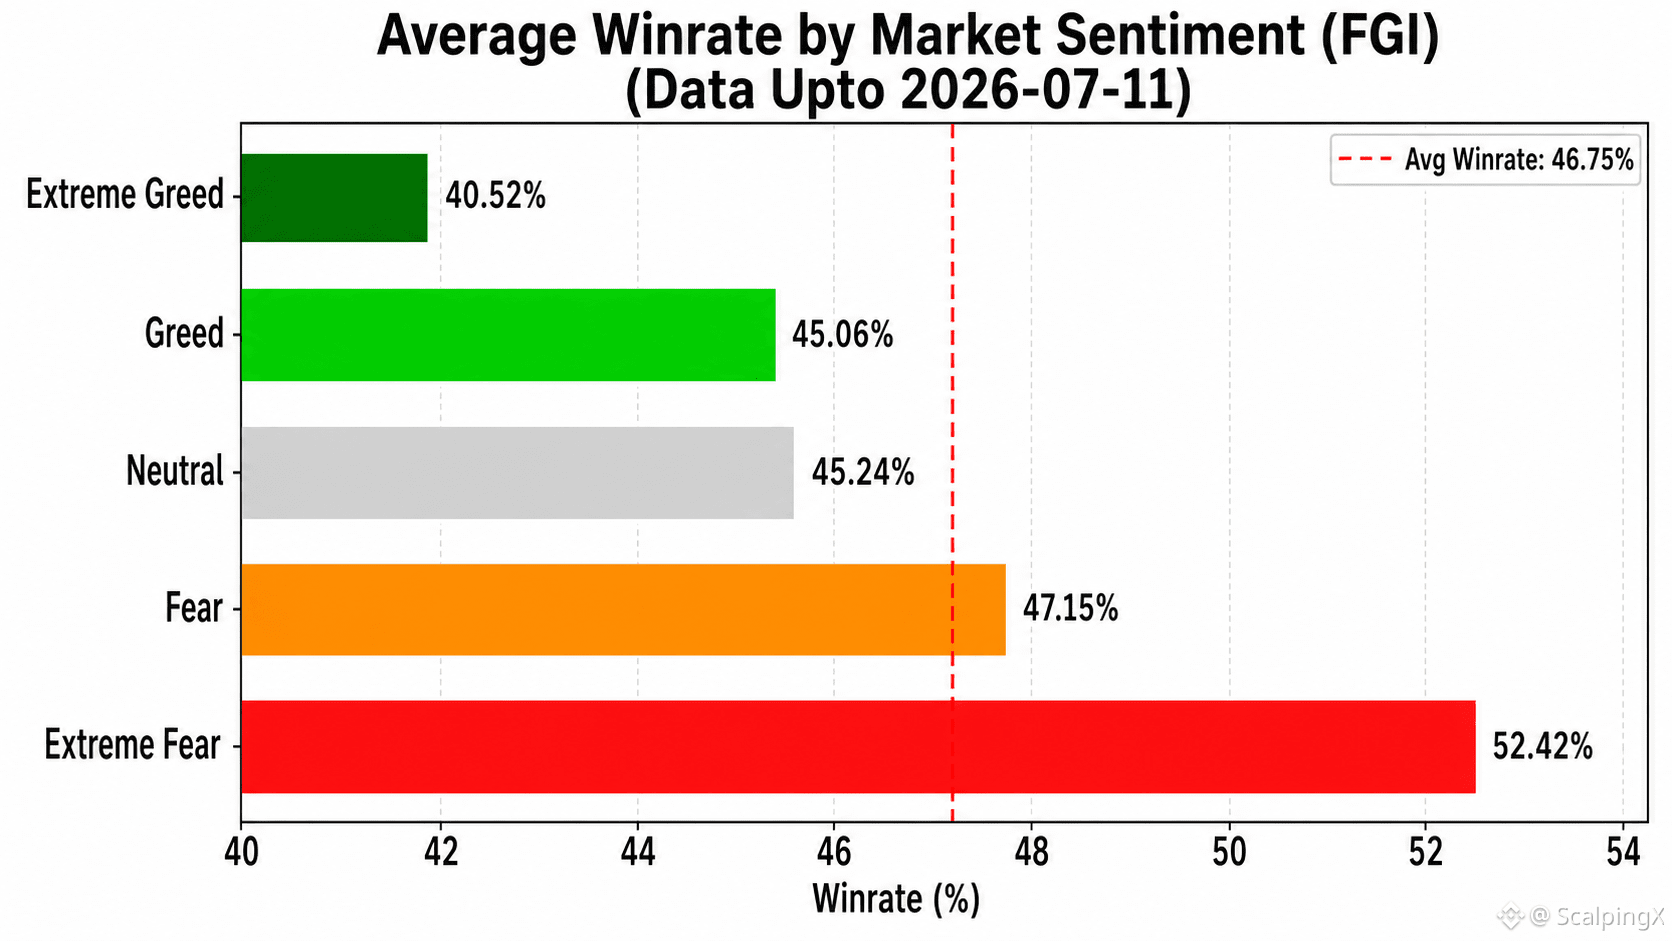
📊 TRADING PERFORMANCE & MARKET SENTIMENT INDEX (FGI) REPORT – UPDATED 11/07/2026
The latest data shows that the correlation between FGI and Win Rate remains weak and continues to lean negative (r ≈ -0.295). This further reinforces that FGI is not suitable as a tool for predicting price direction or identifying entry points, but it can still provide practical value in assessing trading risk. Overall performance tends to decline as market sentiment approaches extreme euphoria, making FGI more useful as an early risk-warning indicator than as a signal for expanding profit targets.
Below is a summary of Win Rate (WR), minimum breakeven R:R and the number of recorded days (n) across each sentiment zone:
🤑 Extreme Greed (≥80): WR 40.5% • R:R=1:1.47 • n=25
🤤 Greed (60–80): WR 45.1% • R:R=1:1.22 • n=215
😐 Neutral (40–60): WR 45.2% • R:R=1:1.21 • n=150
😨 Fear (20–40): WR 47.1% • R:R=1:1.12 • n=234
😱 Extreme Fear (<20): WR 52.4% • R:R=1:0.91 • n=115
The percentage of days with performance above the overall average of 46.75% in each sentiment zone:
🤑 Extreme Greed: 8.0%
🤤 Greed: 36.3%
😐 Neutral: 38.0%
😨 Fear: 52.6%
😱 Extreme Fear: 67.8%
➤ Scalpers can use FGI as a reference for adjusting expected profit targets when entering trades:
📈 When FGI is high, expected profit targets should be increased to maintain a sufficiently large R:R ratio and compensate for the lower win rate.
📉 When FGI is low, expected profit targets can be reduced to improve capital turnover and make profits easier to realize.
#TradingPerformance $BNB $GRAM $HYPE
📊 TRADING PERFORMANCE & MARKET SENTIMENT INDEX (FGI) REPORT – UPDATED 11/07/2026
The latest data shows that the correlation between FGI and Win Rate remains weak and continues to lean negative (r ≈ -0.295). This further reinforces that FGI is not suitable as a tool for predicting price direction or identifying entry points, but it can still provide practical value in assessing trading risk. Overall performance tends to decline as market sentiment approaches extreme euphoria, making FGI more useful as an early risk-warning indicator than as a signal for expanding profit targets.
Below is a summary of Win Rate (WR), minimum breakeven R:R and the number of recorded days (n) across each sentiment zone:
🤑 Extreme Greed (≥80): WR 40.5% • R:R=1:1.47 • n=25
🤤 Greed (60–80): WR 45.1% • R:R=1:1.22 • n=215
😐 Neutral (40–60): WR 45.2% • R:R=1:1.21 • n=150
😨 Fear (20–40): WR 47.1% • R:R=1:1.12 • n=234
😱 Extreme Fear (<20): WR 52.4% • R:R=1:0.91 • n=115
The percentage of days with performance above the overall average of 46.75% in each sentiment zone:
🤑 Extreme Greed: 8.0%
🤤 Greed: 36.3%
😐 Neutral: 38.0%
😨 Fear: 52.6%
😱 Extreme Fear: 67.8%
➤ Scalpers can use FGI as a reference for adjusting expected profit targets when entering trades:
📈 When FGI is high, expected profit targets should be increased to maintain a sufficiently large R:R ratio and compensate for the lower win rate.
📉 When FGI is low, expected profit targets can be reduced to improve capital turnover and make profits easier to realize.
#TradingPerformance $BNB $GRAM $HYPE
The latest data shows that the correlation between FGI and Win Rate remains weak and continues to lean negative (r ≈ -0.295). This further reinforces that FGI is not suitable as a tool for predicting price direction or identifying entry points, but it can still provide practical value in assessing trading risk. Overall performance tends to decline as market sentiment approaches extreme euphoria, making FGI more useful as an early risk-warning indicator than as a signal for expanding profit targets.
Below is a summary of Win Rate (WR), minimum breakeven R:R and the number of recorded days (n) across each sentiment zone:
🤑 Extreme Greed (≥80): WR 40.5% • R:R=1:1.47 • n=25
🤤 Greed (60–80): WR 45.1% • R:R=1:1.22 • n=215
😐 Neutral (40–60): WR 45.2% • R:R=1:1.21 • n=150
😨 Fear (20–40): WR 47.1% • R:R=1:1.12 • n=234
😱 Extreme Fear (<20): WR 52.4% • R:R=1:0.91 • n=115
The percentage of days with performance above the overall average of 46.75% in each sentiment zone:
🤑 Extreme Greed: 8.0%
🤤 Greed: 36.3%
😐 Neutral: 38.0%
😨 Fear: 52.6%
😱 Extreme Fear: 67.8%
➤ Scalpers can use FGI as a reference for adjusting expected profit targets when entering trades:
📈 When FGI is high, expected profit targets should be increased to maintain a sufficiently large R:R ratio and compensate for the lower win rate.
📉 When FGI is low, expected profit targets can be reduced to improve capital turnover and make profits easier to realize.
#TradingPerformance $BNB $GRAM $HYPE
109
·
--
Bullish
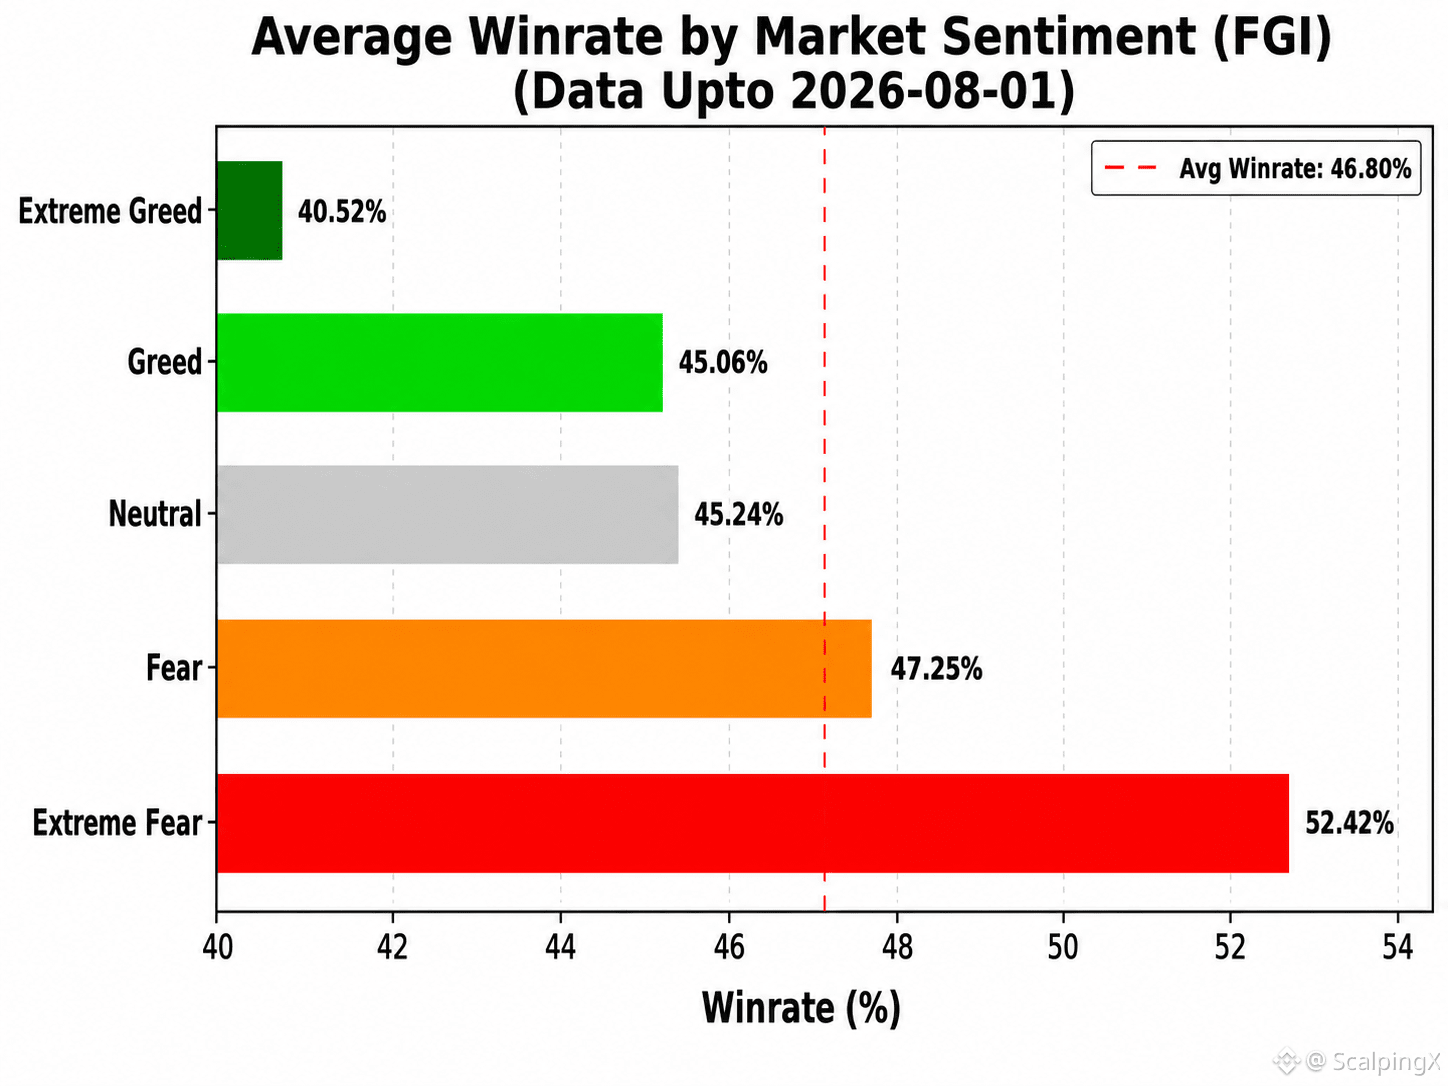
📊 TRADING PERFORMANCE & MARKET SENTIMENT INDEX (FGI) REPORT – UPDATED 01/08/2026
The latest data show that the correlation between the Fear & Greed Index and Win Rate remains weak and negative, at approximately r = -0.291. This suggests that FGI is not suitable as a standalone tool for predicting price direction or identifying order entries, but it can still provide practical value in risk assessment. Trading performance generally tends to weaken as market sentiment approaches extreme optimism, making FGI more useful as an early risk-warning indicator than as a signal for expanding profit targets.
Below is a summary of Win Rate (WR), minimum breakeven R:R, and the number of recorded days (n) across each sentiment zone:
🤑 Extreme Greed (≥80): WR 40.5% • R:R=1:1.47 • n=25
🤤 Greed (60–80): WR 45.1% • R:R=1:1.22 • n=215
😐 Neutral (40–60): WR 45.2% • R:R=1:1.21 • n=150
😨 Fear (20–40): WR 47.3% • R:R=1:1.12 • n=255
😱 Extreme Fear (<20): WR 52.4% • R:R=1:0.91 • n=115
The percentage of days with performance above the overall average of 46.80% in each zone:
🤑 Extreme Greed: 8.0%
🤤 Greed: 36.3%
😐 Neutral: 38.0%
😨 Fear: 53.7%
😱 Extreme Fear: 67.8%
➤ Scalpers can use FGI as a reference for adjusting expected profit targets when trading:
📈 When FGI is high, traders should increase their expected profit target to maintain a sufficiently large R:R and compensate for the lower win rate.
📉 When FGI is low, traders may reduce their expected profit target to accelerate capital turnover and realize profits more easily.
#TradingPerformance $BNB $ETH $VANRY
📊 TRADING PERFORMANCE & MARKET SENTIMENT INDEX (FGI) REPORT – UPDATED 01/08/2026
The latest data show that the correlation between the Fear & Greed Index and Win Rate remains weak and negative, at approximately r = -0.291. This suggests that FGI is not suitable as a standalone tool for predicting price direction or identifying order entries, but it can still provide practical value in risk assessment. Trading performance generally tends to weaken as market sentiment approaches extreme optimism, making FGI more useful as an early risk-warning indicator than as a signal for expanding profit targets.
Below is a summary of Win Rate (WR), minimum breakeven R:R, and the number of recorded days (n) across each sentiment zone:
🤑 Extreme Greed (≥80): WR 40.5% • R:R=1:1.47 • n=25
🤤 Greed (60–80): WR 45.1% • R:R=1:1.22 • n=215
😐 Neutral (40–60): WR 45.2% • R:R=1:1.21 • n=150
😨 Fear (20–40): WR 47.3% • R:R=1:1.12 • n=255
😱 Extreme Fear (<20): WR 52.4% • R:R=1:0.91 • n=115
The percentage of days with performance above the overall average of 46.80% in each zone:
🤑 Extreme Greed: 8.0%
🤤 Greed: 36.3%
😐 Neutral: 38.0%
😨 Fear: 53.7%
😱 Extreme Fear: 67.8%
➤ Scalpers can use FGI as a reference for adjusting expected profit targets when trading:
📈 When FGI is high, traders should increase their expected profit target to maintain a sufficiently large R:R and compensate for the lower win rate.
📉 When FGI is low, traders may reduce their expected profit target to accelerate capital turnover and realize profits more easily.
#TradingPerformance $BNB $ETH $VANRY
The latest data show that the correlation between the Fear & Greed Index and Win Rate remains weak and negative, at approximately r = -0.291. This suggests that FGI is not suitable as a standalone tool for predicting price direction or identifying order entries, but it can still provide practical value in risk assessment. Trading performance generally tends to weaken as market sentiment approaches extreme optimism, making FGI more useful as an early risk-warning indicator than as a signal for expanding profit targets.
Below is a summary of Win Rate (WR), minimum breakeven R:R, and the number of recorded days (n) across each sentiment zone:
🤑 Extreme Greed (≥80): WR 40.5% • R:R=1:1.47 • n=25
🤤 Greed (60–80): WR 45.1% • R:R=1:1.22 • n=215
😐 Neutral (40–60): WR 45.2% • R:R=1:1.21 • n=150
😨 Fear (20–40): WR 47.3% • R:R=1:1.12 • n=255
😱 Extreme Fear (<20): WR 52.4% • R:R=1:0.91 • n=115
The percentage of days with performance above the overall average of 46.80% in each zone:
🤑 Extreme Greed: 8.0%
🤤 Greed: 36.3%
😐 Neutral: 38.0%
😨 Fear: 53.7%
😱 Extreme Fear: 67.8%
➤ Scalpers can use FGI as a reference for adjusting expected profit targets when trading:
📈 When FGI is high, traders should increase their expected profit target to maintain a sufficiently large R:R and compensate for the lower win rate.
📉 When FGI is low, traders may reduce their expected profit target to accelerate capital turnover and realize profits more easily.
#TradingPerformance $BNB $ETH $VANRY
113
·
--
Bullish
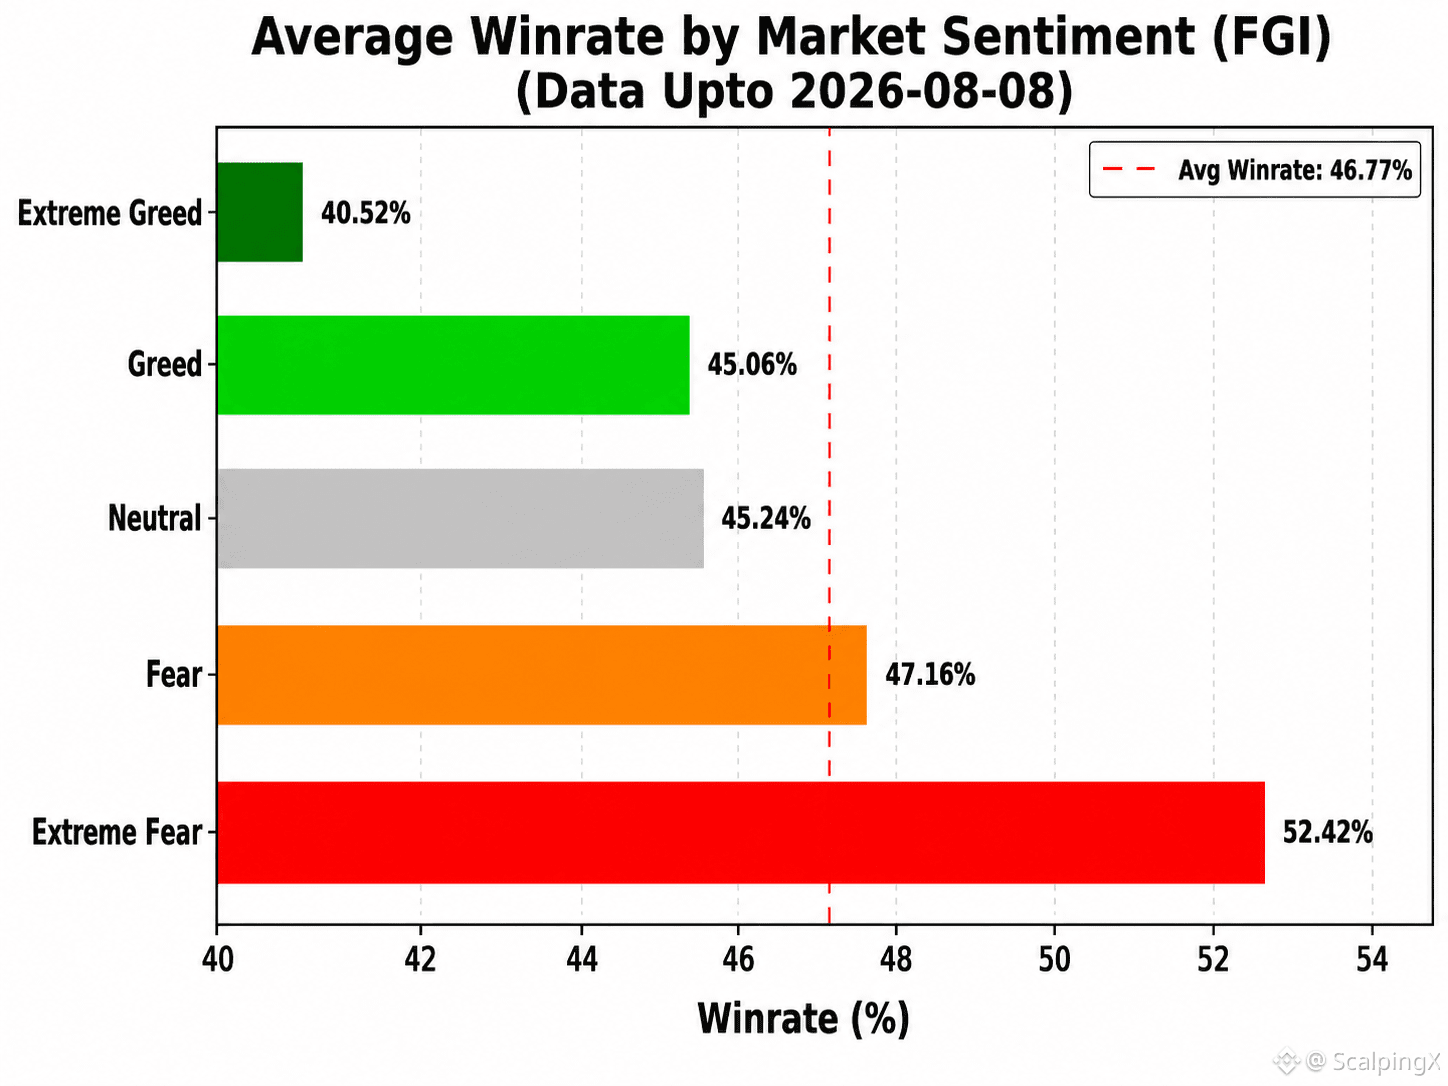
📊 TRADING PERFORMANCE & MARKET SENTIMENT INDEX (FGI) REPORT – UPDATED 08/08/2026
The latest statistics show that the correlation between the FGI and Win Rate remains weak and continues to lean negative, with r ≈ -0.288. This suggests that FGI is not suitable as a standalone tool for determining order entries, but it still provides value for quantifying risk. Trading performance generally tends to weaken as market sentiment moves toward extreme euphoria, making FGI more suitable as an early risk-warning indicator than as a signal for expanding profit targets.
Below is a summary of Win Rate (WR), minimum break-even R:R, and the number of recorded days (n) across different sentiment zones:
🤑 Extreme Greed (≥80): WR 40.5% • R:R=1:1.47 • n=25
🤤 Greed (60–80): WR 45.1% • R:R=1:1.22 • n=215
😐 Neutral (40–60): WR 45.2% • R:R=1:1.21 • n=150
😰 Fear (20–40): WR 47.2% • R:R=1:1.12 • n=262
😱 Extreme Fear (<20): WR 52.4% • R:R=1:0.91 • n=115
The percentage of days with performance above the overall average of 46.77% in each sentiment zone:
🤑 Extreme Greed: 8.0%
🤤 Greed: 36.3%
😐 Neutral: 38.0%
😰 Fear: 53.4%
😱 Extreme Fear: 67.8%
➤ Short-term traders can use FGI as a reference for adjusting expected profit targets when entering trades:
📈 When FGI is high, expected profit targets may need to be increased to maintain a sufficiently large R:R ratio, helping compensate for the higher risk associated with a lower win rate.
📉 When FGI is low, expected profit targets can be reduced to increase capital turnover and make profit realization easier.
#TradingPerformance $SOL $ETH $BTC
📊 TRADING PERFORMANCE & MARKET SENTIMENT INDEX (FGI) REPORT – UPDATED 08/08/2026
The latest statistics show that the correlation between the FGI and Win Rate remains weak and continues to lean negative, with r ≈ -0.288. This suggests that FGI is not suitable as a standalone tool for determining order entries, but it still provides value for quantifying risk. Trading performance generally tends to weaken as market sentiment moves toward extreme euphoria, making FGI more suitable as an early risk-warning indicator than as a signal for expanding profit targets.
Below is a summary of Win Rate (WR), minimum break-even R:R, and the number of recorded days (n) across different sentiment zones:
🤑 Extreme Greed (≥80): WR 40.5% • R:R=1:1.47 • n=25
🤤 Greed (60–80): WR 45.1% • R:R=1:1.22 • n=215
😐 Neutral (40–60): WR 45.2% • R:R=1:1.21 • n=150
😰 Fear (20–40): WR 47.2% • R:R=1:1.12 • n=262
😱 Extreme Fear (<20): WR 52.4% • R:R=1:0.91 • n=115
The percentage of days with performance above the overall average of 46.77% in each sentiment zone:
🤑 Extreme Greed: 8.0%
🤤 Greed: 36.3%
😐 Neutral: 38.0%
😰 Fear: 53.4%
😱 Extreme Fear: 67.8%
➤ Short-term traders can use FGI as a reference for adjusting expected profit targets when entering trades:
📈 When FGI is high, expected profit targets may need to be increased to maintain a sufficiently large R:R ratio, helping compensate for the higher risk associated with a lower win rate.
📉 When FGI is low, expected profit targets can be reduced to increase capital turnover and make profit realization easier.
#TradingPerformance $SOL $ETH $BTC
The latest statistics show that the correlation between the FGI and Win Rate remains weak and continues to lean negative, with r ≈ -0.288. This suggests that FGI is not suitable as a standalone tool for determining order entries, but it still provides value for quantifying risk. Trading performance generally tends to weaken as market sentiment moves toward extreme euphoria, making FGI more suitable as an early risk-warning indicator than as a signal for expanding profit targets.
Below is a summary of Win Rate (WR), minimum break-even R:R, and the number of recorded days (n) across different sentiment zones:
🤑 Extreme Greed (≥80): WR 40.5% • R:R=1:1.47 • n=25
🤤 Greed (60–80): WR 45.1% • R:R=1:1.22 • n=215
😐 Neutral (40–60): WR 45.2% • R:R=1:1.21 • n=150
😰 Fear (20–40): WR 47.2% • R:R=1:1.12 • n=262
😱 Extreme Fear (<20): WR 52.4% • R:R=1:0.91 • n=115
The percentage of days with performance above the overall average of 46.77% in each sentiment zone:
🤑 Extreme Greed: 8.0%
🤤 Greed: 36.3%
😐 Neutral: 38.0%
😰 Fear: 53.4%
😱 Extreme Fear: 67.8%
➤ Short-term traders can use FGI as a reference for adjusting expected profit targets when entering trades:
📈 When FGI is high, expected profit targets may need to be increased to maintain a sufficiently large R:R ratio, helping compensate for the higher risk associated with a lower win rate.
📉 When FGI is low, expected profit targets can be reduced to increase capital turnover and make profit realization easier.
#TradingPerformance $SOL $ETH $BTC
42
·
--
Bullish
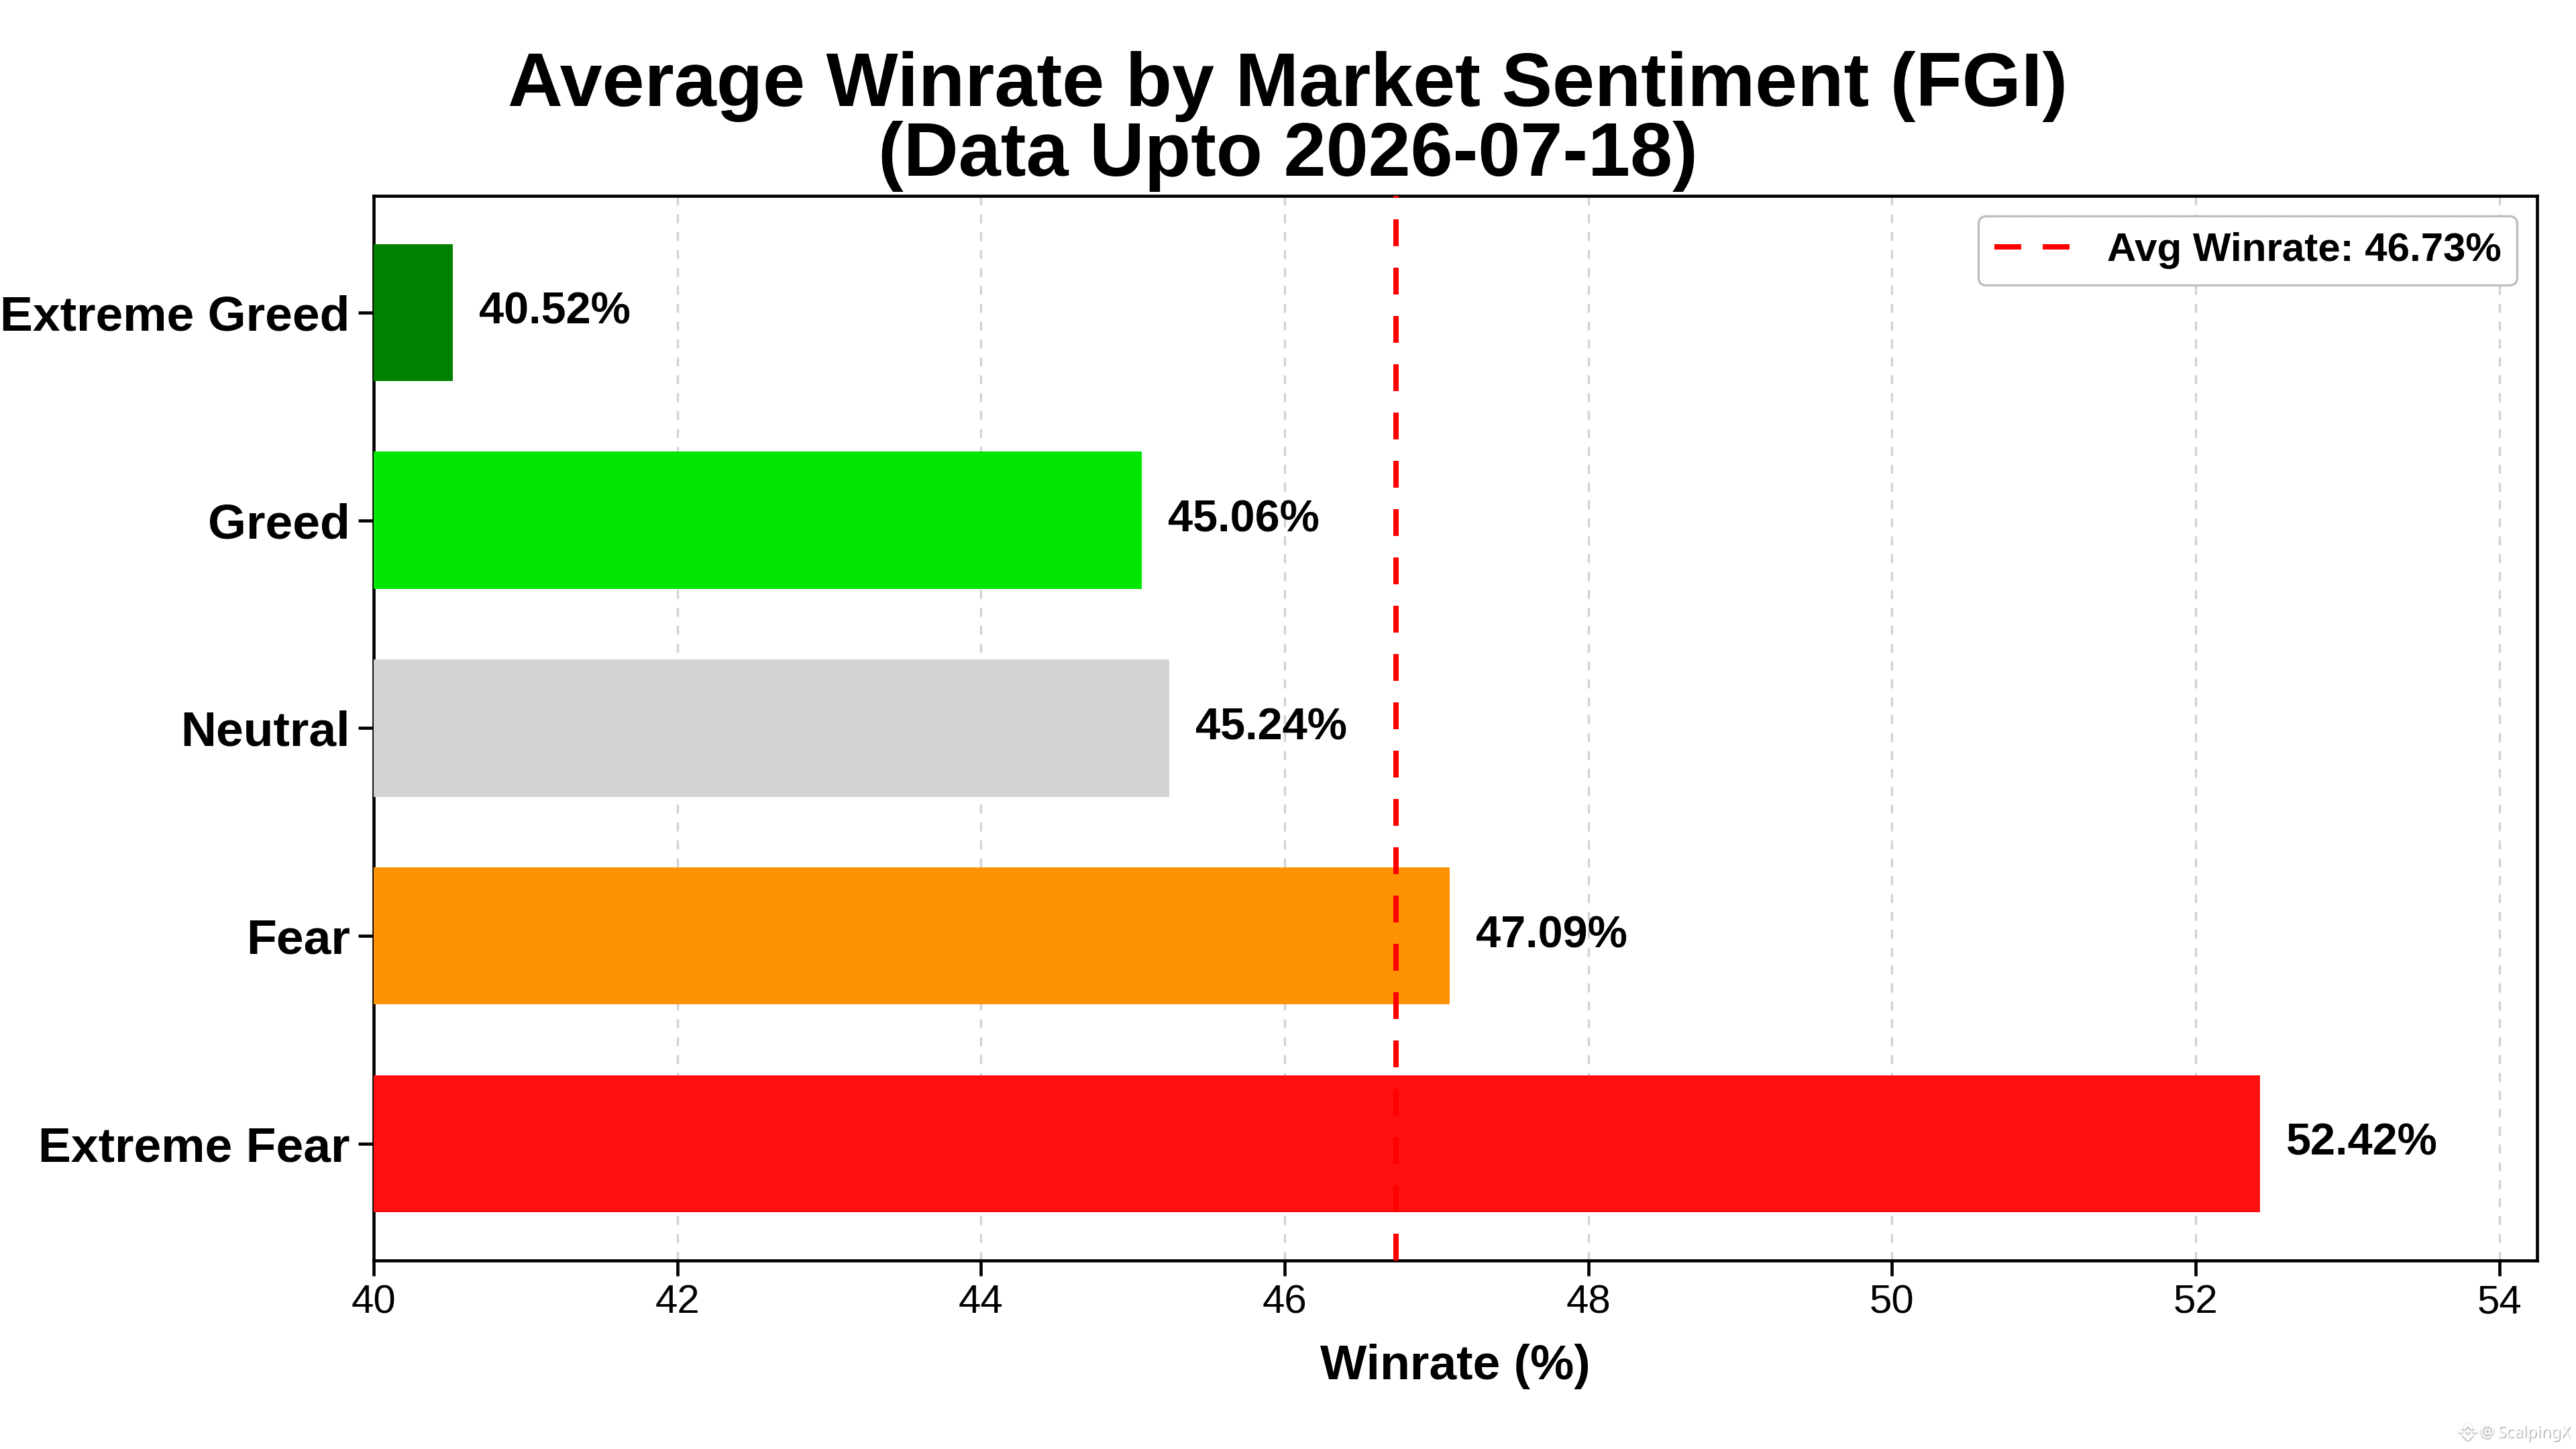
📊 TRADING PERFORMANCE & MARKET SENTIMENT INDEX (FGI) REPORT – UPDATED 18/07/2026
The latest data shows that the correlation between the FGI and Win Rate remains weak and continues to lean negative at approximately r = -0.291. This further supports the view that the FGI is not suitable for predicting price direction or identifying entry points, but it still has practical value for quantifying order risk. Trading performance generally tends to weaken as market sentiment enters extremely euphoric territory, making the FGI more useful as an early risk-warning indicator than as a signal for expanding profit targets.
Below is a summary of Win Rate (WR), minimum break-even R:R, and the number of recorded days (n) across each sentiment zone:
🤑 Extreme Greed (≥80): WR 40.5% • R:R = 1:1.47 • n = 25
🤤 Greed (60–80): WR 45.1% • R:R = 1:1.22 • n = 215
😐 Neutral (40–60): WR 45.2% • R:R = 1:1.21 • n = 150
😨 Fear (20–40): WR 47.1% • R:R = 1:1.12 • n = 241
😱 Extreme Fear (<20): WR 52.4% • R:R = 1:0.91 • n = 115
Percentage of days with performance above the overall average of 46.73% in each sentiment zone:
🤑 Extreme Greed: 8.0%
🤤 Greed: 36.3%
😐 Neutral: 38.0%
😨 Fear: 52.7%
😱 Extreme Fear: 67.8%
➤ Scalpers may use the FGI as a reference for adjusting expected profit targets when entering trades:
📈 When the FGI is high, traders should increase their expected profit target to maintain a sufficiently large R:R and compensate for the decline in win rate.
📉 When the FGI is low, traders may reduce their expected profit target to accelerate capital turnover and realize profits more easily.
#TradingPerformance $BTC $ETH $BNB
📊 TRADING PERFORMANCE & MARKET SENTIMENT INDEX (FGI) REPORT – UPDATED 18/07/2026
The latest data shows that the correlation between the FGI and Win Rate remains weak and continues to lean negative at approximately r = -0.291. This further supports the view that the FGI is not suitable for predicting price direction or identifying entry points, but it still has practical value for quantifying order risk. Trading performance generally tends to weaken as market sentiment enters extremely euphoric territory, making the FGI more useful as an early risk-warning indicator than as a signal for expanding profit targets.
Below is a summary of Win Rate (WR), minimum break-even R:R, and the number of recorded days (n) across each sentiment zone:
🤑 Extreme Greed (≥80): WR 40.5% • R:R = 1:1.47 • n = 25
🤤 Greed (60–80): WR 45.1% • R:R = 1:1.22 • n = 215
😐 Neutral (40–60): WR 45.2% • R:R = 1:1.21 • n = 150
😨 Fear (20–40): WR 47.1% • R:R = 1:1.12 • n = 241
😱 Extreme Fear (<20): WR 52.4% • R:R = 1:0.91 • n = 115
Percentage of days with performance above the overall average of 46.73% in each sentiment zone:
🤑 Extreme Greed: 8.0%
🤤 Greed: 36.3%
😐 Neutral: 38.0%
😨 Fear: 52.7%
😱 Extreme Fear: 67.8%
➤ Scalpers may use the FGI as a reference for adjusting expected profit targets when entering trades:
📈 When the FGI is high, traders should increase their expected profit target to maintain a sufficiently large R:R and compensate for the decline in win rate.
📉 When the FGI is low, traders may reduce their expected profit target to accelerate capital turnover and realize profits more easily.
#TradingPerformance $BTC $ETH $BNB
The latest data shows that the correlation between the FGI and Win Rate remains weak and continues to lean negative at approximately r = -0.291. This further supports the view that the FGI is not suitable for predicting price direction or identifying entry points, but it still has practical value for quantifying order risk. Trading performance generally tends to weaken as market sentiment enters extremely euphoric territory, making the FGI more useful as an early risk-warning indicator than as a signal for expanding profit targets.
Below is a summary of Win Rate (WR), minimum break-even R:R, and the number of recorded days (n) across each sentiment zone:
🤑 Extreme Greed (≥80): WR 40.5% • R:R = 1:1.47 • n = 25
🤤 Greed (60–80): WR 45.1% • R:R = 1:1.22 • n = 215
😐 Neutral (40–60): WR 45.2% • R:R = 1:1.21 • n = 150
😨 Fear (20–40): WR 47.1% • R:R = 1:1.12 • n = 241
😱 Extreme Fear (<20): WR 52.4% • R:R = 1:0.91 • n = 115
Percentage of days with performance above the overall average of 46.73% in each sentiment zone:
🤑 Extreme Greed: 8.0%
🤤 Greed: 36.3%
😐 Neutral: 38.0%
😨 Fear: 52.7%
😱 Extreme Fear: 67.8%
➤ Scalpers may use the FGI as a reference for adjusting expected profit targets when entering trades:
📈 When the FGI is high, traders should increase their expected profit target to maintain a sufficiently large R:R and compensate for the decline in win rate.
📉 When the FGI is low, traders may reduce their expected profit target to accelerate capital turnover and realize profits more easily.
#TradingPerformance $BTC $ETH $BNB
25
·
--
Bullish
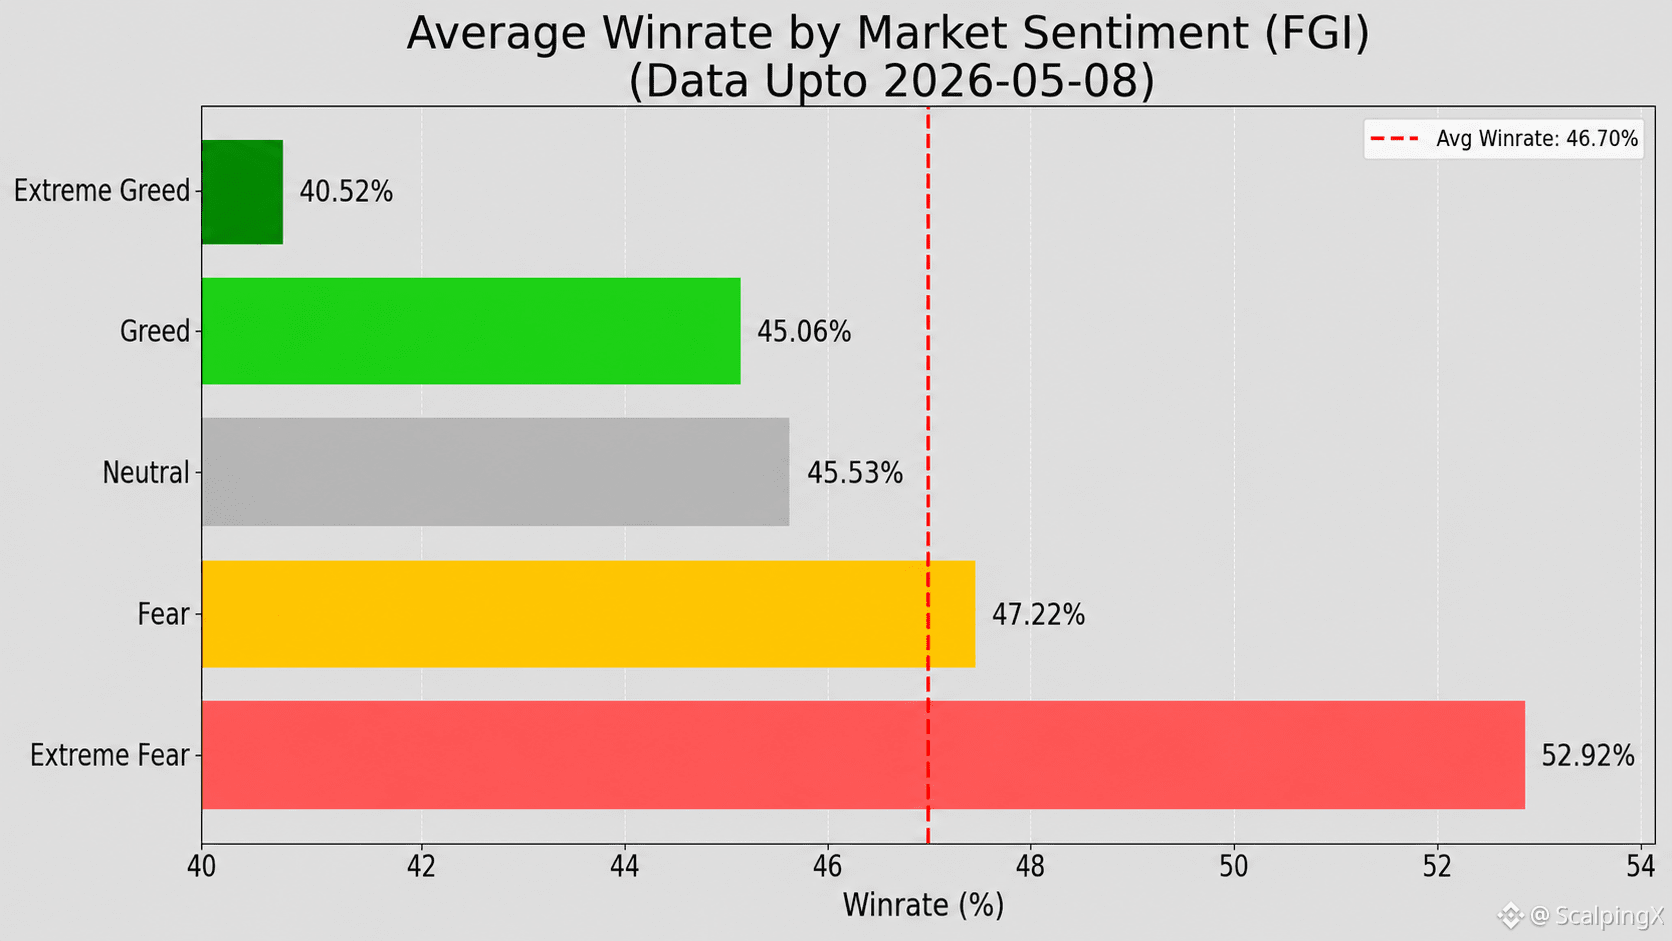
📊 TRADING PERFORMANCE & FEAR AND GREED INDEX (FGI) REPORT – UPDATED 08/05/2026
The latest statistical data shows that the correlation between the FGI and Winrate remains low and continues to lean negative (r ~ -0.325). This continues to support the view that FGI is not suitable as a tool for predicting price direction or identifying trade entries, but it still has practical value in quantifying position risk. More specifically, trading performance generally weakens when market sentiment moves into extreme euphoria, making FGI more useful as an early risk-warning signal rather than a signal for expanding profit expectations.
Below is a summary of Winrate (WR), minimum breakeven R:R, and number of recorded days (n) across sentiment zones for reference:
🤑 Extreme Greed (≥80): WR 40.5% • R:R=1:1.47 • n=25
🤤 Greed (60–80): WR 45.1% • R:R=1:1.22 • n=215
😐 Neutral (40–60): WR 45.5% • R:R=1:1.20 • n=145
😨 Fear (20–40): WR 47.2% • R:R=1:1.12 • n=198
😱 Extreme Fear (<20): WR 52.9% • R:R=1:0.89 • n=92
Share of days with performance above the average level (46.70%) by sentiment zone:
🤑 Extreme Greed: 8.0%
🤤 Greed: 36.3%
😐 Neutral: 40.0%
😨 Fear: 55.1%
😱 Extreme Fear: 70.7%
➤ Scalping traders can use FGI as a guide to adjust profit expectations when entering trades:
📈 When FGI is high, profit expectations should be raised to maintain a sufficiently strong R:R, helping offset the risk of a lower win rate.
📉 When FGI is low, profit expectations can be lowered to improve capital turnover speed and make profit-taking easier.
#TradingPerformance $BTC $BNB $TON
📊 TRADING PERFORMANCE & FEAR AND GREED INDEX (FGI) REPORT – UPDATED 08/05/2026
The latest statistical data shows that the correlation between the FGI and Winrate remains low and continues to lean negative (r ~ -0.325). This continues to support the view that FGI is not suitable as a tool for predicting price direction or identifying trade entries, but it still has practical value in quantifying position risk. More specifically, trading performance generally weakens when market sentiment moves into extreme euphoria, making FGI more useful as an early risk-warning signal rather than a signal for expanding profit expectations.
Below is a summary of Winrate (WR), minimum breakeven R:R, and number of recorded days (n) across sentiment zones for reference:
🤑 Extreme Greed (≥80): WR 40.5% • R:R=1:1.47 • n=25
🤤 Greed (60–80): WR 45.1% • R:R=1:1.22 • n=215
😐 Neutral (40–60): WR 45.5% • R:R=1:1.20 • n=145
😨 Fear (20–40): WR 47.2% • R:R=1:1.12 • n=198
😱 Extreme Fear (<20): WR 52.9% • R:R=1:0.89 • n=92
Share of days with performance above the average level (46.70%) by sentiment zone:
🤑 Extreme Greed: 8.0%
🤤 Greed: 36.3%
😐 Neutral: 40.0%
😨 Fear: 55.1%
😱 Extreme Fear: 70.7%
➤ Scalping traders can use FGI as a guide to adjust profit expectations when entering trades:
📈 When FGI is high, profit expectations should be raised to maintain a sufficiently strong R:R, helping offset the risk of a lower win rate.
📉 When FGI is low, profit expectations can be lowered to improve capital turnover speed and make profit-taking easier.
#TradingPerformance $BTC $BNB $TON
The latest statistical data shows that the correlation between the FGI and Winrate remains low and continues to lean negative (r ~ -0.325). This continues to support the view that FGI is not suitable as a tool for predicting price direction or identifying trade entries, but it still has practical value in quantifying position risk. More specifically, trading performance generally weakens when market sentiment moves into extreme euphoria, making FGI more useful as an early risk-warning signal rather than a signal for expanding profit expectations.
Below is a summary of Winrate (WR), minimum breakeven R:R, and number of recorded days (n) across sentiment zones for reference:
🤑 Extreme Greed (≥80): WR 40.5% • R:R=1:1.47 • n=25
🤤 Greed (60–80): WR 45.1% • R:R=1:1.22 • n=215
😐 Neutral (40–60): WR 45.5% • R:R=1:1.20 • n=145
😨 Fear (20–40): WR 47.2% • R:R=1:1.12 • n=198
😱 Extreme Fear (<20): WR 52.9% • R:R=1:0.89 • n=92
Share of days with performance above the average level (46.70%) by sentiment zone:
🤑 Extreme Greed: 8.0%
🤤 Greed: 36.3%
😐 Neutral: 40.0%
😨 Fear: 55.1%
😱 Extreme Fear: 70.7%
➤ Scalping traders can use FGI as a guide to adjust profit expectations when entering trades:
📈 When FGI is high, profit expectations should be raised to maintain a sufficiently strong R:R, helping offset the risk of a lower win rate.
📉 When FGI is low, profit expectations can be lowered to improve capital turnover speed and make profit-taking easier.
#TradingPerformance $BTC $BNB $TON
100

·
--
Bearish
📊 MacroPulse Performance Update 🚀
Riding the global macro pulse — and results speak for themselves!
✅ Total ROI: +16.08%
💰 Total Profit (PnL): $382,886.59
💼 Total Margin Balance: $201,880
📅 Days Active: 107
🎯 Win Rate: 35.47%
📉 MDD: 98.16%
👥 Subscribers: 2,252 and growing!
Recent moves on SOL/USDT (40x Leverage) have been 🔥, showing strong momentum with smart cross-margin strategy.
📈 MacroPulse continues to deliver — balancing risk, precision, and market timing to stay ahead of the trend.
👉 Follow and subscribe on Binance to ride the macro pulse with us!
#Binance #CryptoTrading #MacroPulse #FuturesTrading #SOLUSDT #TradingPerformance #CryptoProfits
$BTC
{spot}(BTCUSDT)
📊 MacroPulse Performance Update 🚀
Riding the global macro pulse — and results speak for themselves!
✅ Total ROI: +16.08%
💰 Total Profit (PnL): $382,886.59
💼 Total Margin Balance: $201,880
📅 Days Active: 107
🎯 Win Rate: 35.47%
📉 MDD: 98.16%
👥 Subscribers: 2,252 and growing!
Recent moves on SOL/USDT (40x Leverage) have been 🔥, showing strong momentum with smart cross-margin strategy.
📈 MacroPulse continues to deliver — balancing risk, precision, and market timing to stay ahead of the trend.
👉 Follow and subscribe on Binance to ride the macro pulse with us!
#Binance #CryptoTrading #MacroPulse #FuturesTrading #SOLUSDT #TradingPerformance #CryptoProfits
$BTC
Riding the global macro pulse — and results speak for themselves!
✅ Total ROI: +16.08%
💰 Total Profit (PnL): $382,886.59
💼 Total Margin Balance: $201,880
📅 Days Active: 107
🎯 Win Rate: 35.47%
📉 MDD: 98.16%
👥 Subscribers: 2,252 and growing!
Recent moves on SOL/USDT (40x Leverage) have been 🔥, showing strong momentum with smart cross-margin strategy.
📈 MacroPulse continues to deliver — balancing risk, precision, and market timing to stay ahead of the trend.
👉 Follow and subscribe on Binance to ride the macro pulse with us!
#Binance #CryptoTrading #MacroPulse #FuturesTrading #SOLUSDT #TradingPerformance #CryptoProfits
$BTC
6
25
·
--
Bullish
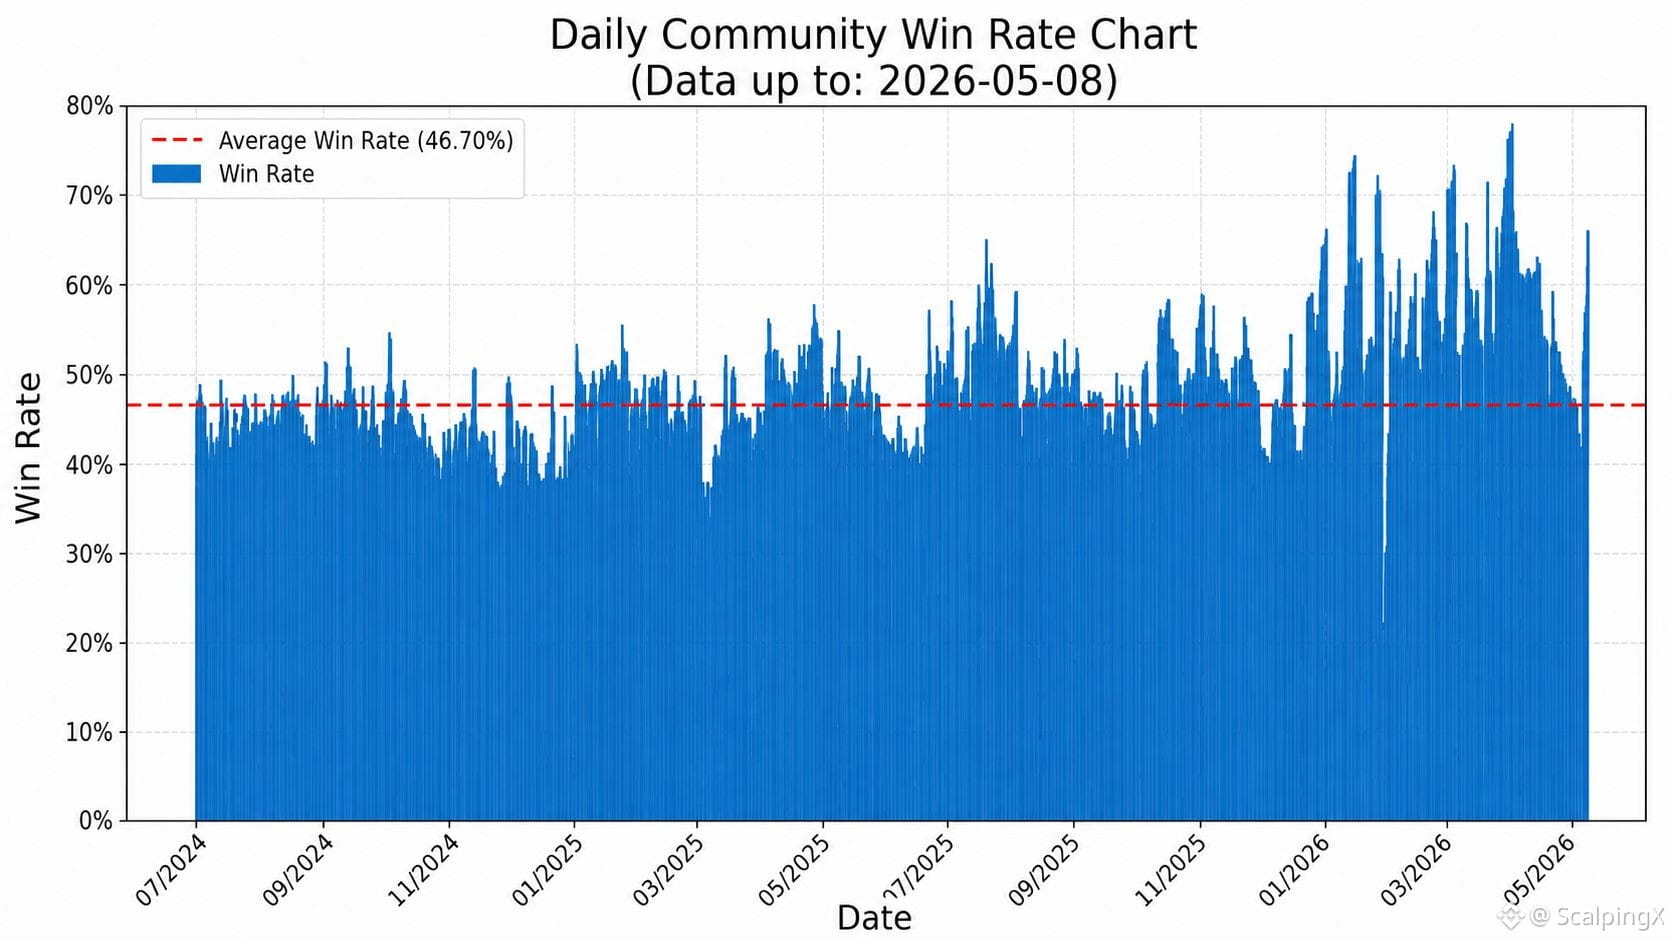
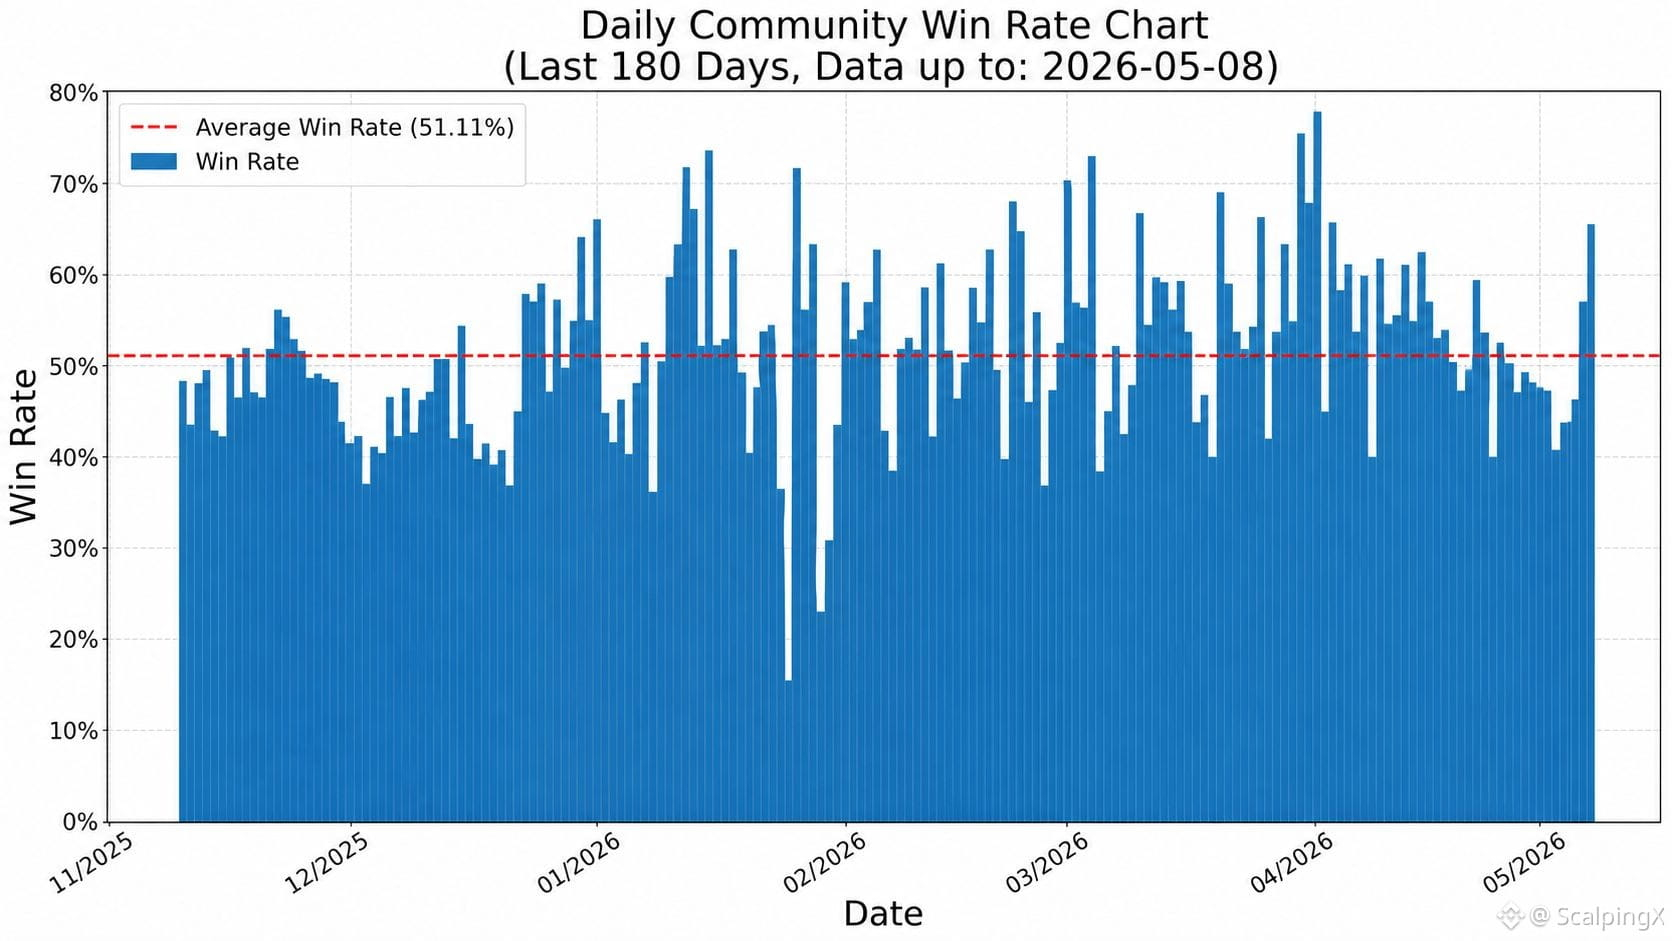
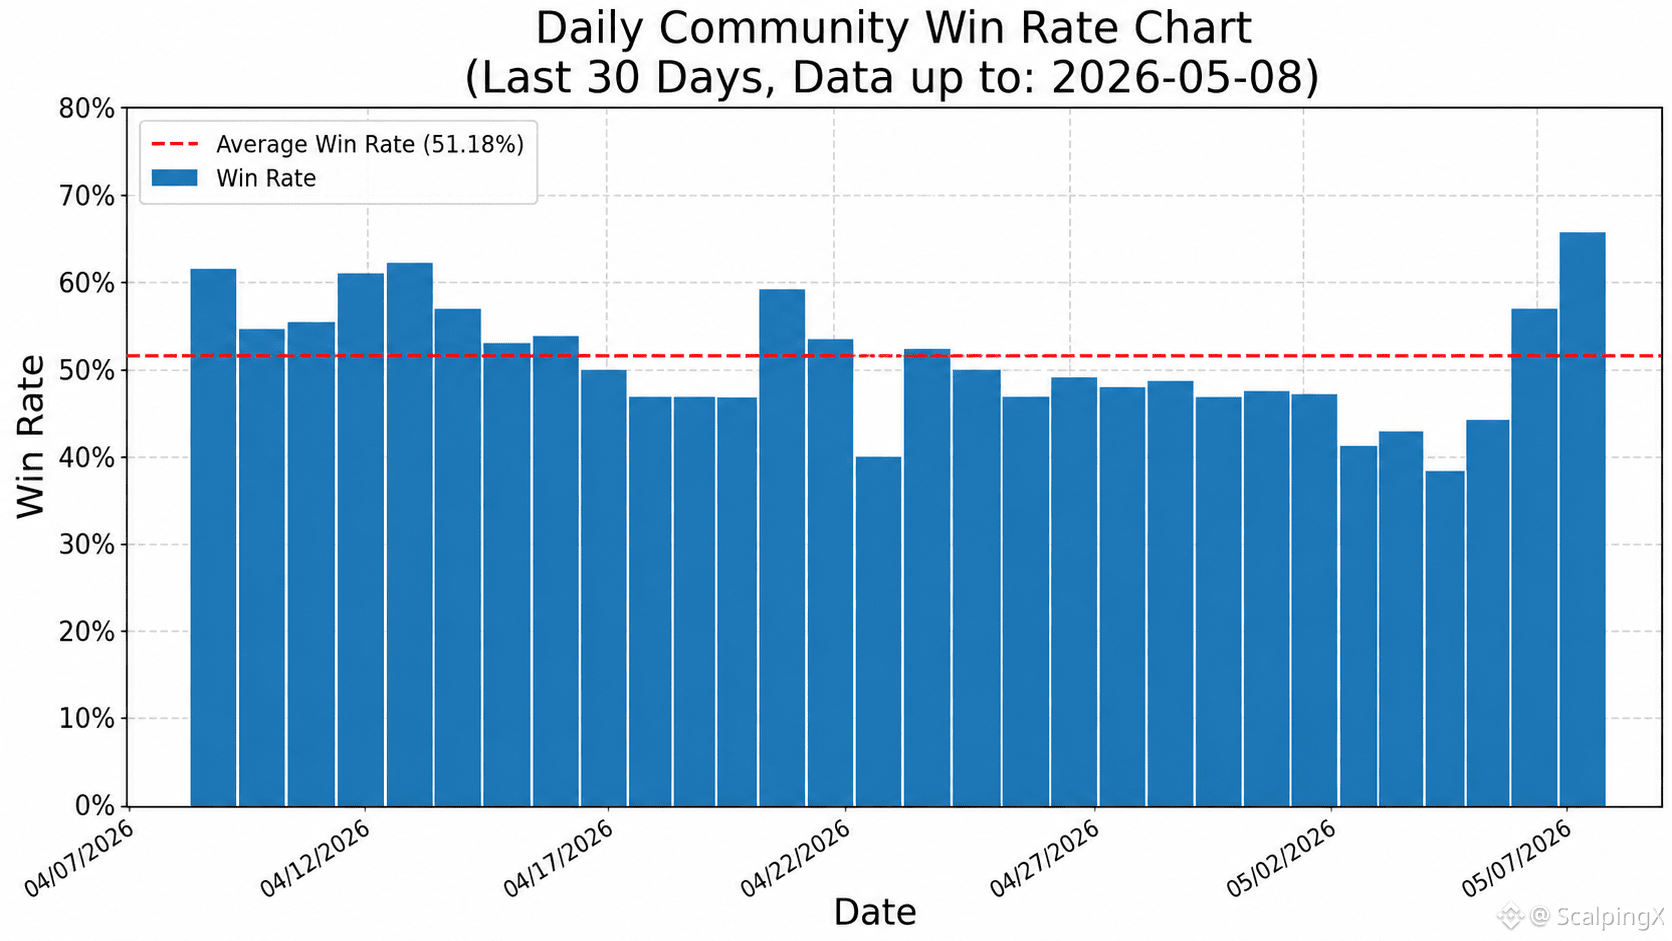
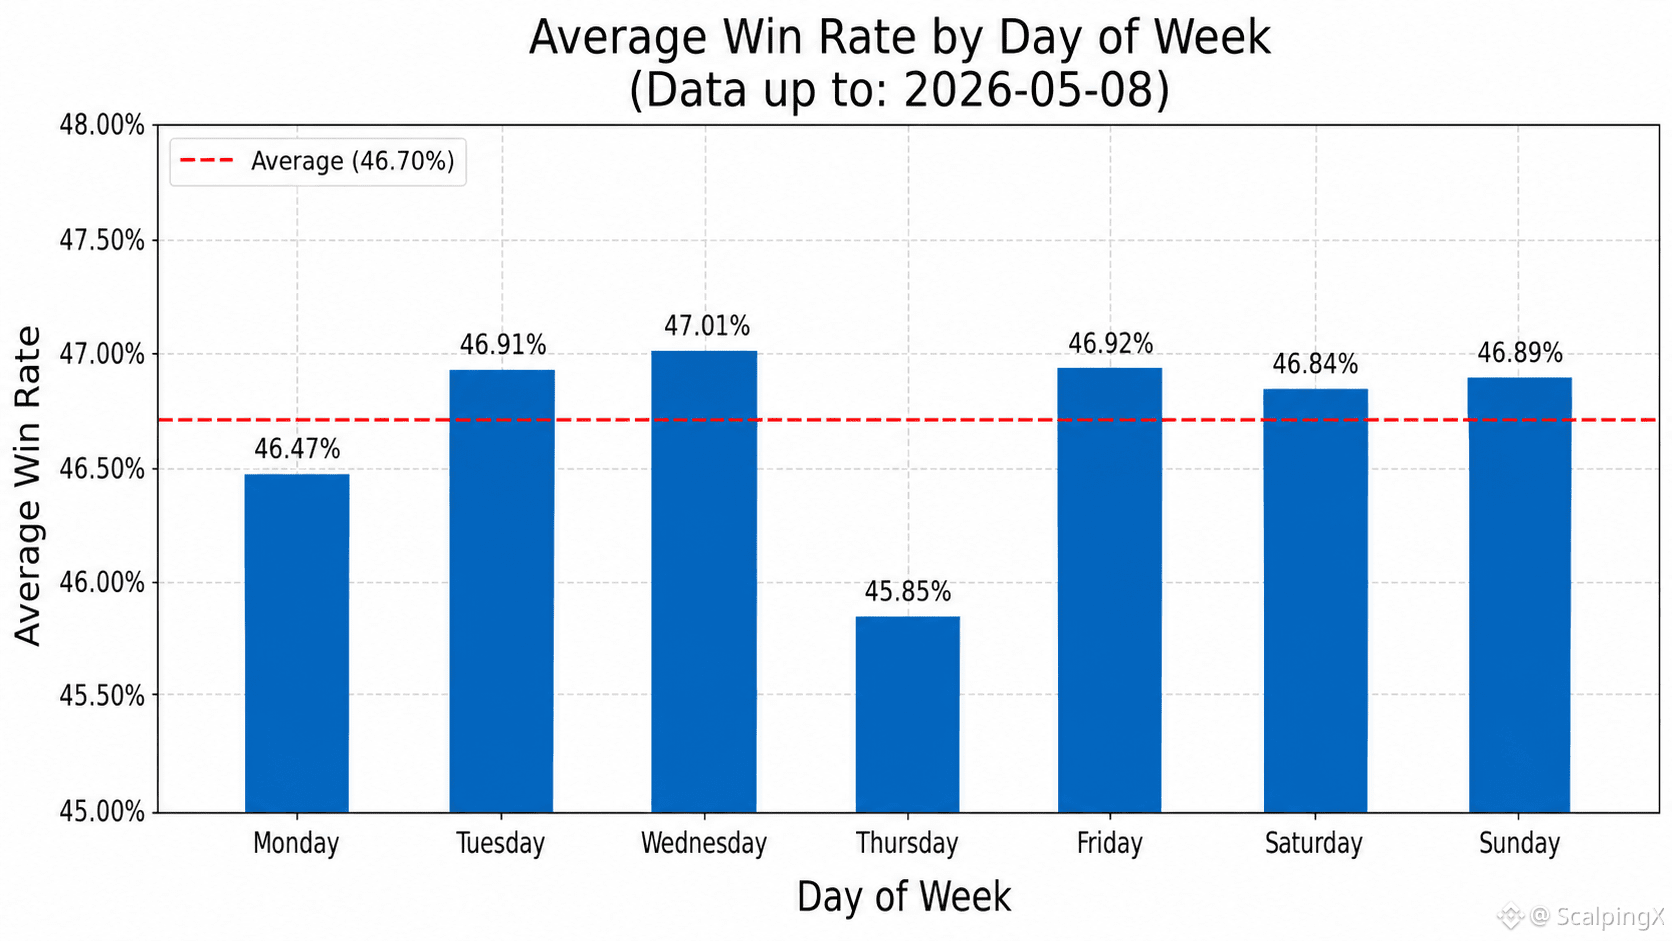
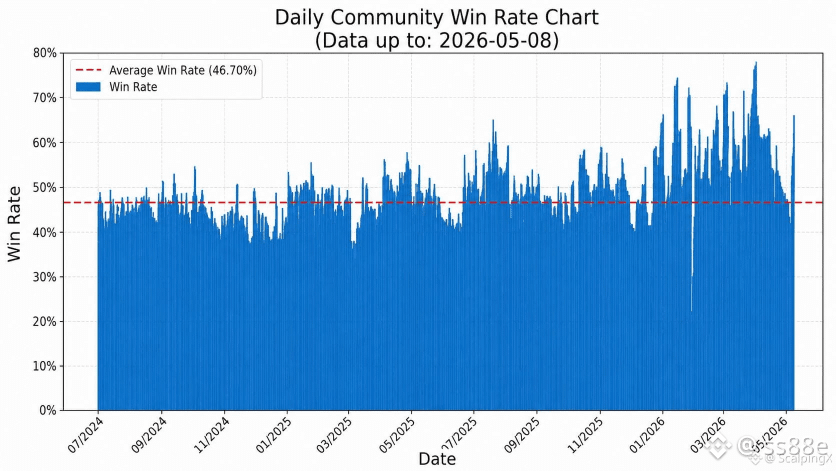
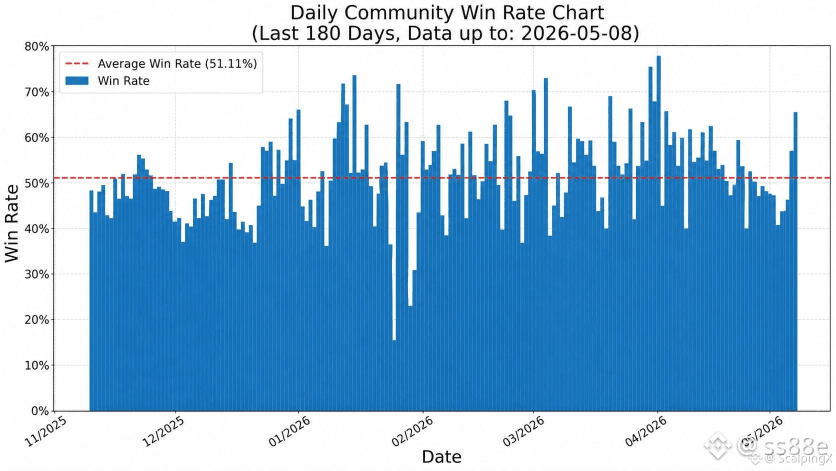
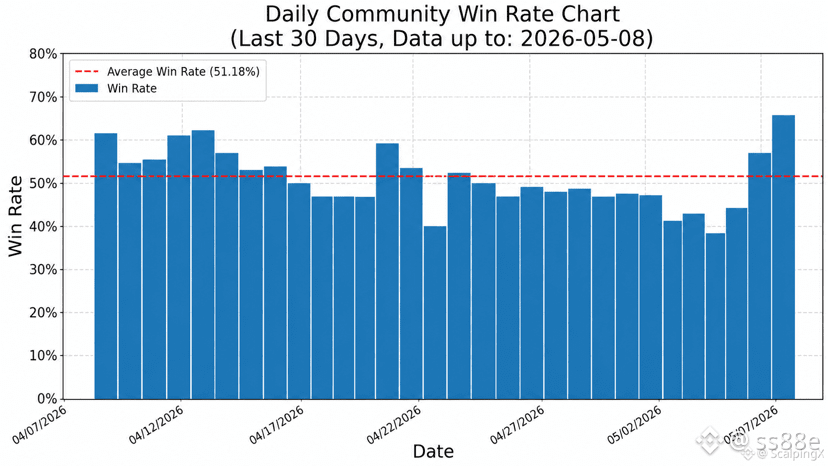
Updated as of 2026-05-08, community-wide trading data:
📊 The average win rate is 46.70%
🏆 The highest win-rate day was 2026-04-01 at 78.08%. The lowest win-rate day was 2026-01-25 at 15.69%
📅 The weekday with the highest average win rate is Wednesday at 47.01%. The weekday with the lowest average win rate is Thursday at 45.85%
⏱️ The strongest 7-day period ended on 2026-04-05, with an average win rate of 63.27%. The weakest 7-day period ended on 2025-03-12, with an average win rate of 36.64%
⚖️ The number of days with a win rate above the average is 312. The number of days with a win rate equal to or below the average is 363
📈 The number of days with a win rate above 50% is 186. The number of days with a win rate between 40% and 50% is 376. The number of days with a win rate below 40% is 113
#TradingPerformance $BTC $TON $BNB
Updated as of 2026-05-08, community-wide trading data:
📊 The average win rate is 46.70%
🏆 The highest win-rate day was 2026-04-01 at 78.08%. The lowest win-rate day was 2026-01-25 at 15.69%
📅 The weekday with the highest average win rate is Wednesday at 47.01%. The weekday with the lowest average win rate is Thursday at 45.85%
⏱️ The strongest 7-day period ended on 2026-04-05, with an average win rate of 63.27%. The weakest 7-day period ended on 2025-03-12, with an average win rate of 36.64%
⚖️ The number of days with a win rate above the average is 312. The number of days with a win rate equal to or below the average is 363
📈 The number of days with a win rate above 50% is 186. The number of days with a win rate between 40% and 50% is 376. The number of days with a win rate below 40% is 113
#TradingPerformance $BTC $TON $BNB
📊 The average win rate is 46.70%
🏆 The highest win-rate day was 2026-04-01 at 78.08%. The lowest win-rate day was 2026-01-25 at 15.69%
📅 The weekday with the highest average win rate is Wednesday at 47.01%. The weekday with the lowest average win rate is Thursday at 45.85%
⏱️ The strongest 7-day period ended on 2026-04-05, with an average win rate of 63.27%. The weakest 7-day period ended on 2025-03-12, with an average win rate of 36.64%
⚖️ The number of days with a win rate above the average is 312. The number of days with a win rate equal to or below the average is 363
📈 The number of days with a win rate above 50% is 186. The number of days with a win rate between 40% and 50% is 376. The number of days with a win rate below 40% is 113
#TradingPerformance $BTC $TON $BNB
66

·
--
Bullish
Last updated on 2026-05-08, community trading data:
📊 Average win rate is 46.70%
🏆 The highest win rate day was on 2026-04-01 with a rate of 78.08%. The lowest win rate day was on 2026-01-25 with a rate of 15.69%
📅 The day of the week with the highest average win rate is Wednesday at 47.01%. The day with the lowest average win rate is Thursday at 45.85%
⏱️ The strongest 7-day period ended on 2026-04-05, with an average win rate of 63.27%. The weakest 7-day period ended on 2025-03-12, with an average win rate of 36.64%
⚖️ The number of days with a win rate above average is 312. The number of days with a win rate equal to or below average is 363
📈 The number of days with a win rate above 50% is 186. The number of days with a win rate between 40% and 50% is 376. The number of days with a win rate below 40% is 113
#TradingPerformance $BTC $TON
Last updated on 2026-05-08, community trading data:
📊 Average win rate is 46.70%
🏆 The highest win rate day was on 2026-04-01 with a rate of 78.08%. The lowest win rate day was on 2026-01-25 with a rate of 15.69%
📅 The day of the week with the highest average win rate is Wednesday at 47.01%. The day with the lowest average win rate is Thursday at 45.85%
⏱️ The strongest 7-day period ended on 2026-04-05, with an average win rate of 63.27%. The weakest 7-day period ended on 2025-03-12, with an average win rate of 36.64%
⚖️ The number of days with a win rate above average is 312. The number of days with a win rate equal to or below average is 363
📈 The number of days with a win rate above 50% is 186. The number of days with a win rate between 40% and 50% is 376. The number of days with a win rate below 40% is 113
#TradingPerformance $BTC $TON
📊 Average win rate is 46.70%
🏆 The highest win rate day was on 2026-04-01 with a rate of 78.08%. The lowest win rate day was on 2026-01-25 with a rate of 15.69%
📅 The day of the week with the highest average win rate is Wednesday at 47.01%. The day with the lowest average win rate is Thursday at 45.85%
⏱️ The strongest 7-day period ended on 2026-04-05, with an average win rate of 63.27%. The weakest 7-day period ended on 2025-03-12, with an average win rate of 36.64%
⚖️ The number of days with a win rate above average is 312. The number of days with a win rate equal to or below average is 363
📈 The number of days with a win rate above 50% is 186. The number of days with a win rate between 40% and 50% is 376. The number of days with a win rate below 40% is 113
#TradingPerformance $BTC $TON
3
144
Log in to explore more content
Join global crypto users on Binance Square
⚡️ Get latest and useful information about crypto.
💬 Trusted by the world’s largest crypto exchange.
👍 Discover real insights from verified creators.
Email / Phone number
Trending Topics
1
#SECReceivesGrayscaleLitecoinTrustETFFiling
0 views
0 Discussing
2
#ClarityActFacesProceduralVoteSept15
75,237 views
964 Discussing
3
#US10YearTreasuryYieldNears5%
27,313 views
486 Discussing
4
#CryptoLiquidations$674MIn24H
8,389 views
94 Discussing
5
#TokenizedStockHoldersUp619.1%
30,553 views
473 Discussing
6
#RevolutConfirmsFakeGovEmailDataBreach
53,519 views
751 Discussing
7
#CanadaOSFISaysTokenizedDepositsEqualTraditionalDeposits
2,391 views
66 Discussing
8
#USBankCompletesCrossBorderPaymentPilotOnStellar
51,635 views
898 Discussing
9
#NvidiaInTalksToInvestUpTo$10BInAnthropicIPO
3,986 views
69 Discussing
10
#EtherRalliesAsBearishBetsLiquidate
73,516 views
1,129 Discussing