
#technicallevels
technicallevels
5,926 views
40 Discussing
Hot
Latest

·
--
$B2
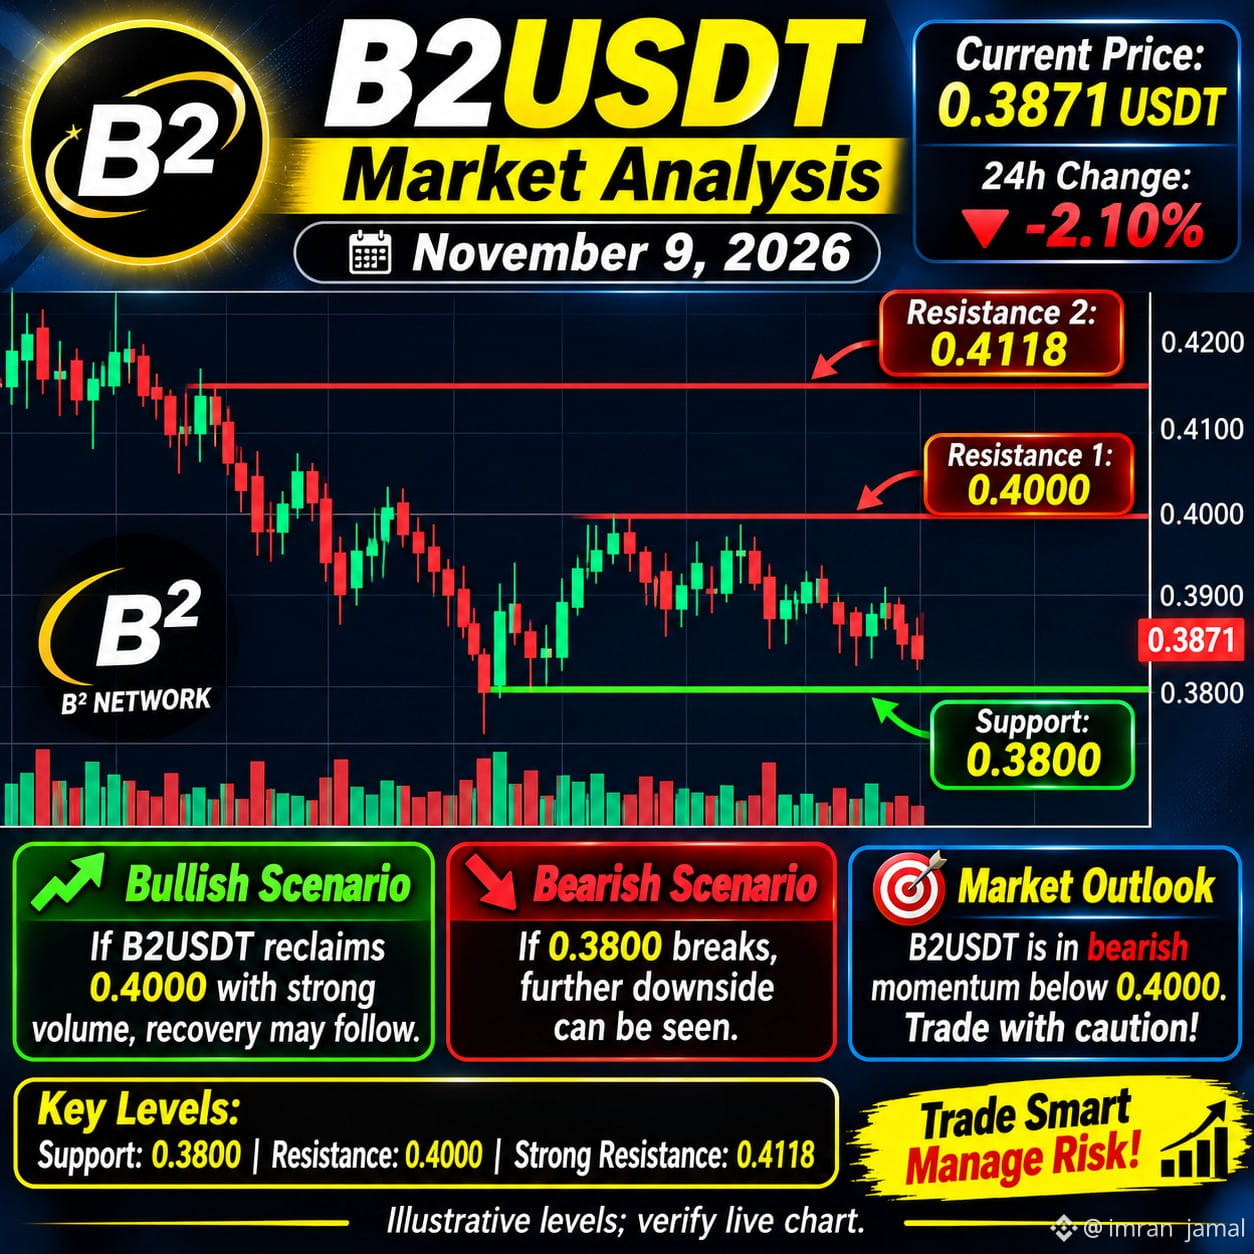
🚀 B2USDT Market Analysis – November 9, 2026
Current Price: $0.3871
24H Change: -2.10% 🔴
📊 Key Technical Levels
Support: $0.3800
Resistance 1: $0.4000
Resistance 2: $0.4118
24H High: $0.4118
24H Low: $0.3802
📉 Bearish Scenario: If B2 breaks below $0.3800, further downside pressure may follow.
📈 Bullish Scenario: A strong breakout above $0.4000 with volume could trigger a recovery toward $0.4118.
Market Outlook: B2USDT is showing short-term bearish momentum. Watch support and volume for the next move.
⚠️ Trade carefully and use proper stop-loss management.
#B2USDT #MarketAnalysis" #Benince #TechnicalLevels
{future}(B2USDT)
$B2
🚀 B2USDT Market Analysis – November 9, 2026
Current Price: $0.3871
24H Change: -2.10% 🔴
📊 Key Technical Levels
Support: $0.3800
Resistance 1: $0.4000
Resistance 2: $0.4118
24H High: $0.4118
24H Low: $0.3802
📉 Bearish Scenario: If B2 breaks below $0.3800, further downside pressure may follow.
📈 Bullish Scenario: A strong breakout above $0.4000 with volume could trigger a recovery toward $0.4118.
Market Outlook: B2USDT is showing short-term bearish momentum. Watch support and volume for the next move.
⚠️ Trade carefully and use proper stop-loss management.
#B2USDT #MarketAnalysis" #Benince #TechnicalLevels
🚀 B2USDT Market Analysis – November 9, 2026
Current Price: $0.3871
24H Change: -2.10% 🔴
📊 Key Technical Levels
Support: $0.3800
Resistance 1: $0.4000
Resistance 2: $0.4118
24H High: $0.4118
24H Low: $0.3802
📉 Bearish Scenario: If B2 breaks below $0.3800, further downside pressure may follow.
📈 Bullish Scenario: A strong breakout above $0.4000 with volume could trigger a recovery toward $0.4118.
Market Outlook: B2USDT is showing short-term bearish momentum. Watch support and volume for the next move.
⚠️ Trade carefully and use proper stop-loss management.
#B2USDT #MarketAnalysis" #Benince #TechnicalLevels
114
·
--
$PFE
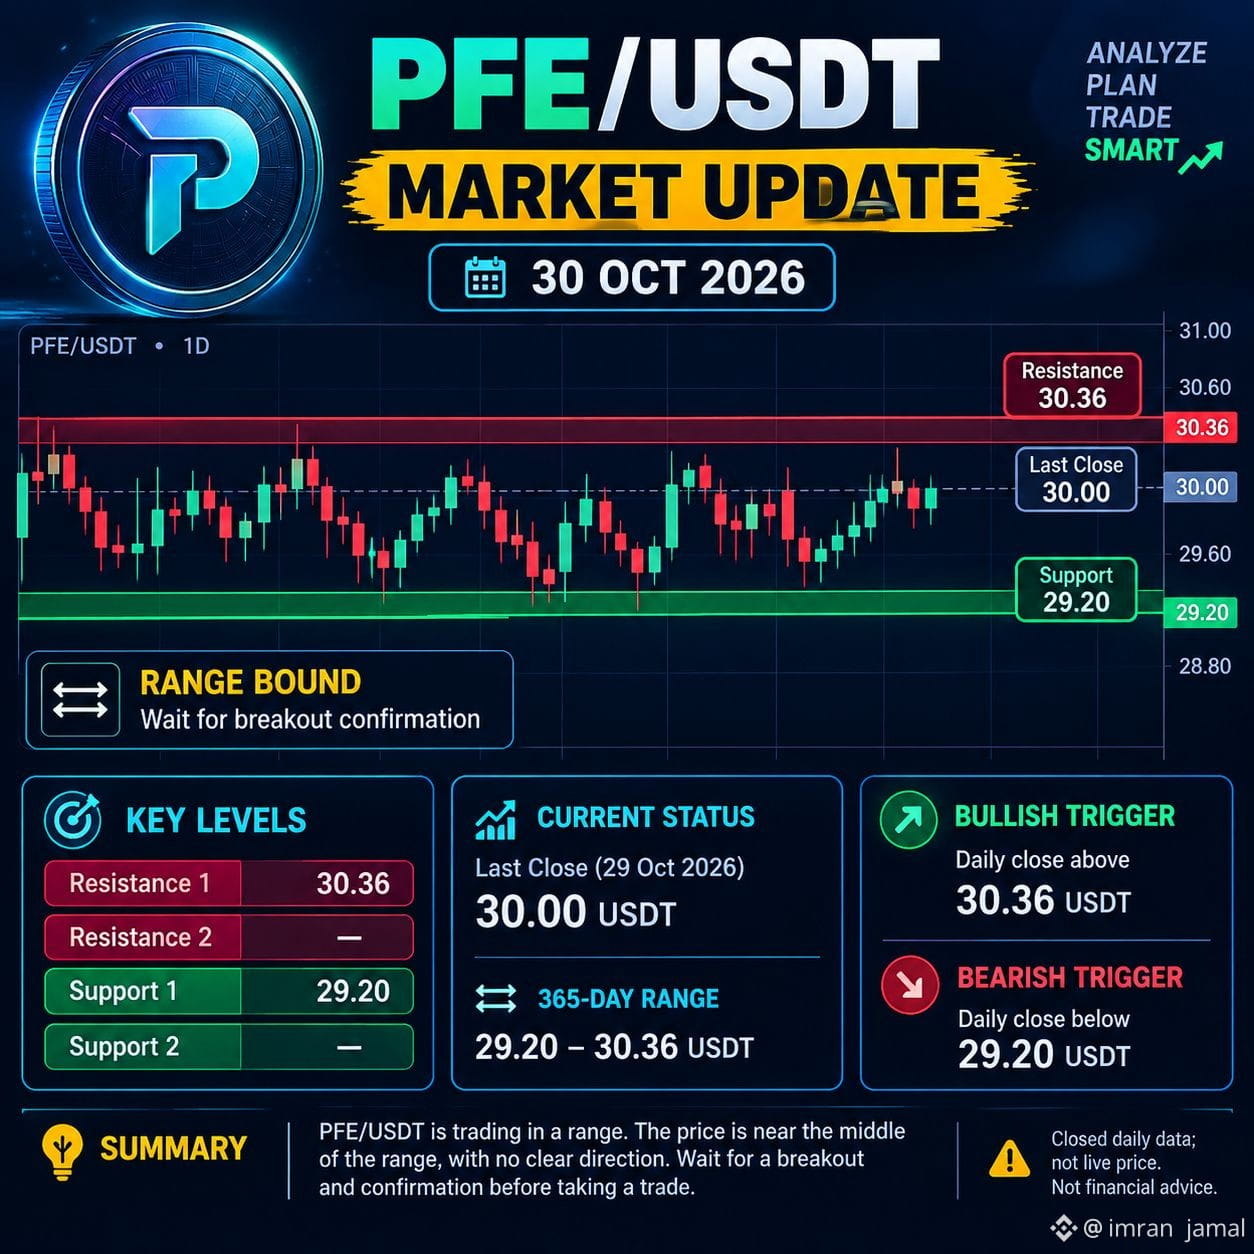
📊 PFE/USDT Market Update – 30 October 2026
🟡 Market Trend: Sideways (Range-Bound)
PFE/USDT is trading around 30.00 USDT, showing consolidation near the middle of its recent trading range. Buyers and sellers are waiting for a clear breakout.
🔑 Key Technical Levels
🟢 Support: 29.20 USDT
🔴 Resistance: 30.36 USDT
Current reference price: 30.00 USDT
📈 Market Outlook
Break above 30.36: Potential bullish momentum.
Break below 29.20: Potential bearish pressure.
Until then: Sideways market expected.
Trading Strategy: Wait for a confirmed breakout with volume before entering a position.
⚠️ Risk management is essential. Not financial advice.
Note: Based on the latest available closed daily data, not a live quote. �
sigloid.com
#PFE #Market_Update #TechnicalLevels
{future}(PFEUSDT)
$PFE
📊 PFE/USDT Market Update – 30 October 2026
🟡 Market Trend: Sideways (Range-Bound)
PFE/USDT is trading around 30.00 USDT, showing consolidation near the middle of its recent trading range. Buyers and sellers are waiting for a clear breakout.
🔑 Key Technical Levels
🟢 Support: 29.20 USDT
🔴 Resistance: 30.36 USDT
Current reference price: 30.00 USDT
📈 Market Outlook
Break above 30.36: Potential bullish momentum.
Break below 29.20: Potential bearish pressure.
Until then: Sideways market expected.
Trading Strategy: Wait for a confirmed breakout with volume before entering a position.
⚠️ Risk management is essential. Not financial advice.
Note: Based on the latest available closed daily data, not a live quote. �
sigloid.com
#PFE #Market_Update #TechnicalLevels
📊 PFE/USDT Market Update – 30 October 2026
🟡 Market Trend: Sideways (Range-Bound)
PFE/USDT is trading around 30.00 USDT, showing consolidation near the middle of its recent trading range. Buyers and sellers are waiting for a clear breakout.
🔑 Key Technical Levels
🟢 Support: 29.20 USDT
🔴 Resistance: 30.36 USDT
Current reference price: 30.00 USDT
📈 Market Outlook
Break above 30.36: Potential bullish momentum.
Break below 29.20: Potential bearish pressure.
Until then: Sideways market expected.
Trading Strategy: Wait for a confirmed breakout with volume before entering a position.
⚠️ Risk management is essential. Not financial advice.
Note: Based on the latest available closed daily data, not a live quote. �
sigloid.com
#PFE #Market_Update #TechnicalLevels
267

SHELLUSDT.P | October 13, 2026: Three Price Areas to Monitor
The supplied 4H analysis provides three key areas for monitoring SHELL. The first is nearby resistance at $0.02307–$0.02314. The second is $0.02468, the recent swing high and the stated level that would challenge the bearish interpretation if a 4H candle closes above it. The third is support at 0.02121–0.02135, with 0.0195 as a lower reference if support fails.
Each level serves a different purpose. The nearby resistance zone helps assess the strength of a rebound. The swing high provides a structural confirmation threshold. The support zone helps evaluate downside risk and possible reactions if price moves lower.
The reference price is 0.02261, with RSI at 41.4 and price below EMA20 and EMA200. This context supports caution, but it does not establish which level will be tested first.
A useful analysis starts by defining what evidence would change the current view. It does not require predicting every short-term movement.
#SHELLUSDT #TechnicalLevels #SupportResistance MarketStructure CryptoAnalysis MyShell BinanceSquare
SHELLUSDT.P | October 13, 2026: Three Price Areas to Monitor
The supplied 4H analysis provides three key areas for monitoring SHELL. The first is nearby resistance at $0.02307–$0.02314. The second is $0.02468, the recent swing high and the stated level that would challenge the bearish interpretation if a 4H candle closes above it. The third is support at 0.02121–0.02135, with 0.0195 as a lower reference if support fails.
Each level serves a different purpose. The nearby resistance zone helps assess the strength of a rebound. The swing high provides a structural confirmation threshold. The support zone helps evaluate downside risk and possible reactions if price moves lower.
The reference price is 0.02261, with RSI at 41.4 and price below EMA20 and EMA200. This context supports caution, but it does not establish which level will be tested first.
A useful analysis starts by defining what evidence would change the current view. It does not require predicting every short-term movement.
#SHELLUSDT #TechnicalLevels #SupportResistance MarketStructure CryptoAnalysis MyShell BinanceSquare
The supplied 4H analysis provides three key areas for monitoring SHELL. The first is nearby resistance at $0.02307–$0.02314. The second is $0.02468, the recent swing high and the stated level that would challenge the bearish interpretation if a 4H candle closes above it. The third is support at 0.02121–0.02135, with 0.0195 as a lower reference if support fails.
Each level serves a different purpose. The nearby resistance zone helps assess the strength of a rebound. The swing high provides a structural confirmation threshold. The support zone helps evaluate downside risk and possible reactions if price moves lower.
The reference price is 0.02261, with RSI at 41.4 and price below EMA20 and EMA200. This context supports caution, but it does not establish which level will be tested first.
A useful analysis starts by defining what evidence would change the current view. It does not require predicting every short-term movement.
#SHELLUSDT #TechnicalLevels #SupportResistance MarketStructure CryptoAnalysis MyShell BinanceSquare
313
SHELLUSDT.P | 13/10/2026: Three price zones, three different roles
The current 4H analysis highlights three areas worth watching. First is the nearby resistance zone at 0.02307–0.02314. Second is the swing high at 0.02468, an important level for reassessing the bearish view if a 4H candle closes above it. Third is the support zone at 0.02121–0.02135, with a reference level of 0.0195 below it if support breaks.
Each area has its own role. The nearby resistance zone helps monitor price action during a rebound. The swing high provides a specific condition for assessing whether the downtrend structure is being challenged. The support zone helps track the risk of further downside and price reactions below.
With a reference price of 0.02261, an RSI of 41.4, and the price below both EMA20 and EMA200, the analysis remains cautious on the 4H timeframe. However, this data does not determine with certainty which zone the price will test first.
A useful analysis plan is to define in advance what would change the outlook, rather than trying to predict every short-term move.
#SHELL #SHELLUSDT #TechnicalLevels SupportResistance MarketStructure CryptoResearch BinanceSquare
SHELLUSDT.P | 13/10/2026: Three price zones, three different roles
The current 4H analysis highlights three areas worth watching. First is the nearby resistance zone at 0.02307–0.02314. Second is the swing high at 0.02468, an important level for reassessing the bearish view if a 4H candle closes above it. Third is the support zone at 0.02121–0.02135, with a reference level of 0.0195 below it if support breaks.
Each area has its own role. The nearby resistance zone helps monitor price action during a rebound. The swing high provides a specific condition for assessing whether the downtrend structure is being challenged. The support zone helps track the risk of further downside and price reactions below.
With a reference price of 0.02261, an RSI of 41.4, and the price below both EMA20 and EMA200, the analysis remains cautious on the 4H timeframe. However, this data does not determine with certainty which zone the price will test first.
A useful analysis plan is to define in advance what would change the outlook, rather than trying to predict every short-term move.
#SHELL #SHELLUSDT #TechnicalLevels SupportResistance MarketStructure CryptoResearch BinanceSquare
The current 4H analysis highlights three areas worth watching. First is the nearby resistance zone at 0.02307–0.02314. Second is the swing high at 0.02468, an important level for reassessing the bearish view if a 4H candle closes above it. Third is the support zone at 0.02121–0.02135, with a reference level of 0.0195 below it if support breaks.
Each area has its own role. The nearby resistance zone helps monitor price action during a rebound. The swing high provides a specific condition for assessing whether the downtrend structure is being challenged. The support zone helps track the risk of further downside and price reactions below.
With a reference price of 0.02261, an RSI of 41.4, and the price below both EMA20 and EMA200, the analysis remains cautious on the 4H timeframe. However, this data does not determine with certainty which zone the price will test first.
A useful analysis plan is to define in advance what would change the outlook, rather than trying to predict every short-term move.
#SHELL #SHELLUSDT #TechnicalLevels SupportResistance MarketStructure CryptoResearch BinanceSquare
51
·
--
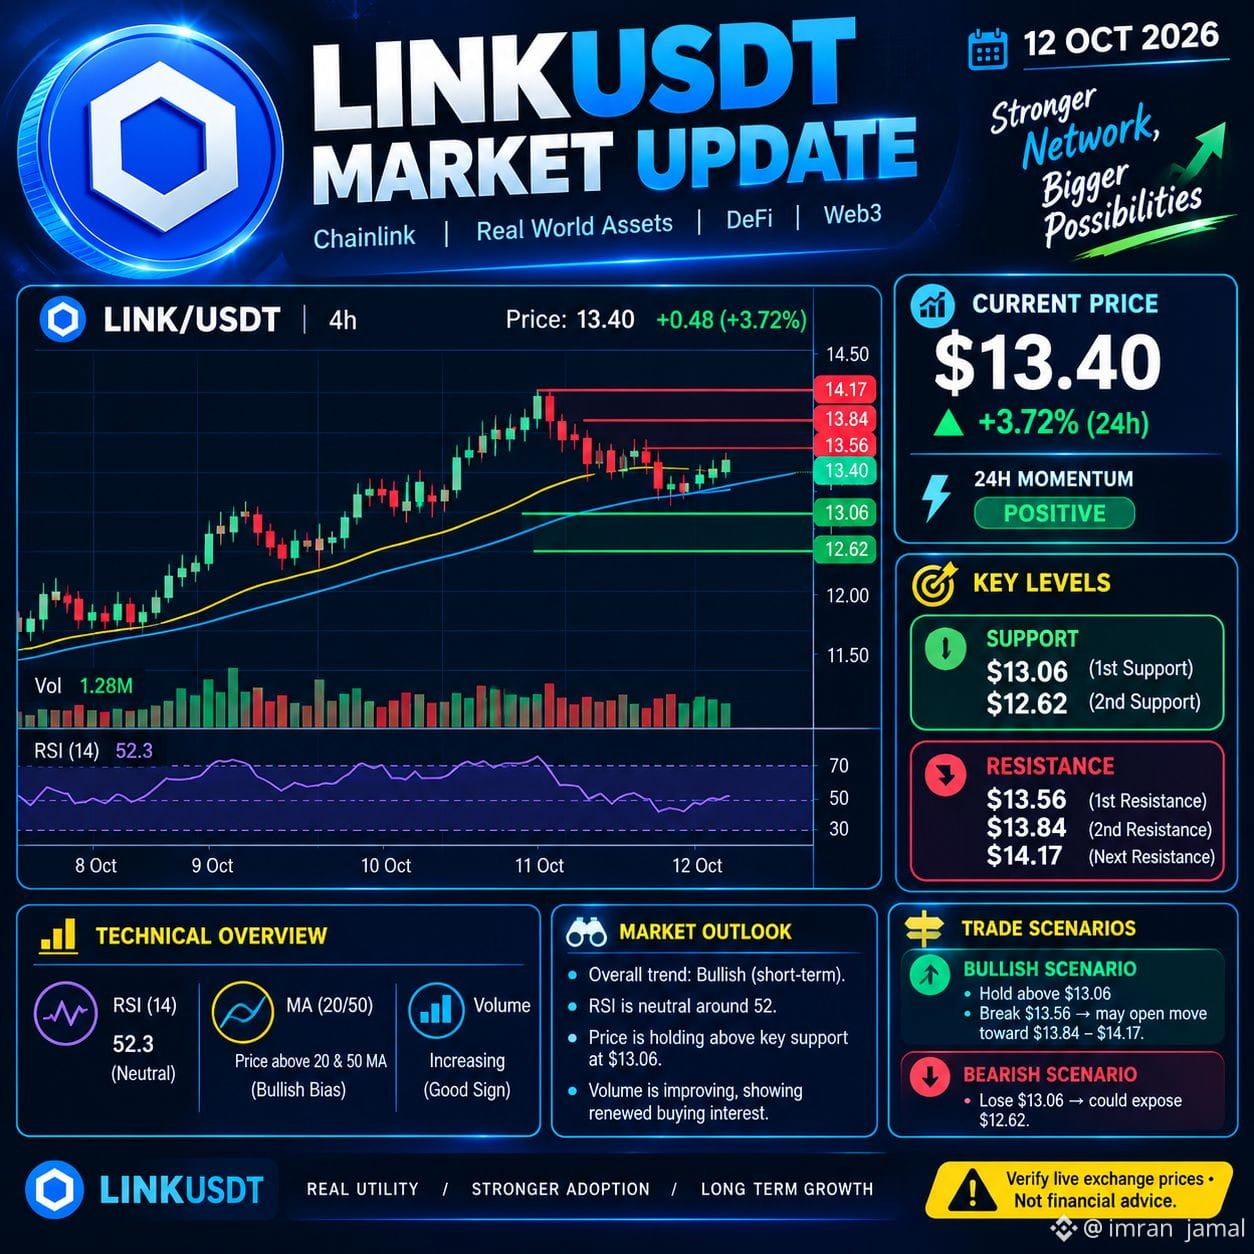
$LINK 📊 LINKUSDT Market Update | 12 October 2026
Chainlink (LINK) is showing positive momentum, trading around $13.40, up approximately 3.7% over 24 hours. Buyers are attempting to extend the recovery, while resistance near $13.56 remains important. �
CoinMarketCap +1
🔑 Key Technical Levels
🟢 Support: $13.06 / $12.62
🔴 Resistance: $13.56 / $13.84 / $14.17
📈 Bullish Scenario
A breakout above $13.56 with strong volume could open the way toward $13.84–$14.17.
📉 Bearish Scenario
If LINK falls below $13.06, the price could retest support near $12.62.
🔍 Market Outlook
Short-term bias: Cautiously bullish. RSI is near neutral, so watch volume and price action for confirmation. �
#Market_Update #TechnicalLevels #LINKPrice
{future}(LINKUSDT)
$LINK 📊 LINKUSDT Market Update | 12 October 2026
Chainlink (LINK) is showing positive momentum, trading around $13.40, up approximately 3.7% over 24 hours. Buyers are attempting to extend the recovery, while resistance near $13.56 remains important. �
CoinMarketCap +1
🔑 Key Technical Levels
🟢 Support: $13.06 / $12.62
🔴 Resistance: $13.56 / $13.84 / $14.17
📈 Bullish Scenario
A breakout above $13.56 with strong volume could open the way toward $13.84–$14.17.
📉 Bearish Scenario
If LINK falls below $13.06, the price could retest support near $12.62.
🔍 Market Outlook
Short-term bias: Cautiously bullish. RSI is near neutral, so watch volume and price action for confirmation. �
#Market_Update #TechnicalLevels #LINKPrice
Chainlink (LINK) is showing positive momentum, trading around $13.40, up approximately 3.7% over 24 hours. Buyers are attempting to extend the recovery, while resistance near $13.56 remains important. �
CoinMarketCap +1
🔑 Key Technical Levels
🟢 Support: $13.06 / $12.62
🔴 Resistance: $13.56 / $13.84 / $14.17
📈 Bullish Scenario
A breakout above $13.56 with strong volume could open the way toward $13.84–$14.17.
📉 Bearish Scenario
If LINK falls below $13.06, the price could retest support near $12.62.
🔍 Market Outlook
Short-term bias: Cautiously bullish. RSI is near neutral, so watch volume and price action for confirmation. �
#Market_Update #TechnicalLevels #LINKPrice
80

Bitcoin is rebounding toward $82,800 following a heavy liquidation event. All eyes are on the $84,400 resistance to see if a move to $87,000 is possible.
#BitcoinRebound #TechnicalLevels
Bitcoin is rebounding toward $82,800 following a heavy liquidation event. All eyes are on the $84,400 resistance to see if a move to $87,000 is possible.
#BitcoinRebound #TechnicalLevels
#BitcoinRebound #TechnicalLevels
10

·
--
Bearish
XRP INVESTORS SHOULD KEEP THEIR EYES ON VOLUME
$XRP is trading near 0.8737, down 9.92%. Price alone does not tell the entire story. Volume can help traders understand whether buyers are returning or sellers remain dominant. I would wait for stronger confirmation before considering a bullish setup and keep risk exposure under control.
NFA. Always DYOR.
#XRP #RippleTrading #VolumeAnalysis #CryptoInvestors #TechnicalLevels
XRP INVESTORS SHOULD KEEP THEIR EYES ON VOLUME
$XRP is trading near 0.8737, down 9.92%. Price alone does not tell the entire story. Volume can help traders understand whether buyers are returning or sellers remain dominant. I would wait for stronger confirmation before considering a bullish setup and keep risk exposure under control.
NFA. Always DYOR.
#XRP #RippleTrading #VolumeAnalysis #CryptoInvestors #TechnicalLevels
$XRP is trading near 0.8737, down 9.92%. Price alone does not tell the entire story. Volume can help traders understand whether buyers are returning or sellers remain dominant. I would wait for stronger confirmation before considering a bullish setup and keep risk exposure under control.
NFA. Always DYOR.
#XRP #RippleTrading #VolumeAnalysis #CryptoInvestors #TechnicalLevels
3
·
--
Bearish
IS BITCOIN APPROACHING A BUYER INTEREST ZONE?
$BTC has fallen to approximately 55,904.9. A 9.65% decline creates an important test for market participants. I would focus on support reactions, trading volume and whether selling pressure is weakening. Buying simply because the market has dropped can be dangerous. Confirmation should come first.
NFA. Always DYOR.
#Bitcoin #BTCTrading #CryptoEducation #TechnicalLevels #TradingPlan
IS BITCOIN APPROACHING A BUYER INTEREST ZONE?
$BTC has fallen to approximately 55,904.9. A 9.65% decline creates an important test for market participants. I would focus on support reactions, trading volume and whether selling pressure is weakening. Buying simply because the market has dropped can be dangerous. Confirmation should come first.
NFA. Always DYOR.
#Bitcoin #BTCTrading #CryptoEducation #TechnicalLevels #TradingPlan
$BTC has fallen to approximately 55,904.9. A 9.65% decline creates an important test for market participants. I would focus on support reactions, trading volume and whether selling pressure is weakening. Buying simply because the market has dropped can be dangerous. Confirmation should come first.
NFA. Always DYOR.
#Bitcoin #BTCTrading #CryptoEducation #TechnicalLevels #TradingPlan

·
--
$BTC TESTING CRITICAL RESISTANCE NEAR $65,900 🔥
Bitcoin slipped back to $64,500 as tech stocks took a hit and retail investors pulled $200M each from Tesla and Apple. The 50-month moving average at $65,900 is showing early signs of resistance, and the anchored VWAP from May's $82K high is also in play.
This level has been a tough nut to crack historically. If BTC can't reclaim $65,900 soon, we might see a deeper retrace before the next leg up. Volume is quiet, but that could change fast.
Will this rejection hold or do you expect a breakout above resistance?
Not financial advice. Always manage your risk.
#BTC #Resistance #BitcoinAnalysis #CryptoMarket #TechnicalLevels
🔥
$BTC TESTING CRITICAL RESISTANCE NEAR $65,900 🔥
Bitcoin slipped back to $64,500 as tech stocks took a hit and retail investors pulled $200M each from Tesla and Apple. The 50-month moving average at $65,900 is showing early signs of resistance, and the anchored VWAP from May's $82K high is also in play.
This level has been a tough nut to crack historically. If BTC can't reclaim $65,900 soon, we might see a deeper retrace before the next leg up. Volume is quiet, but that could change fast.
Will this rejection hold or do you expect a breakout above resistance?
Not financial advice. Always manage your risk.
#BTC #Resistance #BitcoinAnalysis #CryptoMarket #TechnicalLevels
🔥
Bitcoin slipped back to $64,500 as tech stocks took a hit and retail investors pulled $200M each from Tesla and Apple. The 50-month moving average at $65,900 is showing early signs of resistance, and the anchored VWAP from May's $82K high is also in play.
This level has been a tough nut to crack historically. If BTC can't reclaim $65,900 soon, we might see a deeper retrace before the next leg up. Volume is quiet, but that could change fast.
Will this rejection hold or do you expect a breakout above resistance?
Not financial advice. Always manage your risk.
#BTC #Resistance #BitcoinAnalysis #CryptoMarket #TechnicalLevels
🔥
44
Log in to explore more content
Join global crypto users on Binance Square
⚡️ Get latest and useful information about crypto.
💬 Trusted by the world’s largest crypto exchange.
👍 Discover real insights from verified creators.
Email / Phone number
Trending Topics
1
#NvidiaLoses$2.7TrillionInMonthAndAHalf
21,495 views
140 Discussing
2
#CanBTCReboundAfterFallingBelow60K?
787,243 views
3,029 Discussing
3
#GlobalStocksFaceLongestLosingStreakSince2023
287,946 views
2,024 Discussing
4
#BlackRockIBITPostsRecord$541MSingleDayOutflow
34,801 views
105 Discussing
5
#AnthropicPlungesTowardIPOPriceonDay2
148,109 views
1,232 Discussing
6
#TwentyOneCapitalAdds172.25BTC
67,960 views
677 Discussing
7
#HKBillWouldExcludeTokenizedDepositsFromVirtualAssets
9,019 views
50 Discussing
8
#BNBDropsBelow540USDTWith8.46%DailyDecline
80,268 views
657 Discussing
9
#HKBillProposesHK$100KFineForUnauthorizedCryptoTitles
2,696 views
22 Discussing
10
#BitMineFaces$10.1BUnrealizedETHLoss
5,658 views
28 Discussing