
#spcxb
spcxb
429,314 views
3,812 Discussing
Hot
Latest

·
--
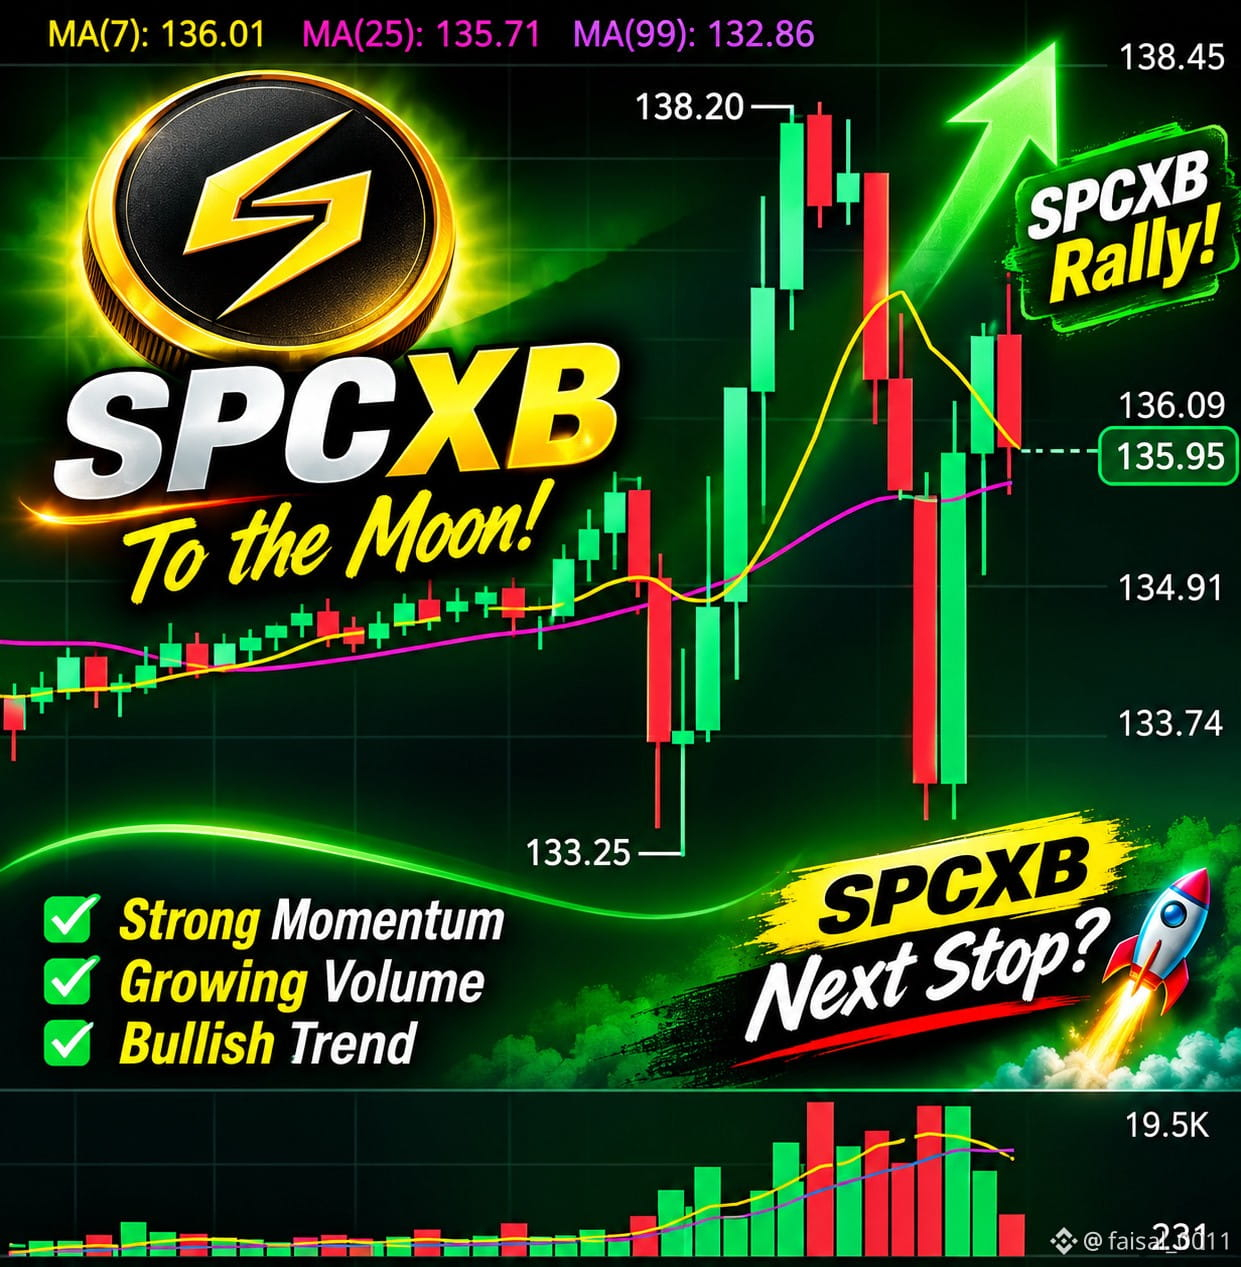
🚨🔥 $SPCXB IS WAKING UP! 👀🚀
The price is moving fast, and traders are starting to take notice! 📈⚡
Is this just the beginning of a bigger breakout?
💥 Momentum rising
🚀 Buyers stepping in
📈 Next move could be explosive!
Are you watching $SPCXB ? 🐂🔥
#TradFiForBeginners #BitcoinFiveWeeklyLosses #spcxb #Binance #binanceworld
{future}(SPCXUSDT)
🚨🔥 $SPCXB IS WAKING UP! 👀🚀
The price is moving fast, and traders are starting to take notice! 📈⚡
Is this just the beginning of a bigger breakout?
💥 Momentum rising
🚀 Buyers stepping in
📈 Next move could be explosive!
Are you watching $SPCXB ? 🐂🔥
#TradFiForBeginners #BitcoinFiveWeeklyLosses #spcxb #Binance #binanceworld
The price is moving fast, and traders are starting to take notice! 📈⚡
Is this just the beginning of a bigger breakout?
💥 Momentum rising
🚀 Buyers stepping in
📈 Next move could be explosive!
Are you watching $SPCXB ? 🐂🔥
#TradFiForBeginners #BitcoinFiveWeeklyLosses #spcxb #Binance #binanceworld
1
153

·
--
$SPCXB looks ready to go higher from here
It is up 3.5 percent today and holding strong
Volume is high at $31.8M today 🚀
RSI is at 64 so it has room to climb
Entry zone 138.9434 to 140.3266
Stop 132.5879
Targets 151.2432 then 158.7054 then 169.8986
Tap $SPCXB to buy it here
#SPCXB #TradingSignals
$SPCXB looks ready to go higher from here
It is up 3.5 percent today and holding strong
Volume is high at $31.8M today 🚀
RSI is at 64 so it has room to climb
Entry zone 138.9434 to 140.3266
Stop 132.5879
Targets 151.2432 then 158.7054 then 169.8986
Tap $SPCXB to buy it here
#SPCXB #TradingSignals
It is up 3.5 percent today and holding strong
Volume is high at $31.8M today 🚀
RSI is at 64 so it has room to climb
Entry zone 138.9434 to 140.3266
Stop 132.5879
Targets 151.2432 then 158.7054 then 169.8986
Tap $SPCXB to buy it here
#SPCXB #TradingSignals

·
--
$SPCXB SPCXB is showing bullish movement: 1.45% (Crypto).
Volume: 27.54M | Last: $137.31
Key signals: high trader activity.
Bias Daily: BULLISH 🟢 | Weekly: BULLISH 🟢
SPCXB gained 2.08% over 24h to $138.05, lifted by NASA contract sentiment and persistent buy-side inflows.
**NASA Contract Selection (High)**: SpaceX chosen for NASA's $10B cargo transport framework → reinforced core operational value and commercial outlook.
- **Strong Spot Inflows (High)**: Persistent net total inflows exceeding $1.3M per hour during peak sessions → propelled price upward past $138.00.
- **Bullish Technical Rebound (Medium)**: Price crossed above EMA 7 ($136.61) and EMA 25 ($135.98) with positive MACD histogram expansion → accelerated upward momentum.
#SPCXB #BinanceSquare #BinanceSquareFamily #NVIDIA #Crypto
$SPCXB SPCXB is showing bullish movement: 1.45% (Crypto).
Volume: 27.54M | Last: $137.31
Key signals: high trader activity.
Bias Daily: BULLISH 🟢 | Weekly: BULLISH 🟢
SPCXB gained 2.08% over 24h to $138.05, lifted by NASA contract sentiment and persistent buy-side inflows.
**NASA Contract Selection (High)**: SpaceX chosen for NASA's $10B cargo transport framework → reinforced core operational value and commercial outlook.
- **Strong Spot Inflows (High)**: Persistent net total inflows exceeding $1.3M per hour during peak sessions → propelled price upward past $138.00.
- **Bullish Technical Rebound (Medium)**: Price crossed above EMA 7 ($136.61) and EMA 25 ($135.98) with positive MACD histogram expansion → accelerated upward momentum.
#SPCXB #BinanceSquare #BinanceSquareFamily #NVIDIA #Crypto
Volume: 27.54M | Last: $137.31
Key signals: high trader activity.
Bias Daily: BULLISH 🟢 | Weekly: BULLISH 🟢
SPCXB gained 2.08% over 24h to $138.05, lifted by NASA contract sentiment and persistent buy-side inflows.
**NASA Contract Selection (High)**: SpaceX chosen for NASA's $10B cargo transport framework → reinforced core operational value and commercial outlook.
- **Strong Spot Inflows (High)**: Persistent net total inflows exceeding $1.3M per hour during peak sessions → propelled price upward past $138.00.
- **Bullish Technical Rebound (Medium)**: Price crossed above EMA 7 ($136.61) and EMA 25 ($135.98) with positive MACD histogram expansion → accelerated upward momentum.
#SPCXB #BinanceSquare #BinanceSquareFamily #NVIDIA #Crypto
13

·
--
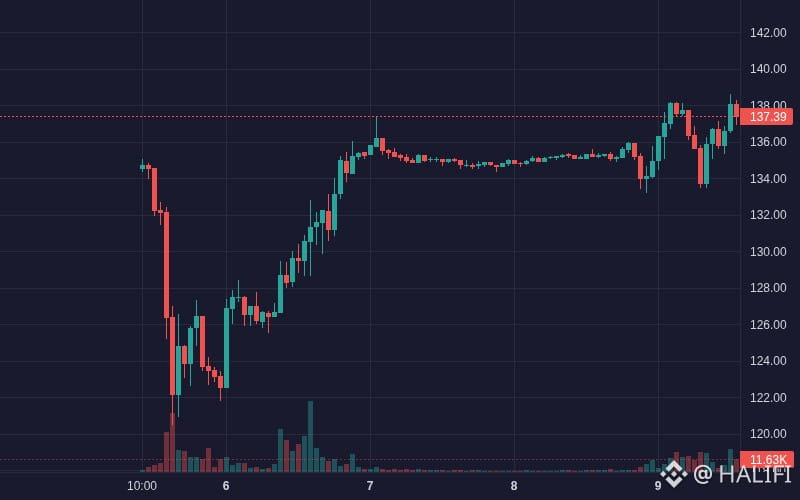
Quiet volume during a 1.44 percent daily rise changes how to read $SPCXB.
At $137.19, SPCXB trades near its 23-hour high of $138.20 while hourly volume sits below the daily average at 0.86x. This disparity hints that recent gains lack broad participation.
A bullish continuation scenario requires a confirmed hourly close above $138.20 on expanding volume. Conversely, dropping below the session low of $133.25 invalidates the move and signals trapped buyers.
Will you wait for a volume-backed breakout past $138.20, or does a drop toward $133.25 change your plan?
Tap $SPCXB for the live chart. #SPCXB #BinanceSquare
Quiet volume during a 1.44 percent daily rise changes how to read $SPCXB .
At $137.19, SPCXB trades near its 23-hour high of $138.20 while hourly volume sits below the daily average at 0.86x. This disparity hints that recent gains lack broad participation.
A bullish continuation scenario requires a confirmed hourly close above $138.20 on expanding volume. Conversely, dropping below the session low of $133.25 invalidates the move and signals trapped buyers.
Will you wait for a volume-backed breakout past $138.20, or does a drop toward $133.25 change your plan?
Tap $SPCXB for the live chart. #SPCXB #BinanceSquare
At $137.19, SPCXB trades near its 23-hour high of $138.20 while hourly volume sits below the daily average at 0.86x. This disparity hints that recent gains lack broad participation.
A bullish continuation scenario requires a confirmed hourly close above $138.20 on expanding volume. Conversely, dropping below the session low of $133.25 invalidates the move and signals trapped buyers.
Will you wait for a volume-backed breakout past $138.20, or does a drop toward $133.25 change your plan?
Tap $SPCXB for the live chart. #SPCXB #BinanceSquare
1
·
--
$SPCXB
{spot}(SPCXBUSDT)
Market Analysis | Daily Chart
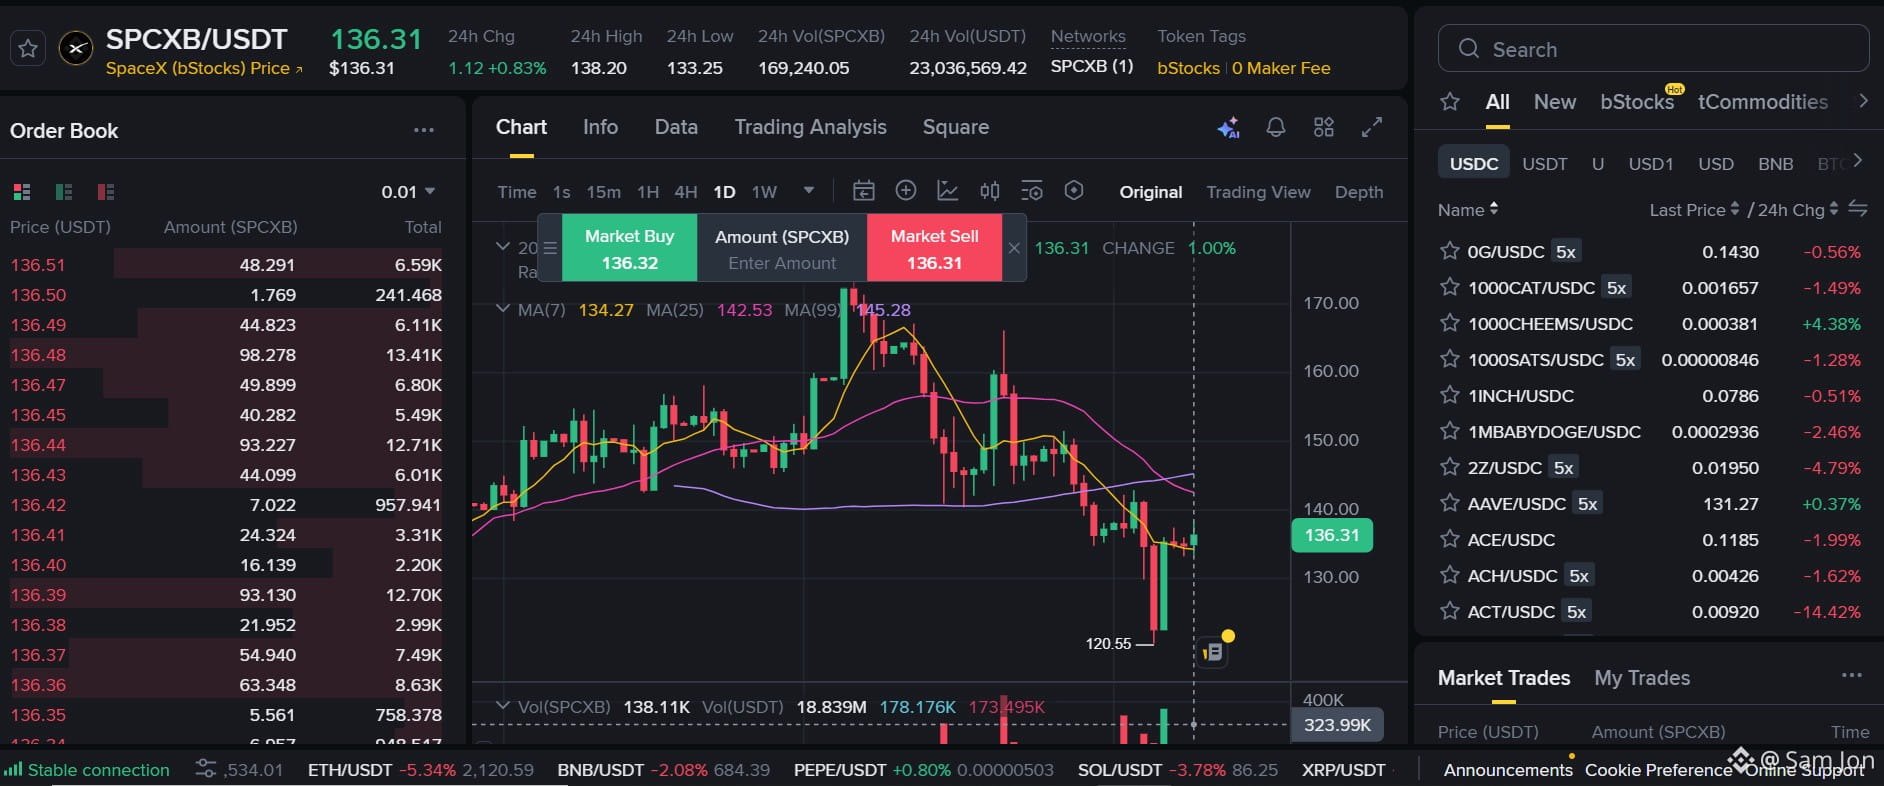
$SPCXB is showing a recovery attempt after a significant period of selling pressure.
The recent rebound suggests that buyers are becoming active around lower levels. However, the broader market structure remains under pressure, with price still trading below the key medium- and long-term moving averages.
At this stage, the market appears to be testing whether the recent recovery has enough strength to develop into a sustained move or whether sellers will regain control.
Market Outlook
The next phase will be important for determining the direction of momentum. A stronger recovery in price structure is needed before the market can establish a convincing trend reversal.
What is your assessment of SPCXB? Is this recovery gaining strength, or is the market still vulnerable to further selling pressure?
#SPCXB #CryptoAnalysis #MarketTrends #BİNANCESQUAR #NvidiaInvestigatesAfterHuang’sAffairApology
$SPCXB
Market Analysis | Daily Chart
$SPCXB is showing a recovery attempt after a significant period of selling pressure.
The recent rebound suggests that buyers are becoming active around lower levels. However, the broader market structure remains under pressure, with price still trading below the key medium- and long-term moving averages.
At this stage, the market appears to be testing whether the recent recovery has enough strength to develop into a sustained move or whether sellers will regain control.
Market Outlook
The next phase will be important for determining the direction of momentum. A stronger recovery in price structure is needed before the market can establish a convincing trend reversal.
What is your assessment of SPCXB? Is this recovery gaining strength, or is the market still vulnerable to further selling pressure?
#SPCXB #CryptoAnalysis #MarketTrends #BİNANCESQUAR #NvidiaInvestigatesAfterHuang’sAffairApology
Market Analysis | Daily Chart
$SPCXB is showing a recovery attempt after a significant period of selling pressure.
The recent rebound suggests that buyers are becoming active around lower levels. However, the broader market structure remains under pressure, with price still trading below the key medium- and long-term moving averages.
At this stage, the market appears to be testing whether the recent recovery has enough strength to develop into a sustained move or whether sellers will regain control.
Market Outlook
The next phase will be important for determining the direction of momentum. A stronger recovery in price structure is needed before the market can establish a convincing trend reversal.
What is your assessment of SPCXB? Is this recovery gaining strength, or is the market still vulnerable to further selling pressure?
#SPCXB #CryptoAnalysis #MarketTrends #BİNANCESQUAR #NvidiaInvestigatesAfterHuang’sAffairApology
115

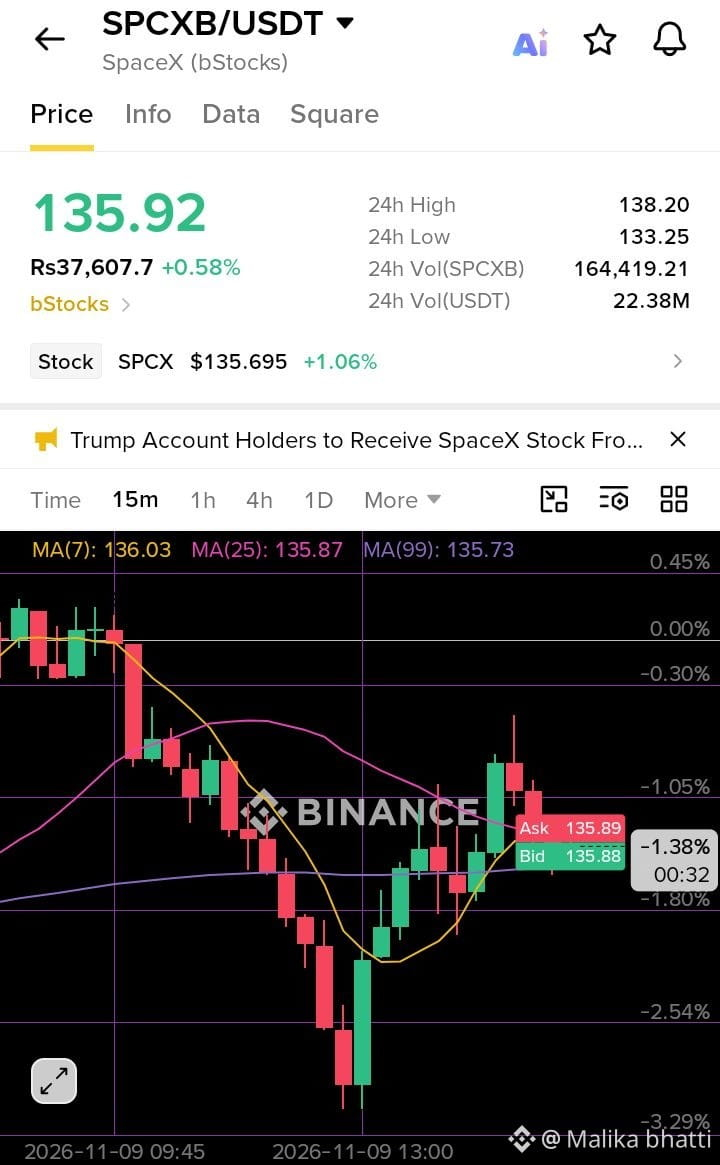
$SPCXB is showing a recovery after a strong downward move. Buyers have pushed the price upward, but recent candles indicate some selling pressure. The short-term trend is still uncertain.
🔹 Resistance: 136.30 – 136.80
🔹 Support: 135.70 – 135.20
🔹 Bullish Signal: A strong candle close above 136.30
🔹 Bearish Signal: A break below 135.70
💰 Current Price: 135.92 USDT
📈 24H Change: +0.58%
#SPCXB #USDT #Binance #CryptoAnalysis #15MTrading
{spot}(SPCXBUSDT)
$SPCXB is showing a recovery after a strong downward move. Buyers have pushed the price upward, but recent candles indicate some selling pressure. The short-term trend is still uncertain.
🔹 Resistance: 136.30 – 136.80
🔹 Support: 135.70 – 135.20
🔹 Bullish Signal: A strong candle close above 136.30
🔹 Bearish Signal: A break below 135.70
💰 Current Price: 135.92 USDT
📈 24H Change: +0.58%
#SPCXB #USDT #Binance #CryptoAnalysis #15MTrading
🔹 Resistance: 136.30 – 136.80
🔹 Support: 135.70 – 135.20
🔹 Bullish Signal: A strong candle close above 136.30
🔹 Bearish Signal: A break below 135.70
💰 Current Price: 135.92 USDT
📈 24H Change: +0.58%
#SPCXB #USDT #Binance #CryptoAnalysis #15MTrading
109
·
--
$SPCXB SPCXB is showing bullish movement: 1.99% (Crypto).
Volume: 12.34M | Last: $137.66
Key signals: high trader activity.
Bias Daily: BULLISH 🟢 | Weekly: BULLISH 🟢
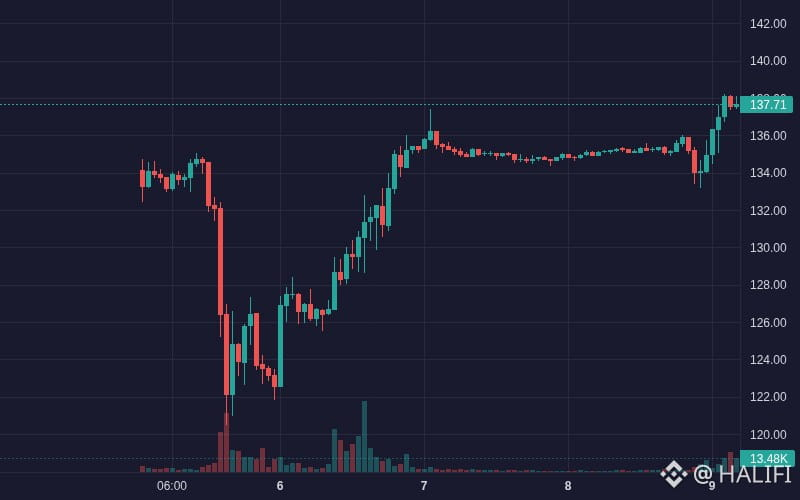
SPCXB gained 1.90% over 24h, reaching $137.52 amid heavy trading volume and upcoming Starship launch catalysts.
**Milestone Anticipation & Ambitious Guidance (High)**: Excitement surrounding mid-November Starship 15 launch and long-term $500B revenue target sparked strong accumulation → buying momentum accelerated.
- **Volume & Inflow Surge (High)**: Trading volume surged to $5.38M alongside +$600.8K net total inflows, pushing price from $133.96 to $138.14.
- **Bullish Trend Alignment (Medium)**: Price crossed above EMA 7/25/99 with MACD turning positive (histogram expanding to +0.26) → confirming short-term breakout.
#SPCXB #BinanceSquare #bitcoin #CryptoNews #Crypto
$SPCXB SPCXB is showing bullish movement: 1.99% (Crypto).
Volume: 12.34M | Last: $137.66
Key signals: high trader activity.
Bias Daily: BULLISH 🟢 | Weekly: BULLISH 🟢
SPCXB gained 1.90% over 24h, reaching $137.52 amid heavy trading volume and upcoming Starship launch catalysts.
**Milestone Anticipation & Ambitious Guidance (High)**: Excitement surrounding mid-November Starship 15 launch and long-term $500B revenue target sparked strong accumulation → buying momentum accelerated.
- **Volume & Inflow Surge (High)**: Trading volume surged to $5.38M alongside +$600.8K net total inflows, pushing price from $133.96 to $138.14.
- **Bullish Trend Alignment (Medium)**: Price crossed above EMA 7/25/99 with MACD turning positive (histogram expanding to +0.26) → confirming short-term breakout.
#SPCXB #BinanceSquare #bitcoin #CryptoNews #Crypto
Volume: 12.34M | Last: $137.66
Key signals: high trader activity.
Bias Daily: BULLISH 🟢 | Weekly: BULLISH 🟢
SPCXB gained 1.90% over 24h, reaching $137.52 amid heavy trading volume and upcoming Starship launch catalysts.
**Milestone Anticipation & Ambitious Guidance (High)**: Excitement surrounding mid-November Starship 15 launch and long-term $500B revenue target sparked strong accumulation → buying momentum accelerated.
- **Volume & Inflow Surge (High)**: Trading volume surged to $5.38M alongside +$600.8K net total inflows, pushing price from $133.96 to $138.14.
- **Bullish Trend Alignment (Medium)**: Price crossed above EMA 7/25/99 with MACD turning positive (histogram expanding to +0.26) → confirming short-term breakout.
#SPCXB #BinanceSquare #bitcoin #CryptoNews #Crypto
14


$SPCXB: When Volume Sparks Overconfidence
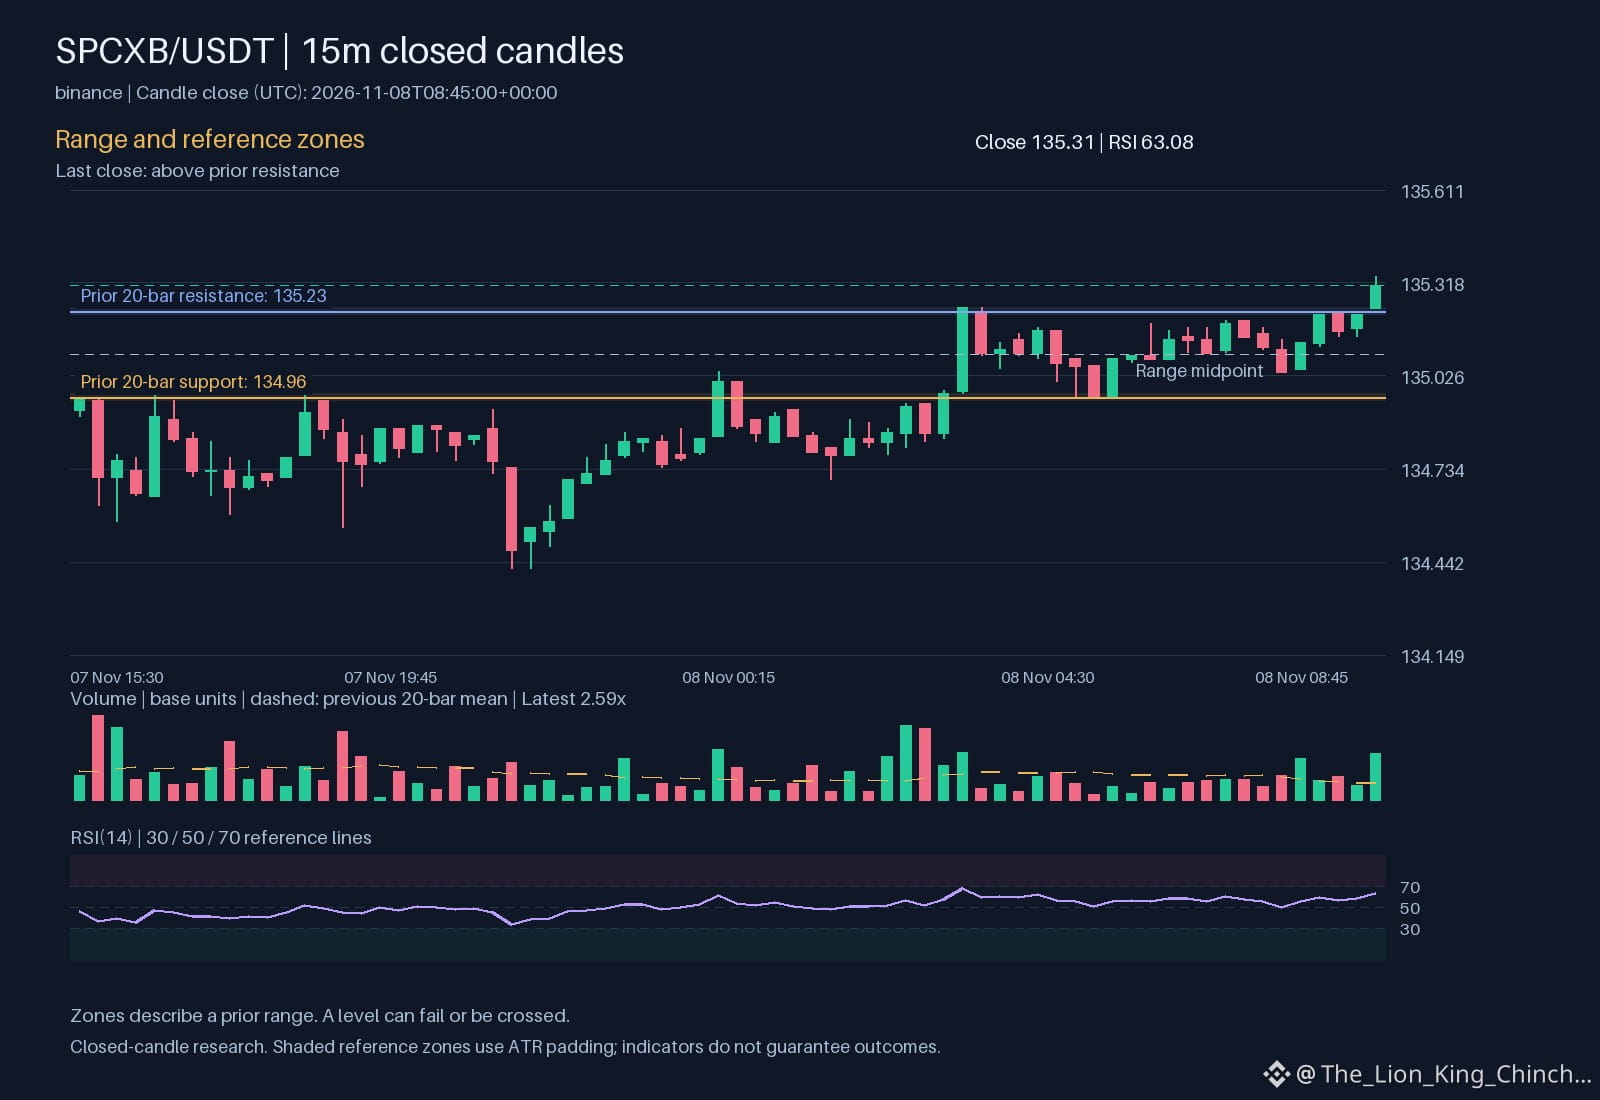
The current snapshot shows $SPCXB trading above resistance with an hourly direction up and volume above baseline. This combination often triggers the anchoring bias, where traders fixate on the recent upward move and expect it to continue, ignoring broader context.
**The decision bias**
Anchoring leads people to treat the latest price action as a reference point. In this case, the visible strength may cause a trader to assume the rally will persist, even if other signals are neutral.
**How it changes a research decision**
When anchoring dominates, a researcher might skip a deeper check of support levels or trend strength, relying solely on the observed volume surge. This shortcuts the analysis and can result in over‑exposure if the move reverses.
**A practical self‑check**
- Pause and write down the most recent price level that influenced your view.
- Ask yourself: "If I started observing the chart a week earlier, would I still consider this level the most important?"
- Compare that answer with an objective metric such as 2.5887 or the 134.96 level.
By actively questioning the anchor, you reduce the risk of chasing a false signal. Remember, volume spikes can be temporary, and the market may retest lower zones before resuming any trend. 🌱
Probabilistic market research, not a recommendation or guaranteed return.
Would you keep the same rule after missing a move?
#SPCXB #TradingPsychology #CryptoLearning
$SPCXB : When Volume Sparks Overconfidence
The current snapshot shows $SPCXB trading above resistance with an hourly direction up and volume above baseline. This combination often triggers the anchoring bias, where traders fixate on the recent upward move and expect it to continue, ignoring broader context.
**The decision bias**
Anchoring leads people to treat the latest price action as a reference point. In this case, the visible strength may cause a trader to assume the rally will persist, even if other signals are neutral.
**How it changes a research decision**
When anchoring dominates, a researcher might skip a deeper check of support levels or trend strength, relying solely on the observed volume surge. This shortcuts the analysis and can result in over‑exposure if the move reverses.
**A practical self‑check**
- Pause and write down the most recent price level that influenced your view.
- Ask yourself: "If I started observing the chart a week earlier, would I still consider this level the most important?"
- Compare that answer with an objective metric such as 2.5887 or the 134.96 level.
By actively questioning the anchor, you reduce the risk of chasing a false signal. Remember, volume spikes can be temporary, and the market may retest lower zones before resuming any trend. 🌱
Probabilistic market research, not a recommendation or guaranteed return.
Would you keep the same rule after missing a move?
#SPCXB #TradingPsychology #CryptoLearning
The current snapshot shows $SPCXB trading above resistance with an hourly direction up and volume above baseline. This combination often triggers the anchoring bias, where traders fixate on the recent upward move and expect it to continue, ignoring broader context.
**The decision bias**
Anchoring leads people to treat the latest price action as a reference point. In this case, the visible strength may cause a trader to assume the rally will persist, even if other signals are neutral.
**How it changes a research decision**
When anchoring dominates, a researcher might skip a deeper check of support levels or trend strength, relying solely on the observed volume surge. This shortcuts the analysis and can result in over‑exposure if the move reverses.
**A practical self‑check**
- Pause and write down the most recent price level that influenced your view.
- Ask yourself: "If I started observing the chart a week earlier, would I still consider this level the most important?"
- Compare that answer with an objective metric such as 2.5887 or the 134.96 level.
By actively questioning the anchor, you reduce the risk of chasing a false signal. Remember, volume spikes can be temporary, and the market may retest lower zones before resuming any trend. 🌱
Probabilistic market research, not a recommendation or guaranteed return.
Would you keep the same rule after missing a move?
#SPCXB #TradingPsychology #CryptoLearning
46

·
--
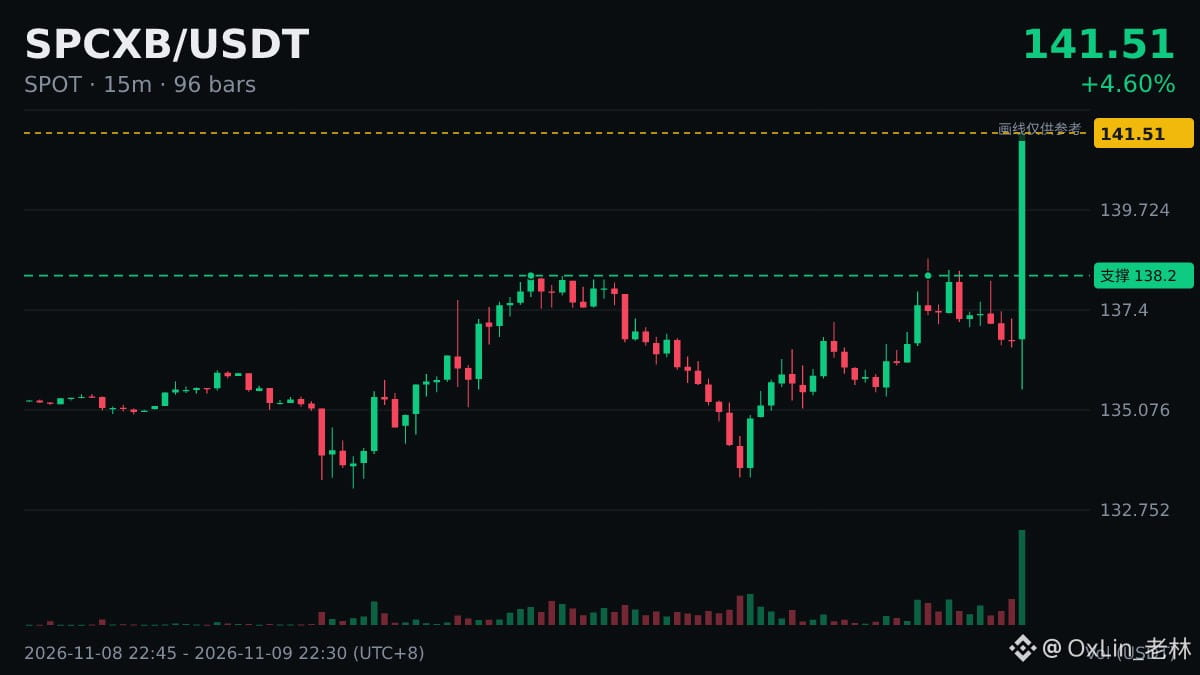
May the market move soon. It broke through the 140 level: $SPCXB .
Things that take several tries to get through are usually more solid.
I’ll make a note of it for now and wait for the market to give its own answer. Have you ever experienced this?
May you understand the winds and waves. Wallet 30% cashback code B1991, always by your side.
#SPCXB
May the market move soon. It broke through the 140 level: $SPCXB .
Things that take several tries to get through are usually more solid.
I’ll make a note of it for now and wait for the market to give its own answer. Have you ever experienced this?
May you understand the winds and waves. Wallet 30% cashback code B1991, always by your side.
#SPCXB
Things that take several tries to get through are usually more solid.
I’ll make a note of it for now and wait for the market to give its own answer. Have you ever experienced this?
May you understand the winds and waves. Wallet 30% cashback code B1991, always by your side.
#SPCXB
65

·
--
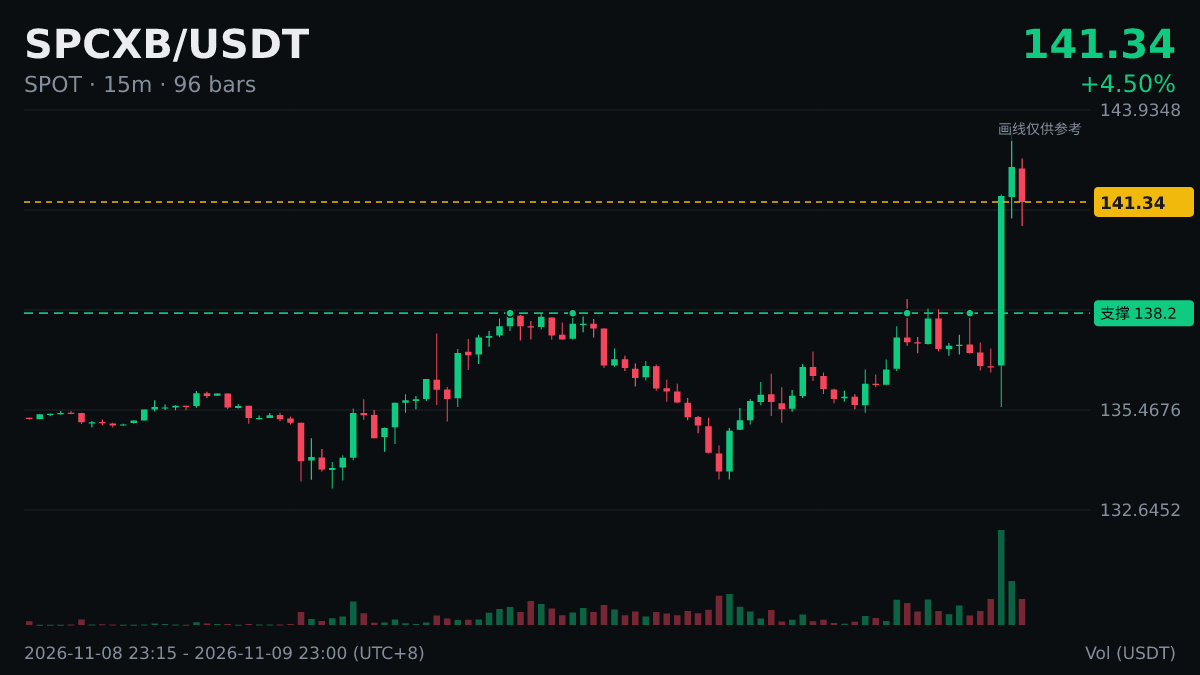
🐋 $SPCXB 1-hour trading volume was approximately $6.76 million, 5.5 times the previous average; the price rose 3.12% over the same period.
When volume surges, many people’s first thought is that big money has arrived—but not necessarily.
Price and volume should be considered together: where the price is trading and how long the wicks are are usually more informative than volume alone.
Sometimes a volume spike comes from a cluster of liquidations. Liquidation orders are forced trades, so this kind of volume has a different significance from active trading. Consider it alongside liquidation data.
The same reading can mean very different things in different market conditions, so don’t blindly apply a single rule.
#SPCXB
This content is for reference only. You’re responsible for your own trading.
🐋 $SPCXB 1-hour trading volume was approximately $6.76 million, 5.5 times the previous average; the price rose 3.12% over the same period.
When volume surges, many people’s first thought is that big money has arrived—but not necessarily.
Price and volume should be considered together: where the price is trading and how long the wicks are are usually more informative than volume alone.
Sometimes a volume spike comes from a cluster of liquidations. Liquidation orders are forced trades, so this kind of volume has a different significance from active trading. Consider it alongside liquidation data.
The same reading can mean very different things in different market conditions, so don’t blindly apply a single rule.
#SPCXB
This content is for reference only. You’re responsible for your own trading.
When volume surges, many people’s first thought is that big money has arrived—but not necessarily.
Price and volume should be considered together: where the price is trading and how long the wicks are are usually more informative than volume alone.
Sometimes a volume spike comes from a cluster of liquidations. Liquidation orders are forced trades, so this kind of volume has a different significance from active trading. Consider it alongside liquidation data.
The same reading can mean very different things in different market conditions, so don’t blindly apply a single rule.
#SPCXB
This content is for reference only. You’re responsible for your own trading.
34

$SPCXB Trade Recap: Surviving the Black Swan & Locking In Profits 📈
Walking away from today’s session in the green feels like a massive win—especially after last night’s black swan event and a few questionable decisions on my end. Sometimes Lady Luck helps you dodge the worst, but disciplined profit-taking is what actually secures the bag.
Here is how I managed my $SPCXB position today:
70% Profit Secured: I closed out 70% of my position to lock in gains and reduce exposure heading into the weekend.
30% Runner Remaining: My original plan was to trim 80% and leave 20%, but the price action near the close was simply too strong. I decided to leave an extra 10% on the table to ride any potential continuation.
Risk Management First: Even when momentum looks tempting, trimming into strength protects capital and keeps emotions out of the trade.
Wishing everyone a restful weekend—take time to recharge, step away from the charts, and let’s come back sharp for Monday’s session!
How did you handle the volatility over the last 24 hours? Drop your thoughts below! 👇
#spcxb #CryptoTrading #RiskManagement #TradingJournal #BinanceSquare
$SPCXB Trade Recap: Surviving the Black Swan & Locking In Profits 📈
Walking away from today’s session in the green feels like a massive win—especially after last night’s black swan event and a few questionable decisions on my end. Sometimes Lady Luck helps you dodge the worst, but disciplined profit-taking is what actually secures the bag.
Here is how I managed my $SPCXB position today:
70% Profit Secured: I closed out 70% of my position to lock in gains and reduce exposure heading into the weekend.
30% Runner Remaining: My original plan was to trim 80% and leave 20%, but the price action near the close was simply too strong. I decided to leave an extra 10% on the table to ride any potential continuation.
Risk Management First: Even when momentum looks tempting, trimming into strength protects capital and keeps emotions out of the trade.
Wishing everyone a restful weekend—take time to recharge, step away from the charts, and let’s come back sharp for Monday’s session!
How did you handle the volatility over the last 24 hours? Drop your thoughts below! 👇
#spcxb #CryptoTrading #RiskManagement #TradingJournal #BinanceSquare
Walking away from today’s session in the green feels like a massive win—especially after last night’s black swan event and a few questionable decisions on my end. Sometimes Lady Luck helps you dodge the worst, but disciplined profit-taking is what actually secures the bag.
Here is how I managed my $SPCXB position today:
70% Profit Secured: I closed out 70% of my position to lock in gains and reduce exposure heading into the weekend.
30% Runner Remaining: My original plan was to trim 80% and leave 20%, but the price action near the close was simply too strong. I decided to leave an extra 10% on the table to ride any potential continuation.
Risk Management First: Even when momentum looks tempting, trimming into strength protects capital and keeps emotions out of the trade.
Wishing everyone a restful weekend—take time to recharge, step away from the charts, and let’s come back sharp for Monday’s session!
How did you handle the volatility over the last 24 hours? Drop your thoughts below! 👇
#spcxb #CryptoTrading #RiskManagement #TradingJournal #BinanceSquare
149

·
--
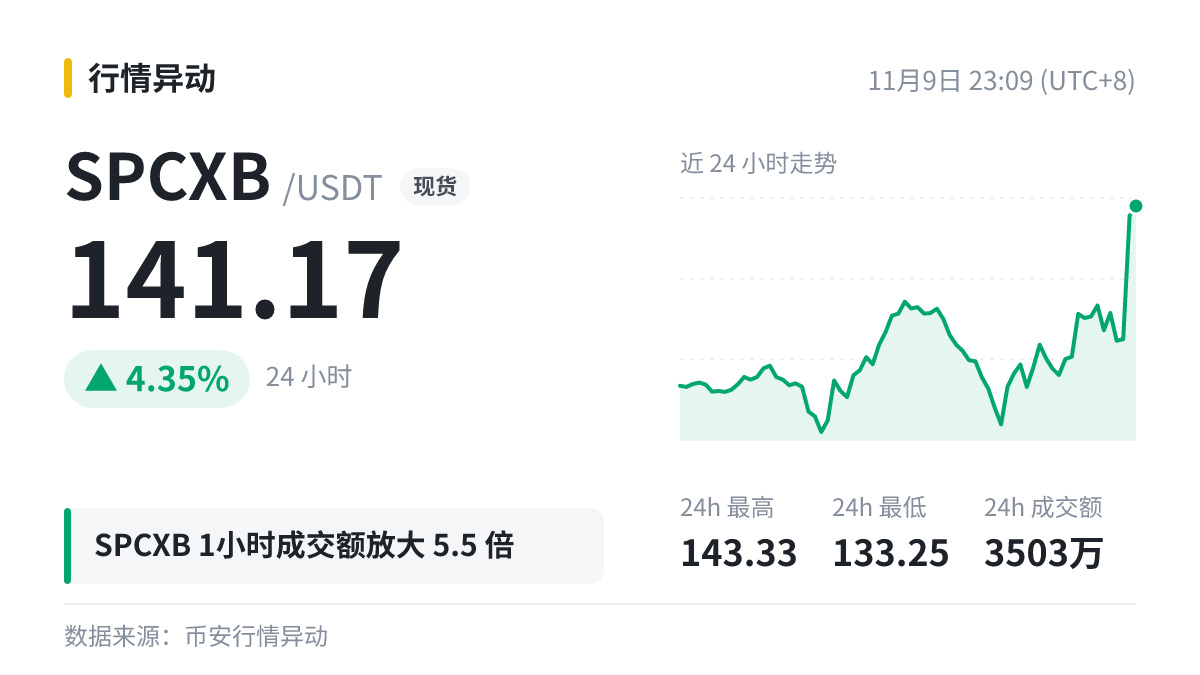
$SPCXB The 1-hour trading turnover rose to 5.5 times its average, with the price up 3.12%.
After a volume spike, there are usually three things to watch:
1) Price direction: upward
2) Whether high volume continues; a single volume spike can be a one-off
3) The range of the high-volume candlestick, which often becomes a short-term dividing line
Which direction are you more bullish on?
#SPCXB
When markets are volatile, manage risk first.
$SPCXB The 1-hour trading turnover rose to 5.5 times its average, with the price up 3.12%.
After a volume spike, there are usually three things to watch:
1) Price direction: upward
2) Whether high volume continues; a single volume spike can be a one-off
3) The range of the high-volume candlestick, which often becomes a short-term dividing line
Which direction are you more bullish on?
#SPCXB
When markets are volatile, manage risk first.
After a volume spike, there are usually three things to watch:
1) Price direction: upward
2) Whether high volume continues; a single volume spike can be a one-off
3) The range of the high-volume candlestick, which often becomes a short-term dividing line
Which direction are you more bullish on?
#SPCXB
When markets are volatile, manage risk first.
12

·
--
🗒️ $SPCXB Gain Breakdown
5 minutes: +2.23%
1h: +2.7%
4h: +3.91%
24h: +4.28%
Current price: 141.04, 24h trading volume: $32.52 million
The 24h gain exceeds this rally, and the trend has been going on for a while.
Can the bulls hold on to their gains?
#SPCXB
This view may not be accurate. Trade at your own risk.
🗒️ $SPCXB Gain Breakdown
5 minutes: +2.23%
1h: +2.7%
4h: +3.91%
24h: +4.28%
Current price: 141.04, 24h trading volume: $32.52 million
The 24h gain exceeds this rally, and the trend has been going on for a while.
Can the bulls hold on to their gains?
#SPCXB
This view may not be accurate. Trade at your own risk.
5 minutes: +2.23%
1h: +2.7%
4h: +3.91%
24h: +4.28%
Current price: 141.04, 24h trading volume: $32.52 million
The 24h gain exceeds this rally, and the trend has been going on for a while.
Can the bulls hold on to their gains?
#SPCXB
This view may not be accurate. Trade at your own risk.

·
--
$SPCXB |1-hour volume surged 5.5x|Price up 3.12%
Before looking at fund flows, first understand what a volume surge means.
A spike in volume sometimes appears before a price move, so many people treat a sudden surge in volume as a cue to pay attention to a coin. The direction still needs to be confirmed by how the candlesticks develop.
When volume surges but the price stays largely flat, it means buyers and sellers are exchanging hands in significant volume at this level. Which way the price moves next depends on which side gives way first.
Unusually high readings often come with greater volatility. At times like this, it’s wiser to reduce your position rather than make a big bet.
#SPCXB
$SPCXB |1-hour volume surged 5.5x|Price up 3.12%
Before looking at fund flows, first understand what a volume surge means.
A spike in volume sometimes appears before a price move, so many people treat a sudden surge in volume as a cue to pay attention to a coin. The direction still needs to be confirmed by how the candlesticks develop.
When volume surges but the price stays largely flat, it means buyers and sellers are exchanging hands in significant volume at this level. Which way the price moves next depends on which side gives way first.
Unusually high readings often come with greater volatility. At times like this, it’s wiser to reduce your position rather than make a big bet.
#SPCXB
Before looking at fund flows, first understand what a volume surge means.
A spike in volume sometimes appears before a price move, so many people treat a sudden surge in volume as a cue to pay attention to a coin. The direction still needs to be confirmed by how the candlesticks develop.
When volume surges but the price stays largely flat, it means buyers and sellers are exchanging hands in significant volume at this level. Which way the price moves next depends on which side gives way first.
Unusually high readings often come with greater volatility. At times like this, it’s wiser to reduce your position rather than make a big bet.
#SPCXB
84

·
--
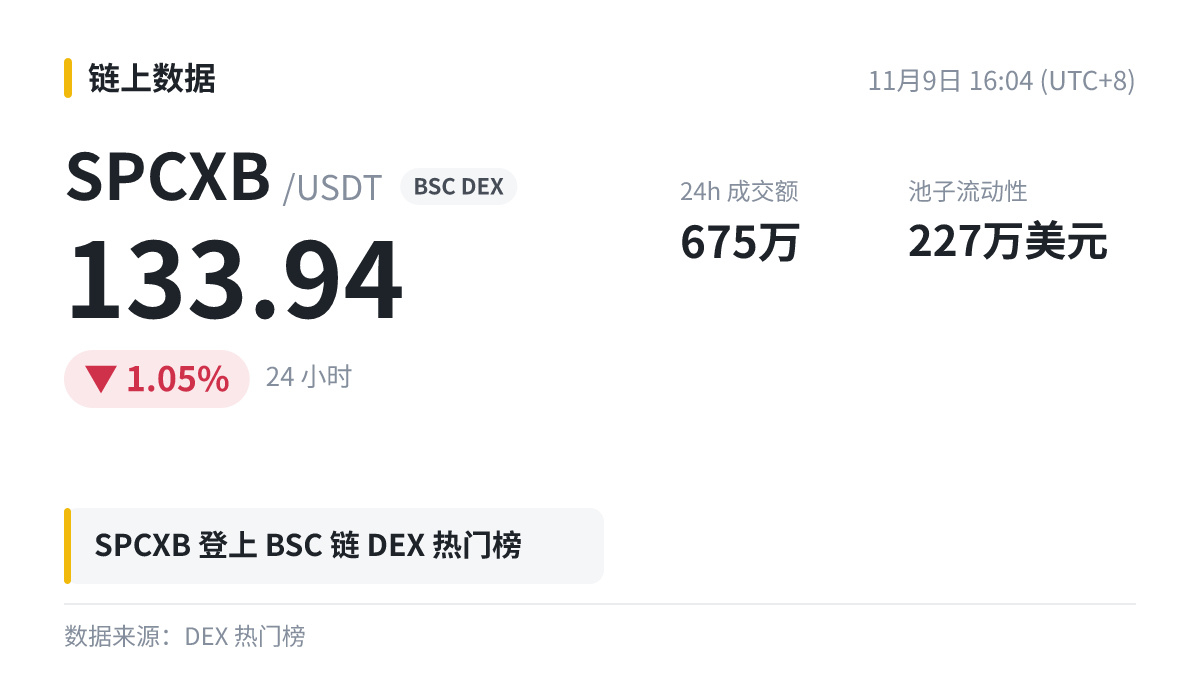
Is hot money flowing on-chain into $SPCXB ?
BSC DEX trending list: -1.05% in 24h, with $2.27 million in pool liquidity.
On-chain hot money can enter and exit quickly. Watch for declines in pool liquidity—a sudden drop is often a risk signal.
#SPCXB
Is hot money flowing on-chain into $SPCXB ?
BSC DEX trending list: -1.05% in 24h, with $2.27 million in pool liquidity.
On-chain hot money can enter and exit quickly. Watch for declines in pool liquidity—a sudden drop is often a risk signal.
#SPCXB
BSC DEX trending list: -1.05% in 24h, with $2.27 million in pool liquidity.
On-chain hot money can enter and exit quickly. Watch for declines in pool liquidity—a sudden drop is often a risk signal.
#SPCXB

·
--
$ZRO +0.68% | $XPL +0.60% | $SPCXB +0.58%
#ZRO holds at $1.63, nudging up 0.68% on $1.9 M of volume. The modest rise suggests some buyer interest but the trade size remains limited.
#XPL trades at $0.0573, edging higher 0.60% with $2.8 M changing hands. The volume outpaces the price move, hinting at possible accumulation.
#SPCXB is priced at $134.83, climbing 0.58% on a solid $6.8 M volume. The stronger turnover may give this gain a firmer footing.
📌 Keep an eye on whether the volume differentials translate into sustained momentum for any of these assets.
#Write2Earn #Binance
$ZRO +0.68% | $XPL +0.60% | $SPCXB +0.58%
#ZRO holds at $1.63, nudging up 0.68% on $1.9 M of volume. The modest rise suggests some buyer interest but the trade size remains limited.
#XPL trades at $0.0573, edging higher 0.60% with $2.8 M changing hands. The volume outpaces the price move, hinting at possible accumulation.
#SPCXB is priced at $134.83, climbing 0.58% on a solid $6.8 M volume. The stronger turnover may give this gain a firmer footing.
📌 Keep an eye on whether the volume differentials translate into sustained momentum for any of these assets.
#Write2Earn #Binance
#ZRO holds at $1.63, nudging up 0.68% on $1.9 M of volume. The modest rise suggests some buyer interest but the trade size remains limited.
#XPL trades at $0.0573, edging higher 0.60% with $2.8 M changing hands. The volume outpaces the price move, hinting at possible accumulation.
#SPCXB is priced at $134.83, climbing 0.58% on a solid $6.8 M volume. The stronger turnover may give this gain a firmer footing.
📌 Keep an eye on whether the volume differentials translate into sustained momentum for any of these assets.
#Write2Earn #Binance
33

·
--
$SPCXB Short-term sell signal: RSI 73, overbought; price touched the upper Bollinger Band at 138.070, with resistance at 138.200. Watch for a spike followed by a pullback. Stop loss: 139.289. Technical analysis only, not investment advice. #SPCXB #Sell
$SPCXB Short-term sell signal: RSI 73, overbought; price touched the upper Bollinger Band at 138.070, with resistance at 138.200. Watch for a spike followed by a pullback. Stop loss: 139.289. Technical analysis only, not investment advice. #SPCXB #Sell
54
·
--
🔥 It’s picking up|$SPCXB 24-hour trading volume: 5040919.01 USDT, current price: 135.25 USDT.
📊 Data snapshot
· Current price: 135.25 USDT
· 24h: +0.27%
· Range: 133.25 — 136.00
· Trading volume: 5040919.01 USDT
Volume is picking up, and the price is moving too. But volume matters more than price—bulls and bears are clearly battling it out this time.
Volatility doesn’t equal opportunity.
Are you keeping an eye on it? 👇
#市场观察 #SPCXB #Binance
🔥 It’s picking up|$SPCXB 24-hour trading volume: 5040919.01 USDT, current price: 135.25 USDT.
📊 Data snapshot
· Current price: 135.25 USDT
· 24h: +0.27%
· Range: 133.25 — 136.00
· Trading volume: 5040919.01 USDT
Volume is picking up, and the price is moving too. But volume matters more than price—bulls and bears are clearly battling it out this time.
Volatility doesn’t equal opportunity.
Are you keeping an eye on it? 👇
#市场观察 #SPCXB #Binance
📊 Data snapshot
· Current price: 135.25 USDT
· 24h: +0.27%
· Range: 133.25 — 136.00
· Trading volume: 5040919.01 USDT
Volume is picking up, and the price is moving too. But volume matters more than price—bulls and bears are clearly battling it out this time.
Volatility doesn’t equal opportunity.
Are you keeping an eye on it? 👇
#市场观察 #SPCXB #Binance

30

·
--
🚨 $SPCXB
{spot}(SPCXBUSDT)
BIG MOVE INCOMING? 🚀🔥
📅 November 7 Market Update
- Price: $135.02
- 24H Change: +3.70%
- Market Cap: $206.79M
- Volume: $39.36M
📊 KEY LEVELS:
- Support: $128.80
- Resistance: $136.80
- Next Target: $142.50
🟢 Break above $136.80 = Bullish momentum.
🔴 Drop below $128.80 = Downside risk.
⚡ MY VIEW: Momentum is positive, but wait for breakout confirmation.
💬 SPCXB: BUY, SELL OR WAIT?
⚠️ DYOR. Not financial advice.
#spcxb #SpaceX #crypto #trading
🚨 $SPCXB
BIG MOVE INCOMING? 🚀🔥
📅 November 7 Market Update
- Price: $135.02
- 24H Change: +3.70%
- Market Cap: $206.79M
- Volume: $39.36M
📊 KEY LEVELS:
- Support: $128.80
- Resistance: $136.80
- Next Target: $142.50
🟢 Break above $136.80 = Bullish momentum.
🔴 Drop below $128.80 = Downside risk.
⚡ MY VIEW: Momentum is positive, but wait for breakout confirmation.
💬 SPCXB: BUY, SELL OR WAIT?
⚠️ DYOR. Not financial advice.
#spcxb #SpaceX #crypto #trading
BIG MOVE INCOMING? 🚀🔥
📅 November 7 Market Update
- Price: $135.02
- 24H Change: +3.70%
- Market Cap: $206.79M
- Volume: $39.36M
📊 KEY LEVELS:
- Support: $128.80
- Resistance: $136.80
- Next Target: $142.50
🟢 Break above $136.80 = Bullish momentum.
🔴 Drop below $128.80 = Downside risk.
⚡ MY VIEW: Momentum is positive, but wait for breakout confirmation.
💬 SPCXB: BUY, SELL OR WAIT?
⚠️ DYOR. Not financial advice.
#spcxb #SpaceX #crypto #trading

3
71
·
--
$SPCXB +2.18% | $GAL +1.48% | $DODO +1.27%
#SPCXB nudged up to $135.03, gaining +2.18% on $15.7 M of volume.
#GAL rose to $2.54, up +1.48% with $1.3 M traded.
#DODO inched higher to $0.0222, climbing +1.27% on $1.9 M of volume.
📈 The trio’s modest lifts are backed by solid flow, but the spread in volume suggests SPCXB may be leading the short‑term rally.
#Write2Earn #Binance
$SPCXB +2.18% | $GAL +1.48% | $DODO +1.27%
#SPCXB nudged up to $135.03, gaining +2.18% on $15.7 M of volume.
#GAL rose to $2.54, up +1.48% with $1.3 M traded.
#DODO inched higher to $0.0222, climbing +1.27% on $1.9 M of volume.
📈 The trio’s modest lifts are backed by solid flow, but the spread in volume suggests SPCXB may be leading the short‑term rally.
#Write2Earn #Binance
#SPCXB nudged up to $135.03, gaining +2.18% on $15.7 M of volume.
#GAL rose to $2.54, up +1.48% with $1.3 M traded.
#DODO inched higher to $0.0222, climbing +1.27% on $1.9 M of volume.
📈 The trio’s modest lifts are backed by solid flow, but the spread in volume suggests SPCXB may be leading the short‑term rally.
#Write2Earn #Binance
11
Log in to explore more content
Join global crypto users on Binance Square
⚡️ Get latest and useful information about crypto.
💬 Trusted by the world’s largest crypto exchange.
👍 Discover real insights from verified creators.
Email / Phone number
Trending Topics
1
#NvidiaInvestigatesAfterHuang’sAffairApology
123,577 views
1,311 Discussing
2
#BitcoinFiveWeeklyLosses
151,206 views
1,780 Discussing
3
#AIChipSlumpNasdaq
78,285 views
1,111 Discussing
4
#CPITestsDecemberRateOutlook
578,260 views
2,554 Discussing
5
#AnthropicRejectsIPODelayValuationinQuestion
16,409 views
290 Discussing
6
#CryptoLiquidationsReach$1.16BIn24Hours
2,349 views
26 Discussing
7
#BrentCrudeDrops3.8%To$94.56
2,450 views
16 Discussing
8
#EUInstitutionsInviteIndustryToSetTokenizedSecuritiesStandards
912 views
8 Discussing
9
#ChinaCACListsFiveIssuesAffectingBlockchainFilings
6,016 views
101 Discussing
10
#UKBanksCanNowApplyToConductCryptoAssetBusiness
4,322 views
70 Discussing