
#pltr
pltr
88,372 views
1,066 Discussing
Hot
Latest

·
--
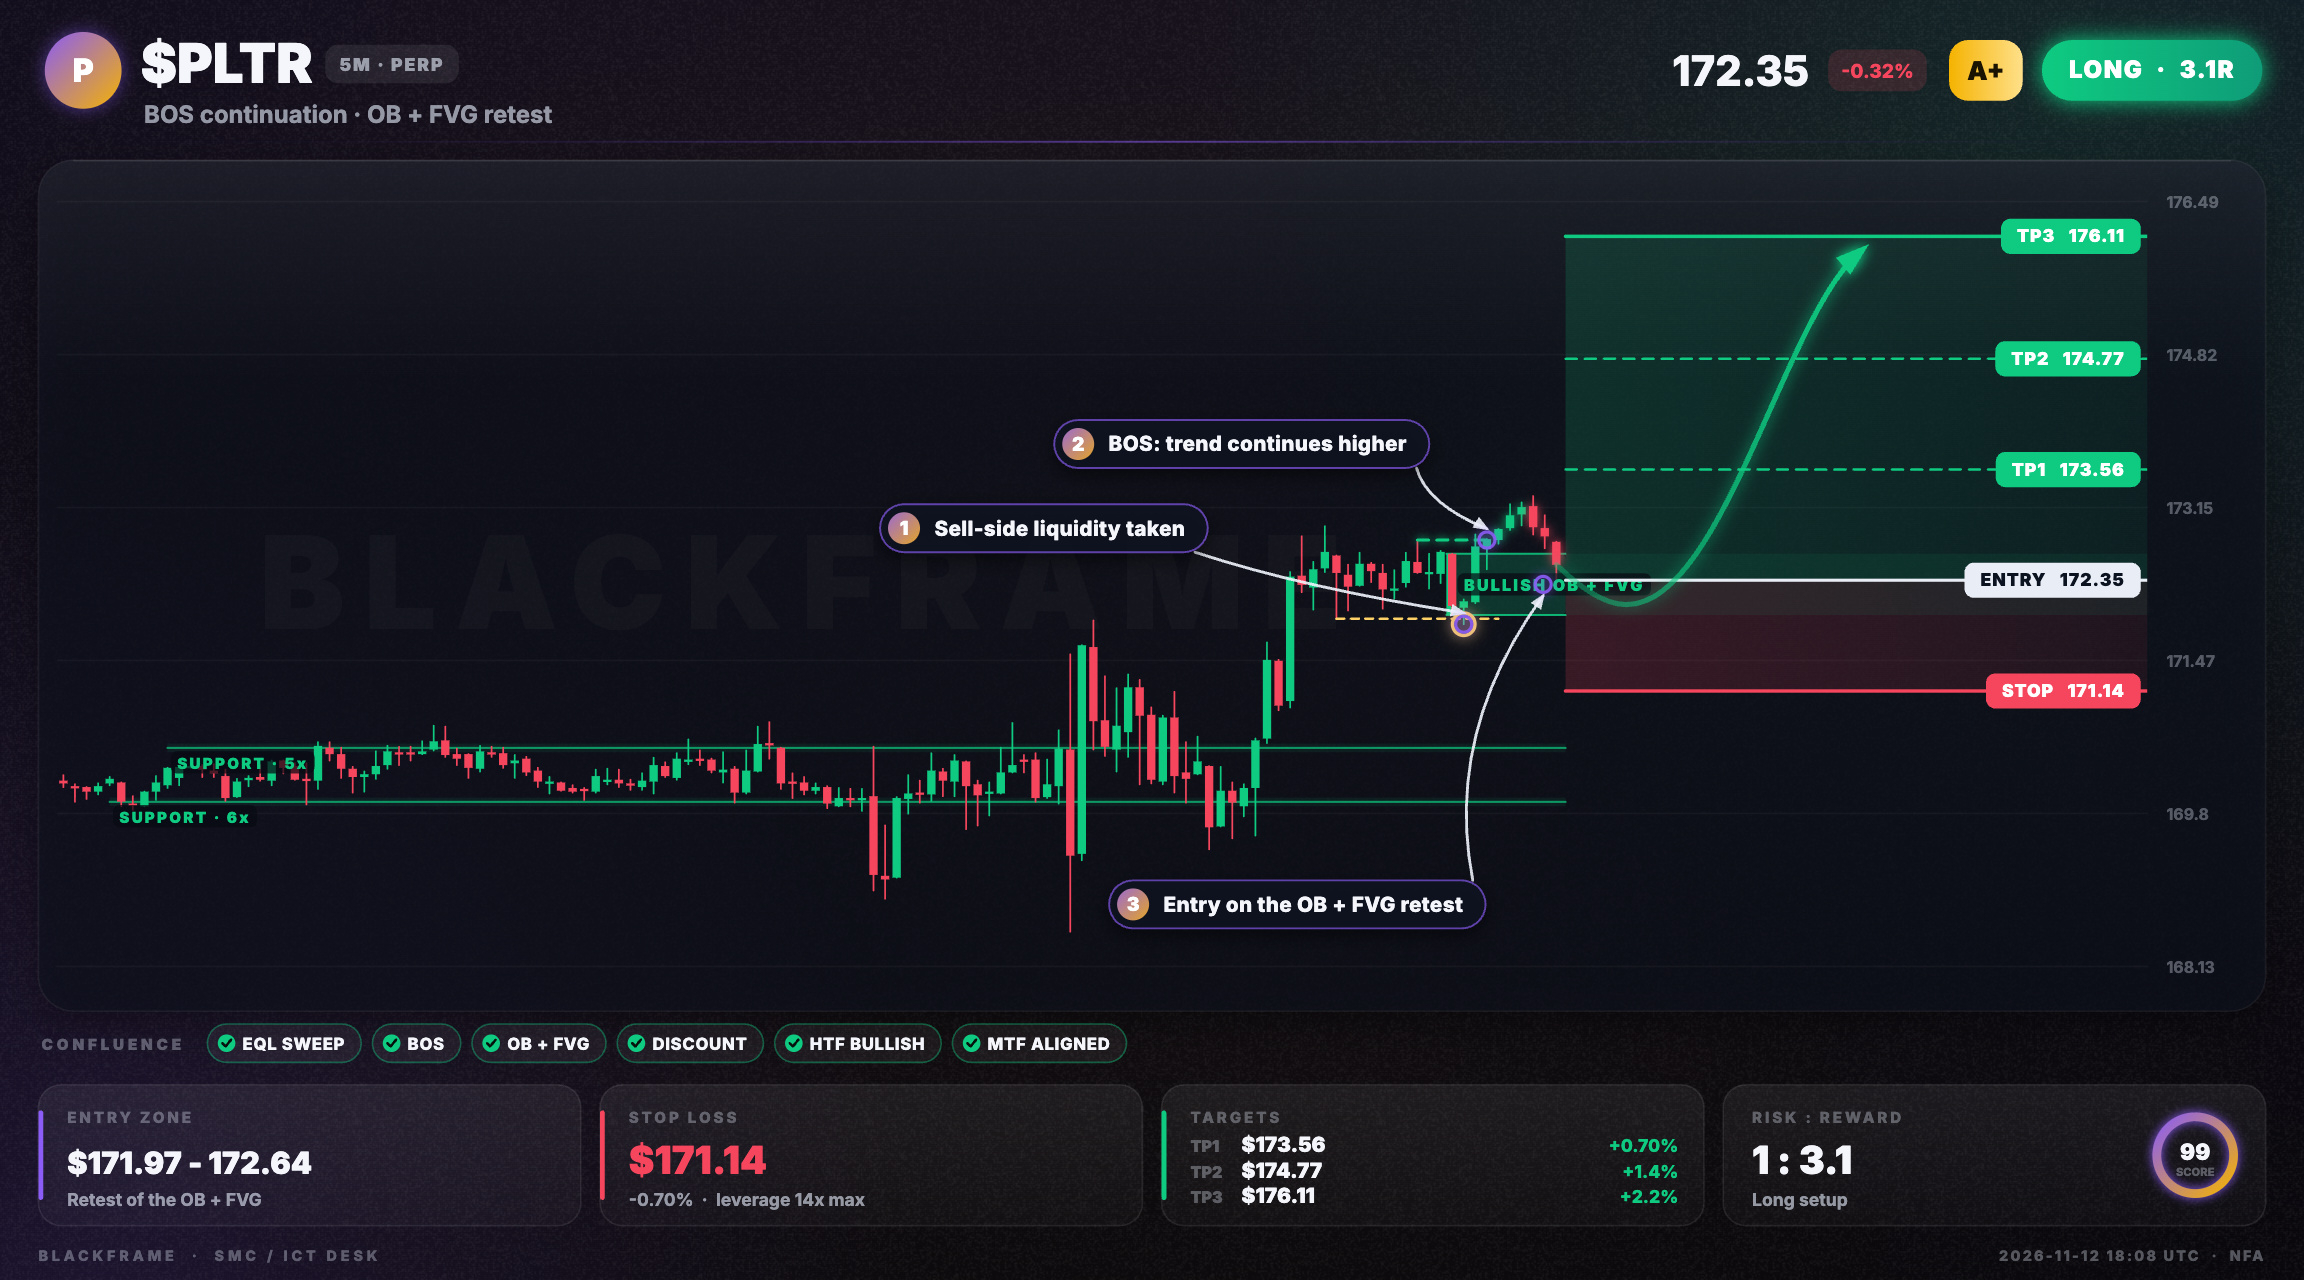
🌟 $PLTR finds bullish order block surge
LONG · 5M
Entry: $172.35 - $172.64
TP1: $173.56
TP2: $174.77
TP3: $176.11
SL: $171.14
Equal lows swept, BOS on 5M confirms uptrend. OB+FVG stacked at $171.97-172.64 offers discount entry at $172.35. Target buy-side liquidity at $176.11; stop at $171.14.
#PLTR #SmartMoney · NFA
🌟 $PLTR finds bullish order block surge
LONG · 5M
Entry: $172.35 - $172.64
TP1: $173.56
TP2: $174.77
TP3: $176.11
SL: $171.14
Equal lows swept, BOS on 5M confirms uptrend. OB+FVG stacked at $171.97-172.64 offers discount entry at $172.35. Target buy-side liquidity at $176.11; stop at $171.14.
#PLTR #SmartMoney · NFA
LONG · 5M
Entry: $172.35 - $172.64
TP1: $173.56
TP2: $174.77
TP3: $176.11
SL: $171.14
Equal lows swept, BOS on 5M confirms uptrend. OB+FVG stacked at $171.97-172.64 offers discount entry at $172.35. Target buy-side liquidity at $176.11; stop at $171.14.
#PLTR #SmartMoney · NFA
21
·
--
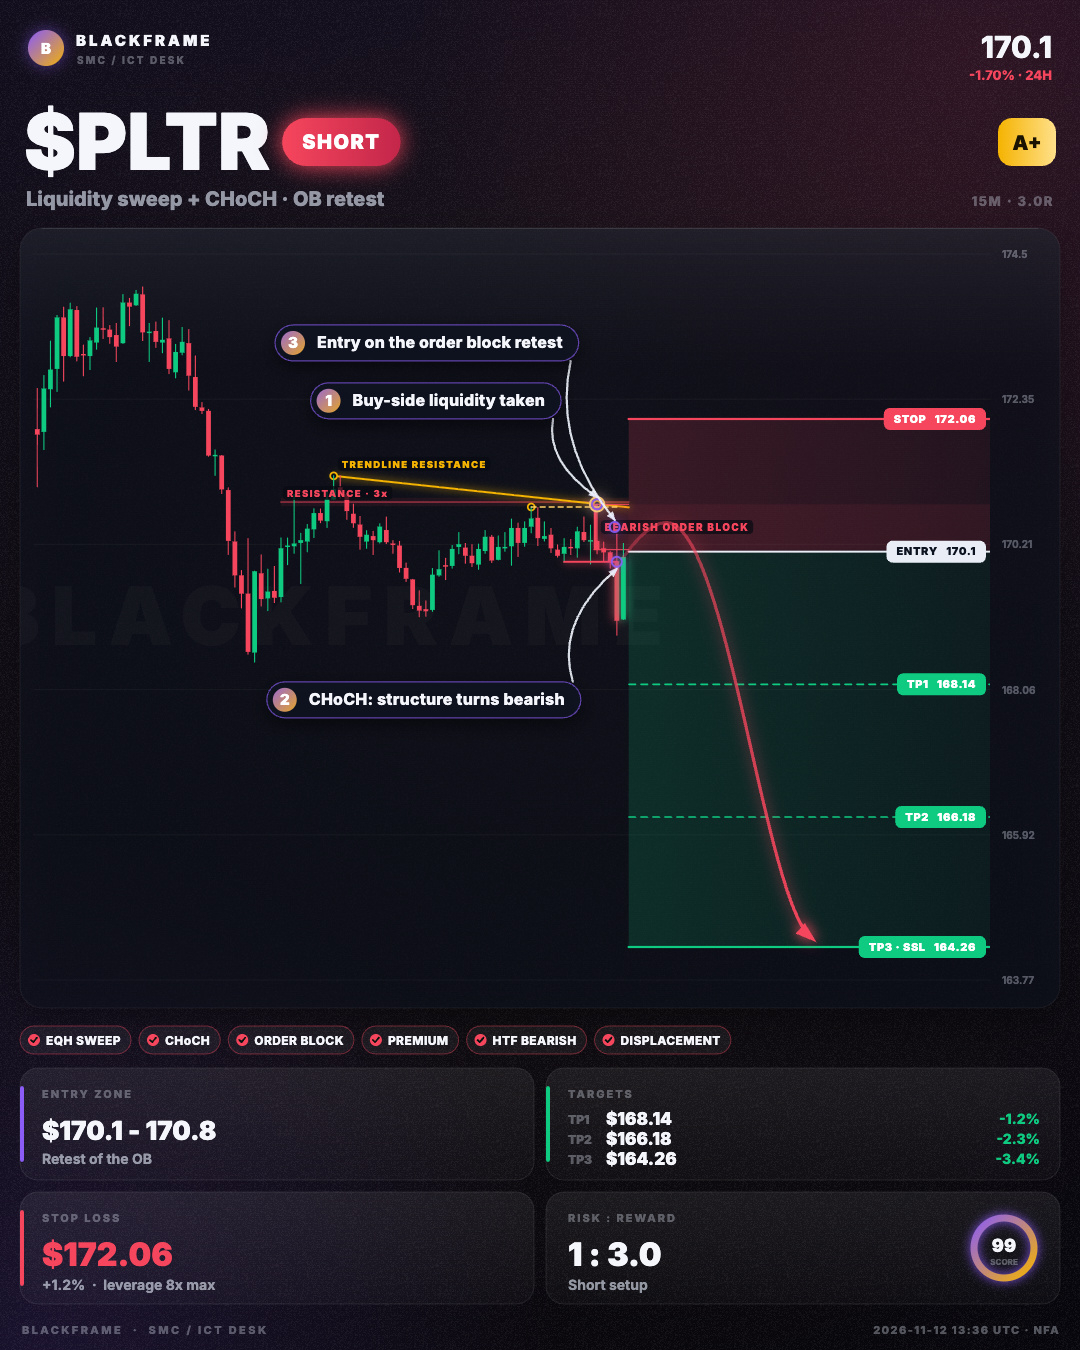
🚨 $PLTR breaks below recent swing, liquidity swept
SHORT · 15M
Entry: $170.1 - $170.13
TP1: $168.14
TP2: $166.18
TP3: $164.26
SL: $172.06
Sell‑side order block on 15M retested, CHoCH confirmed. Entry at $170.1 with stop at $172.06. Target at $164.26 where sell‑side liquidity sits. Invalid if price reclaims premium.
#PLTR #PriceAction · NFA
🚨 $PLTR breaks below recent swing, liquidity swept
SHORT · 15M
Entry: $170.1 - $170.13
TP1: $168.14
TP2: $166.18
TP3: $164.26
SL: $172.06
Sell‑side order block on 15M retested, CHoCH confirmed. Entry at $170.1 with stop at $172.06. Target at $164.26 where sell‑side liquidity sits. Invalid if price reclaims premium.
#PLTR #PriceAction · NFA
SHORT · 15M
Entry: $170.1 - $170.13
TP1: $168.14
TP2: $166.18
TP3: $164.26
SL: $172.06
Sell‑side order block on 15M retested, CHoCH confirmed. Entry at $170.1 with stop at $172.06. Target at $164.26 where sell‑side liquidity sits. Invalid if price reclaims premium.
#PLTR #PriceAction · NFA
24

·
--
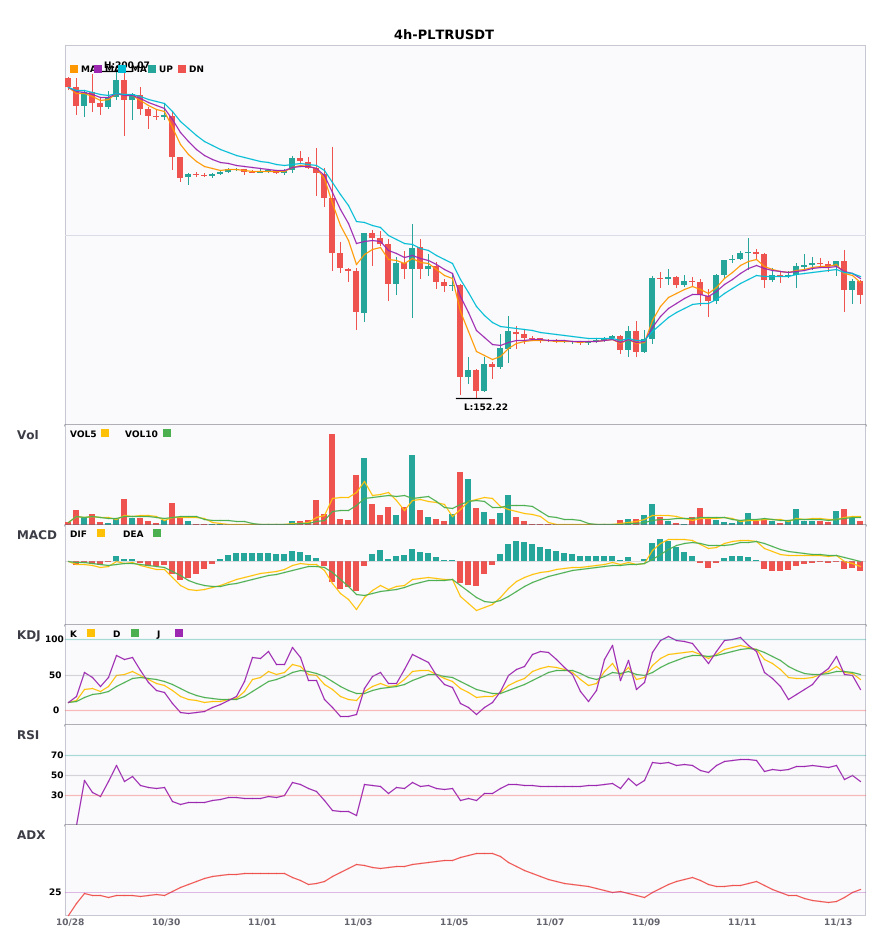
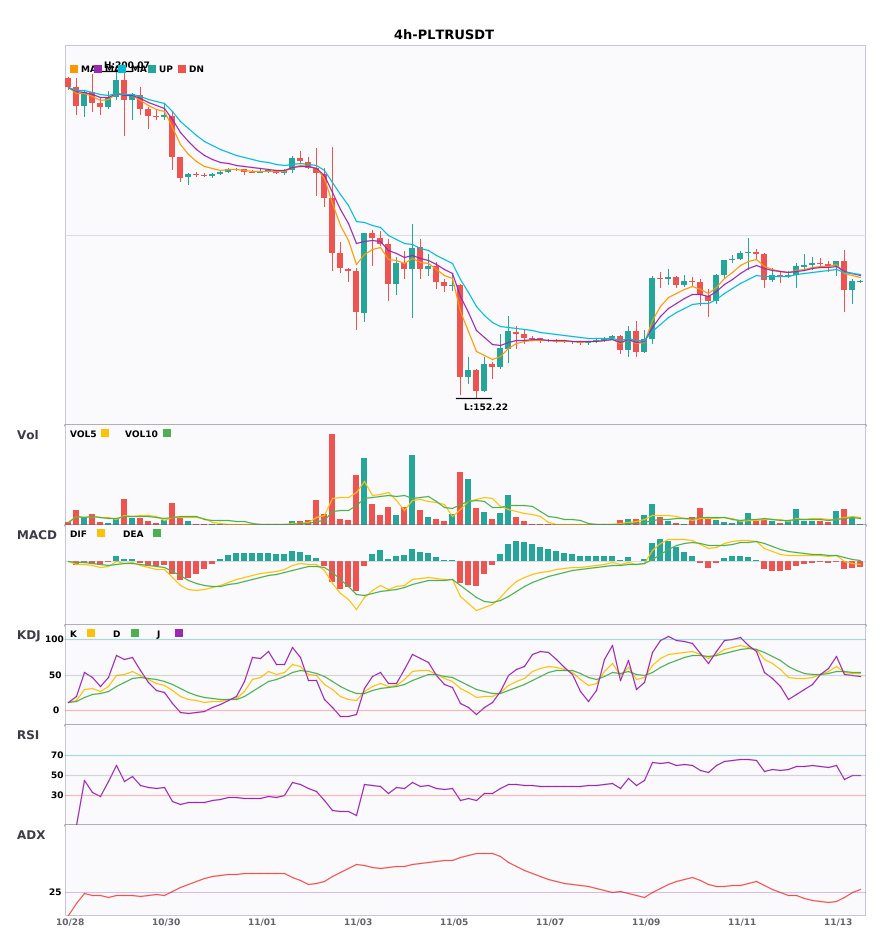
$PLTR 4-hour and daily charts are bearish; multiple timeframes align, favoring a trend-following short 🔥
════════════════════
🟢 $PLTR 4-hour bearish signal
⚠️ Technical analysis: Multiple timeframes align for a short: the 4-hour entry signal is confirmed by the daily bearish trend. The MACD green bars continue, moving averages are bearishly aligned and diverging downward, and trading volume has increased 2.3 times. Short with the trend.
════════════════════
🔔 Follow to get first-hand updates on market movements 🔔
#多周期共振 #PLTR
📌 When trading, check whether the candlestick pattern is consistent
$PLTR 4-hour and daily charts are bearish; multiple timeframes align, favoring a trend-following short 🔥
════════════════════
🟢 $PLTR 4-hour bearish signal
⚠️ Technical analysis: Multiple timeframes align for a short: the 4-hour entry signal is confirmed by the daily bearish trend. The MACD green bars continue, moving averages are bearishly aligned and diverging downward, and trading volume has increased 2.3 times. Short with the trend.
════════════════════
🔔 Follow to get first-hand updates on market movements 🔔
#多周期共振 #PLTR
📌 When trading, check whether the candlestick pattern is consistent
════════════════════
🟢 $PLTR 4-hour bearish signal
⚠️ Technical analysis: Multiple timeframes align for a short: the 4-hour entry signal is confirmed by the daily bearish trend. The MACD green bars continue, moving averages are bearishly aligned and diverging downward, and trading volume has increased 2.3 times. Short with the trend.
════════════════════
🔔 Follow to get first-hand updates on market movements 🔔
#多周期共振 #PLTR
📌 When trading, check whether the candlestick pattern is consistent

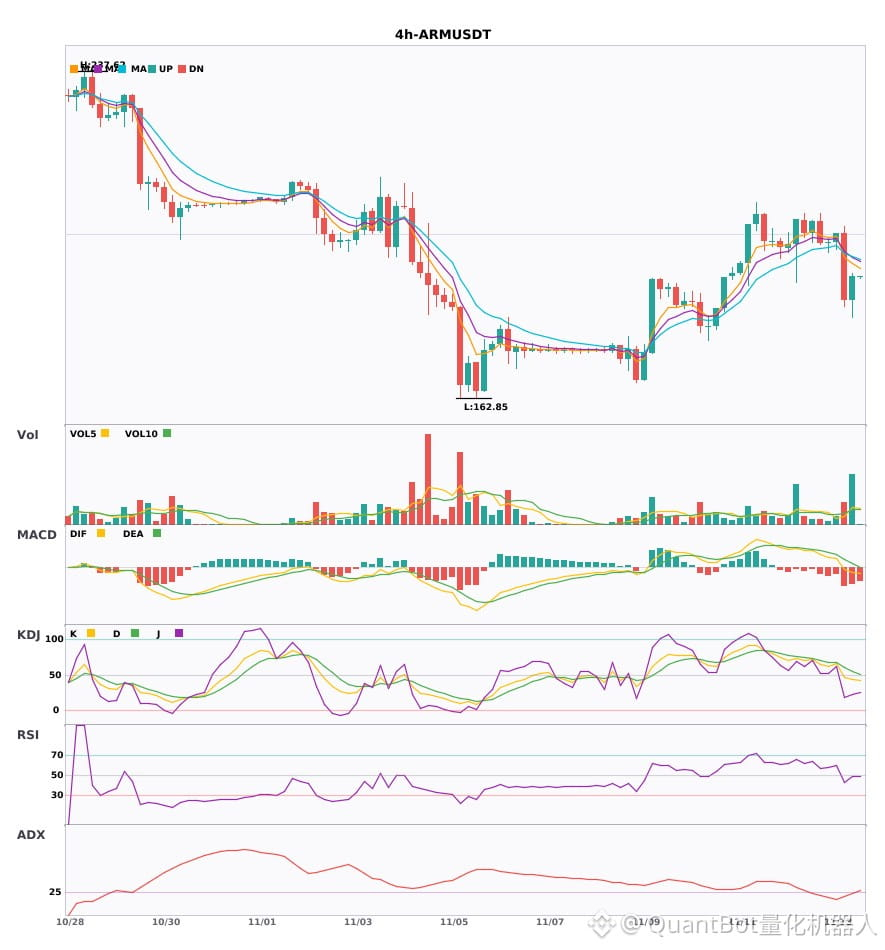
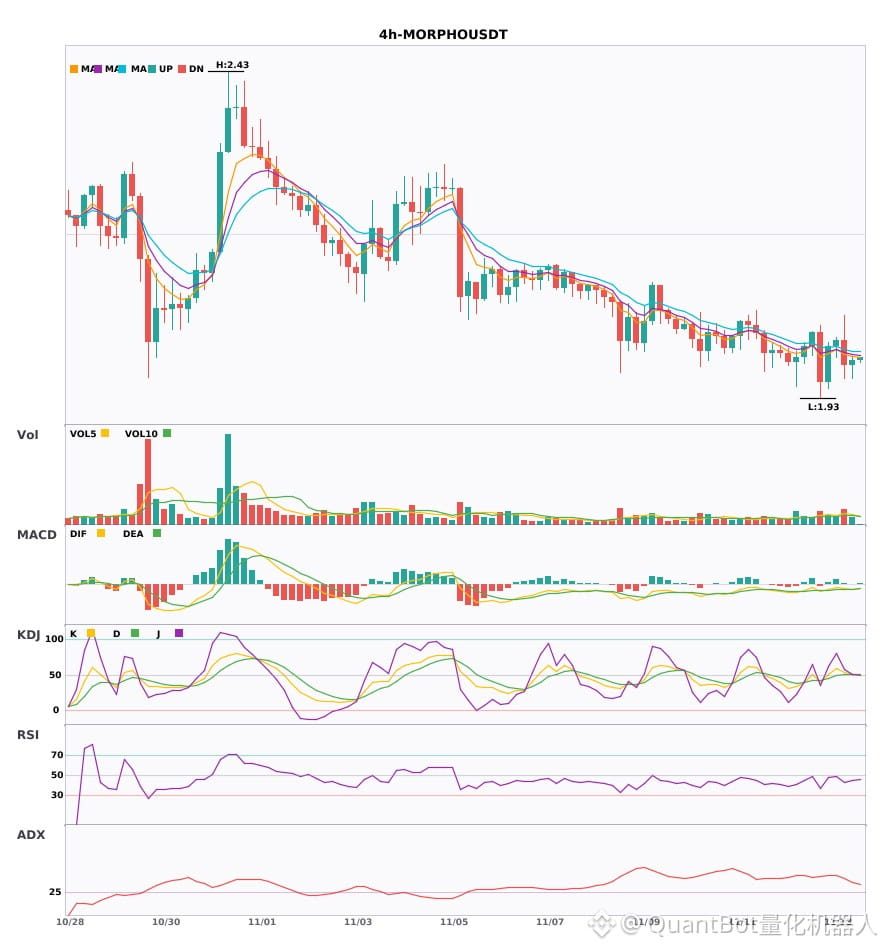
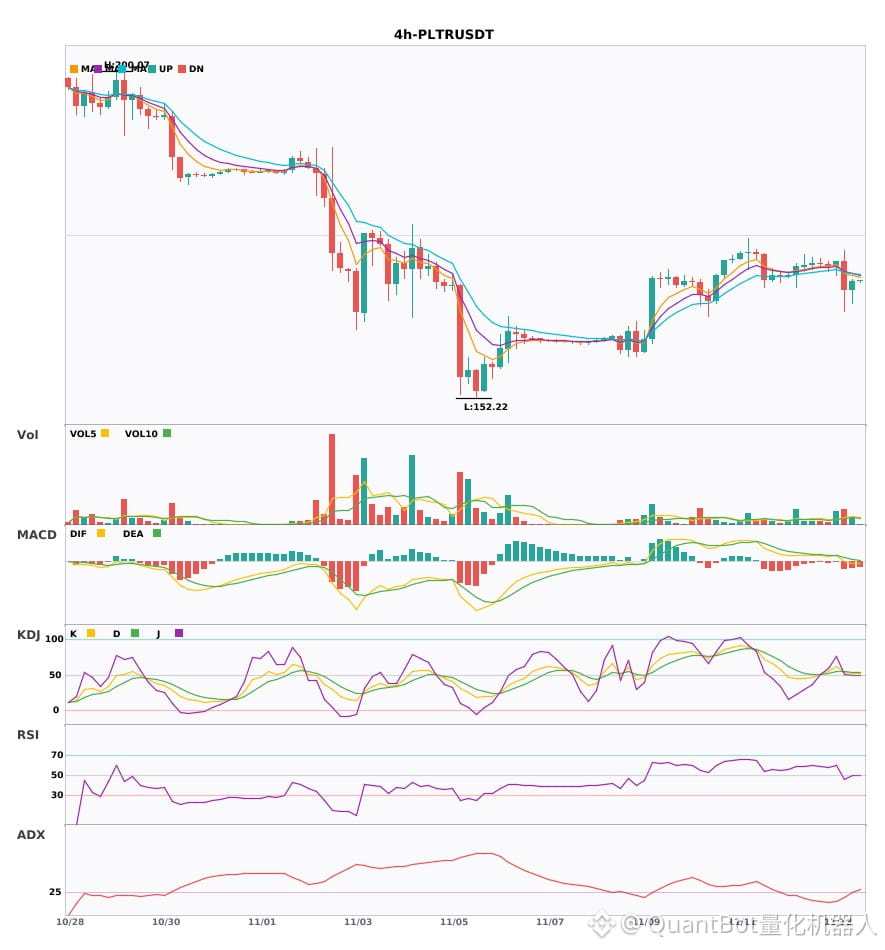
$ARM/$MORPHO/$PLTR 4-hour timeframe bearish confluence signal
📉 $ARM | 4-hour bearish signal
━━━━━━━━━━━━━━━━━━
Technical analysis: ADX(26) indicates a trend is developing, with conditions suitable for participation|MACD is bearish, with the trend under pressure and momentum weakening|EMA5/8/13 are bearishly aligned|Trading volume increased significantly by 3.2x
Price change: 2.9000%
📉 $MORPHO | 4-hour bearish signal
━━━━━━━━━━━━━━━━━━
Technical analysis: ADX(34) indicates a clear trend. The MACD bearish cross below zero confirms strengthening bearish momentum. EMA5\u0026lt;EMA8\u0026lt;EMA13 are bearishly aligned. The KDJ bearish cross (K:50.6,D:50.7) supports a short-term bearish outlook, and trading volume increased by 1.6x.
Price change: 0.3800%
📉 $PLTR | 4-hour bearish signal
━━━━━━━━━━━━━━━━━━
Technical analysis: ADX(28) confirms the trend; conditions are suitable for participation | MACD is bearish, with momentum declining | EMA5\u0026lt;8\u0026lt;13 are bearishly aligned | KDJ favors the bulls (K52.2 D53.8) | Trading volume increased by 2.3x
Price change: 0.8200%
━━━━━━━━━━━━━━━━━━
#技术分析 #ARM #MORPHO #PLTR
📌 The above content is for reference only and does not constitute investment advice
$ARM /$MORPHO /$PLTR 4-hour timeframe bearish confluence signal
📉 $ARM | 4-hour bearish signal
━━━━━━━━━━━━━━━━━━
Technical analysis: ADX(26) indicates a trend is developing, with conditions suitable for participation|MACD is bearish, with the trend under pressure and momentum weakening|EMA5/8/13 are bearishly aligned|Trading volume increased significantly by 3.2x
Price change: 2.9000%
📉 $MORPHO | 4-hour bearish signal
━━━━━━━━━━━━━━━━━━
Technical analysis: ADX(34) indicates a clear trend. The MACD bearish cross below zero confirms strengthening bearish momentum. EMA5\u0026lt;EMA8\u0026lt;EMA13 are bearishly aligned. The KDJ bearish cross (K:50.6,D:50.7) supports a short-term bearish outlook, and trading volume increased by 1.6x.
Price change: 0.3800%
📉 $PLTR | 4-hour bearish signal
━━━━━━━━━━━━━━━━━━
Technical analysis: ADX(28) confirms the trend; conditions are suitable for participation | MACD is bearish, with momentum declining | EMA5\u0026lt;8\u0026lt;13 are bearishly aligned | KDJ favors the bulls (K52.2 D53.8) | Trading volume increased by 2.3x
Price change: 0.8200%
━━━━━━━━━━━━━━━━━━
#技术分析 #ARM #MORPHO #PLTR
📌 The above content is for reference only and does not constitute investment advice
📉 $ARM | 4-hour bearish signal
━━━━━━━━━━━━━━━━━━
Technical analysis: ADX(26) indicates a trend is developing, with conditions suitable for participation|MACD is bearish, with the trend under pressure and momentum weakening|EMA5/8/13 are bearishly aligned|Trading volume increased significantly by 3.2x
Price change: 2.9000%
📉 $MORPHO | 4-hour bearish signal
━━━━━━━━━━━━━━━━━━
Technical analysis: ADX(34) indicates a clear trend. The MACD bearish cross below zero confirms strengthening bearish momentum. EMA5\u0026lt;EMA8\u0026lt;EMA13 are bearishly aligned. The KDJ bearish cross (K:50.6,D:50.7) supports a short-term bearish outlook, and trading volume increased by 1.6x.
Price change: 0.3800%
📉 $PLTR | 4-hour bearish signal
━━━━━━━━━━━━━━━━━━
Technical analysis: ADX(28) confirms the trend; conditions are suitable for participation | MACD is bearish, with momentum declining | EMA5\u0026lt;8\u0026lt;13 are bearishly aligned | KDJ favors the bulls (K52.2 D53.8) | Trading volume increased by 2.3x
Price change: 0.8200%
━━━━━━━━━━━━━━━━━━
#技术分析 #ARM #MORPHO #PLTR
📌 The above content is for reference only and does not constitute investment advice

·
--
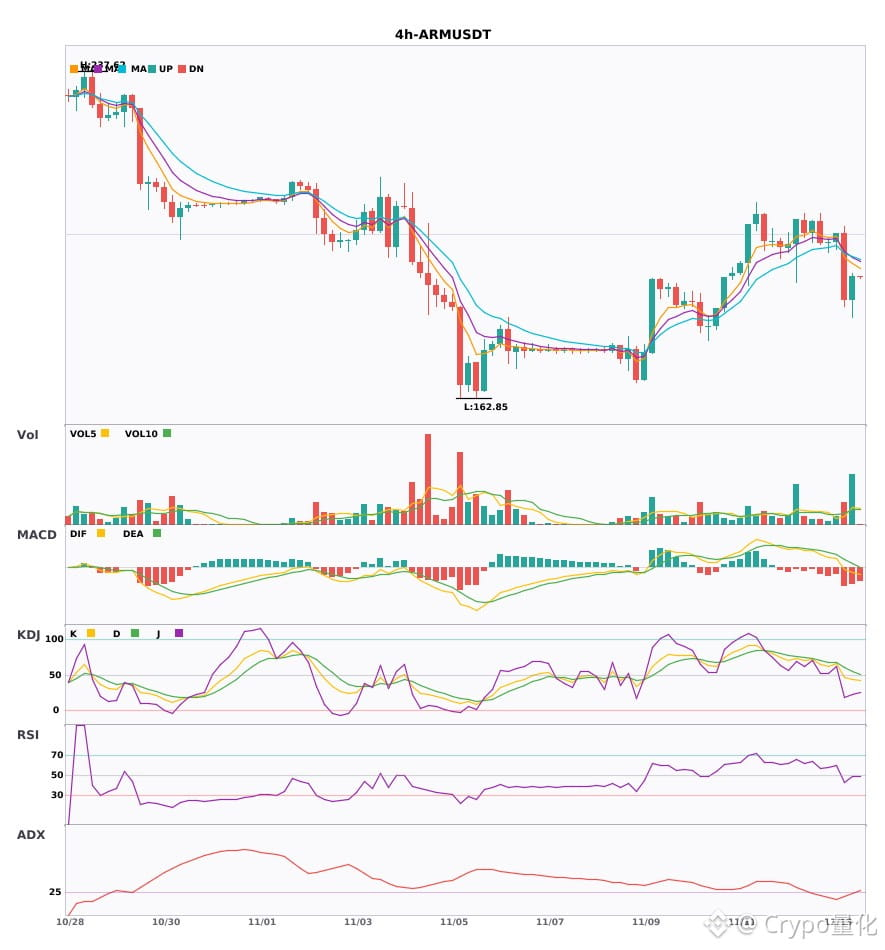
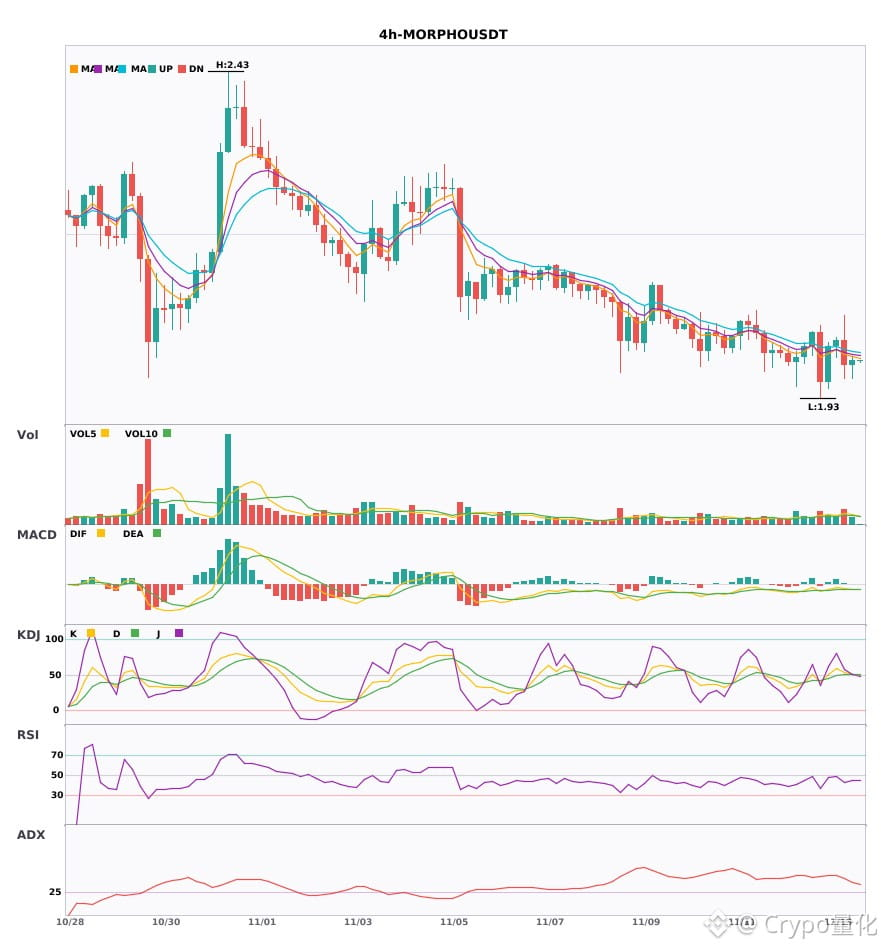
$ARM $MORPHO $PLTR 4 hours weakening; likely to fall in the short term 🔥
════════════════════
🟢 $ARM 4 hours bearish signal
⚠️ Technicals: ADX trend emerging, potential entry | MACD bearish, red bars shrinking and momentum weakening | moving averages in bearish alignment, trending down | volume surged 3.2x
════════════════════
🟢 $MORPHO 4 hours bearish signal
⚠️ Technicals: ADX is at 34, so the trend is quite clear. MACD has formed a death cross below zero with rising volume; bearish momentum is accelerating. Moving averages have just formed a bearish alignment and are trending down. KDJ has formed a death cross but is not yet oversold, suggesting a short-term bearish outlook; volume is also up 1.6x.
════════════════════
🟢 $PLTR 4 hours bearish signal
⚠️ Technicals: ADX trend just starting, potential entry; MACD green bars are shrinking, so bearish momentum is weakening. Moving averages are in bearish alignment, but KDJ's K line has crossed above D and is not overbought, indicating relative strength. Volume is up more than 2x.
════════════════════
🔔 Follow for first-hand market updates 🔔
#技术分析 #ARM #MORPHO #PLTR
📌 When trading, pay attention to whether the candlestick pattern confirms the signal
$ARM $MORPHO $PLTR 4 hours weakening; likely to fall in the short term 🔥
════════════════════
🟢 $ARM 4 hours bearish signal
⚠️ Technicals: ADX trend emerging, potential entry | MACD bearish, red bars shrinking and momentum weakening | moving averages in bearish alignment, trending down | volume surged 3.2x
════════════════════
🟢 $MORPHO 4 hours bearish signal
⚠️ Technicals: ADX is at 34, so the trend is quite clear. MACD has formed a death cross below zero with rising volume; bearish momentum is accelerating. Moving averages have just formed a bearish alignment and are trending down. KDJ has formed a death cross but is not yet oversold, suggesting a short-term bearish outlook; volume is also up 1.6x.
════════════════════
🟢 $PLTR 4 hours bearish signal
⚠️ Technicals: ADX trend just starting, potential entry; MACD green bars are shrinking, so bearish momentum is weakening. Moving averages are in bearish alignment, but KDJ's K line has crossed above D and is not overbought, indicating relative strength. Volume is up more than 2x.
════════════════════
🔔 Follow for first-hand market updates 🔔
#技术分析 #ARM #MORPHO #PLTR
📌 When trading, pay attention to whether the candlestick pattern confirms the signal
════════════════════
🟢 $ARM 4 hours bearish signal
⚠️ Technicals: ADX trend emerging, potential entry | MACD bearish, red bars shrinking and momentum weakening | moving averages in bearish alignment, trending down | volume surged 3.2x
════════════════════
🟢 $MORPHO 4 hours bearish signal
⚠️ Technicals: ADX is at 34, so the trend is quite clear. MACD has formed a death cross below zero with rising volume; bearish momentum is accelerating. Moving averages have just formed a bearish alignment and are trending down. KDJ has formed a death cross but is not yet oversold, suggesting a short-term bearish outlook; volume is also up 1.6x.
════════════════════
🟢 $PLTR 4 hours bearish signal
⚠️ Technicals: ADX trend just starting, potential entry; MACD green bars are shrinking, so bearish momentum is weakening. Moving averages are in bearish alignment, but KDJ's K line has crossed above D and is not overbought, indicating relative strength. Volume is up more than 2x.
════════════════════
🔔 Follow for first-hand market updates 🔔
#技术分析 #ARM #MORPHO #PLTR
📌 When trading, pay attention to whether the candlestick pattern confirms the signal
4
·
--
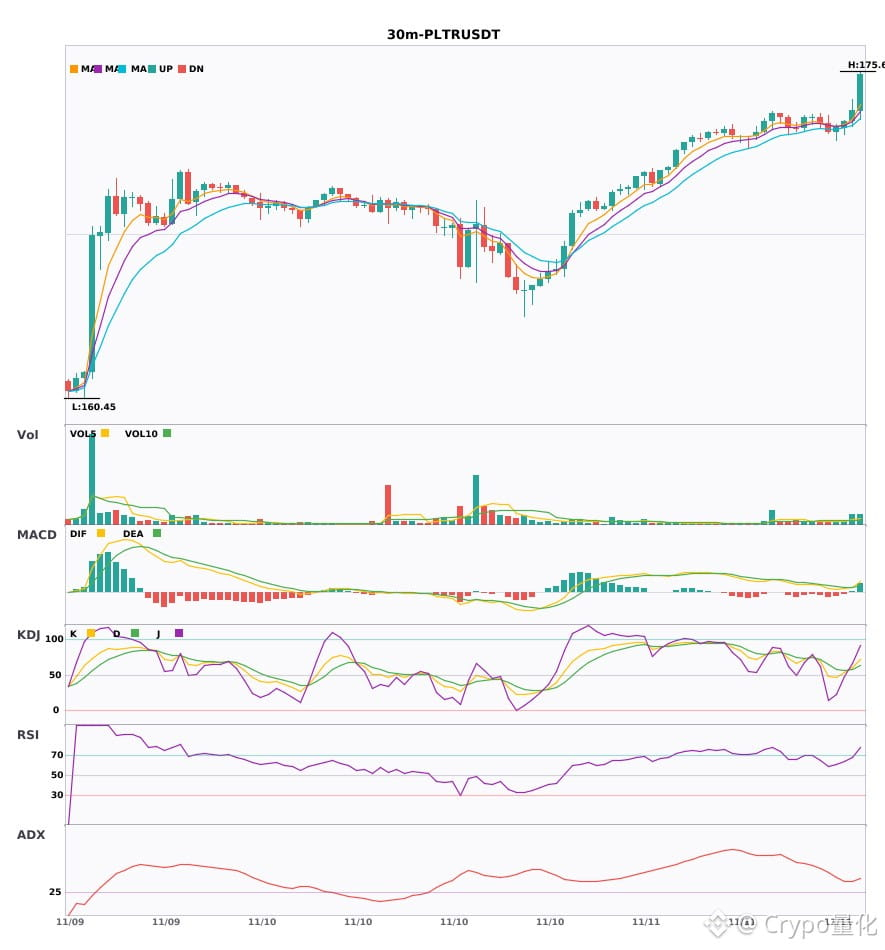
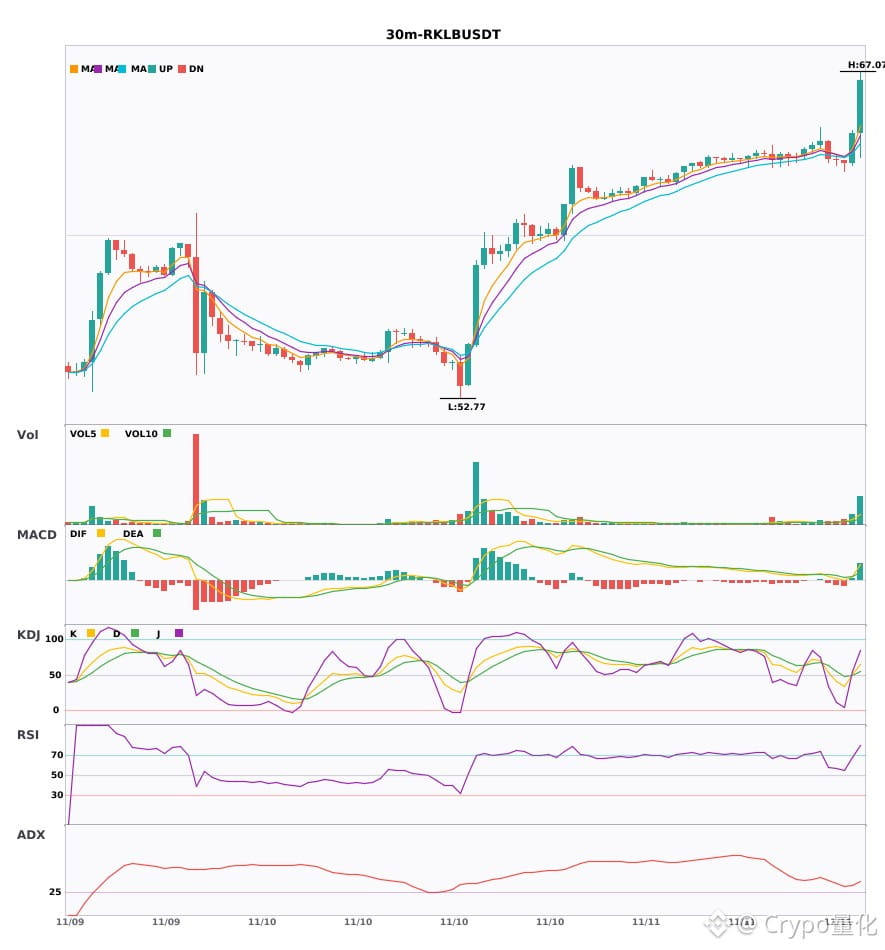
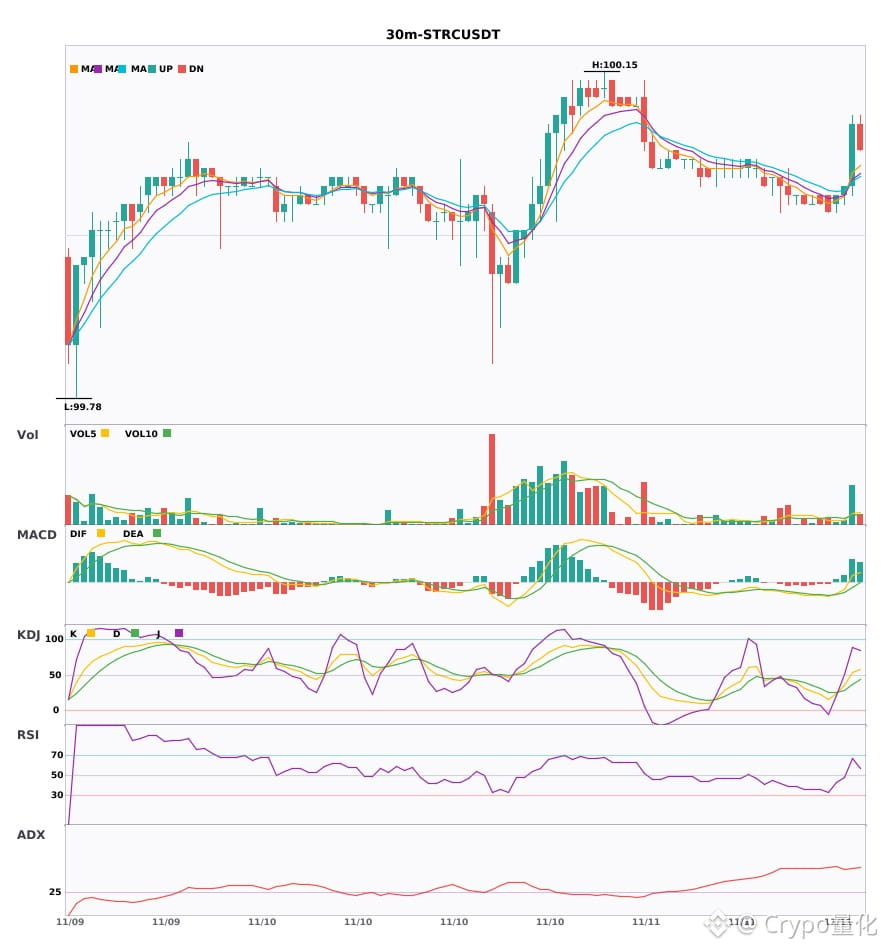
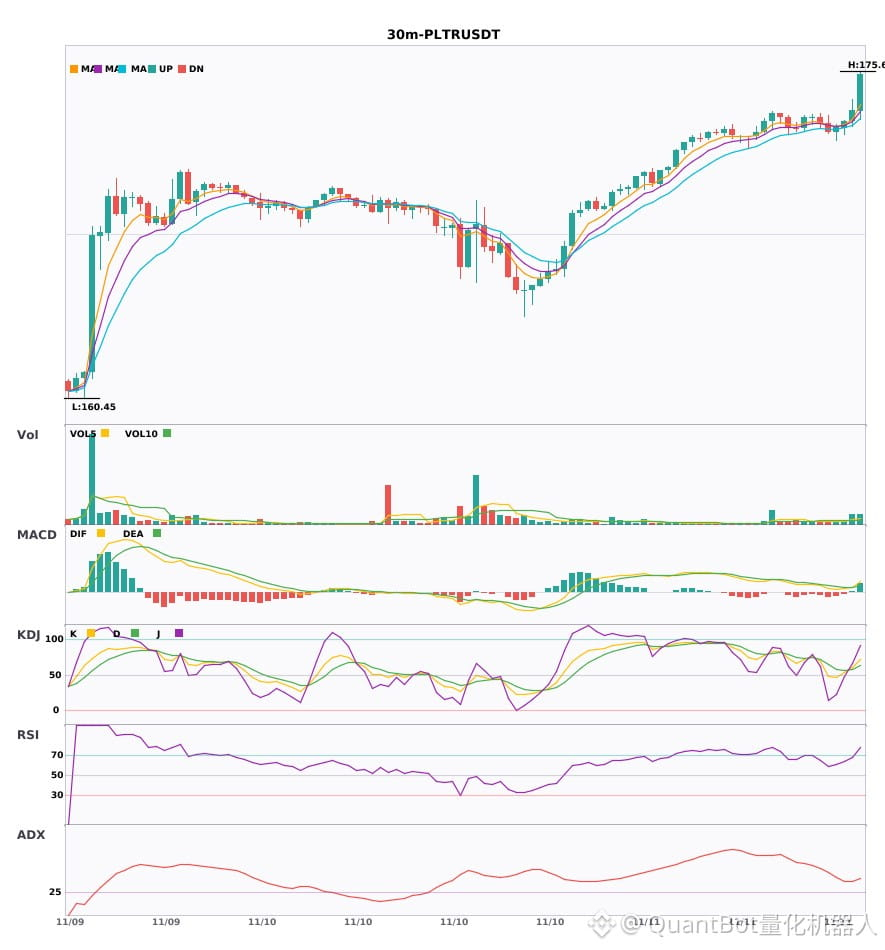
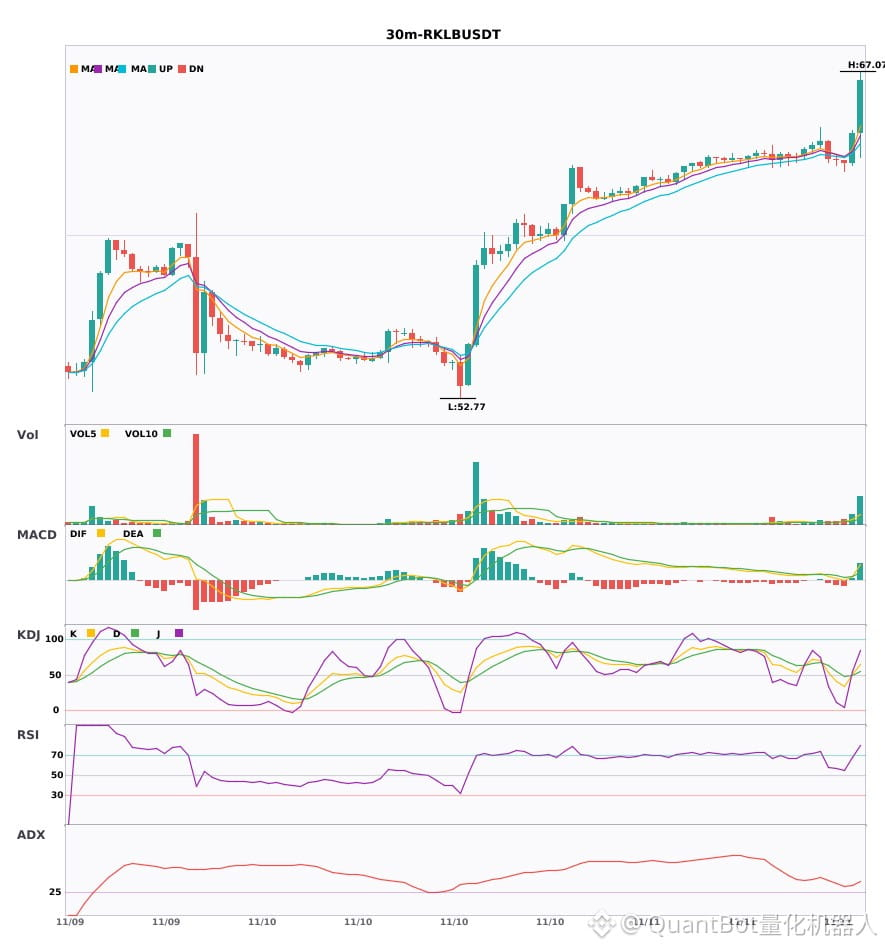
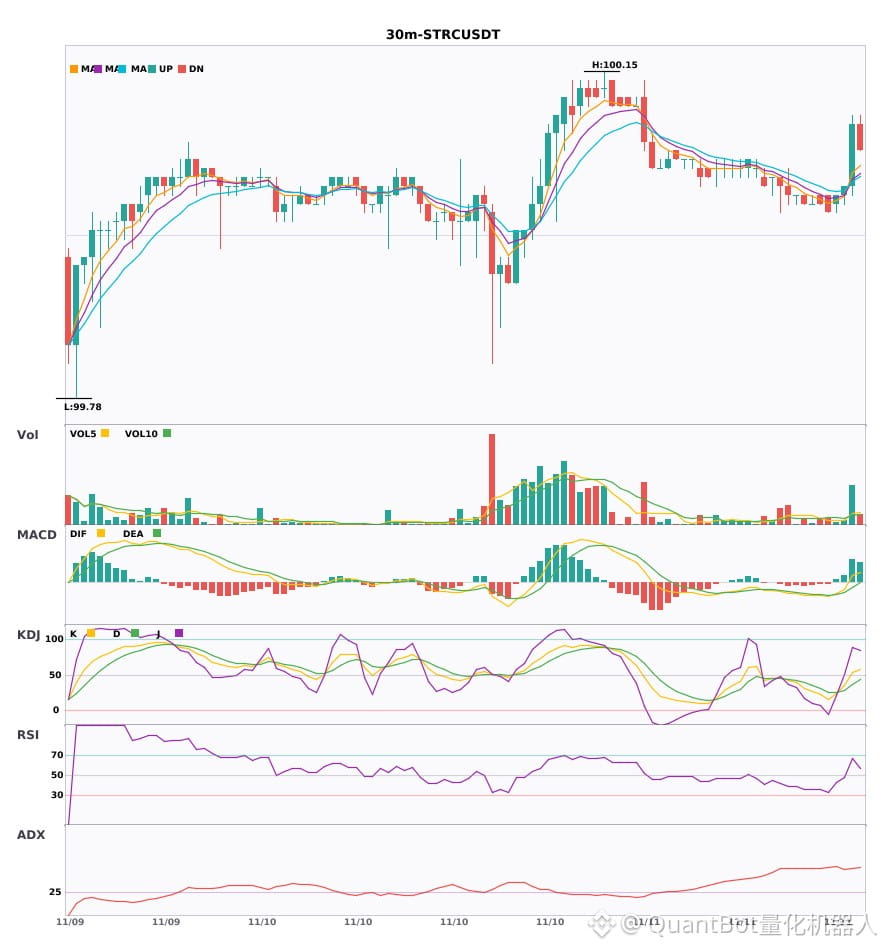
Three bullish signals on the 30-minute timeframe appeared simultaneously: $PLTR / $RKLB / $STRC🔥
════════════════════
🔴 $PLTR 30-minute bullish signal
⚠️Technical analysis: ADX(35): clear trending market | MACD golden cross above zero, bullish momentum emerging | EMA5 > EMA8 > EMA13, bullish alignment | KDJ golden cross, bullish in the short term (K: 60.7, D: 58.1) | Volume increase (2.4x)
════════════════════
🔴 $RKLB 30-minute bullish signal
⚠️Technical analysis: ADX(29): trend is forming; opportunity to participate | MACD golden cross above zero, bullish momentum emerging | EMA5 crossed above EMA8, short-term outlook turns bullish | KDJ golden cross, bullish in the short term (K: 51.1, D: 49.2) | Volume surge (2.8x)
════════════════════
🔴 $STRC 30-minute bullish signal
⚠️Technical analysis: ADX(54): very strong trend (watch out for an overheated pullback) | MACD DIF crossed above the zero line, trend turns bullish | EMA5 crossed above EMA8, short-term outlook turns bullish | Volume surge (3.8x)
════════════════════
🔔 Follow us for first-hand market updates 🔔
#技术分析 #PLTR #RKLB #STRC
📌 When trading, pay attention to whether the candlestick patterns confirm the signal
Three bullish signals on the 30-minute timeframe appeared simultaneously: $PLTR / $RKLB / $STRC 🔥
════════════════════
🔴 $PLTR 30-minute bullish signal
⚠️Technical analysis: ADX(35): clear trending market | MACD golden cross above zero, bullish momentum emerging | EMA5 > EMA8 > EMA13, bullish alignment | KDJ golden cross, bullish in the short term (K: 60.7, D: 58.1) | Volume increase (2.4x)
════════════════════
🔴 $RKLB 30-minute bullish signal
⚠️Technical analysis: ADX(29): trend is forming; opportunity to participate | MACD golden cross above zero, bullish momentum emerging | EMA5 crossed above EMA8, short-term outlook turns bullish | KDJ golden cross, bullish in the short term (K: 51.1, D: 49.2) | Volume surge (2.8x)
════════════════════
🔴 $STRC 30-minute bullish signal
⚠️Technical analysis: ADX(54): very strong trend (watch out for an overheated pullback) | MACD DIF crossed above the zero line, trend turns bullish | EMA5 crossed above EMA8, short-term outlook turns bullish | Volume surge (3.8x)
════════════════════
🔔 Follow us for first-hand market updates 🔔
#技术分析 #PLTR #RKLB #STRC
📌 When trading, pay attention to whether the candlestick patterns confirm the signal
════════════════════
🔴 $PLTR 30-minute bullish signal
⚠️Technical analysis: ADX(35): clear trending market | MACD golden cross above zero, bullish momentum emerging | EMA5 > EMA8 > EMA13, bullish alignment | KDJ golden cross, bullish in the short term (K: 60.7, D: 58.1) | Volume increase (2.4x)
════════════════════
🔴 $RKLB 30-minute bullish signal
⚠️Technical analysis: ADX(29): trend is forming; opportunity to participate | MACD golden cross above zero, bullish momentum emerging | EMA5 crossed above EMA8, short-term outlook turns bullish | KDJ golden cross, bullish in the short term (K: 51.1, D: 49.2) | Volume surge (2.8x)
════════════════════
🔴 $STRC 30-minute bullish signal
⚠️Technical analysis: ADX(54): very strong trend (watch out for an overheated pullback) | MACD DIF crossed above the zero line, trend turns bullish | EMA5 crossed above EMA8, short-term outlook turns bullish | Volume surge (3.8x)
════════════════════
🔔 Follow us for first-hand market updates 🔔
#技术分析 #PLTR #RKLB #STRC
📌 When trading, pay attention to whether the candlestick patterns confirm the signal
3
$PLTR / $RKLB / $STRC Bullish bias on the 30-minute timeframe, with short-term confluence opportunities
📈 $PLTR | 30-minute bullish signal
━━━━━━━━━━━━━━━━━━
Technical analysis: ADX(35): clear trending market | MACD golden cross above zero, bullish momentum released | EMA5 > EMA8 > EMA13: bullish alignment | KDJ golden cross, bullish short-term outlook (K: 60.7, D: 58.1) | Volume increased (2.4x)
Price change: 0.3000%
📈 $RKLB | 30-minute bullish signal
━━━━━━━━━━━━━━━━━━
Technical analysis: ADX(29): trend forming, potential entry | MACD golden cross above zero, bullish momentum released | EMA5 crossed above EMA8, short-term outlook turns bullish | KDJ golden cross, bullish short-term outlook (K: 51.1, D: 49.2) | Volume surged (2.8x)
Price change: 2.0500%
📈 $STRC | 30-minute bullish signal
━━━━━━━━━━━━━━━━━━
Technical analysis: ADX(54): very strong trend (beware of a potential overbought pullback) | MACD DIF broke above zero, trend turns bullish | EMA5 crossed above EMA8, short-term outlook turns bullish | Volume surged (3.8x)
Price change: 0.0700%
━━━━━━━━━━━━━━━━━━
#技术分析 #PLTR #RKLB #STRC
📌 The above content is for reference only and does not constitute investment advice
$PLTR / $RKLB / $STRC Bullish bias on the 30-minute timeframe, with short-term confluence opportunities
📈 $PLTR | 30-minute bullish signal
━━━━━━━━━━━━━━━━━━
Technical analysis: ADX(35): clear trending market | MACD golden cross above zero, bullish momentum released | EMA5 > EMA8 > EMA13: bullish alignment | KDJ golden cross, bullish short-term outlook (K: 60.7, D: 58.1) | Volume increased (2.4x)
Price change: 0.3000%
📈 $RKLB | 30-minute bullish signal
━━━━━━━━━━━━━━━━━━
Technical analysis: ADX(29): trend forming, potential entry | MACD golden cross above zero, bullish momentum released | EMA5 crossed above EMA8, short-term outlook turns bullish | KDJ golden cross, bullish short-term outlook (K: 51.1, D: 49.2) | Volume surged (2.8x)
Price change: 2.0500%
📈 $STRC | 30-minute bullish signal
━━━━━━━━━━━━━━━━━━
Technical analysis: ADX(54): very strong trend (beware of a potential overbought pullback) | MACD DIF broke above zero, trend turns bullish | EMA5 crossed above EMA8, short-term outlook turns bullish | Volume surged (3.8x)
Price change: 0.0700%
━━━━━━━━━━━━━━━━━━
#技术分析 #PLTR #RKLB #STRC
📌 The above content is for reference only and does not constitute investment advice
📈 $PLTR | 30-minute bullish signal
━━━━━━━━━━━━━━━━━━
Technical analysis: ADX(35): clear trending market | MACD golden cross above zero, bullish momentum released | EMA5 > EMA8 > EMA13: bullish alignment | KDJ golden cross, bullish short-term outlook (K: 60.7, D: 58.1) | Volume increased (2.4x)
Price change: 0.3000%
📈 $RKLB | 30-minute bullish signal
━━━━━━━━━━━━━━━━━━
Technical analysis: ADX(29): trend forming, potential entry | MACD golden cross above zero, bullish momentum released | EMA5 crossed above EMA8, short-term outlook turns bullish | KDJ golden cross, bullish short-term outlook (K: 51.1, D: 49.2) | Volume surged (2.8x)
Price change: 2.0500%
📈 $STRC | 30-minute bullish signal
━━━━━━━━━━━━━━━━━━
Technical analysis: ADX(54): very strong trend (beware of a potential overbought pullback) | MACD DIF broke above zero, trend turns bullish | EMA5 crossed above EMA8, short-term outlook turns bullish | Volume surged (3.8x)
Price change: 0.0700%
━━━━━━━━━━━━━━━━━━
#技术分析 #PLTR #RKLB #STRC
📌 The above content is for reference only and does not constitute investment advice
6
·
--
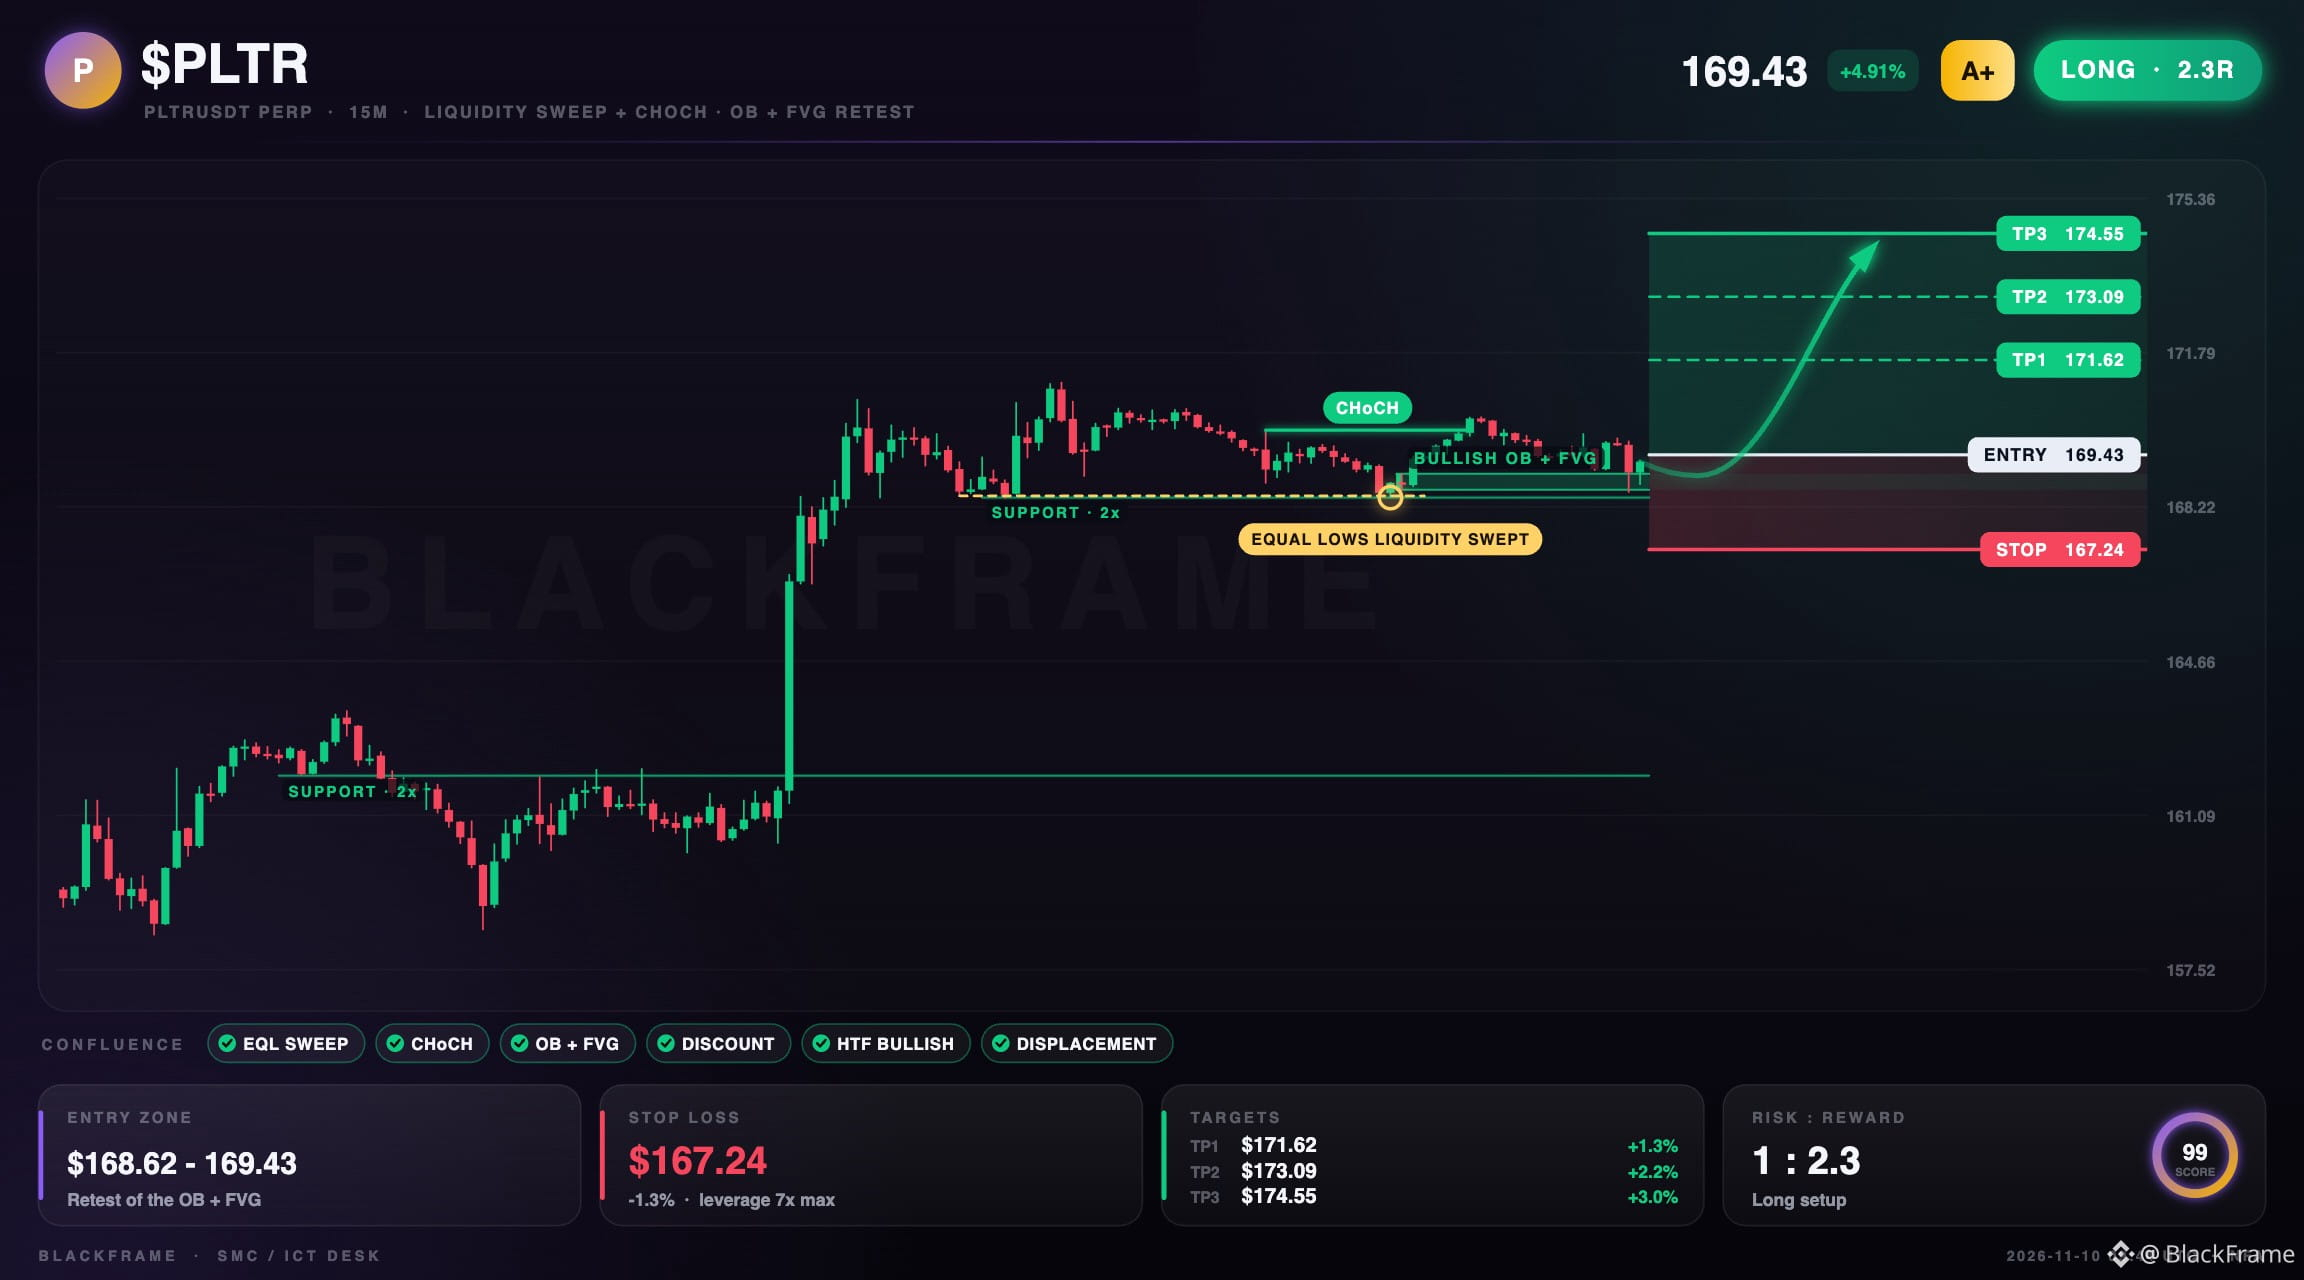
🪤 $PLTR trapped the late shorts and turned bullish
LONG · 15M
Entry: $168.99 - $169.43
TP1: $171.62
TP2: $173.09
TP3: $174.55
SL: $167.24
Sell-side liquidity below the equal lows was swept and price closed back inside. Structure then flipped bullish with a CHoCH on the 15M. Entry is the first retest of the fresh bullish order block and FVG in discount, targeting buy-side liquidity above.
#PLTR #SmartMoney · NFA
🪤 $PLTR trapped the late shorts and turned bullish
LONG · 15M
Entry: $168.99 - $169.43
TP1: $171.62
TP2: $173.09
TP3: $174.55
SL: $167.24
Sell-side liquidity below the equal lows was swept and price closed back inside. Structure then flipped bullish with a CHoCH on the 15M. Entry is the first retest of the fresh bullish order block and FVG in discount, targeting buy-side liquidity above.
#PLTR #SmartMoney · NFA
LONG · 15M
Entry: $168.99 - $169.43
TP1: $171.62
TP2: $173.09
TP3: $174.55
SL: $167.24
Sell-side liquidity below the equal lows was swept and price closed back inside. Structure then flipped bullish with a CHoCH on the 15M. Entry is the first retest of the fresh bullish order block and FVG in discount, targeting buy-side liquidity above.
#PLTR #SmartMoney · NFA
16
·
--
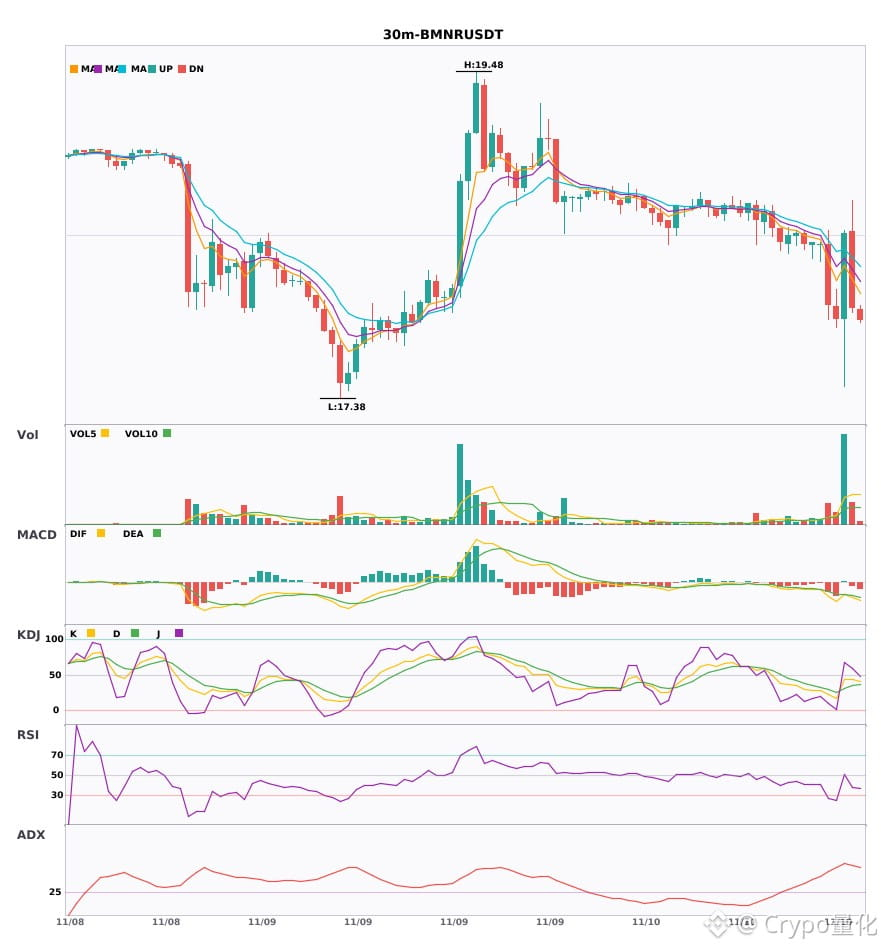
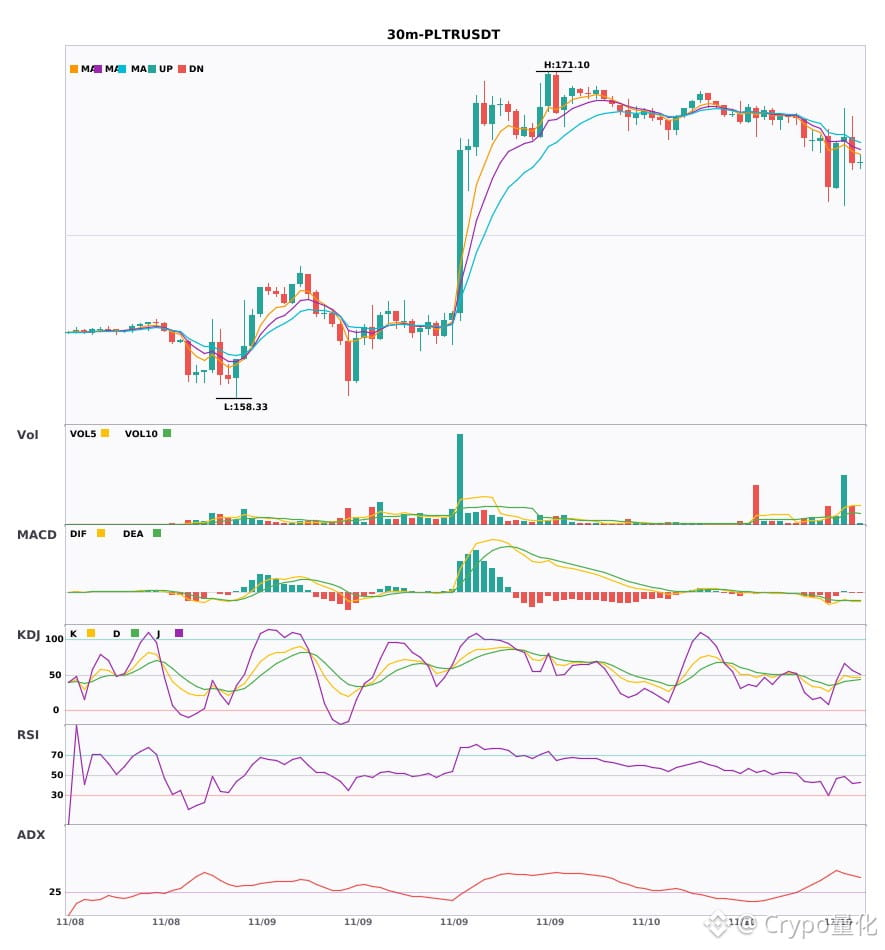
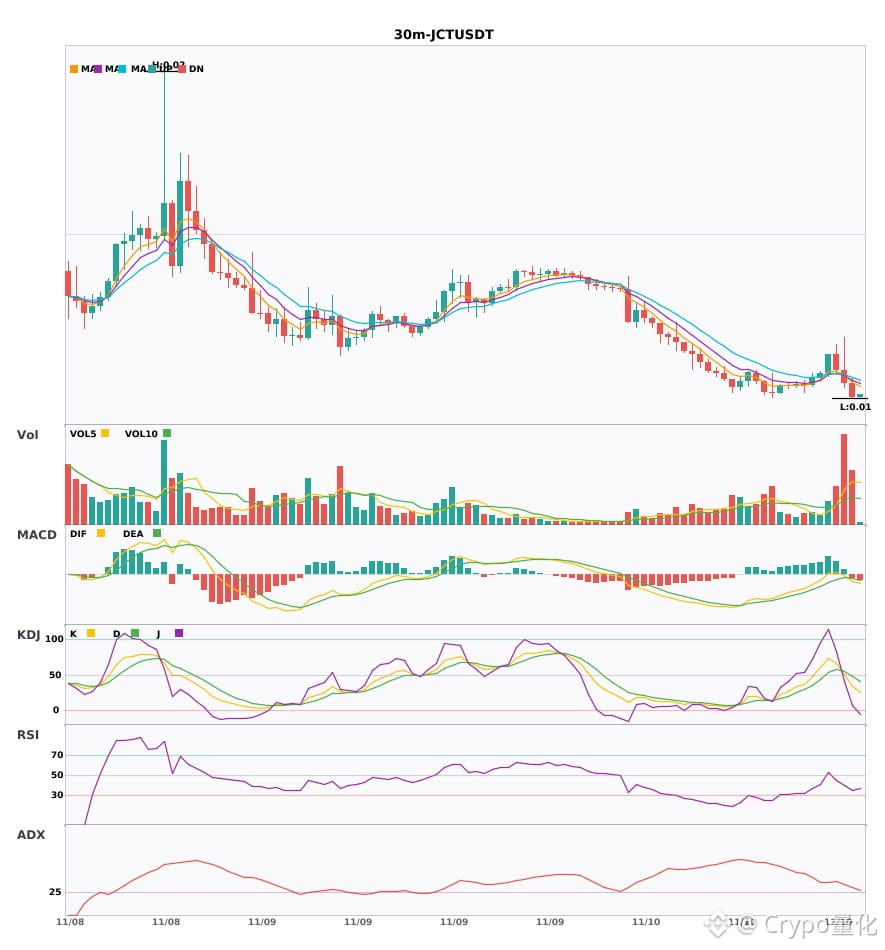
$BMNR / $PLTR / $JCT 30-minute synchronized bearish reversal, with bearish signals appearing simultaneously 🔥
════════════════════
🟢 $BMNR 30-minute bearish signal
⚠️ Technicals: ADX(60) Very strong trend (beware of an overheated pullback) | MACD bearish crossover below zero, bearish momentum accelerating | EMA5 < EMA8 < EMA13, bearish alignment | KDJ trading weakly, bears in control (K: 43.2, D: 35.5) | Volume surge (5.7x)
════════════════════
🟢 $PLTR 30-minute bearish signal
⚠️ Technicals: ADX(47) Very strong trend (beware of an overheated pullback) | MACD bearish crossover below zero, bearish momentum accelerating | EMA5 < EMA8 < EMA13, bearish alignment | KDJ trading weakly, bears in control (K: 47.0, D: 42.6) | Volume surge (4.7x)
════════════════════
🟢 $JCT 30-minute bearish signal
⚠️ Technicals: ADX(29) Trend is forming; entry may be considered | MACD bearish crossover below zero, bearish momentum accelerating | EMA5 crossed below EMA8, short-term bearish turn | KDJ trading weakly, bears in control (K: 34.6, D: 48.5) | Volume surge (3.5x)
════════════════════
🔔 Follow for first-hand market updates 🔔
#技术分析 #BMNR #PLTR #JCT
📌 When trading, check whether the candlestick pattern confirms the signal
$BMNR / $PLTR / $JCT 30-minute synchronized bearish reversal, with bearish signals appearing simultaneously 🔥
════════════════════
🟢 $BMNR 30-minute bearish signal
⚠️ Technicals: ADX(60) Very strong trend (beware of an overheated pullback) | MACD bearish crossover below zero, bearish momentum accelerating | EMA5 < EMA8 < EMA13, bearish alignment | KDJ trading weakly, bears in control (K: 43.2, D: 35.5) | Volume surge (5.7x)
════════════════════
🟢 $PLTR 30-minute bearish signal
⚠️ Technicals: ADX(47) Very strong trend (beware of an overheated pullback) | MACD bearish crossover below zero, bearish momentum accelerating | EMA5 < EMA8 < EMA13, bearish alignment | KDJ trading weakly, bears in control (K: 47.0, D: 42.6) | Volume surge (4.7x)
════════════════════
🟢 $JCT 30-minute bearish signal
⚠️ Technicals: ADX(29) Trend is forming; entry may be considered | MACD bearish crossover below zero, bearish momentum accelerating | EMA5 crossed below EMA8, short-term bearish turn | KDJ trading weakly, bears in control (K: 34.6, D: 48.5) | Volume surge (3.5x)
════════════════════
🔔 Follow for first-hand market updates 🔔
#技术分析 #BMNR #PLTR #JCT
📌 When trading, check whether the candlestick pattern confirms the signal
════════════════════
🟢 $BMNR 30-minute bearish signal
⚠️ Technicals: ADX(60) Very strong trend (beware of an overheated pullback) | MACD bearish crossover below zero, bearish momentum accelerating | EMA5 < EMA8 < EMA13, bearish alignment | KDJ trading weakly, bears in control (K: 43.2, D: 35.5) | Volume surge (5.7x)
════════════════════
🟢 $PLTR 30-minute bearish signal
⚠️ Technicals: ADX(47) Very strong trend (beware of an overheated pullback) | MACD bearish crossover below zero, bearish momentum accelerating | EMA5 < EMA8 < EMA13, bearish alignment | KDJ trading weakly, bears in control (K: 47.0, D: 42.6) | Volume surge (4.7x)
════════════════════
🟢 $JCT 30-minute bearish signal
⚠️ Technicals: ADX(29) Trend is forming; entry may be considered | MACD bearish crossover below zero, bearish momentum accelerating | EMA5 crossed below EMA8, short-term bearish turn | KDJ trading weakly, bears in control (K: 34.6, D: 48.5) | Volume surge (3.5x)
════════════════════
🔔 Follow for first-hand market updates 🔔
#技术分析 #BMNR #PLTR #JCT
📌 When trading, check whether the candlestick pattern confirms the signal
49
·
--
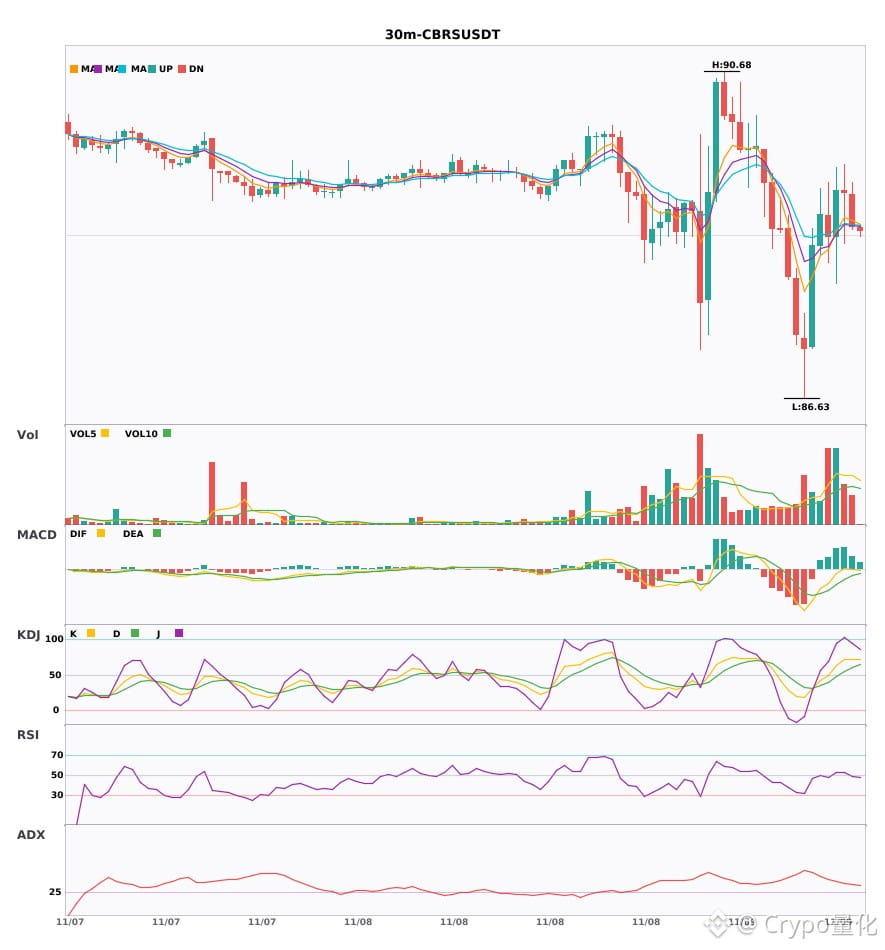
$CBRS / $PLTR 30-minute confluence turns bullish, with bullish signals appearing simultaneously 🔥
════════════════════
🔴 $CBRS 30-minute bullish signal
⚠️Technical: ADX(34) indicates a clear trending market | MACD DIF breaks above zero, signaling a bullish trend | Moving averages converge and build momentum; a directional move is imminent | KDJ is strong, with bulls in control (K: 71.2, D: 55.5) | Volume expands (2.2x)
════════════════════
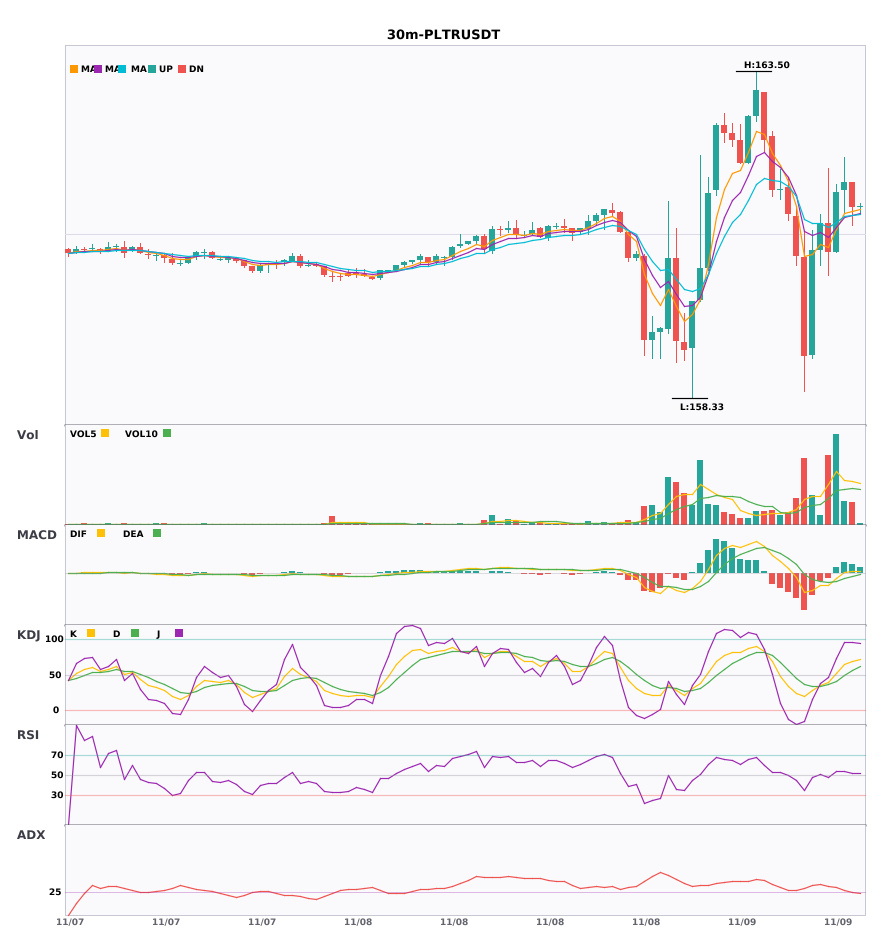
🔴 $PLTR 30-minute bullish signal
⚠️Technical: ADX(28) indicates a developing trend; an opportunity to participate | MACD DIF breaks above zero, signaling a bullish trend | EMA5 crosses above EMA8, signaling a short-term bullish turn | Volume surges (2.7x)
════════════════════
🔔 Follow for firsthand updates on unusual market movements 🔔
#技术分析 #CBRS #PLTR
📌 When trading, pay attention to whether the candlestick pattern confirms the setup
$CBRS / $PLTR 30-minute confluence turns bullish, with bullish signals appearing simultaneously 🔥
════════════════════
🔴 $CBRS 30-minute bullish signal
⚠️Technical: ADX(34) indicates a clear trending market | MACD DIF breaks above zero, signaling a bullish trend | Moving averages converge and build momentum; a directional move is imminent | KDJ is strong, with bulls in control (K: 71.2, D: 55.5) | Volume expands (2.2x)
════════════════════
🔴 $PLTR 30-minute bullish signal
⚠️Technical: ADX(28) indicates a developing trend; an opportunity to participate | MACD DIF breaks above zero, signaling a bullish trend | EMA5 crosses above EMA8, signaling a short-term bullish turn | Volume surges (2.7x)
════════════════════
🔔 Follow for firsthand updates on unusual market movements 🔔
#技术分析 #CBRS #PLTR
📌 When trading, pay attention to whether the candlestick pattern confirms the setup
════════════════════
🔴 $CBRS 30-minute bullish signal
⚠️Technical: ADX(34) indicates a clear trending market | MACD DIF breaks above zero, signaling a bullish trend | Moving averages converge and build momentum; a directional move is imminent | KDJ is strong, with bulls in control (K: 71.2, D: 55.5) | Volume expands (2.2x)
════════════════════
🔴 $PLTR 30-minute bullish signal
⚠️Technical: ADX(28) indicates a developing trend; an opportunity to participate | MACD DIF breaks above zero, signaling a bullish trend | EMA5 crosses above EMA8, signaling a short-term bullish turn | Volume surges (2.7x)
════════════════════
🔔 Follow for firsthand updates on unusual market movements 🔔
#技术分析 #CBRS #PLTR
📌 When trading, pay attention to whether the candlestick pattern confirms the setup
3
·
--
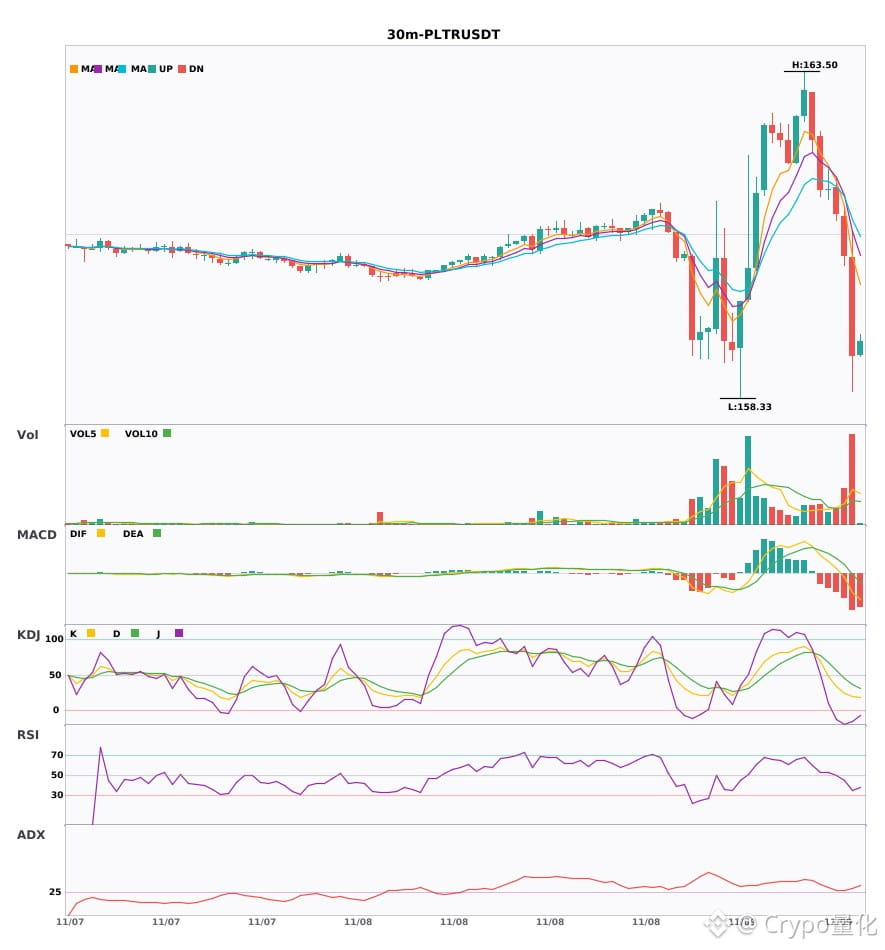
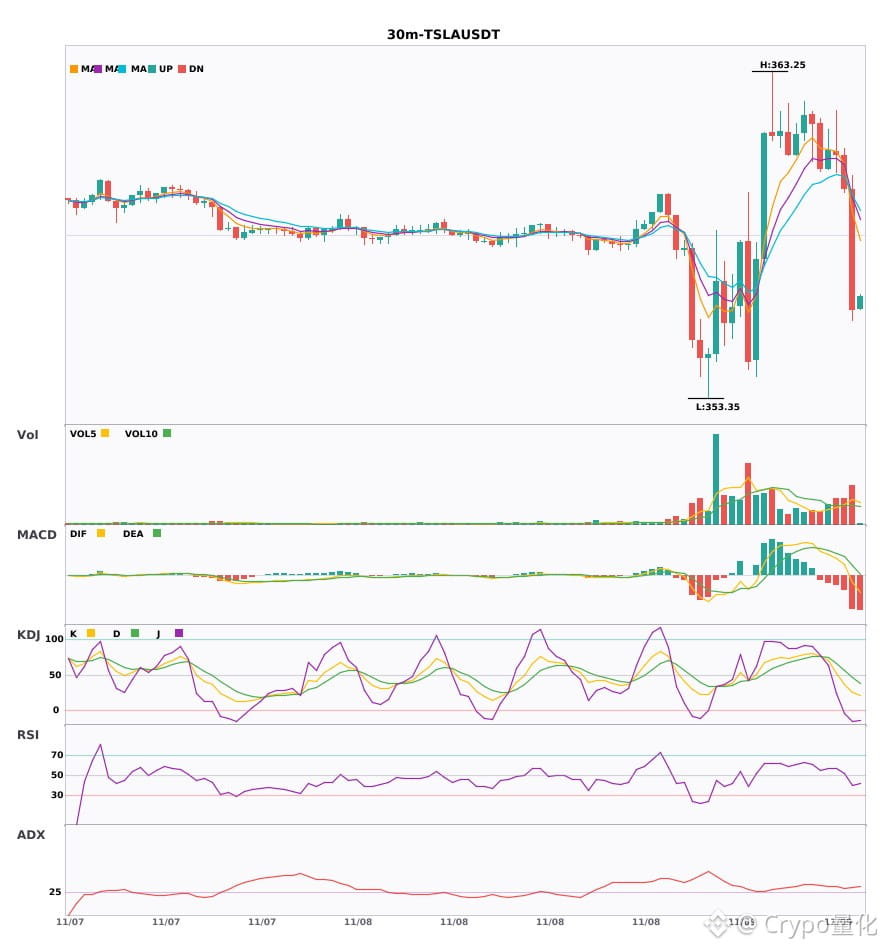
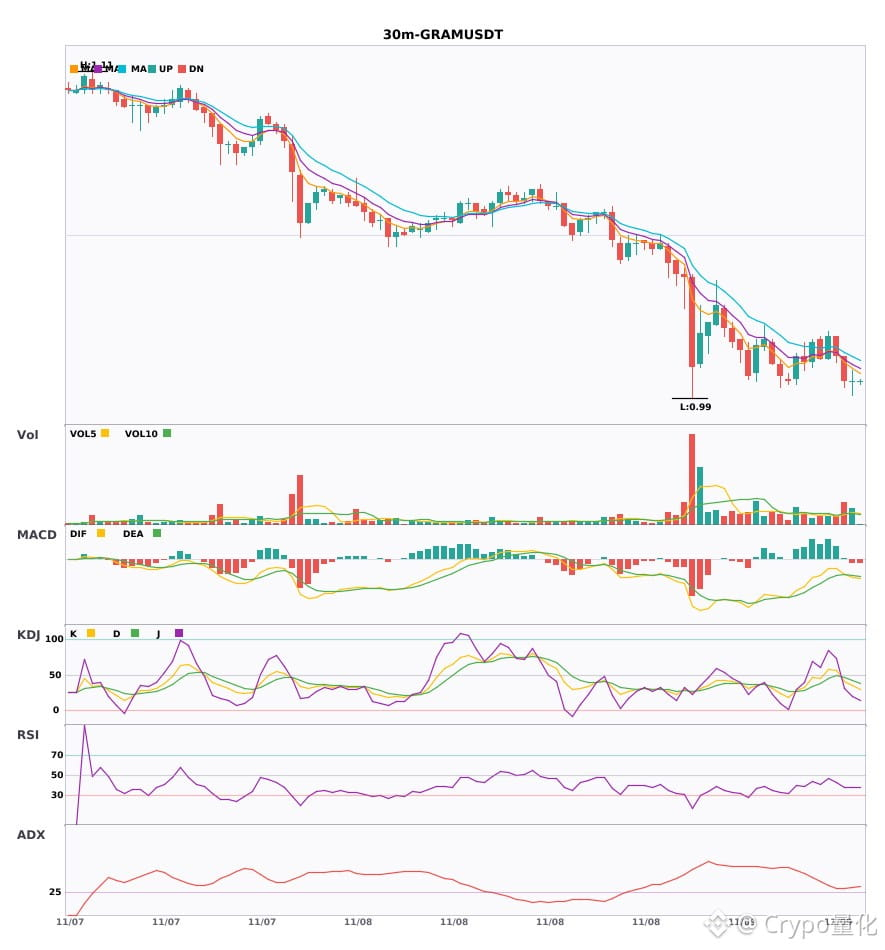
Multi-timeframe confluence: 3 assets with 30-minute bearish signals + 4-hour bearish trend confirmation🔥
════════════════════
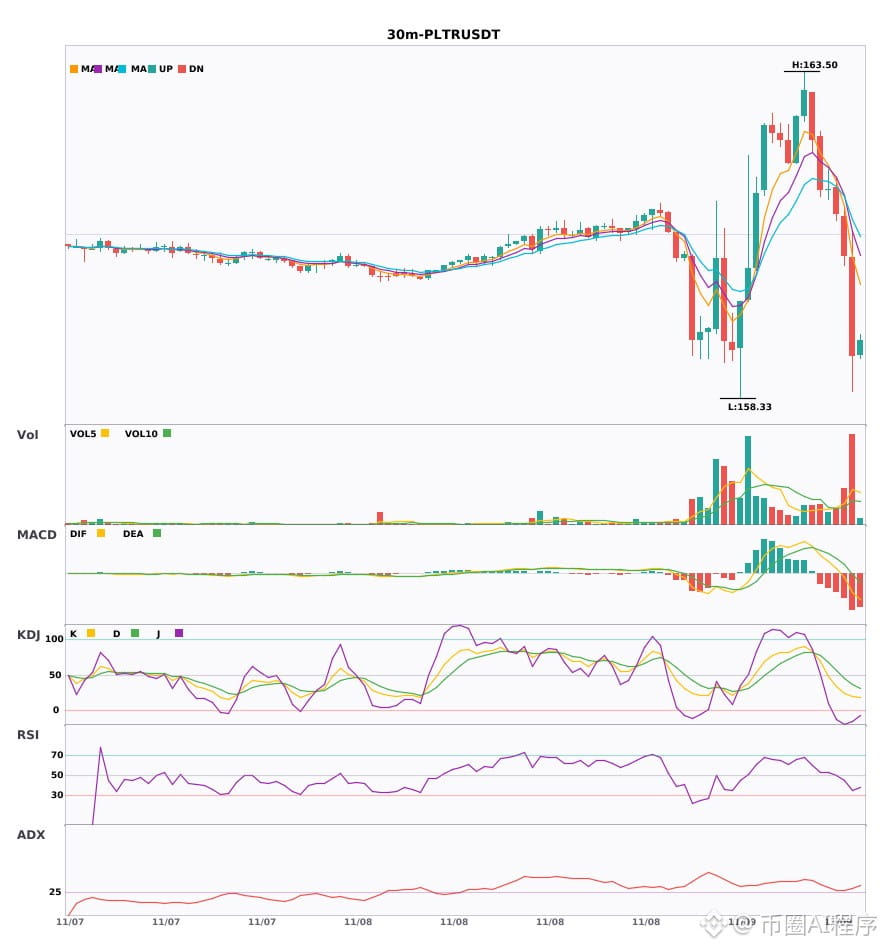
🟢 $PLTR 30-minute bearish signal
⚠️Technical analysis: 4-hour bearish confluence confirmed | 30-minute entry: MACD bearish, trend is weak, momentum is strengthening | EMA5 < EMA8 < EMA13, bearish alignment | KDJ is weak, bears are in control (K: 19.5, D: 36.9) | Volume surge (3.7x)
════════════════════
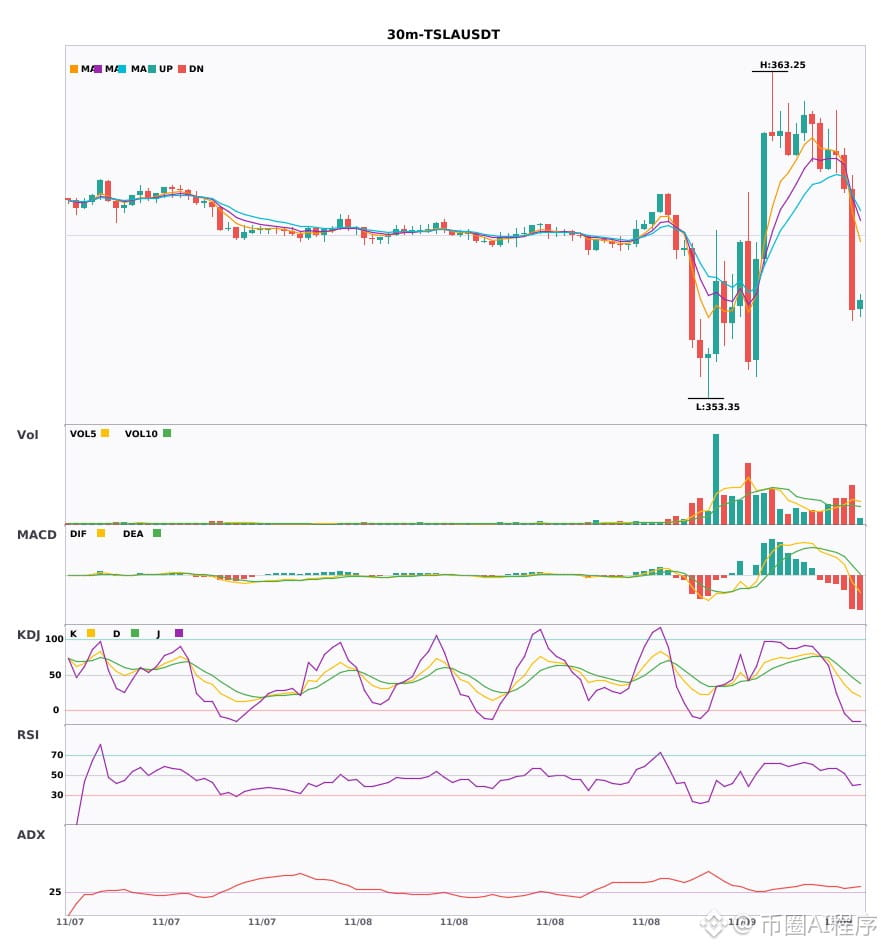
🟢 $TSLA 30-minute bearish signal
⚠️Technical analysis: 4-hour bearish confluence confirmed | 30-minute entry: MACD DIF falls below the zero line, trend turns bearish | EMA5 crosses below EMA8, short-term trend turns bearish | KDJ is weak, bears are in control (K: 25.8, D: 46.3) | Increased volume (2.0x)
════════════════════
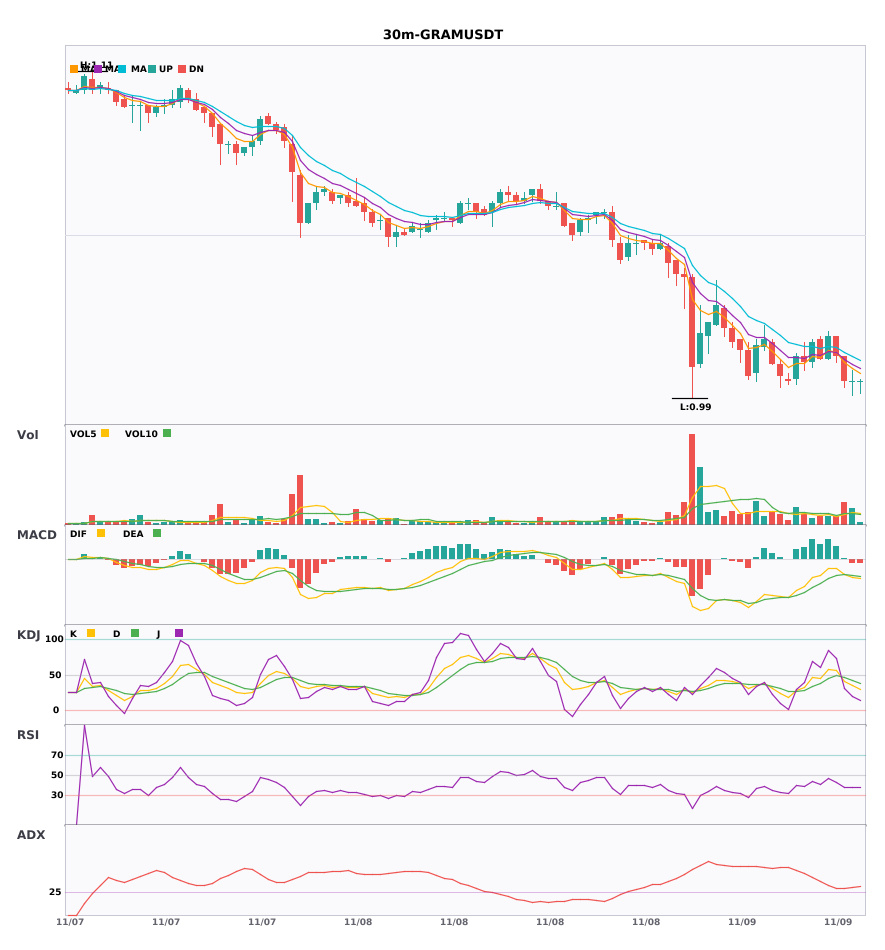
🟢 $GRAM 30-minute bearish signal
⚠️Technical analysis: 4-hour bearish confluence confirmed | 30-minute entry: MACD bearish crossover below zero, bearish momentum accelerates | EMA5 < EMA8 < EMA13, bearish alignment | KDJ is weak, bears are in control (K: 34.7, D: 42.4) | Increased volume (2.0x)
════════════════════
🔔 Follow for first-hand market alerts 🔔
#多周期共振 #PLTR #TSLA #GRAM
📌 When trading, pay attention to whether the candlestick pattern meets the criteria
Multi-timeframe confluence: 3 assets with 30-minute bearish signals + 4-hour bearish trend confirmation🔥
════════════════════
🟢 $PLTR 30-minute bearish signal
⚠️Technical analysis: 4-hour bearish confluence confirmed | 30-minute entry: MACD bearish, trend is weak, momentum is strengthening | EMA5 < EMA8 < EMA13, bearish alignment | KDJ is weak, bears are in control (K: 19.5, D: 36.9) | Volume surge (3.7x)
════════════════════
🟢 $TSLA 30-minute bearish signal
⚠️Technical analysis: 4-hour bearish confluence confirmed | 30-minute entry: MACD DIF falls below the zero line, trend turns bearish | EMA5 crosses below EMA8, short-term trend turns bearish | KDJ is weak, bears are in control (K: 25.8, D: 46.3) | Increased volume (2.0x)
════════════════════
🟢 $GRAM 30-minute bearish signal
⚠️Technical analysis: 4-hour bearish confluence confirmed | 30-minute entry: MACD bearish crossover below zero, bearish momentum accelerates | EMA5 < EMA8 < EMA13, bearish alignment | KDJ is weak, bears are in control (K: 34.7, D: 42.4) | Increased volume (2.0x)
════════════════════
🔔 Follow for first-hand market alerts 🔔
#多周期共振 #PLTR #TSLA #GRAM
📌 When trading, pay attention to whether the candlestick pattern meets the criteria
════════════════════
🟢 $PLTR 30-minute bearish signal
⚠️Technical analysis: 4-hour bearish confluence confirmed | 30-minute entry: MACD bearish, trend is weak, momentum is strengthening | EMA5 < EMA8 < EMA13, bearish alignment | KDJ is weak, bears are in control (K: 19.5, D: 36.9) | Volume surge (3.7x)
════════════════════
🟢 $TSLA 30-minute bearish signal
⚠️Technical analysis: 4-hour bearish confluence confirmed | 30-minute entry: MACD DIF falls below the zero line, trend turns bearish | EMA5 crosses below EMA8, short-term trend turns bearish | KDJ is weak, bears are in control (K: 25.8, D: 46.3) | Increased volume (2.0x)
════════════════════
🟢 $GRAM 30-minute bearish signal
⚠️Technical analysis: 4-hour bearish confluence confirmed | 30-minute entry: MACD bearish crossover below zero, bearish momentum accelerates | EMA5 < EMA8 < EMA13, bearish alignment | KDJ is weak, bears are in control (K: 34.7, D: 42.4) | Increased volume (2.0x)
════════════════════
🔔 Follow for first-hand market alerts 🔔
#多周期共振 #PLTR #TSLA #GRAM
📌 When trading, pay attention to whether the candlestick pattern meets the criteria
10
·
--
$PLTR / $TSLA / $GRAM 30-minute timeframe bearish, short-term under pressure 🔥
════════════════════
🟢 $PLTR 30-minute bearish signal
⚠️Technical: ADX(31) clear trending market | MACD bearish, trend is weak, momentum strengthening | EMA5 < EMA8 < EMA13, bearish alignment | KDJ weakening, bears in control (K: 19.5, D: 36.9) | Volume surge (3.7x)
════════════════════
🟢 $TSLA 30-minute bearish signal
⚠️Technical: ADX(32) clear trending market | MACD DIF falls below zero, trend turns bearish | EMA5 crosses below EMA8, short-term trend turns bearish | KDJ weakening, bears in control (K: 25.8, D: 46.3) | Volume increases (2.0x)
════════════════════
🟢 $GRAM 30-minute bearish signal
⚠️Technical: ADX(27) Trend is forming; opportunity to participate | MACD bearish cross below zero, bearish momentum accelerating | EMA5 < EMA8 < EMA13, bearish alignment | KDJ weakening, bears in control (K: 34.7, D: 42.4) | Volume increases (2.0x)
════════════════════
🔔 Follow for first-hand market updates 🔔
#技术分析 #PLTR #TSLA #GRAM
📌 When trading, pay attention to whether the candlestick pattern meets the criteria
$PLTR / $TSLA / $GRAM 30-minute timeframe bearish, short-term under pressure 🔥
════════════════════
🟢 $PLTR 30-minute bearish signal
⚠️Technical: ADX(31) clear trending market | MACD bearish, trend is weak, momentum strengthening | EMA5 < EMA8 < EMA13, bearish alignment | KDJ weakening, bears in control (K: 19.5, D: 36.9) | Volume surge (3.7x)
════════════════════
🟢 $TSLA 30-minute bearish signal
⚠️Technical: ADX(32) clear trending market | MACD DIF falls below zero, trend turns bearish | EMA5 crosses below EMA8, short-term trend turns bearish | KDJ weakening, bears in control (K: 25.8, D: 46.3) | Volume increases (2.0x)
════════════════════
🟢 $GRAM 30-minute bearish signal
⚠️Technical: ADX(27) Trend is forming; opportunity to participate | MACD bearish cross below zero, bearish momentum accelerating | EMA5 < EMA8 < EMA13, bearish alignment | KDJ weakening, bears in control (K: 34.7, D: 42.4) | Volume increases (2.0x)
════════════════════
🔔 Follow for first-hand market updates 🔔
#技术分析 #PLTR #TSLA #GRAM
📌 When trading, pay attention to whether the candlestick pattern meets the criteria
════════════════════
🟢 $PLTR 30-minute bearish signal
⚠️Technical: ADX(31) clear trending market | MACD bearish, trend is weak, momentum strengthening | EMA5 < EMA8 < EMA13, bearish alignment | KDJ weakening, bears in control (K: 19.5, D: 36.9) | Volume surge (3.7x)
════════════════════
🟢 $TSLA 30-minute bearish signal
⚠️Technical: ADX(32) clear trending market | MACD DIF falls below zero, trend turns bearish | EMA5 crosses below EMA8, short-term trend turns bearish | KDJ weakening, bears in control (K: 25.8, D: 46.3) | Volume increases (2.0x)
════════════════════
🟢 $GRAM 30-minute bearish signal
⚠️Technical: ADX(27) Trend is forming; opportunity to participate | MACD bearish cross below zero, bearish momentum accelerating | EMA5 < EMA8 < EMA13, bearish alignment | KDJ weakening, bears in control (K: 34.7, D: 42.4) | Volume increases (2.0x)
════════════════════
🔔 Follow for first-hand market updates 🔔
#技术分析 #PLTR #TSLA #GRAM
📌 When trading, pay attention to whether the candlestick pattern meets the criteria
14

·
--
Bulls and bears are already arguing over this level. Palantir $PLTR is trading at 152.56 on OKX futures, down 11.35% in a day and just a step above its 24-hour low of 152.26.
Yesterday it was still at 172.13; today it’s hovering near the low. For people holding stocks like this, the hardest part isn’t how much they’ve lost—it’s not knowing whether this is just a deep pullback or the market really has turned.
I could be wrong: if 152.26 holds, there’s still room to breathe; if it doesn’t, a new low is next. I’ll own it if I’m wrong. The key level is 152.26—if it breaks, it breaks.
At this level for Palantir, are you stepping in now, or waiting for it to finish falling first?
#PLTR #USStocks
Bulls and bears are already arguing over this level. Palantir $PLTR is trading at 152.56 on OKX futures, down 11.35% in a day and just a step above its 24-hour low of 152.26.
Yesterday it was still at 172.13; today it’s hovering near the low. For people holding stocks like this, the hardest part isn’t how much they’ve lost—it’s not knowing whether this is just a deep pullback or the market really has turned.
I could be wrong: if 152.26 holds, there’s still room to breathe; if it doesn’t, a new low is next. I’ll own it if I’m wrong. The key level is 152.26—if it breaks, it breaks.
At this level for Palantir, are you stepping in now, or waiting for it to finish falling first?
#PLTR #USStocks
Yesterday it was still at 172.13; today it’s hovering near the low. For people holding stocks like this, the hardest part isn’t how much they’ve lost—it’s not knowing whether this is just a deep pullback or the market really has turned.
I could be wrong: if 152.26 holds, there’s still room to breathe; if it doesn’t, a new low is next. I’ll own it if I’m wrong. The key level is 152.26—if it breaks, it breaks.
At this level for Palantir, are you stepping in now, or waiting for it to finish falling first?
#PLTR #USStocks

·
--
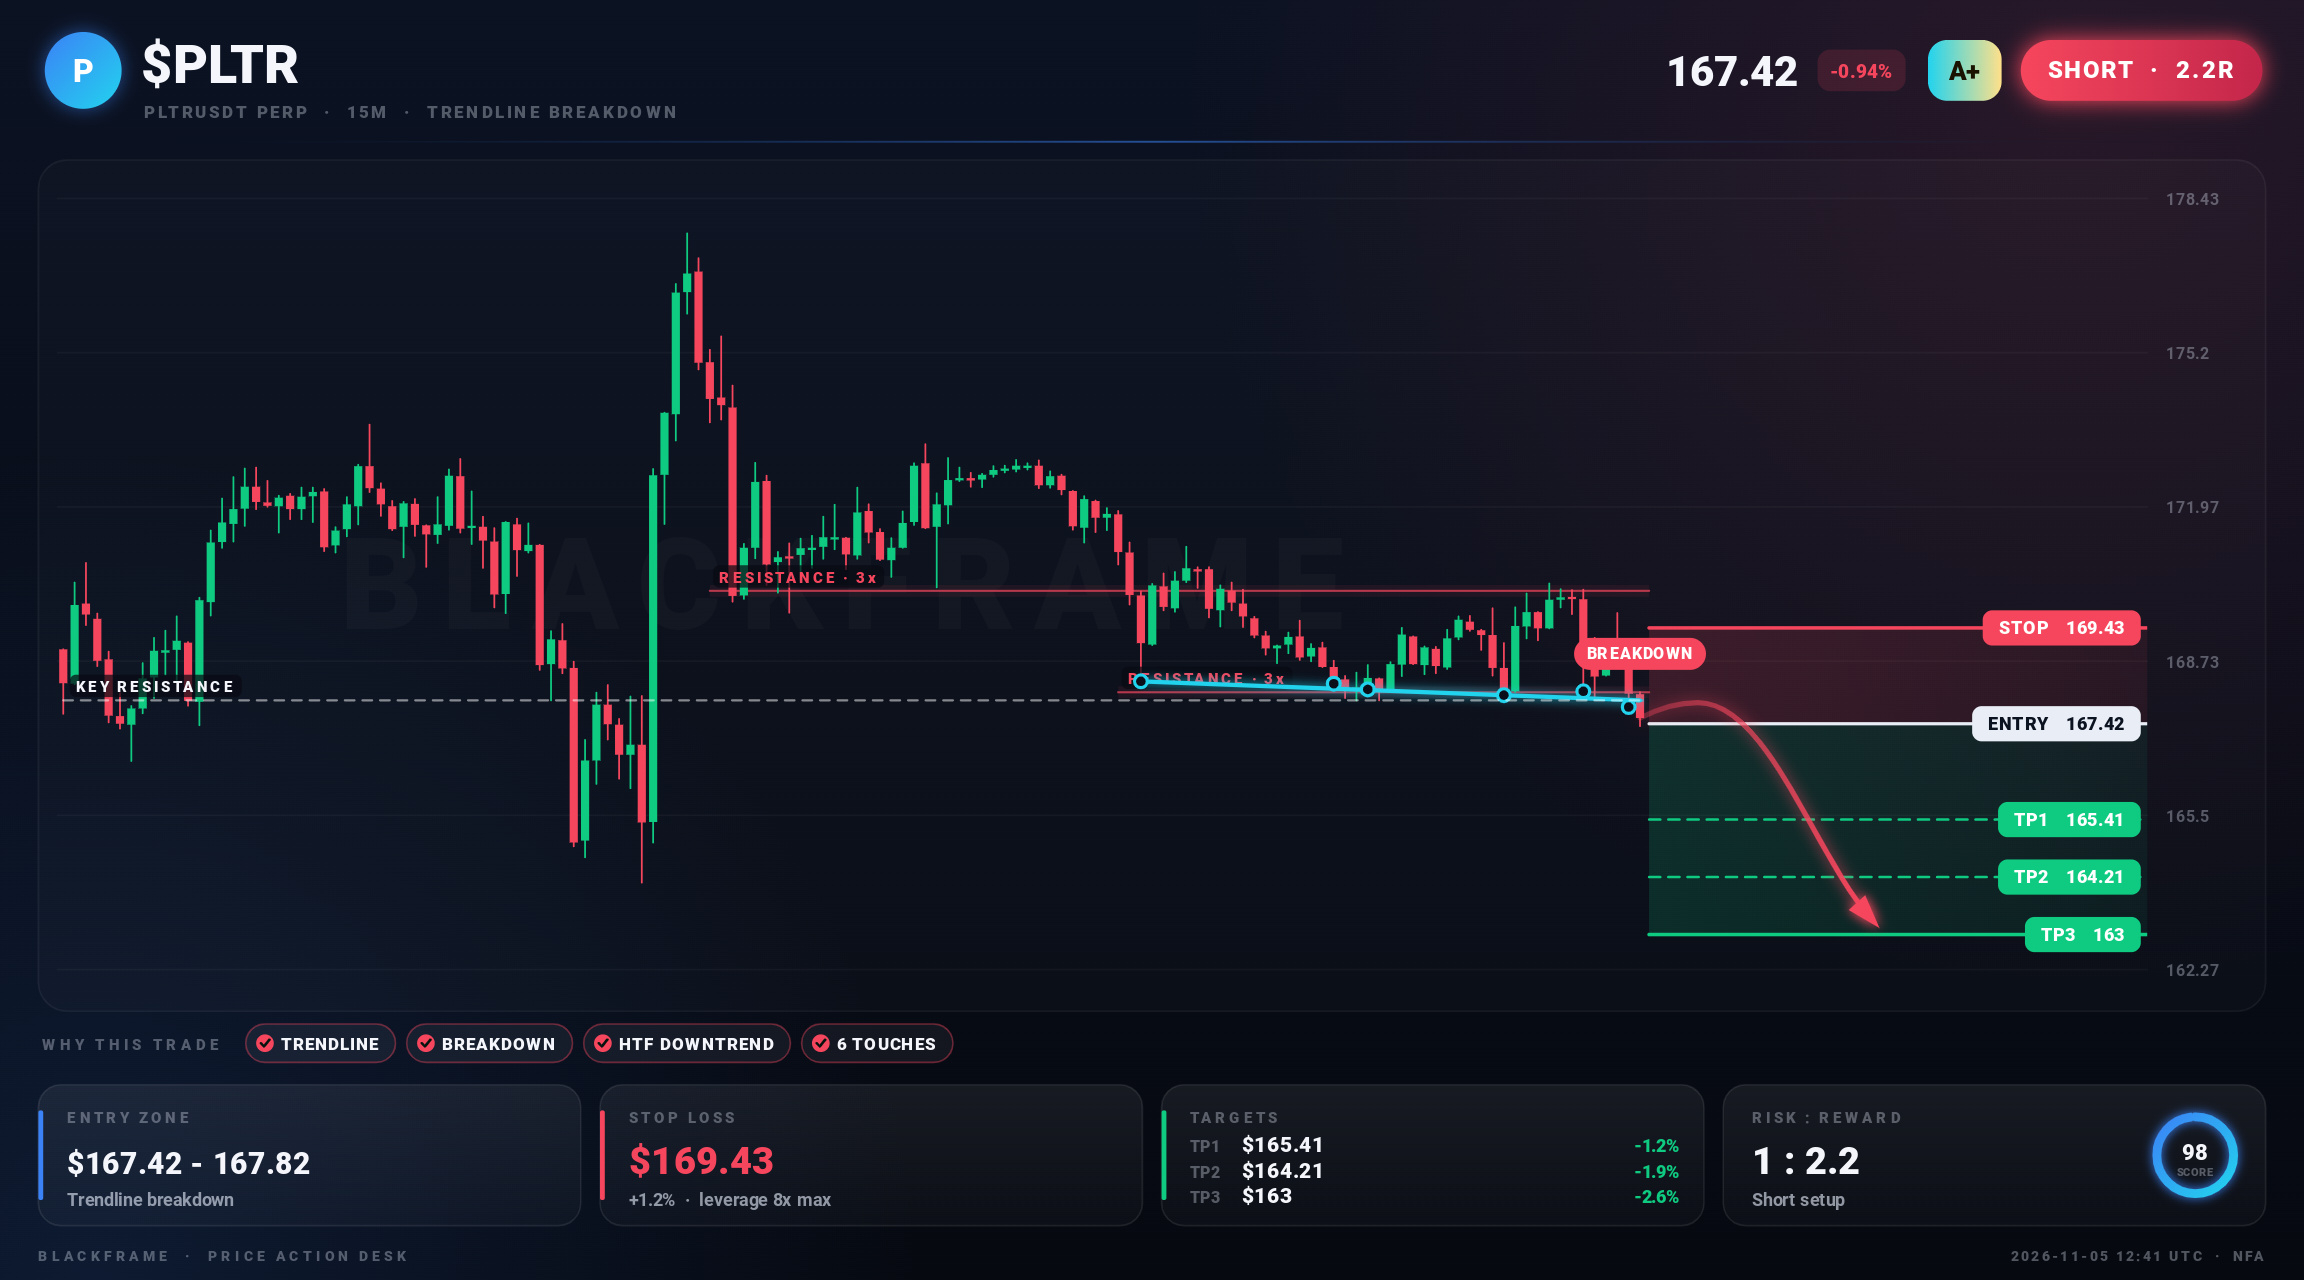
🩸 $PLTR just lost the floor
SHORT · 15M
Entry: $167.42 - $167.92
TP1: $165.41
TP2: $164.21
TP3: $163
SL: $169.43
Price broke below a trendline near $167.91 and is holding it. The higher timeframe trend agrees.
#PLTR #CryptoTrading #CryptoMarket · NFA
🩸 $PLTR just lost the floor
SHORT · 15M
Entry: $167.42 - $167.92
TP1: $165.41
TP2: $164.21
TP3: $163
SL: $169.43
Price broke below a trendline near $167.91 and is holding it. The higher timeframe trend agrees.
#PLTR #CryptoTrading #CryptoMarket · NFA
SHORT · 15M
Entry: $167.42 - $167.92
TP1: $165.41
TP2: $164.21
TP3: $163
SL: $169.43
Price broke below a trendline near $167.91 and is holding it. The higher timeframe trend agrees.
#PLTR #CryptoTrading #CryptoMarket · NFA
2
·
--
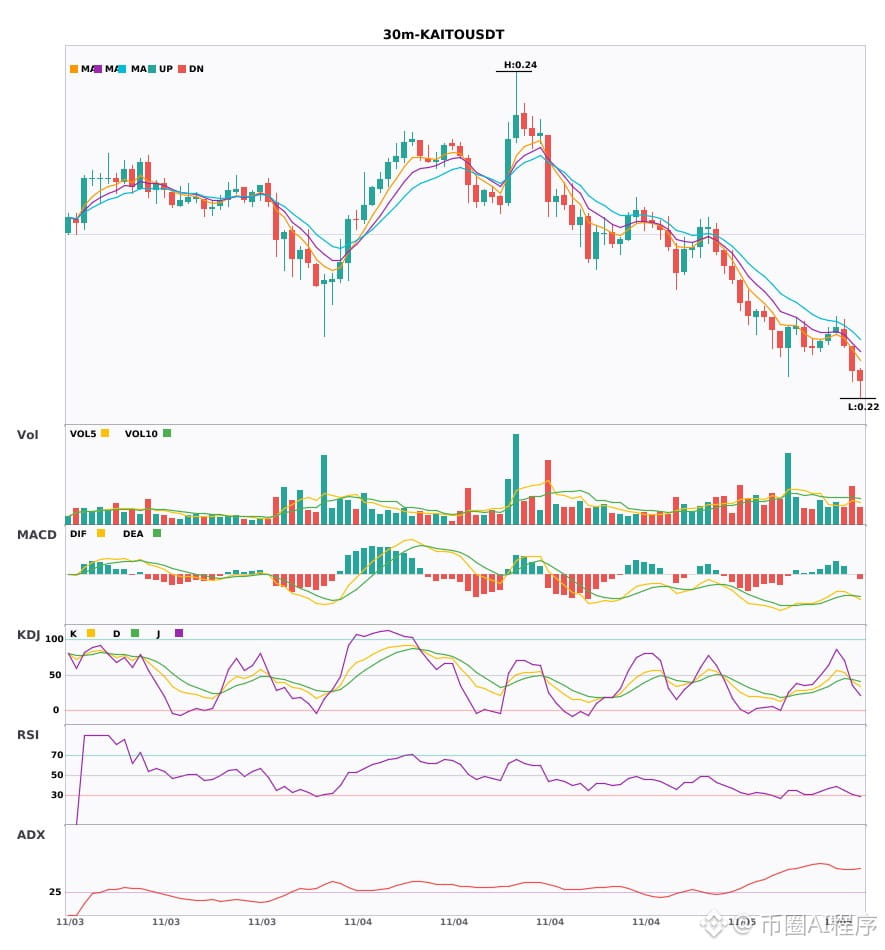
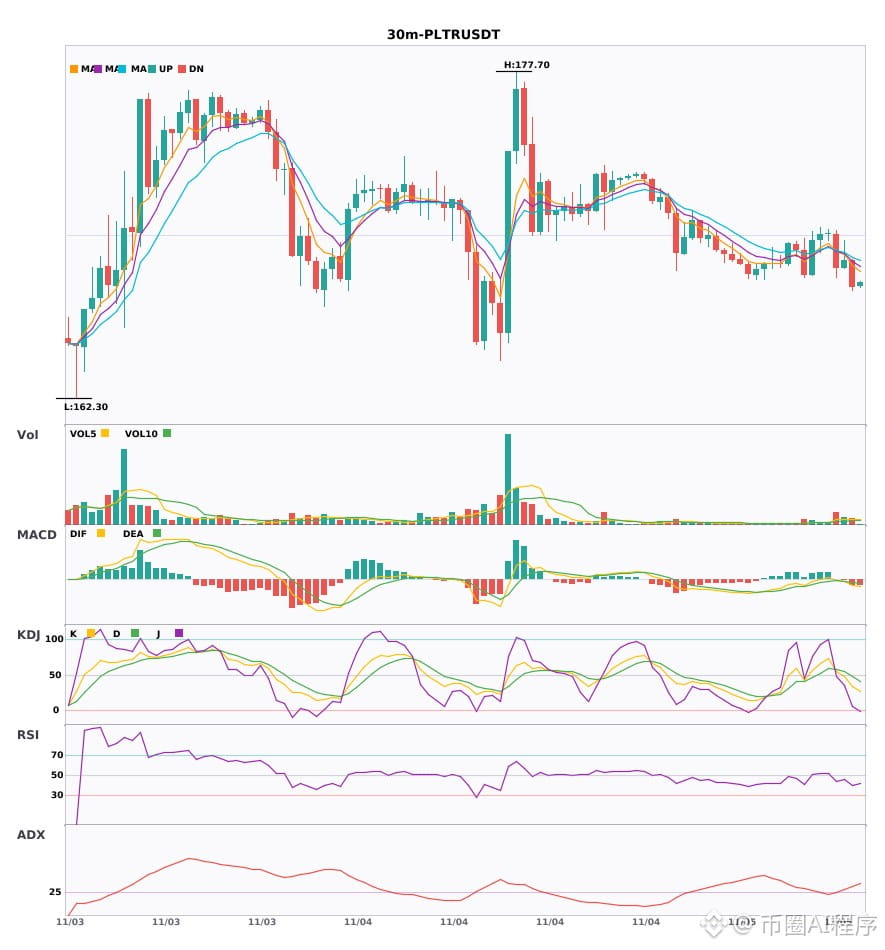
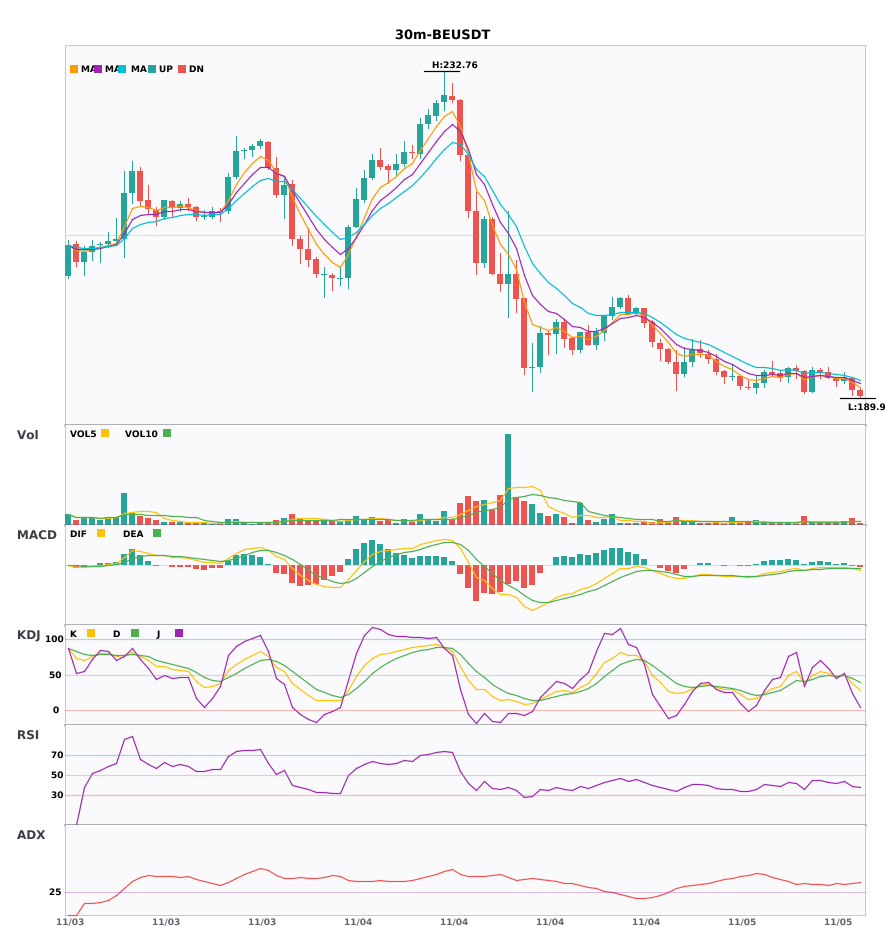
Multi-timeframe confluence: $KAITO / $PLTR / $BE weakening on the 30-minute timeframe, 4-hour bearish trend confirmed 🔥
════════════════════
🟢 $KAITO 30-minute bearish signal
⚠️Technical analysis: 4-hour bearish confluence confirmed | 30-minute entry: MACD bearish crossover below zero, bearish momentum accelerating | EMA5 < EMA8 < EMA13, bearish alignment | KDJ bearish crossover, short-term outlook bearish (K: 41.1, D: 44.1) | Volume normal (1.4x)
════════════════════
🟢 $PLTR 30-minute bearish signal
⚠️Technical analysis: 4-hour bearish confluence confirmed | 30-minute entry: MACD bearish crossover below zero, bearish momentum accelerating | EMA5 crossed below EMA8, short-term outlook turns bearish | Volume surges (3.9x)
════════════════════
🟢 $BE 30-minute bearish signal
⚠️Technical analysis: 4-hour bearish confluence confirmed | 30-minute entry: MACD bearish crossover below zero, bearish momentum accelerating | EMA5 < EMA8 < EMA13, bearish alignment | KDJ bearish crossover, short-term outlook bearish (K: 38.5, D: 45.6) | Volume increases (1.9x)
📢Market update: Predict (PREDICT) Listing Will Be Postponed
════════════════════
🔔 Follow for first-hand market alerts 🔔
#多周期共振 #KAITO #PLTR #BE
📌 When trading, pay attention to whether the candlestick pattern confirms the signal
Multi-timeframe confluence: $KAITO / $PLTR / $BE weakening on the 30-minute timeframe, 4-hour bearish trend confirmed 🔥
════════════════════
🟢 $KAITO 30-minute bearish signal
⚠️Technical analysis: 4-hour bearish confluence confirmed | 30-minute entry: MACD bearish crossover below zero, bearish momentum accelerating | EMA5 < EMA8 < EMA13, bearish alignment | KDJ bearish crossover, short-term outlook bearish (K: 41.1, D: 44.1) | Volume normal (1.4x)
════════════════════
🟢 $PLTR 30-minute bearish signal
⚠️Technical analysis: 4-hour bearish confluence confirmed | 30-minute entry: MACD bearish crossover below zero, bearish momentum accelerating | EMA5 crossed below EMA8, short-term outlook turns bearish | Volume surges (3.9x)
════════════════════
🟢 $BE 30-minute bearish signal
⚠️Technical analysis: 4-hour bearish confluence confirmed | 30-minute entry: MACD bearish crossover below zero, bearish momentum accelerating | EMA5 < EMA8 < EMA13, bearish alignment | KDJ bearish crossover, short-term outlook bearish (K: 38.5, D: 45.6) | Volume increases (1.9x)
📢Market update: Predict (PREDICT) Listing Will Be Postponed
════════════════════
🔔 Follow for first-hand market alerts 🔔
#多周期共振 #KAITO #PLTR #BE
📌 When trading, pay attention to whether the candlestick pattern confirms the signal
════════════════════
🟢 $KAITO 30-minute bearish signal
⚠️Technical analysis: 4-hour bearish confluence confirmed | 30-minute entry: MACD bearish crossover below zero, bearish momentum accelerating | EMA5 < EMA8 < EMA13, bearish alignment | KDJ bearish crossover, short-term outlook bearish (K: 41.1, D: 44.1) | Volume normal (1.4x)
════════════════════
🟢 $PLTR 30-minute bearish signal
⚠️Technical analysis: 4-hour bearish confluence confirmed | 30-minute entry: MACD bearish crossover below zero, bearish momentum accelerating | EMA5 crossed below EMA8, short-term outlook turns bearish | Volume surges (3.9x)
════════════════════
🟢 $BE 30-minute bearish signal
⚠️Technical analysis: 4-hour bearish confluence confirmed | 30-minute entry: MACD bearish crossover below zero, bearish momentum accelerating | EMA5 < EMA8 < EMA13, bearish alignment | KDJ bearish crossover, short-term outlook bearish (K: 38.5, D: 45.6) | Volume increases (1.9x)
📢Market update: Predict (PREDICT) Listing Will Be Postponed
════════════════════
🔔 Follow for first-hand market alerts 🔔
#多周期共振 #KAITO #PLTR #BE
📌 When trading, pay attention to whether the candlestick pattern confirms the signal
11
·
--
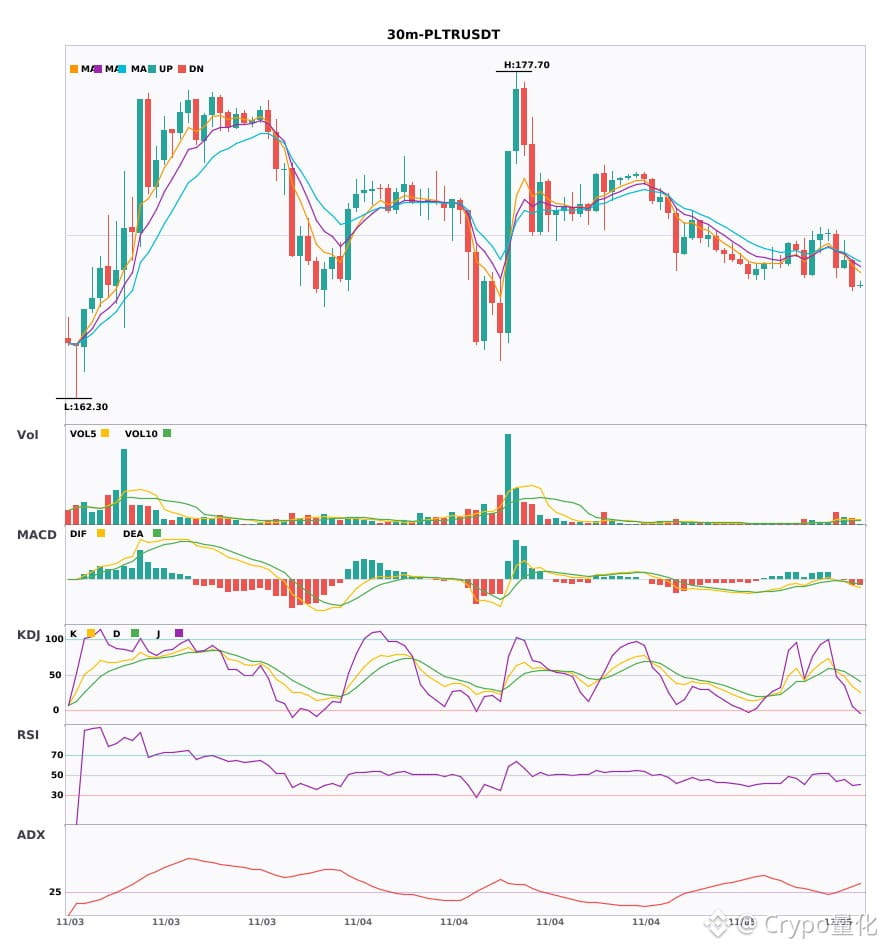
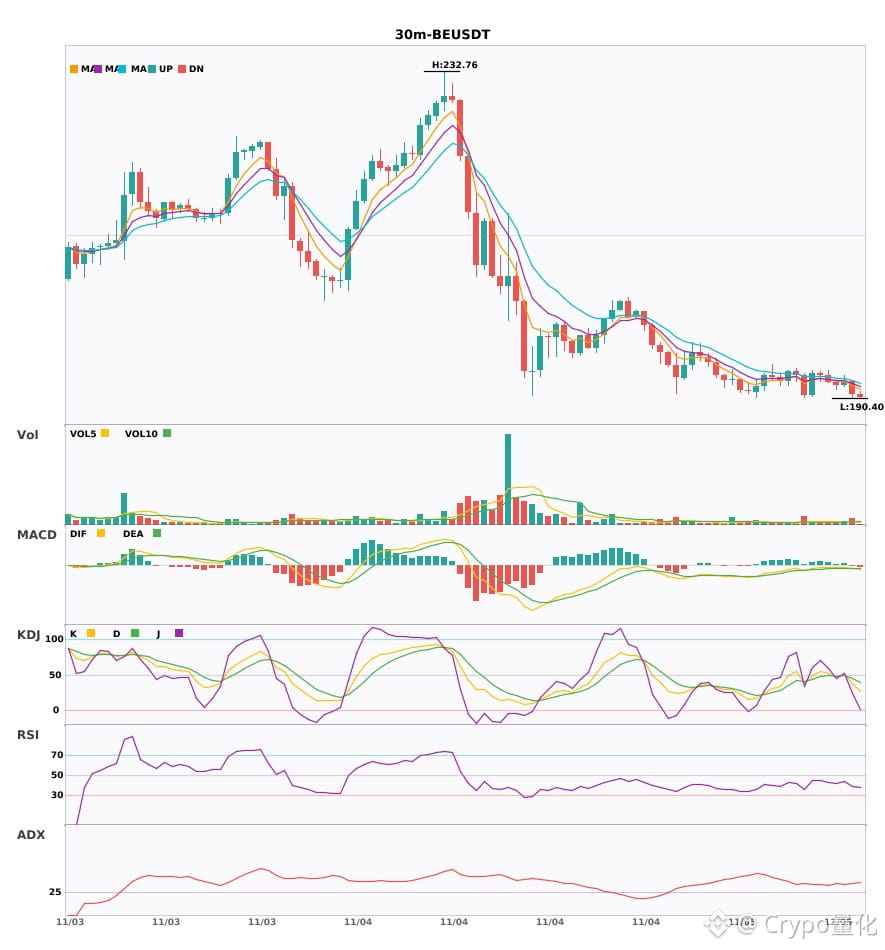
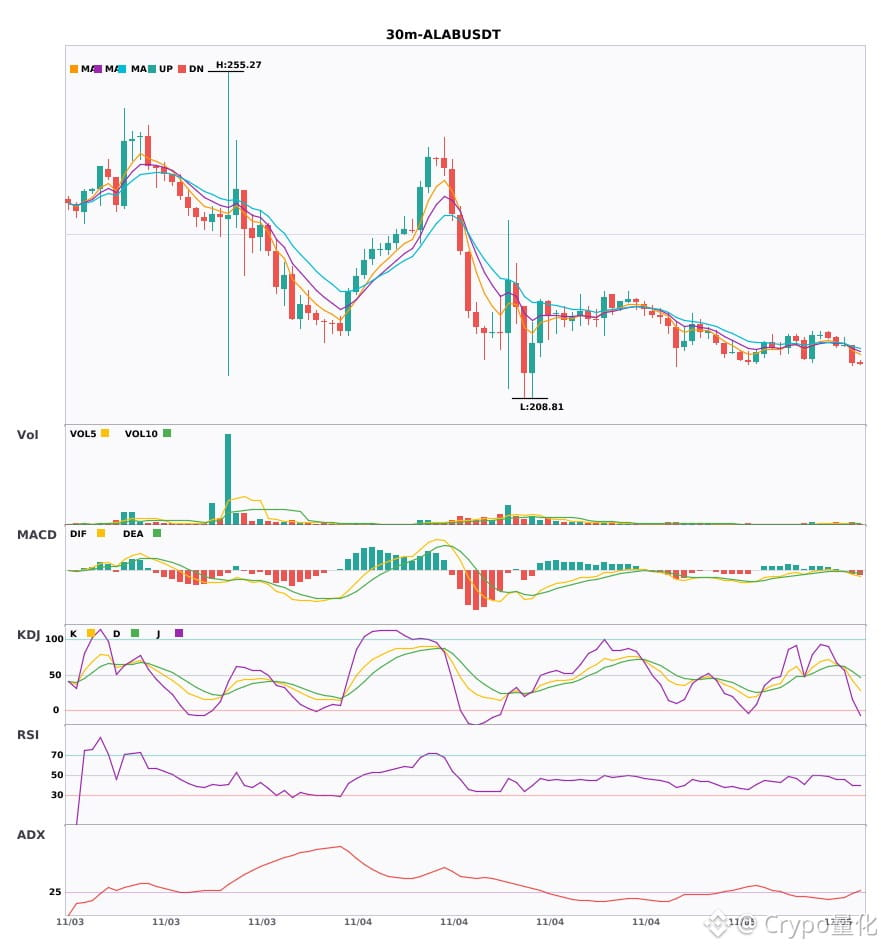
3 30-minute bearish alerts: $PLTR / $BE / $ALAB🔥
════════════════════
🟢 $PLTR 30-minute bearish signal
⚠️Technical analysis: ADX(28): Trend is forming, opportunity to participate | MACD bearish crossover below zero, bearish momentum accelerating | EMA5 crosses below EMA8, short-term outlook turns bearish | Volume surge (3.9x)
════════════════════
🟢 $BE 30-minute bearish signal
⚠️Technical analysis: ADX(34): Clear trending market | MACD bearish crossover below zero, bearish momentum accelerating | EMA5 < EMA8 < EMA13, bearish alignment | KDJ bearish crossover, short-term outlook is bearish (K: 38.5, D: 45.6) | Volume increase (1.9x)
📢Market update: Predict (PREDICT) Listing Will Be Postponed
════════════════════
🟢 $ALAB 30-minute bearish signal
⚠️Technical analysis: ADX(25): Trend is forming, opportunity to participate | MACD bearish crossover below zero, bearish momentum accelerating | EMA5 crosses below EMA8, short-term outlook turns bearish | Volume increase (2.2x)
════════════════════
🔔 Follow to get the latest market movements 🔔
#技术分析 #PLTR #BE #ALAB
📌 When trading, pay attention to whether the candlestick pattern aligns
3 30-minute bearish alerts: $PLTR / $BE / $ALAB 🔥
════════════════════
🟢 $PLTR 30-minute bearish signal
⚠️Technical analysis: ADX(28): Trend is forming, opportunity to participate | MACD bearish crossover below zero, bearish momentum accelerating | EMA5 crosses below EMA8, short-term outlook turns bearish | Volume surge (3.9x)
════════════════════
🟢 $BE 30-minute bearish signal
⚠️Technical analysis: ADX(34): Clear trending market | MACD bearish crossover below zero, bearish momentum accelerating | EMA5 < EMA8 < EMA13, bearish alignment | KDJ bearish crossover, short-term outlook is bearish (K: 38.5, D: 45.6) | Volume increase (1.9x)
📢Market update: Predict (PREDICT) Listing Will Be Postponed
════════════════════
🟢 $ALAB 30-minute bearish signal
⚠️Technical analysis: ADX(25): Trend is forming, opportunity to participate | MACD bearish crossover below zero, bearish momentum accelerating | EMA5 crosses below EMA8, short-term outlook turns bearish | Volume increase (2.2x)
════════════════════
🔔 Follow to get the latest market movements 🔔
#技术分析 #PLTR #BE #ALAB
📌 When trading, pay attention to whether the candlestick pattern aligns
════════════════════
🟢 $PLTR 30-minute bearish signal
⚠️Technical analysis: ADX(28): Trend is forming, opportunity to participate | MACD bearish crossover below zero, bearish momentum accelerating | EMA5 crosses below EMA8, short-term outlook turns bearish | Volume surge (3.9x)
════════════════════
🟢 $BE 30-minute bearish signal
⚠️Technical analysis: ADX(34): Clear trending market | MACD bearish crossover below zero, bearish momentum accelerating | EMA5 < EMA8 < EMA13, bearish alignment | KDJ bearish crossover, short-term outlook is bearish (K: 38.5, D: 45.6) | Volume increase (1.9x)
📢Market update: Predict (PREDICT) Listing Will Be Postponed
════════════════════
🟢 $ALAB 30-minute bearish signal
⚠️Technical analysis: ADX(25): Trend is forming, opportunity to participate | MACD bearish crossover below zero, bearish momentum accelerating | EMA5 crosses below EMA8, short-term outlook turns bearish | Volume increase (2.2x)
════════════════════
🔔 Follow to get the latest market movements 🔔
#技术分析 #PLTR #BE #ALAB
📌 When trading, pay attention to whether the candlestick pattern aligns
6
·
--
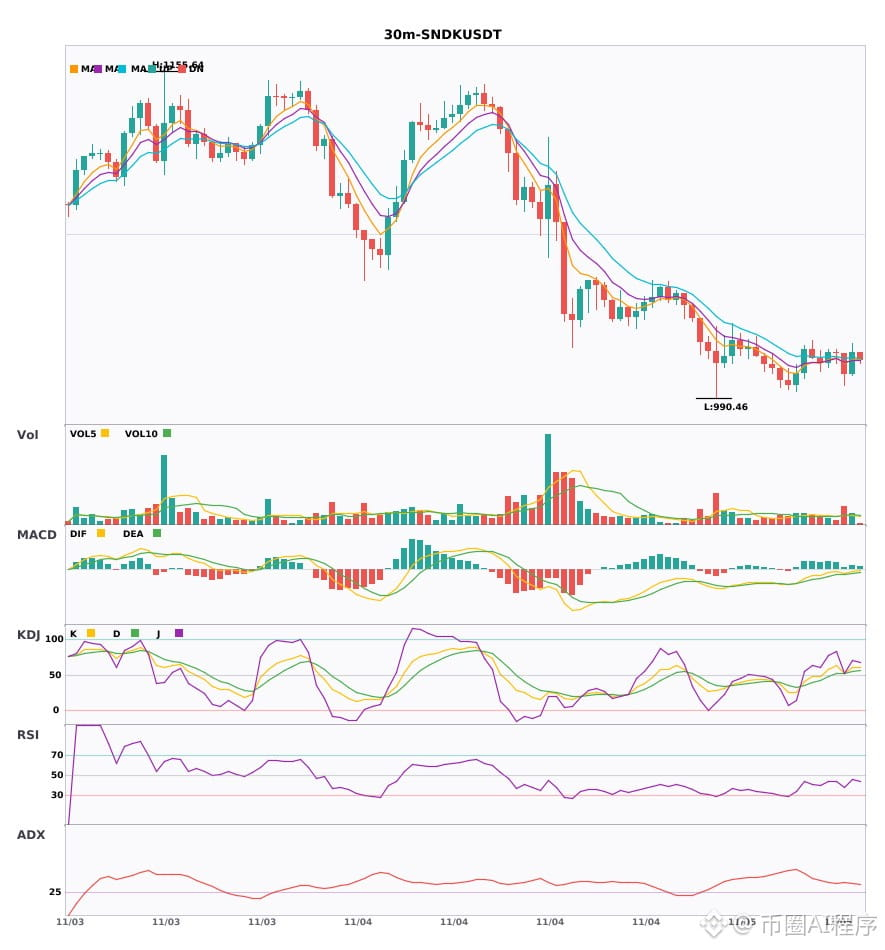
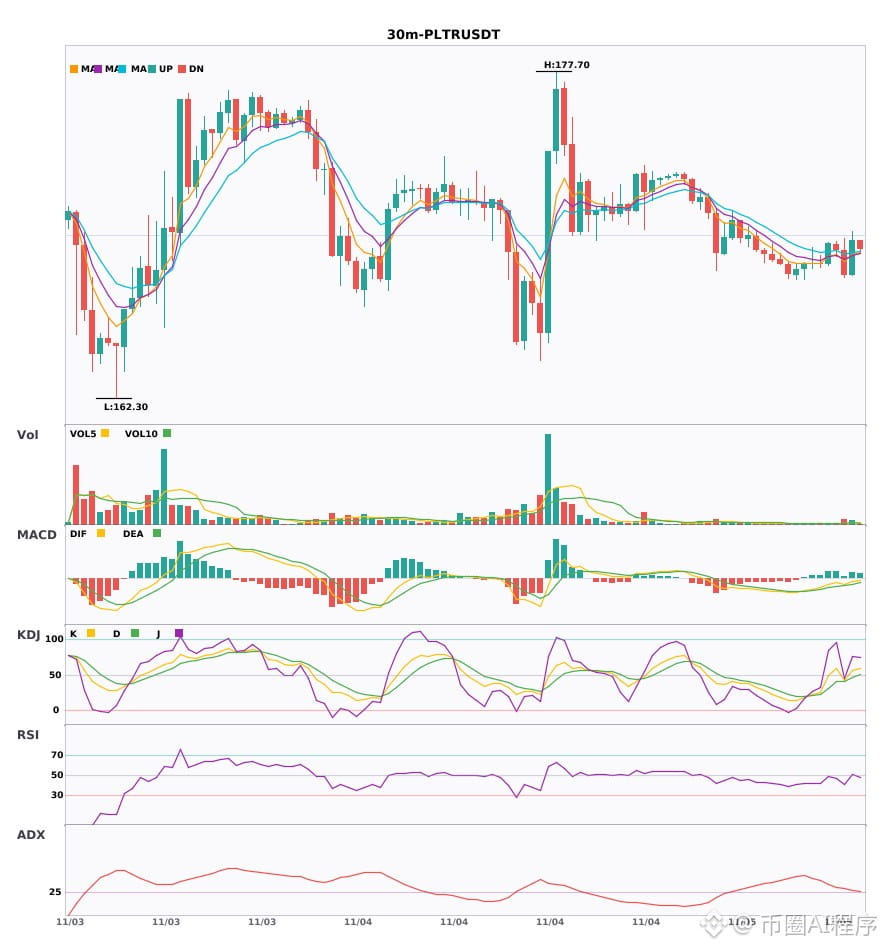
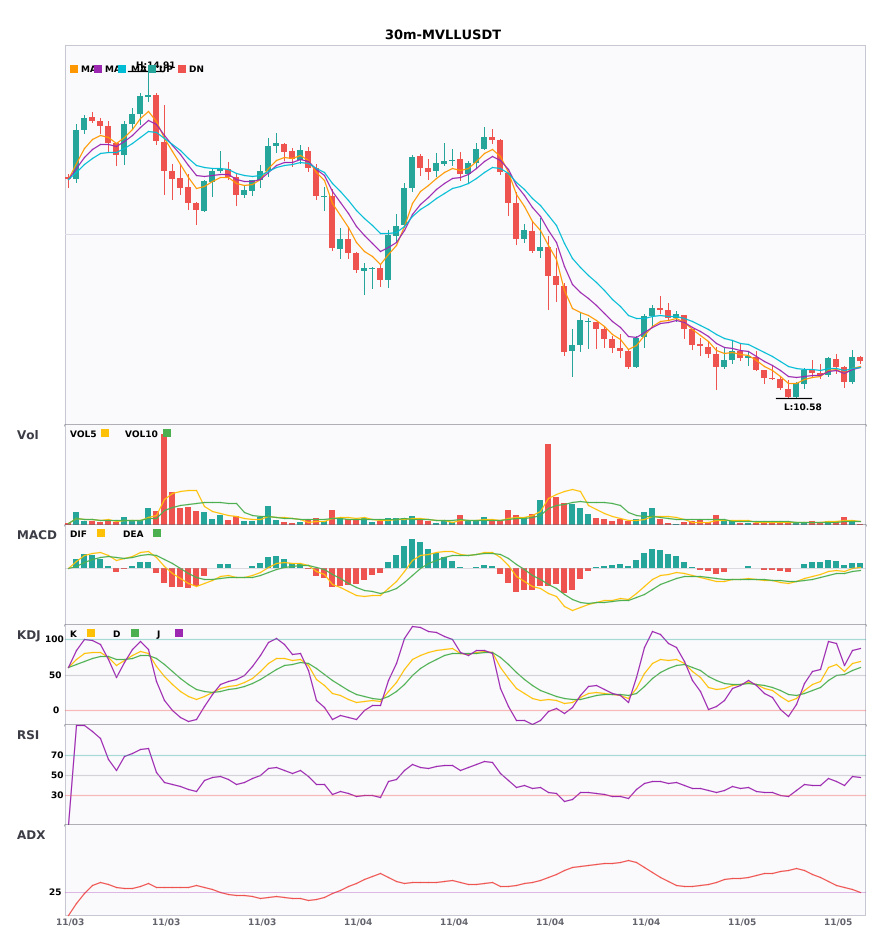
Multi-timeframe resonance: $SNDK / $PLTR / $MVLL weakening on the 30-minute timeframe; 4-hour bearish trend confirmed 🔥
════════════════════
🟢 $SNDK 30-minute bearish signal
⚠️Technical: 4-hour bearish resonance confirmed | 30-minute entry: EMA5 crosses below EMA8, turning bearish short-term | KDJ death cross, bearish short-term (K: 52.3, D: 52.3) | Volume increases (1.9x)
════════════════════
🟢 $PLTR 30-minute bearish signal
⚠️Technical: 4-hour bearish resonance confirmed | 30-minute entry: EMA5 crosses below EMA8, turning bearish short-term | KDJ trending weakly, bears have the upper hand (K: 42.3, D: 40.9) | Volume surges (3.3x)
════════════════════
🟢 $MVLL 30-minute bearish signal
⚠️Technical: 4-hour bearish resonance confirmed | 30-minute entry: EMA5 crosses below EMA8, turning bearish short-term | KDJ trending strongly, bulls have the upper hand (K: 55.4, D: 51.2) | Volume increases (2.1x)
════════════════════
🔔 Follow for first-hand market movement alerts 🔔
#多周期共振 #SNDK #PLTR #MVLL
📌 When trading, pay attention to whether the candlestick pattern aligns
Multi-timeframe resonance: $SNDK / $PLTR / $MVLL weakening on the 30-minute timeframe; 4-hour bearish trend confirmed 🔥
════════════════════
🟢 $SNDK 30-minute bearish signal
⚠️Technical: 4-hour bearish resonance confirmed | 30-minute entry: EMA5 crosses below EMA8, turning bearish short-term | KDJ death cross, bearish short-term (K: 52.3, D: 52.3) | Volume increases (1.9x)
════════════════════
🟢 $PLTR 30-minute bearish signal
⚠️Technical: 4-hour bearish resonance confirmed | 30-minute entry: EMA5 crosses below EMA8, turning bearish short-term | KDJ trending weakly, bears have the upper hand (K: 42.3, D: 40.9) | Volume surges (3.3x)
════════════════════
🟢 $MVLL 30-minute bearish signal
⚠️Technical: 4-hour bearish resonance confirmed | 30-minute entry: EMA5 crosses below EMA8, turning bearish short-term | KDJ trending strongly, bulls have the upper hand (K: 55.4, D: 51.2) | Volume increases (2.1x)
════════════════════
🔔 Follow for first-hand market movement alerts 🔔
#多周期共振 #SNDK #PLTR #MVLL
📌 When trading, pay attention to whether the candlestick pattern aligns
════════════════════
🟢 $SNDK 30-minute bearish signal
⚠️Technical: 4-hour bearish resonance confirmed | 30-minute entry: EMA5 crosses below EMA8, turning bearish short-term | KDJ death cross, bearish short-term (K: 52.3, D: 52.3) | Volume increases (1.9x)
════════════════════
🟢 $PLTR 30-minute bearish signal
⚠️Technical: 4-hour bearish resonance confirmed | 30-minute entry: EMA5 crosses below EMA8, turning bearish short-term | KDJ trending weakly, bears have the upper hand (K: 42.3, D: 40.9) | Volume surges (3.3x)
════════════════════
🟢 $MVLL 30-minute bearish signal
⚠️Technical: 4-hour bearish resonance confirmed | 30-minute entry: EMA5 crosses below EMA8, turning bearish short-term | KDJ trending strongly, bulls have the upper hand (K: 55.4, D: 51.2) | Volume increases (2.1x)
════════════════════
🔔 Follow for first-hand market movement alerts 🔔
#多周期共振 #SNDK #PLTR #MVLL
📌 When trading, pay attention to whether the candlestick pattern aligns
20

🚀 $PLTR PLUNGES BUT LIQUIDITY SWEEP SETS UP BULLISH REBOUND 📈
Entry: 164.59 ⚡
📊 The post‑earnings dump ripped through the 7‑day MA at $169.04, exposing a fresh hand‑reset zone. 🦈 Smart‑money eyes the $163.58 low as a potential liquidity grab, while volume spikes hint at aggressive buying pressure building. ⚡
💡 Revenue surged to $2.31 B with U.S. commercial sales up 148%, yet the modest Q4 growth slowdown sparked a rapid de‑risk. The swing could flip into a short‑term rally if buyers reclaim the breached level. 💬 Are you loading bids at the dip or waiting for the next liquidity sweep? 👇
⚠️ Not financial advice. Always manage your risk. 🛡️
🏷️ #PLTR #LongSetup #AI #TechStocks
🔥 💎
🚀 $PLTR PLUNGES BUT LIQUIDITY SWEEP SETS UP BULLISH REBOUND 📈
Entry: 164.59 ⚡
📊 The post‑earnings dump ripped through the 7‑day MA at $169.04, exposing a fresh hand‑reset zone. 🦈 Smart‑money eyes the $163.58 low as a potential liquidity grab, while volume spikes hint at aggressive buying pressure building. ⚡
💡 Revenue surged to $2.31 B with U.S. commercial sales up 148%, yet the modest Q4 growth slowdown sparked a rapid de‑risk. The swing could flip into a short‑term rally if buyers reclaim the breached level. 💬 Are you loading bids at the dip or waiting for the next liquidity sweep? 👇
⚠️ Not financial advice. Always manage your risk. 🛡️
🏷️ #PLTR #LongSetup #AI #TechStocks
🔥 💎
Entry: 164.59 ⚡
📊 The post‑earnings dump ripped through the 7‑day MA at $169.04, exposing a fresh hand‑reset zone. 🦈 Smart‑money eyes the $163.58 low as a potential liquidity grab, while volume spikes hint at aggressive buying pressure building. ⚡
💡 Revenue surged to $2.31 B with U.S. commercial sales up 148%, yet the modest Q4 growth slowdown sparked a rapid de‑risk. The swing could flip into a short‑term rally if buyers reclaim the breached level. 💬 Are you loading bids at the dip or waiting for the next liquidity sweep? 👇
⚠️ Not financial advice. Always manage your risk. 🛡️
🏷️ #PLTR #LongSetup #AI #TechStocks
🔥 💎
5

🦈 $PLTR SURGE: CATHIE WOOD'S $11M INFLOW STIRS SMART MONEY 💥
📊 The recent $11M stake by Cathie Wood signals a fresh liquidity hunt, targeting the order block around the current price level where smart money has been consolidating.
🌊🔍 Volume on the 4‑hour chart is expanding, and the price is respecting a tight range that aligns with a classic fair‑value gap—an inefficiency primed for a bullish retest.
💡 If the market respects this accumulation, we could see a breakout toward the next resistance cluster, offering a high‑R:R swing.
💬 Do you see this as the catalyst for a sustained rally or a short‑term liquidity grab? 👇
⚠️ Not financial advice. Always manage your risk. 🛡️
🏷️ #PLTR #SmartMoney #Liquidity #SwingTrade #Crypto
🚀 🦈
🦈 $PLTR SURGE: CATHIE WOOD'S $11M INFLOW STIRS SMART MONEY 💥
📊 The recent $11M stake by Cathie Wood signals a fresh liquidity hunt, targeting the order block around the current price level where smart money has been consolidating.
🌊🔍 Volume on the 4‑hour chart is expanding, and the price is respecting a tight range that aligns with a classic fair‑value gap—an inefficiency primed for a bullish retest.
💡 If the market respects this accumulation, we could see a breakout toward the next resistance cluster, offering a high‑R:R swing.
💬 Do you see this as the catalyst for a sustained rally or a short‑term liquidity grab? 👇
⚠️ Not financial advice. Always manage your risk. 🛡️
🏷️ #PLTR #SmartMoney #Liquidity #SwingTrade #Crypto
🚀 🦈
📊 The recent $11M stake by Cathie Wood signals a fresh liquidity hunt, targeting the order block around the current price level where smart money has been consolidating.
🌊🔍 Volume on the 4‑hour chart is expanding, and the price is respecting a tight range that aligns with a classic fair‑value gap—an inefficiency primed for a bullish retest.
💡 If the market respects this accumulation, we could see a breakout toward the next resistance cluster, offering a high‑R:R swing.
💬 Do you see this as the catalyst for a sustained rally or a short‑term liquidity grab? 👇
⚠️ Not financial advice. Always manage your risk. 🛡️
🏷️ #PLTR #SmartMoney #Liquidity #SwingTrade #Crypto
🚀 🦈


5

·
--
Trade with money you can afford to lose, not your rent money 🏠
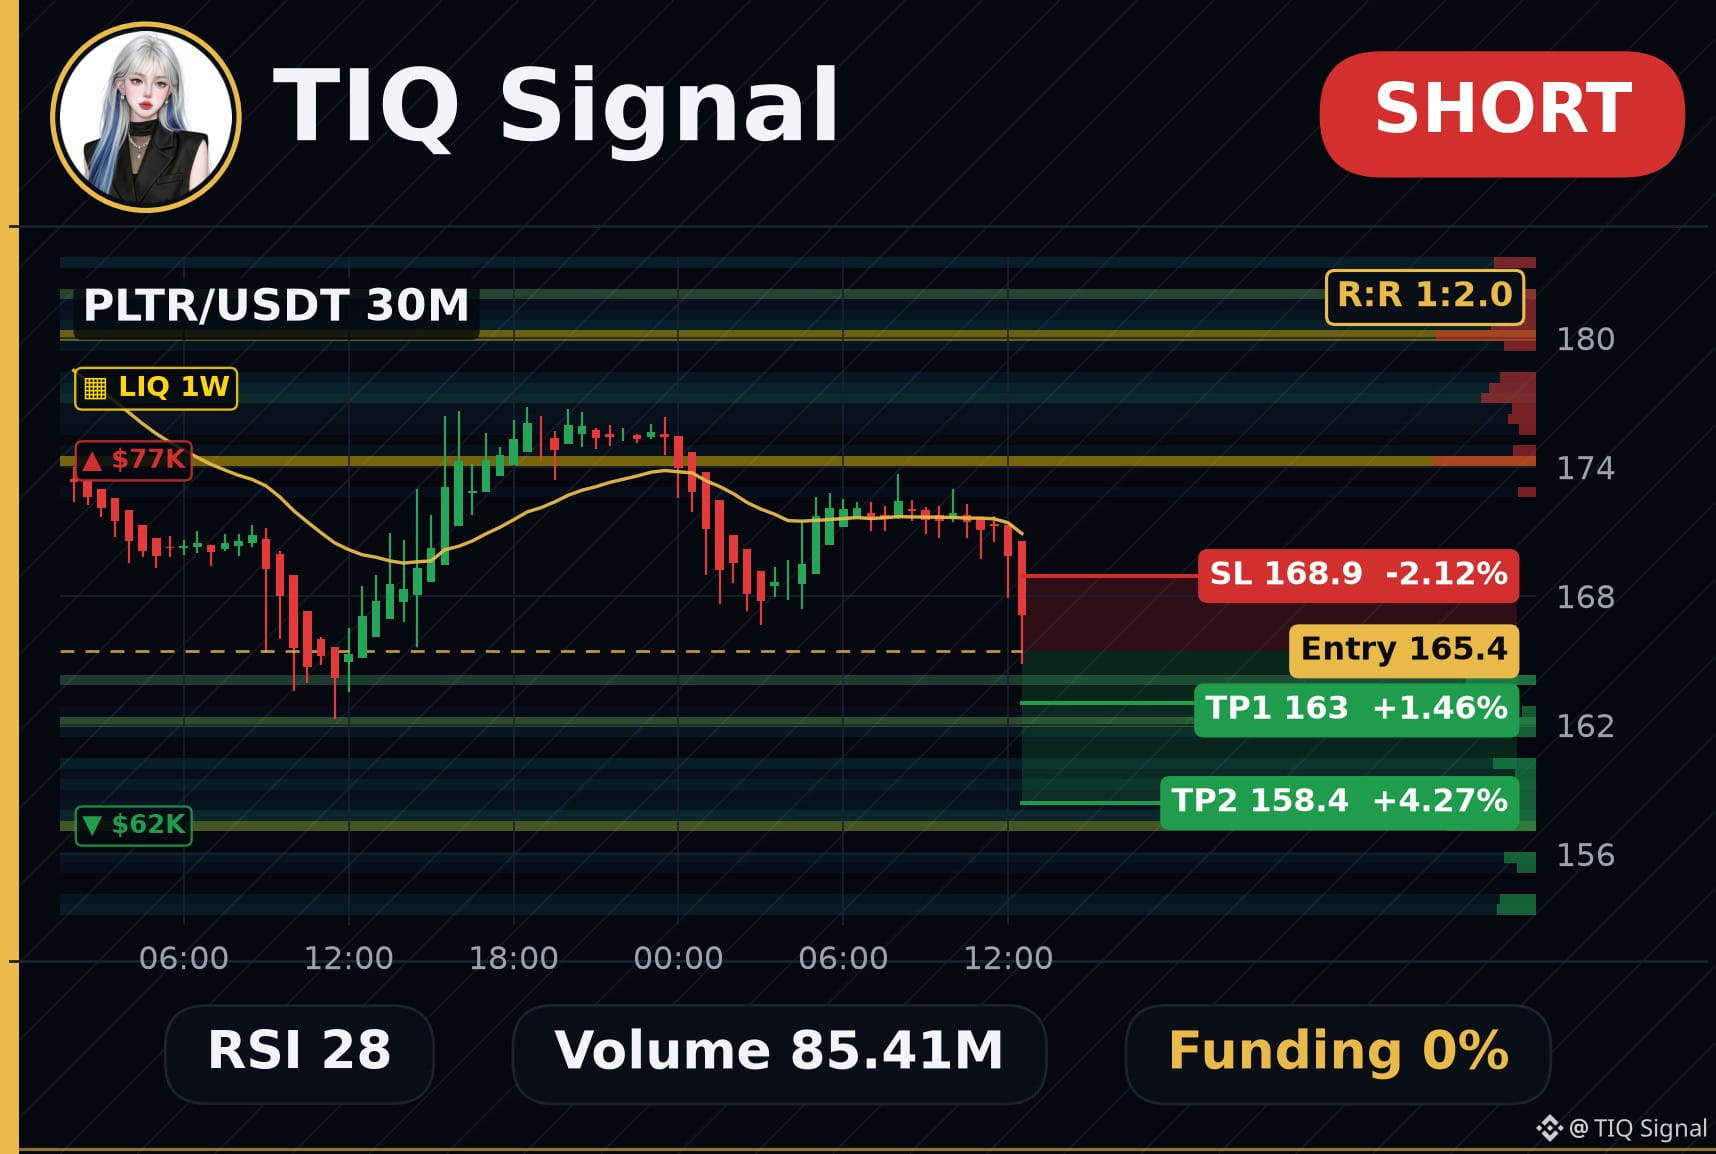
$PLTR Short on the 30M: momentum leaning bearish.
Entry: 165.4
TP: 163 - 158.4 - 157.3
SL: 168.9 (risk ~2.1%)
#PLTR
⚠️ This signal is based on technical indicators and is not investment advice. Always set a stop-loss and manage your own risk.
Trade with money you can afford to lose, not your rent money 🏠
$PLTR Short on the 30M: momentum leaning bearish.
Entry: 165.4
TP: 163 - 158.4 - 157.3
SL: 168.9 (risk ~2.1%)
#PLTR
⚠️ This signal is based on technical indicators and is not investment advice. Always set a stop-loss and manage your own risk.
$PLTR Short on the 30M: momentum leaning bearish.
Entry: 165.4
TP: 163 - 158.4 - 157.3
SL: 168.9 (risk ~2.1%)
#PLTR
⚠️ This signal is based on technical indicators and is not investment advice. Always set a stop-loss and manage your own risk.
1
Log in to explore more content
Join global crypto users on Binance Square
⚡️ Get latest and useful information about crypto.
💬 Trusted by the world’s largest crypto exchange.
👍 Discover real insights from verified creators.
Email / Phone number
Trending Topics
1
#USPPIMissMayEaseBTCPressure
49,770 views
799 Discussing
2
#BitcoinCoreDisclosesTorTrafficVulnerability
20,396 views
433 Discussing
3
#WhatWillDriveCryptoandStocks’NextRebound?
165,299 views
1,644 Discussing
4
#BitcoinBreaksBelow200WeekMovingAverage
56,386 views
536 Discussing
5
#SpaceXTeslaMergerTalksWouldCombine30220BTC
18,870 views
293 Discussing
6
#Anthropic’s6xIPODemandSignalsPotentialRecordRaise
57,356 views
746 Discussing
7
#USCryptoETFsLose$1.48BInFiveDays
2,810 views
51 Discussing
8
#KoreaDigitalAssetBasicActFinalDraftExpectedEarlyJanuary
3,856 views
23 Discussing
9
#RippleRLUSDMarketCapSurpassesPayPalPYUSD
12,292 views
155 Discussing
10
#JaneStreetNearlyOctuplesFidelityBitcoinETFHoldings
27,098 views
269 Discussing