
#mstu
mstu
3,759 views
47 Discussing
Hot
Latest

·
--
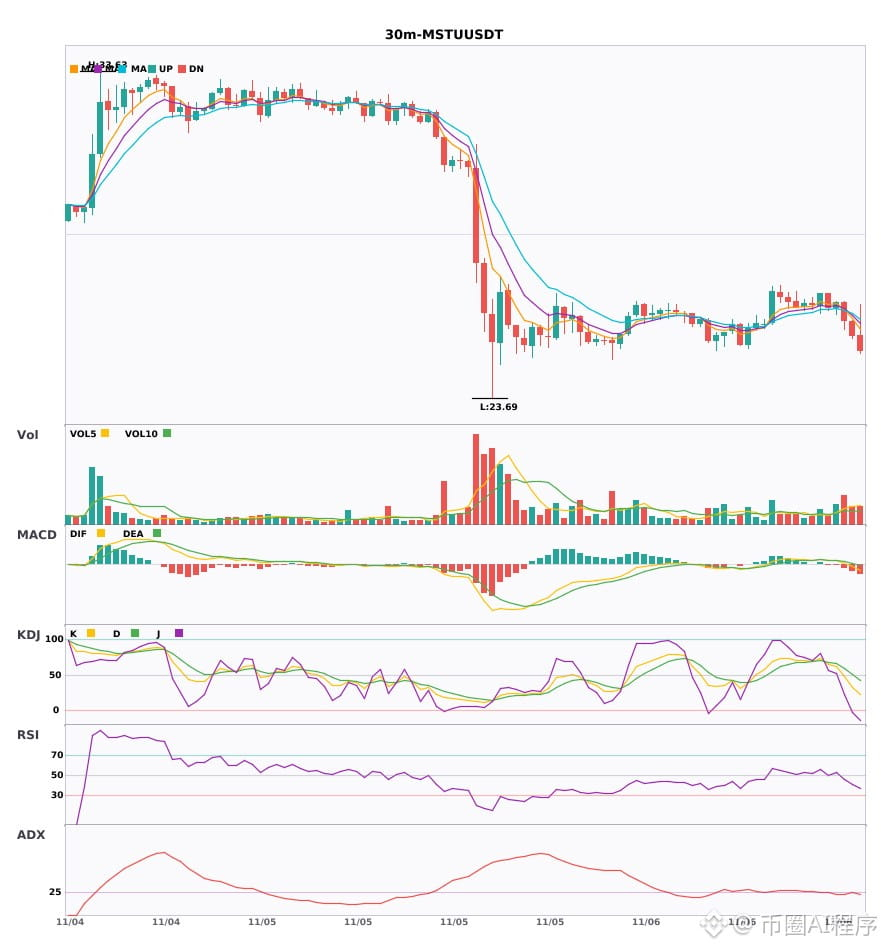
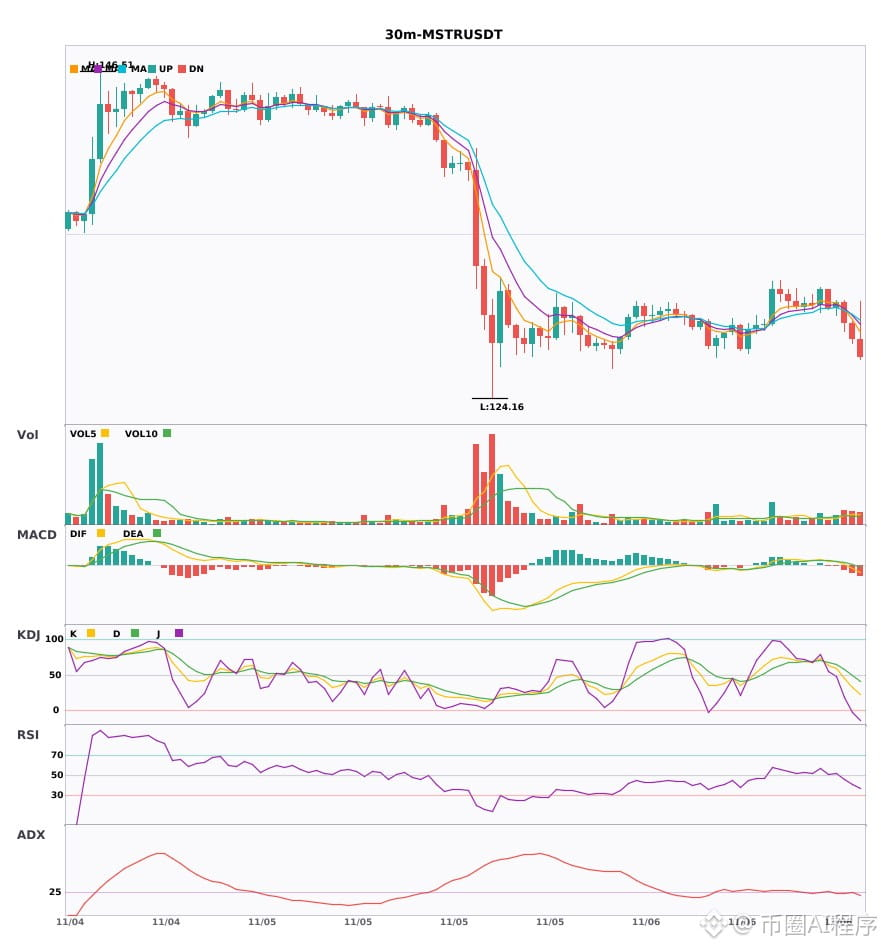
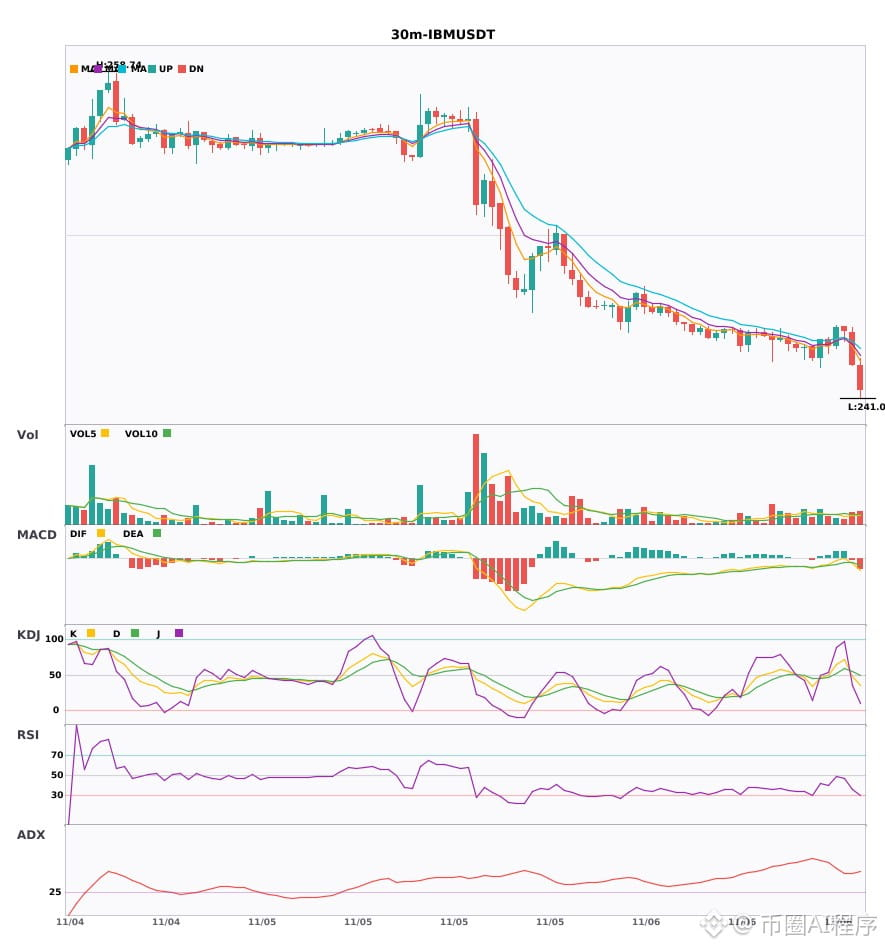
$MSTU / $MSTR / $IBM 30-minute bearish + 4-hour bearish alignment, multi-timeframe confluence turns bearish 🔥
════════════════════
🟢 $MSTU 30-minute bearish signal
⚠️Technical analysis: 4-hour bearish confluence confirmed | 30-minute entry: MACDDIF breaks below the zero line, trend turns bearish | EMA5 < EMA8 < EMA13, bearish alignment | Increased volume (2.0x)
════════════════════
🟢 $MSTR 30-minute bearish signal
⚠️Technical analysis: 4-hour bearish confluence confirmed | 30-minute entry: MACDDIF breaks below the zero line, trend turns bearish | EMA5 < EMA8 < EMA13, bearish alignment | KDJ showing weakness, bears in control (K: 32.1, D: 49.5) | Increased volume (1.6x)
════════════════════
🟢 $IBM 30-minute bearish signal
⚠️Technical analysis: 4-hour bearish confluence confirmed | 30-minute entry: MACD death cross below zero, bearish momentum accelerating | EMA5 crosses below EMA8, short-term outlook turns bearish | KDJ death cross, short-term bearish outlook (K: 48.5, D: 55.3) | Normal volume (1.2x)
📢Market update: Binance Will Support the International Business Machines Corporation (IBM), Apple Inc. (AAPL), Corning Incorporated (GLW), and Eli Lilly and Company (LLY) Cash Dividend Distribution via bStocks
════════════════════
🔔 Follow to get real-time market alerts 🔔
#多周期共振 #MSTU #MSTR #IBM
📌 When trading, check whether the candlestick pattern confirms
$MSTU / $MSTR / $IBM 30-minute bearish + 4-hour bearish alignment, multi-timeframe confluence turns bearish 🔥
════════════════════
🟢 $MSTU 30-minute bearish signal
⚠️Technical analysis: 4-hour bearish confluence confirmed | 30-minute entry: MACDDIF breaks below the zero line, trend turns bearish | EMA5 < EMA8 < EMA13, bearish alignment | Increased volume (2.0x)
════════════════════
🟢 $MSTR 30-minute bearish signal
⚠️Technical analysis: 4-hour bearish confluence confirmed | 30-minute entry: MACDDIF breaks below the zero line, trend turns bearish | EMA5 < EMA8 < EMA13, bearish alignment | KDJ showing weakness, bears in control (K: 32.1, D: 49.5) | Increased volume (1.6x)
════════════════════
🟢 $IBM 30-minute bearish signal
⚠️Technical analysis: 4-hour bearish confluence confirmed | 30-minute entry: MACD death cross below zero, bearish momentum accelerating | EMA5 crosses below EMA8, short-term outlook turns bearish | KDJ death cross, short-term bearish outlook (K: 48.5, D: 55.3) | Normal volume (1.2x)
📢Market update: Binance Will Support the International Business Machines Corporation (IBM), Apple Inc. (AAPL), Corning Incorporated (GLW), and Eli Lilly and Company (LLY) Cash Dividend Distribution via bStocks
════════════════════
🔔 Follow to get real-time market alerts 🔔
#多周期共振 #MSTU #MSTR #IBM
📌 When trading, check whether the candlestick pattern confirms
════════════════════
🟢 $MSTU 30-minute bearish signal
⚠️Technical analysis: 4-hour bearish confluence confirmed | 30-minute entry: MACDDIF breaks below the zero line, trend turns bearish | EMA5 < EMA8 < EMA13, bearish alignment | Increased volume (2.0x)
════════════════════
🟢 $MSTR 30-minute bearish signal
⚠️Technical analysis: 4-hour bearish confluence confirmed | 30-minute entry: MACDDIF breaks below the zero line, trend turns bearish | EMA5 < EMA8 < EMA13, bearish alignment | KDJ showing weakness, bears in control (K: 32.1, D: 49.5) | Increased volume (1.6x)
════════════════════
🟢 $IBM 30-minute bearish signal
⚠️Technical analysis: 4-hour bearish confluence confirmed | 30-minute entry: MACD death cross below zero, bearish momentum accelerating | EMA5 crosses below EMA8, short-term outlook turns bearish | KDJ death cross, short-term bearish outlook (K: 48.5, D: 55.3) | Normal volume (1.2x)
📢Market update: Binance Will Support the International Business Machines Corporation (IBM), Apple Inc. (AAPL), Corning Incorporated (GLW), and Eli Lilly and Company (LLY) Cash Dividend Distribution via bStocks
════════════════════
🔔 Follow to get real-time market alerts 🔔
#多周期共振 #MSTU #MSTR #IBM
📌 When trading, check whether the candlestick pattern confirms
7

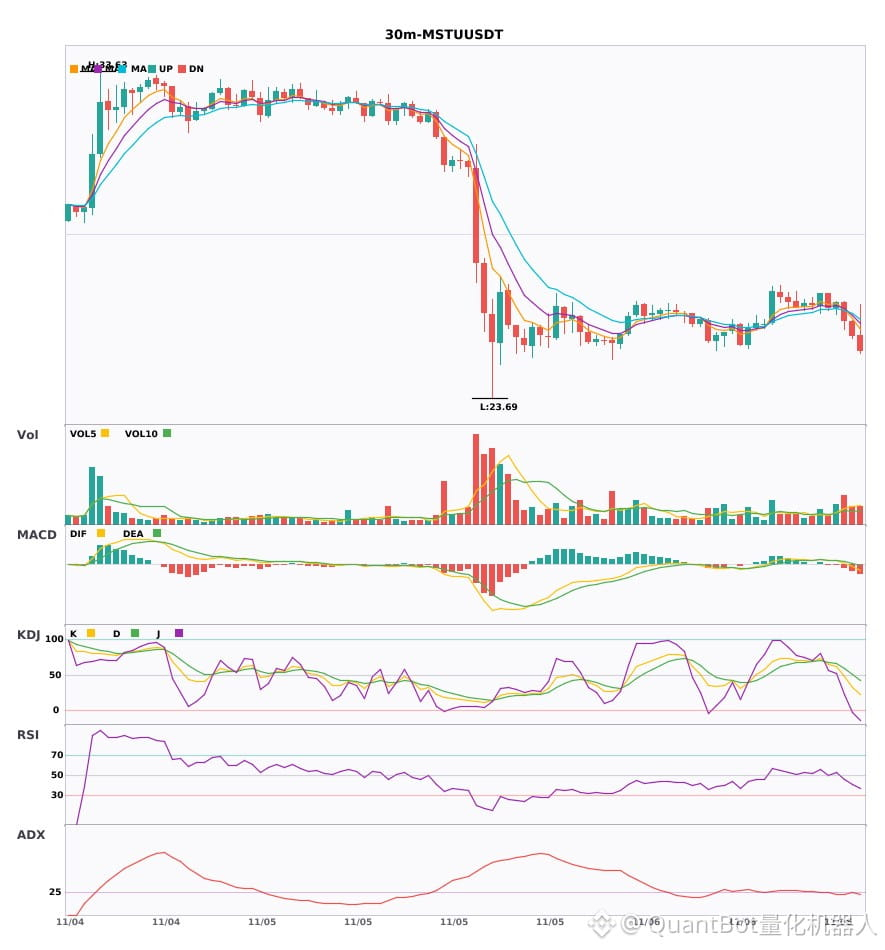
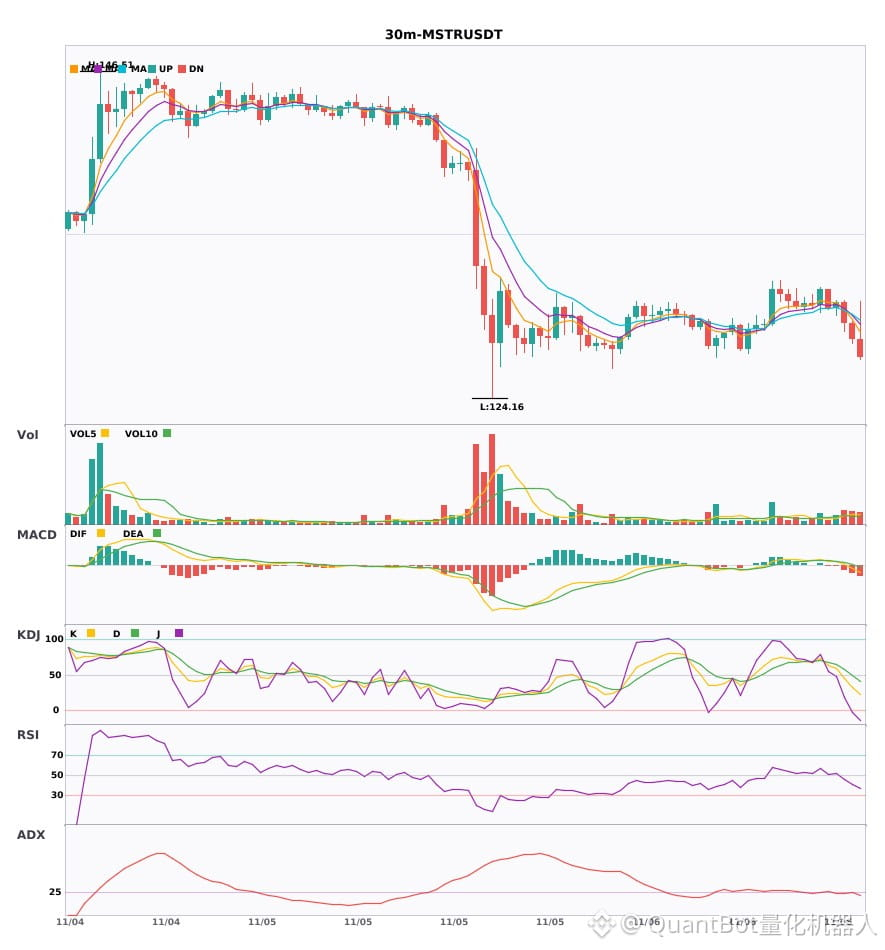
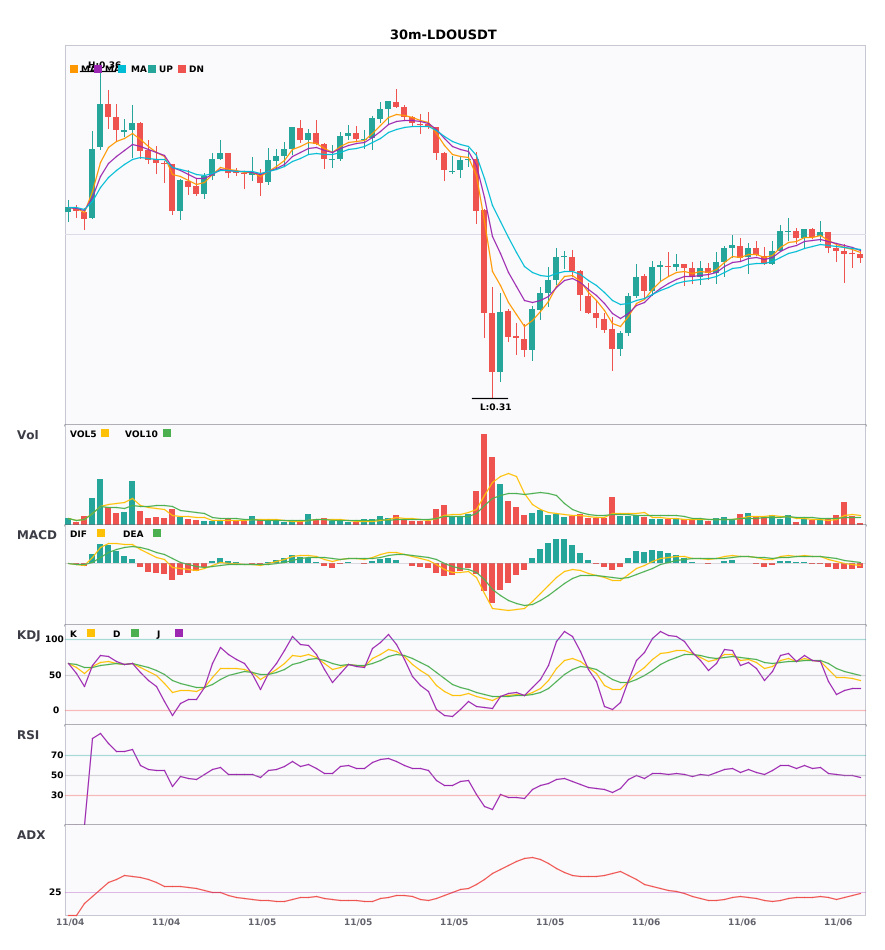
$MSTU / $MSTR / $LDO 30-minute bearish outlook, short-term pressure
📉 $MSTU | 30-minute bearish signal
━━━━━━━━━━━━━━━━━━
Technical analysis: ADX(28) Trend is forming; potential entry | MACDDIF has fallen below the zero line, signaling a bearish trend | EMA5 < EMA8 < EMA13, bearish alignment | Volume increased (2.0x)
Price change: -1.8400%
📉 $MSTR | 30-minute bearish signal
━━━━━━━━━━━━━━━━━━
Technical analysis: ADX(27) Trend is forming; potential entry | MACDDIF has fallen below the zero line, signaling a bearish trend | EMA5 < EMA8 < EMA13, bearish alignment | KDJ is weak, with bears in control (K: 32.1, D: 49.5) | Volume increased (1.6x)
Price change: -0.8500%
📉 $LDO | 30-minute bearish signal
━━━━━━━━━━━━━━━━━━
Technical analysis: ADX(25) Trend is forming; potential entry | MACDDIF has fallen below the zero line, signaling a bearish trend | Moving averages are converging as the market gathers momentum; a direction is likely to emerge soon | Volume surged (2.8x)
Price change: -0.0300%
━━━━━━━━━━━━━━━━━━
#技术分析 #MSTU #MSTR #LDO
📌 The above is for reference only and does not constitute investment advice
$MSTU / $MSTR / $LDO 30-minute bearish outlook, short-term pressure
📉 $MSTU | 30-minute bearish signal
━━━━━━━━━━━━━━━━━━
Technical analysis: ADX(28) Trend is forming; potential entry | MACDDIF has fallen below the zero line, signaling a bearish trend | EMA5 < EMA8 < EMA13, bearish alignment | Volume increased (2.0x)
Price change: -1.8400%
📉 $MSTR | 30-minute bearish signal
━━━━━━━━━━━━━━━━━━
Technical analysis: ADX(27) Trend is forming; potential entry | MACDDIF has fallen below the zero line, signaling a bearish trend | EMA5 < EMA8 < EMA13, bearish alignment | KDJ is weak, with bears in control (K: 32.1, D: 49.5) | Volume increased (1.6x)
Price change: -0.8500%
📉 $LDO | 30-minute bearish signal
━━━━━━━━━━━━━━━━━━
Technical analysis: ADX(25) Trend is forming; potential entry | MACDDIF has fallen below the zero line, signaling a bearish trend | Moving averages are converging as the market gathers momentum; a direction is likely to emerge soon | Volume surged (2.8x)
Price change: -0.0300%
━━━━━━━━━━━━━━━━━━
#技术分析 #MSTU #MSTR #LDO
📌 The above is for reference only and does not constitute investment advice
📉 $MSTU | 30-minute bearish signal
━━━━━━━━━━━━━━━━━━
Technical analysis: ADX(28) Trend is forming; potential entry | MACDDIF has fallen below the zero line, signaling a bearish trend | EMA5 < EMA8 < EMA13, bearish alignment | Volume increased (2.0x)
Price change: -1.8400%
📉 $MSTR | 30-minute bearish signal
━━━━━━━━━━━━━━━━━━
Technical analysis: ADX(27) Trend is forming; potential entry | MACDDIF has fallen below the zero line, signaling a bearish trend | EMA5 < EMA8 < EMA13, bearish alignment | KDJ is weak, with bears in control (K: 32.1, D: 49.5) | Volume increased (1.6x)
Price change: -0.8500%
📉 $LDO | 30-minute bearish signal
━━━━━━━━━━━━━━━━━━
Technical analysis: ADX(25) Trend is forming; potential entry | MACDDIF has fallen below the zero line, signaling a bearish trend | Moving averages are converging as the market gathers momentum; a direction is likely to emerge soon | Volume surged (2.8x)
Price change: -0.0300%
━━━━━━━━━━━━━━━━━━
#技术分析 #MSTU #MSTR #LDO
📌 The above is for reference only and does not constitute investment advice
8

·
--
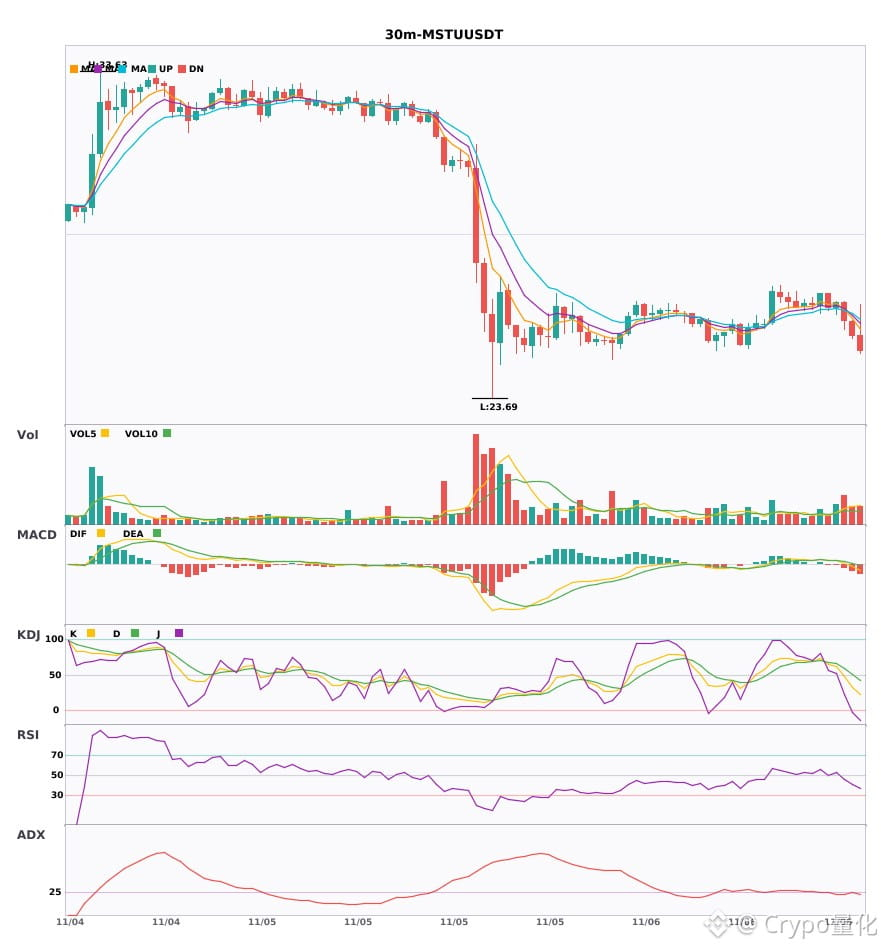
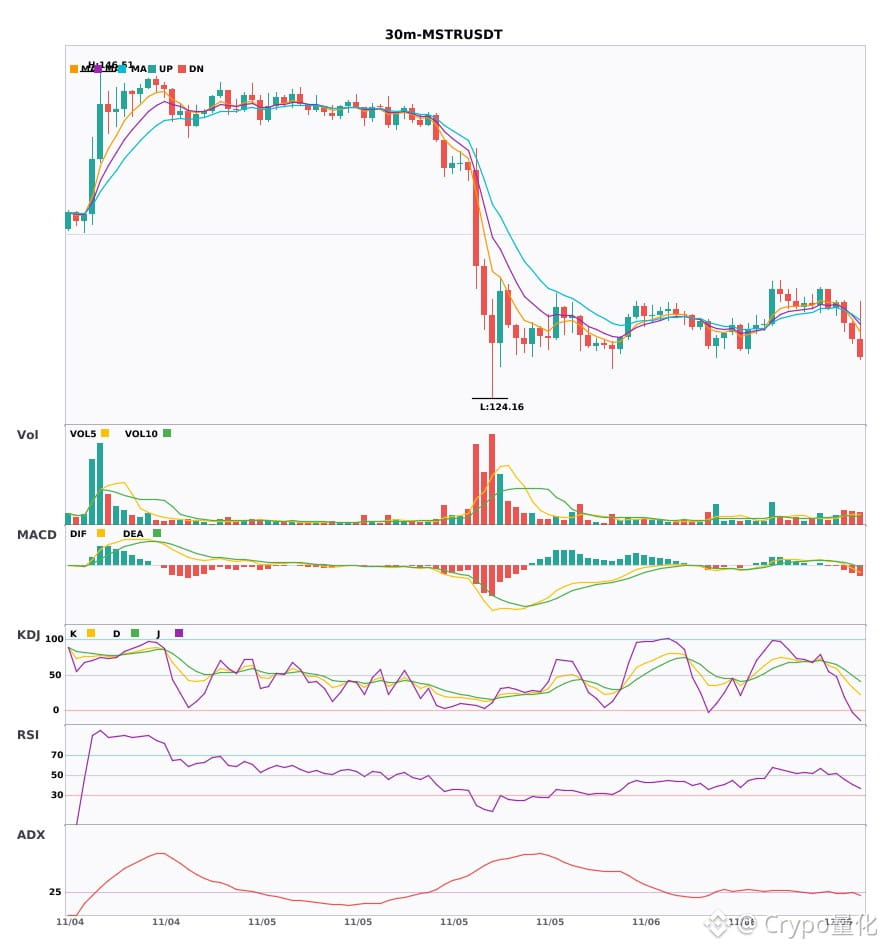
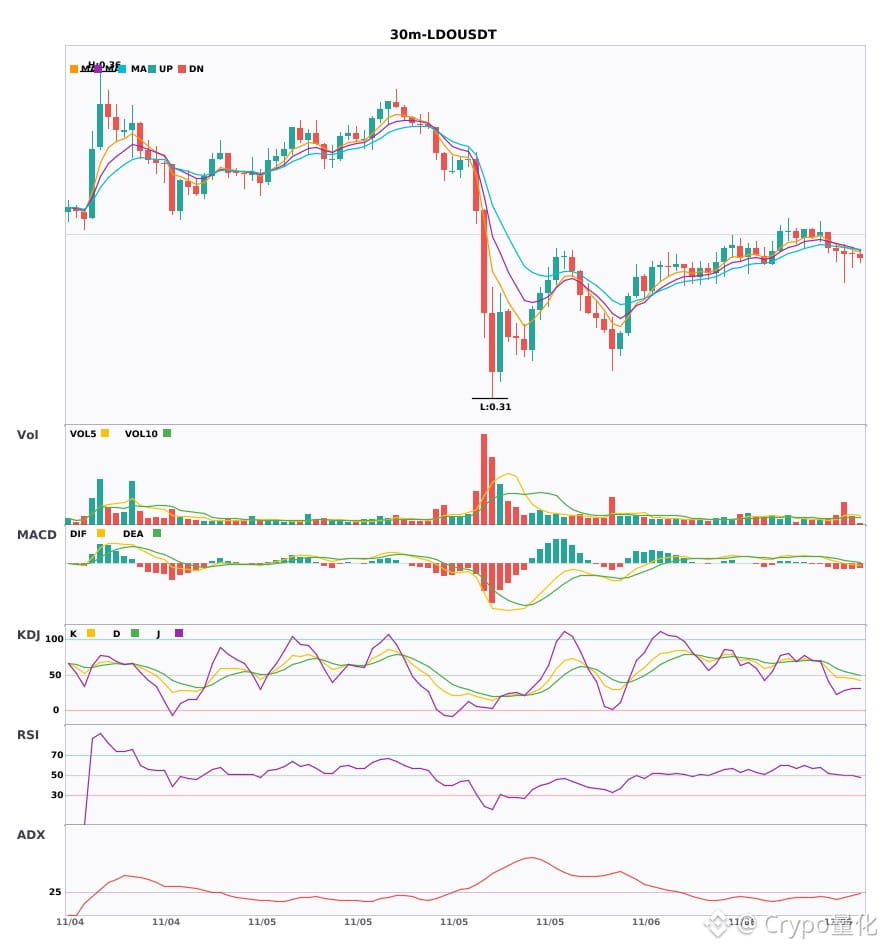
3 30-minute bearish alerts: $MSTU / $MSTR / $LDO🔥
════════════════════
🟢 $MSTU 30-minute bearish signal
⚠️Technical analysis: ADX(28) Trend is forming; opportunity to participate | MACD DIF fell below the zero line, trend turning bearish | EMA5 < EMA8 < EMA13, bearish alignment | Volume increased (2.0x)
════════════════════
🟢 $MSTR 30-minute bearish signal
⚠️Technical analysis: ADX(27) Trend is forming; opportunity to participate | MACD DIF fell below the zero line, trend turning bearish | EMA5 < EMA8 < EMA13, bearish alignment | KDJ is trending weakly, with bears in control (K: 32.1, D: 49.5) | Volume increased (1.6x)
════════════════════
🟢 $LDO 30-minute bearish signal
⚠️Technical analysis: ADX(25) Trend is forming; opportunity to participate | MACD DIF fell below the zero line, trend turning bearish | Moving averages are converging and building momentum, with a directional move imminent | Volume surged (2.8x)
════════════════════
🔔 Follow for first-hand market updates 🔔
#技术分析 #MSTU #MSTR #LDO
📌 When trading, pay attention to whether the candlestick pattern confirms the signal
3 30-minute bearish alerts: $MSTU / $MSTR / $LDO 🔥
════════════════════
🟢 $MSTU 30-minute bearish signal
⚠️Technical analysis: ADX(28) Trend is forming; opportunity to participate | MACD DIF fell below the zero line, trend turning bearish | EMA5 < EMA8 < EMA13, bearish alignment | Volume increased (2.0x)
════════════════════
🟢 $MSTR 30-minute bearish signal
⚠️Technical analysis: ADX(27) Trend is forming; opportunity to participate | MACD DIF fell below the zero line, trend turning bearish | EMA5 < EMA8 < EMA13, bearish alignment | KDJ is trending weakly, with bears in control (K: 32.1, D: 49.5) | Volume increased (1.6x)
════════════════════
🟢 $LDO 30-minute bearish signal
⚠️Technical analysis: ADX(25) Trend is forming; opportunity to participate | MACD DIF fell below the zero line, trend turning bearish | Moving averages are converging and building momentum, with a directional move imminent | Volume surged (2.8x)
════════════════════
🔔 Follow for first-hand market updates 🔔
#技术分析 #MSTU #MSTR #LDO
📌 When trading, pay attention to whether the candlestick pattern confirms the signal
════════════════════
🟢 $MSTU 30-minute bearish signal
⚠️Technical analysis: ADX(28) Trend is forming; opportunity to participate | MACD DIF fell below the zero line, trend turning bearish | EMA5 < EMA8 < EMA13, bearish alignment | Volume increased (2.0x)
════════════════════
🟢 $MSTR 30-minute bearish signal
⚠️Technical analysis: ADX(27) Trend is forming; opportunity to participate | MACD DIF fell below the zero line, trend turning bearish | EMA5 < EMA8 < EMA13, bearish alignment | KDJ is trending weakly, with bears in control (K: 32.1, D: 49.5) | Volume increased (1.6x)
════════════════════
🟢 $LDO 30-minute bearish signal
⚠️Technical analysis: ADX(25) Trend is forming; opportunity to participate | MACD DIF fell below the zero line, trend turning bearish | Moving averages are converging and building momentum, with a directional move imminent | Volume surged (2.8x)
════════════════════
🔔 Follow for first-hand market updates 🔔
#技术分析 #MSTU #MSTR #LDO
📌 When trading, pay attention to whether the candlestick pattern confirms the signal
9

·
--
With MSTU in this kind of position, experienced traders usually look for selling pressure to fade before talking about a recovery.
Binance TradFi Perpetuals (traditional financial assets; high gap risk outside trading hours) | MSTU is down 20.11% over the past 24 hours, and weakness persists. For a recovery, first watch whether selling pressure eases. Current price is around 25.98, with 24-hour trading volume of approximately 10.7952 million; the 30m volume ratio is only 0.4x, indicating weak participation. Market flow: 59% of accounts are long; the taker buy/sell ratio is 0.59 (sellers dominate); 30m open interest is down 0.3%; funding rate is +0.0391%.
Reference indicators: The 30m ATR trend-band reference level is 27.839353. The current price is below this level, suggesting the trend support level is coming under pressure. The 30m KDJ is 76.83/73.53/83.43, indicating short-term enthusiasm for chasing prices is elevated. The J value is high, so the key question going forward is whether the price can hold on a pullback.
The order book needs to provide two answers: Can the taker buy/sell ratio recover above 1, and can the current price reclaim the ATR trend-band reference level of 27.839353? Only if both hold does it look like a recovery; if only one does, the market remains in a weak, choppy state.
#MSTU #Unusual Movement Alert
With MSTU in this kind of position, experienced traders usually look for selling pressure to fade before talking about a recovery.
Binance TradFi Perpetuals (traditional financial assets; high gap risk outside trading hours) | MSTU is down 20.11% over the past 24 hours, and weakness persists. For a recovery, first watch whether selling pressure eases. Current price is around 25.98, with 24-hour trading volume of approximately 10.7952 million; the 30m volume ratio is only 0.4x, indicating weak participation. Market flow: 59% of accounts are long; the taker buy/sell ratio is 0.59 (sellers dominate); 30m open interest is down 0.3%; funding rate is +0.0391%.
Reference indicators: The 30m ATR trend-band reference level is 27.839353. The current price is below this level, suggesting the trend support level is coming under pressure. The 30m KDJ is 76.83/73.53/83.43, indicating short-term enthusiasm for chasing prices is elevated. The J value is high, so the key question going forward is whether the price can hold on a pullback.
The order book needs to provide two answers: Can the taker buy/sell ratio recover above 1, and can the current price reclaim the ATR trend-band reference level of 27.839353? Only if both hold does it look like a recovery; if only one does, the market remains in a weak, choppy state.
#MSTU #Unusual Movement Alert
Binance TradFi Perpetuals (traditional financial assets; high gap risk outside trading hours) | MSTU is down 20.11% over the past 24 hours, and weakness persists. For a recovery, first watch whether selling pressure eases. Current price is around 25.98, with 24-hour trading volume of approximately 10.7952 million; the 30m volume ratio is only 0.4x, indicating weak participation. Market flow: 59% of accounts are long; the taker buy/sell ratio is 0.59 (sellers dominate); 30m open interest is down 0.3%; funding rate is +0.0391%.
Reference indicators: The 30m ATR trend-band reference level is 27.839353. The current price is below this level, suggesting the trend support level is coming under pressure. The 30m KDJ is 76.83/73.53/83.43, indicating short-term enthusiasm for chasing prices is elevated. The J value is high, so the key question going forward is whether the price can hold on a pullback.
The order book needs to provide two answers: Can the taker buy/sell ratio recover above 1, and can the current price reclaim the ATR trend-band reference level of 27.839353? Only if both hold does it look like a recovery; if only one does, the market remains in a weak, choppy state.
#MSTU #Unusual Movement Alert
1

·
--
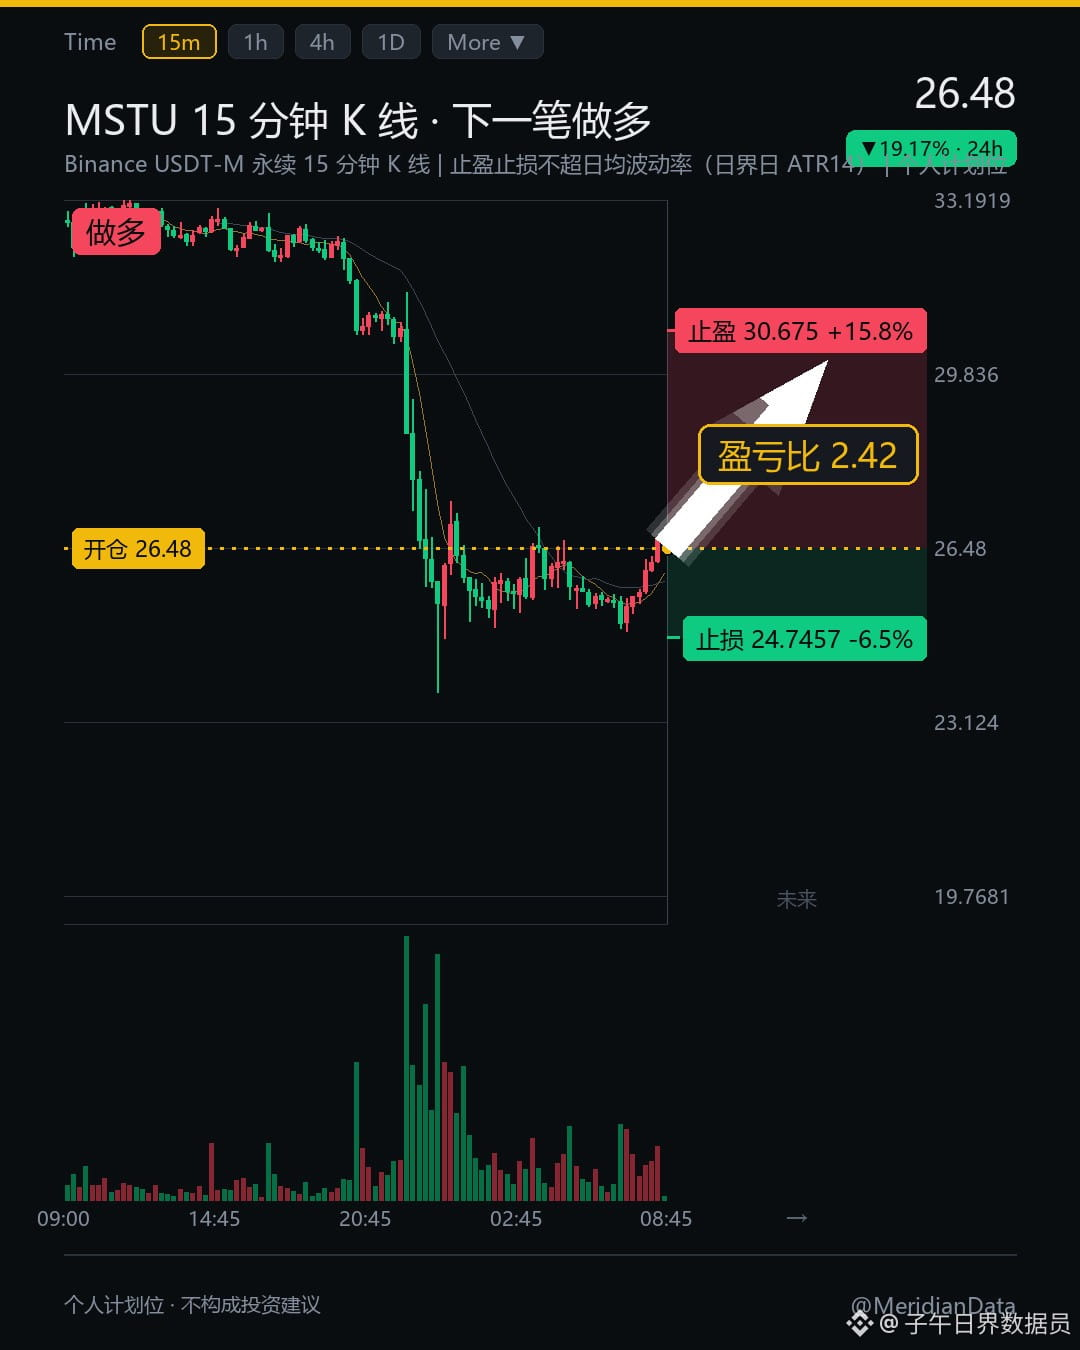
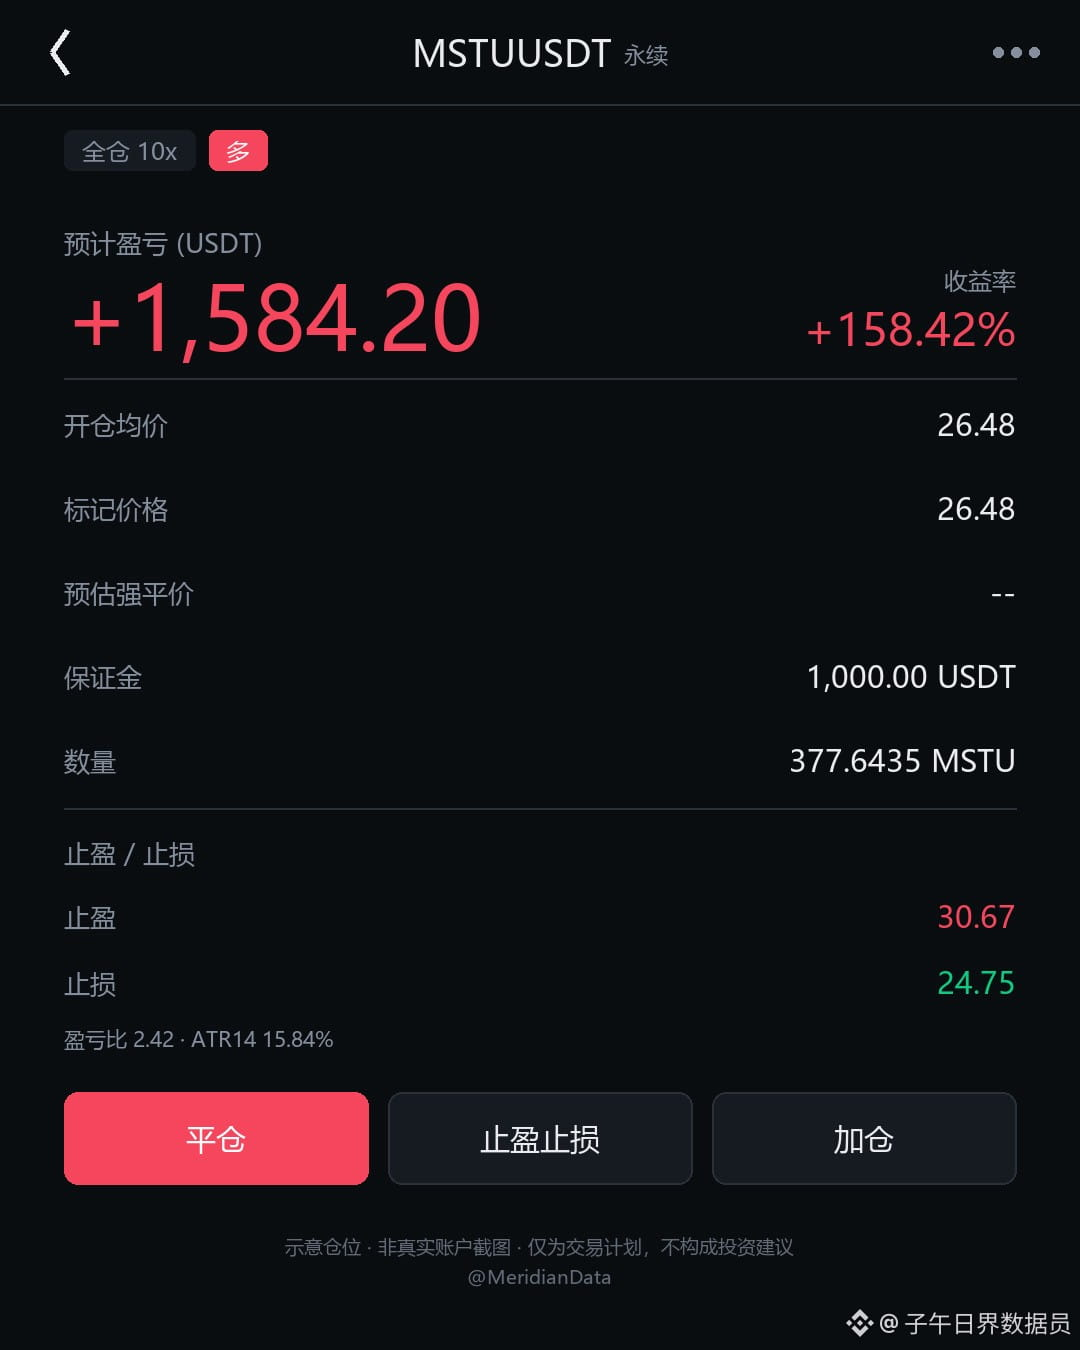
Everyone, I’m opening a large long position on $MSTU .
Take profit: 30.675
Stop loss: 24.7457
👇 Rationale below
{future}(MSTUUSDT)
You may be wondering the obvious question: Why am I going long at this level?
First, let’s clarify the position. The 20-day range is 23.69 to 39.12, and the current price of 26.48 is at the 18.1st percentile—just over 11 points above the lower bound and a long way from the upper bound. It has fallen 6.60% over the past seven days.
Based on the daily ATR14, daily average volatility is 15.84%. I’ve set the take-profit at that level, exactly 15.84% above the current price.
The stop-loss is at 24.7457, 6.55% below the current price, with an additional 0.5% buffer beyond the six-hour extreme. Both the take-profit and stop-loss are within the daily average volatility range. That’s my positioning discipline—I don’t widen the range just to make it look better.
The risk-reward ratio for this trade is 2.42.
The disagreement at this percentile is about positioning. At this level, liquidity is already thin: few are willing to buy, while many want to cash out.
The broader market is our point of reference. Over the same period, $BTC fell 5.441% and $ETH fell 7.406%. The whole market is deleveraging, and thinner markets collapse sooner.
MSTU is linked to a U.S. stock, so its moves are amplified when the underlying stock falls. It’s like the water level outside a dam dropping by one notch, while the pressure on the inside doubles.
I’m not watching to see how strong the rebound is; I’m watching to see whether leveraged positions have been fully cleared out.
If they haven’t, any bounce is just half a step up on the stairs—it won’t hold.
Honestly, I don’t hold products like this overnight. Clear positioning matters more than guessing the direction.
What do you think?
#MSTU #EVAA #cryptocurrency
The above is a record of my personal trading system and observations of market data, and does not constitute investment advice.
Everyone, I’m opening a large long position on $MSTU .
Take profit: 30.675
Stop loss: 24.7457
👇 Rationale below
You may be wondering the obvious question: Why am I going long at this level?
First, let’s clarify the position. The 20-day range is 23.69 to 39.12, and the current price of 26.48 is at the 18.1st percentile—just over 11 points above the lower bound and a long way from the upper bound. It has fallen 6.60% over the past seven days.
Based on the daily ATR14, daily average volatility is 15.84%. I’ve set the take-profit at that level, exactly 15.84% above the current price.
The stop-loss is at 24.7457, 6.55% below the current price, with an additional 0.5% buffer beyond the six-hour extreme. Both the take-profit and stop-loss are within the daily average volatility range. That’s my positioning discipline—I don’t widen the range just to make it look better.
The risk-reward ratio for this trade is 2.42.
The disagreement at this percentile is about positioning. At this level, liquidity is already thin: few are willing to buy, while many want to cash out.
The broader market is our point of reference. Over the same period, $BTC fell 5.441% and $ETH fell 7.406%. The whole market is deleveraging, and thinner markets collapse sooner.
MSTU is linked to a U.S. stock, so its moves are amplified when the underlying stock falls. It’s like the water level outside a dam dropping by one notch, while the pressure on the inside doubles.
I’m not watching to see how strong the rebound is; I’m watching to see whether leveraged positions have been fully cleared out.
If they haven’t, any bounce is just half a step up on the stairs—it won’t hold.
Honestly, I don’t hold products like this overnight. Clear positioning matters more than guessing the direction.
What do you think?
#MSTU #EVAA #cryptocurrency
The above is a record of my personal trading system and observations of market data, and does not constitute investment advice.
Take profit: 30.675
Stop loss: 24.7457
👇 Rationale below
You may be wondering the obvious question: Why am I going long at this level?
First, let’s clarify the position. The 20-day range is 23.69 to 39.12, and the current price of 26.48 is at the 18.1st percentile—just over 11 points above the lower bound and a long way from the upper bound. It has fallen 6.60% over the past seven days.
Based on the daily ATR14, daily average volatility is 15.84%. I’ve set the take-profit at that level, exactly 15.84% above the current price.
The stop-loss is at 24.7457, 6.55% below the current price, with an additional 0.5% buffer beyond the six-hour extreme. Both the take-profit and stop-loss are within the daily average volatility range. That’s my positioning discipline—I don’t widen the range just to make it look better.
The risk-reward ratio for this trade is 2.42.
The disagreement at this percentile is about positioning. At this level, liquidity is already thin: few are willing to buy, while many want to cash out.
The broader market is our point of reference. Over the same period, $BTC fell 5.441% and $ETH fell 7.406%. The whole market is deleveraging, and thinner markets collapse sooner.
MSTU is linked to a U.S. stock, so its moves are amplified when the underlying stock falls. It’s like the water level outside a dam dropping by one notch, while the pressure on the inside doubles.
I’m not watching to see how strong the rebound is; I’m watching to see whether leveraged positions have been fully cleared out.
If they haven’t, any bounce is just half a step up on the stairs—it won’t hold.
Honestly, I don’t hold products like this overnight. Clear positioning matters more than guessing the direction.
What do you think?
#MSTU #EVAA #cryptocurrency
The above is a record of my personal trading system and observations of market data, and does not constitute investment advice.
1
300
·
--
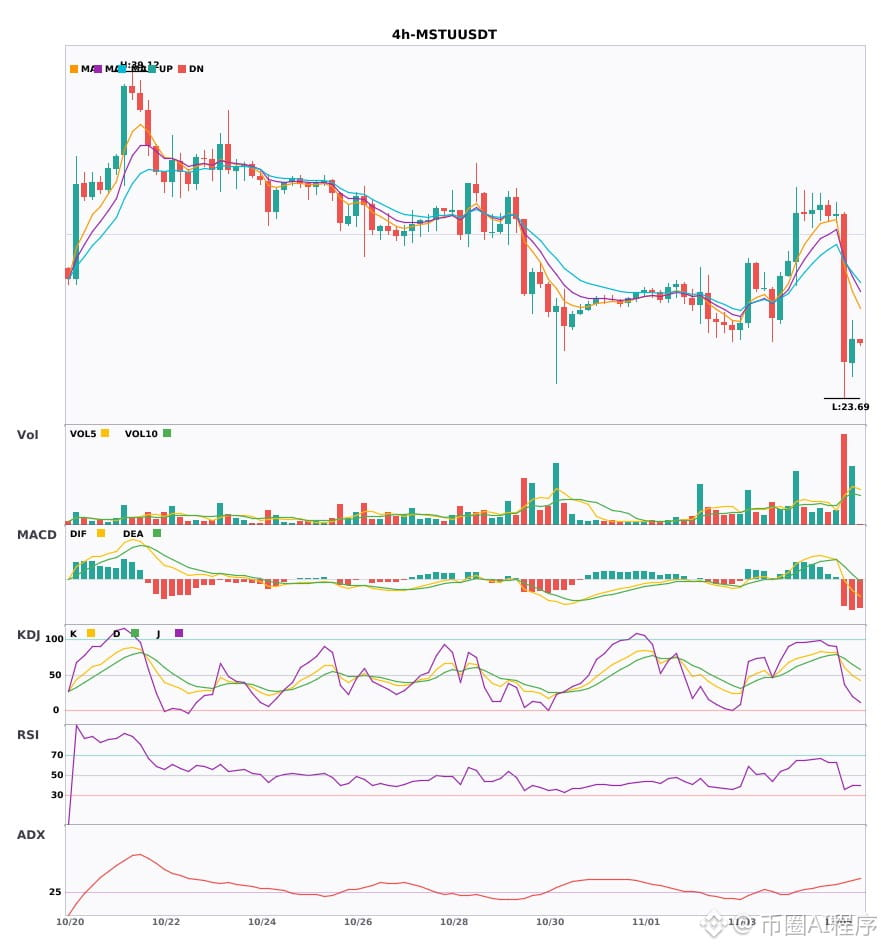
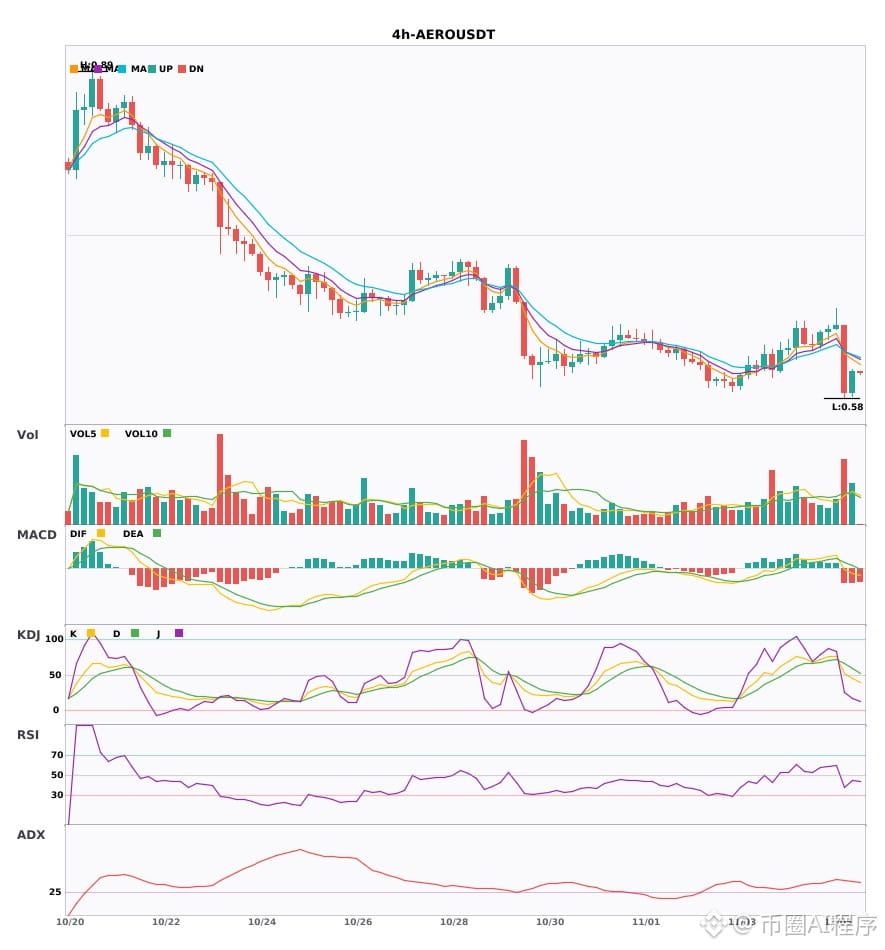
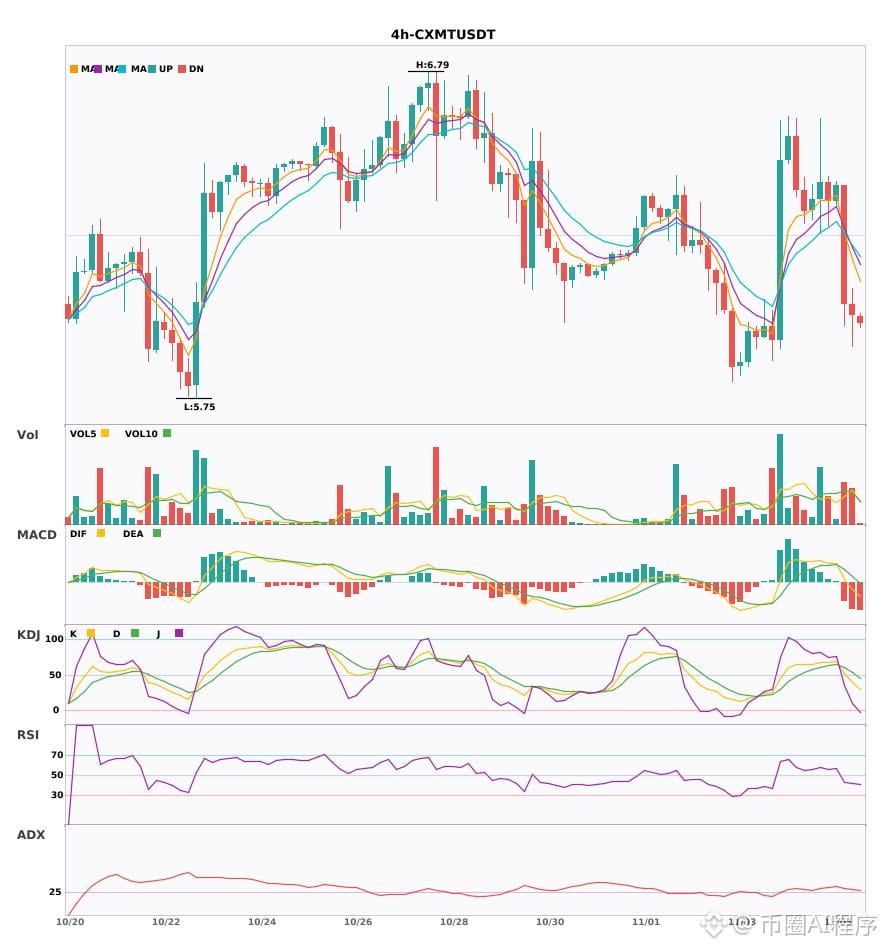
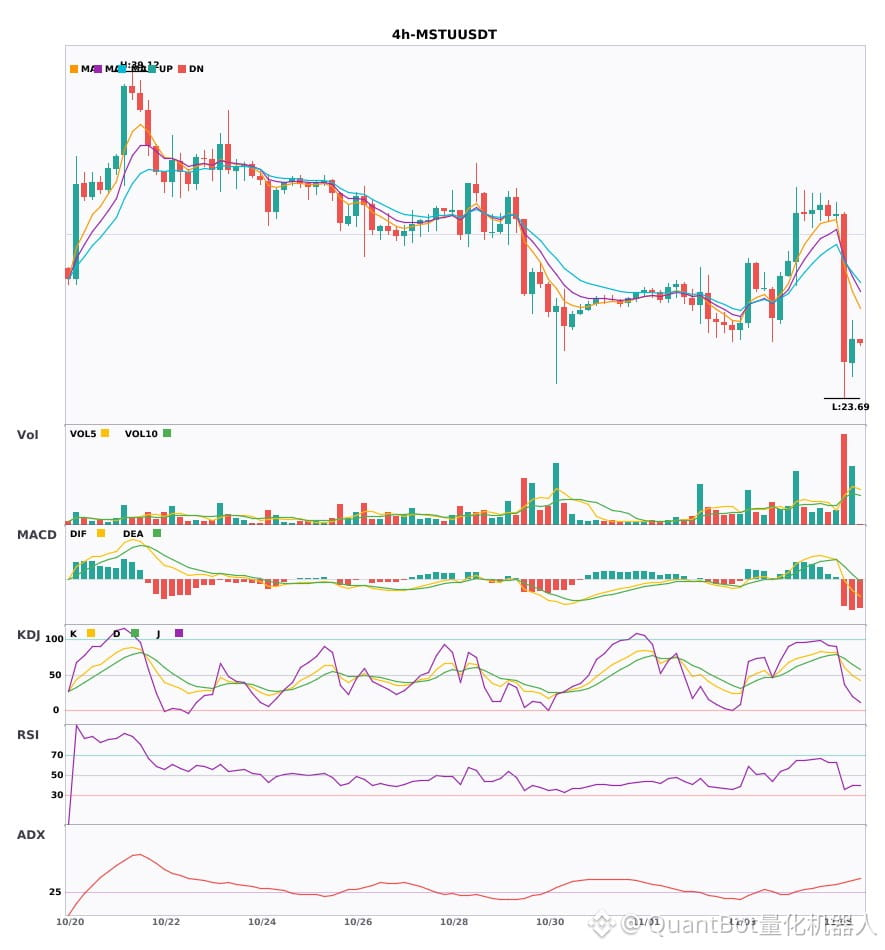
Multi-timeframe confluence: $MSTU / $AERO / $CXMT weakened on the 4-hour timeframe; the daily bearish trend is confirmed 🔥
════════════════════
🟢 $MSTU 4-hour bearish signal
⚠️ Technicals: Daily bearish confluence confirmed | 4-hour entry: MACD bearish, trend weak, momentum strengthening | EMA5 < EMA8 < EMA13, bearish alignment | Volume surge (3.3x)
════════════════════
🟢 $AERO 4-hour bearish signal
⚠️ Technicals: Daily bearish confluence confirmed | 4-hour entry: MACD bearish, trend weak, momentum strengthening | EMA5 < EMA8 < EMA13, bearish alignment | Volume increase (2.0x)
📢 Market update: Binance Will Support the Velodrome Finance (VELODROME) Token Merge to Aerodrome (AERO) and the AERO Contract Swap
════════════════════
🟢 $CXMT 4-hour bearish signal
⚠️ Technicals: Daily bearish confluence confirmed | 4-hour entry: MACD DIF fell below the zero line, trend turned bearish | EMA5 < EMA8 < EMA13, bearish alignment | Volume normal (1.2x)
════════════════════
🔔 Follow for real-time market updates 🔔
#多周期共振 #MSTU #AERO #CXMT
📌 When trading, pay attention to whether the candlestick patterns align
Multi-timeframe confluence: $MSTU / $AERO / $CXMT weakened on the 4-hour timeframe; the daily bearish trend is confirmed 🔥
════════════════════
🟢 $MSTU 4-hour bearish signal
⚠️ Technicals: Daily bearish confluence confirmed | 4-hour entry: MACD bearish, trend weak, momentum strengthening | EMA5 < EMA8 < EMA13, bearish alignment | Volume surge (3.3x)
════════════════════
🟢 $AERO 4-hour bearish signal
⚠️ Technicals: Daily bearish confluence confirmed | 4-hour entry: MACD bearish, trend weak, momentum strengthening | EMA5 < EMA8 < EMA13, bearish alignment | Volume increase (2.0x)
📢 Market update: Binance Will Support the Velodrome Finance (VELODROME) Token Merge to Aerodrome (AERO) and the AERO Contract Swap
════════════════════
🟢 $CXMT 4-hour bearish signal
⚠️ Technicals: Daily bearish confluence confirmed | 4-hour entry: MACD DIF fell below the zero line, trend turned bearish | EMA5 < EMA8 < EMA13, bearish alignment | Volume normal (1.2x)
════════════════════
🔔 Follow for real-time market updates 🔔
#多周期共振 #MSTU #AERO #CXMT
📌 When trading, pay attention to whether the candlestick patterns align
════════════════════
🟢 $MSTU 4-hour bearish signal
⚠️ Technicals: Daily bearish confluence confirmed | 4-hour entry: MACD bearish, trend weak, momentum strengthening | EMA5 < EMA8 < EMA13, bearish alignment | Volume surge (3.3x)
════════════════════
🟢 $AERO 4-hour bearish signal
⚠️ Technicals: Daily bearish confluence confirmed | 4-hour entry: MACD bearish, trend weak, momentum strengthening | EMA5 < EMA8 < EMA13, bearish alignment | Volume increase (2.0x)
📢 Market update: Binance Will Support the Velodrome Finance (VELODROME) Token Merge to Aerodrome (AERO) and the AERO Contract Swap
════════════════════
🟢 $CXMT 4-hour bearish signal
⚠️ Technicals: Daily bearish confluence confirmed | 4-hour entry: MACD DIF fell below the zero line, trend turned bearish | EMA5 < EMA8 < EMA13, bearish alignment | Volume normal (1.2x)
════════════════════
🔔 Follow for real-time market updates 🔔
#多周期共振 #MSTU #AERO #CXMT
📌 When trading, pay attention to whether the candlestick patterns align
12
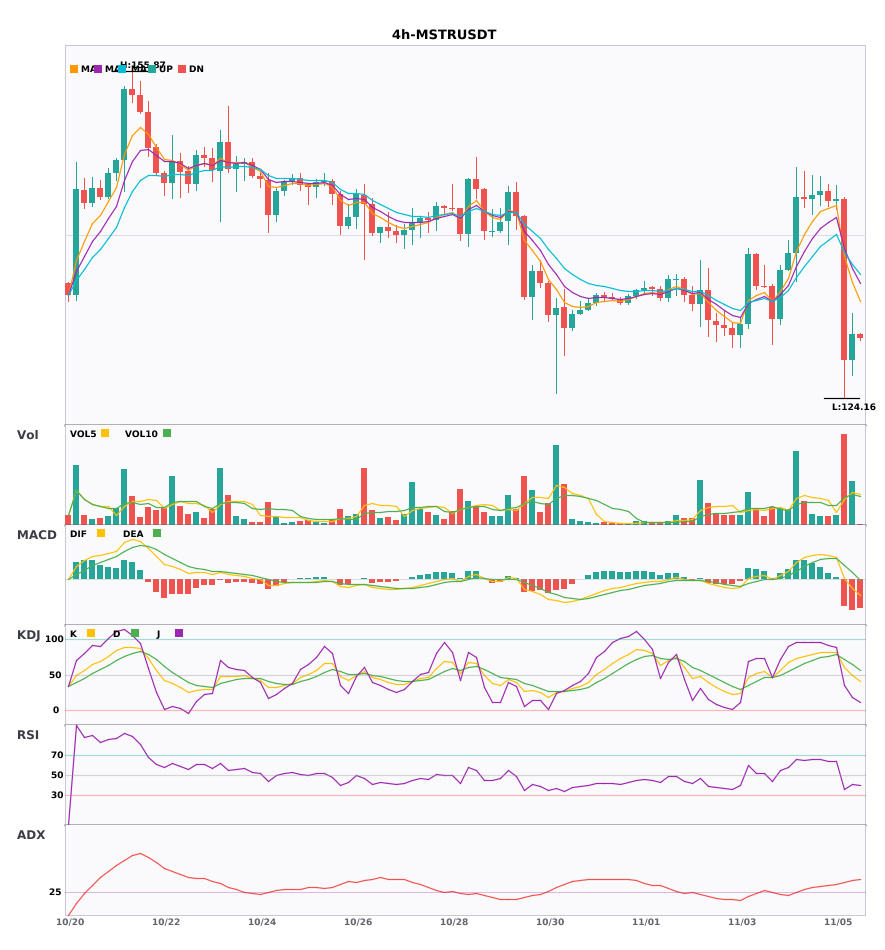
3 4-hour bearish alerts: $MSTU / $AERO / $MSTR
📉 $MSTU | 4-hour bearish signal
━━━━━━━━━━━━━━━━━━
Technical analysis: ADX(42) Strong trending market | MACD is bearish, trend is weak, momentum is strengthening | EMA5 < EMA8 < EMA13, bearish alignment | Volume surge (3.3x)
Price change: 4.2900%
📉 $AERO | 4-hour bearish signal
━━━━━━━━━━━━━━━━━━
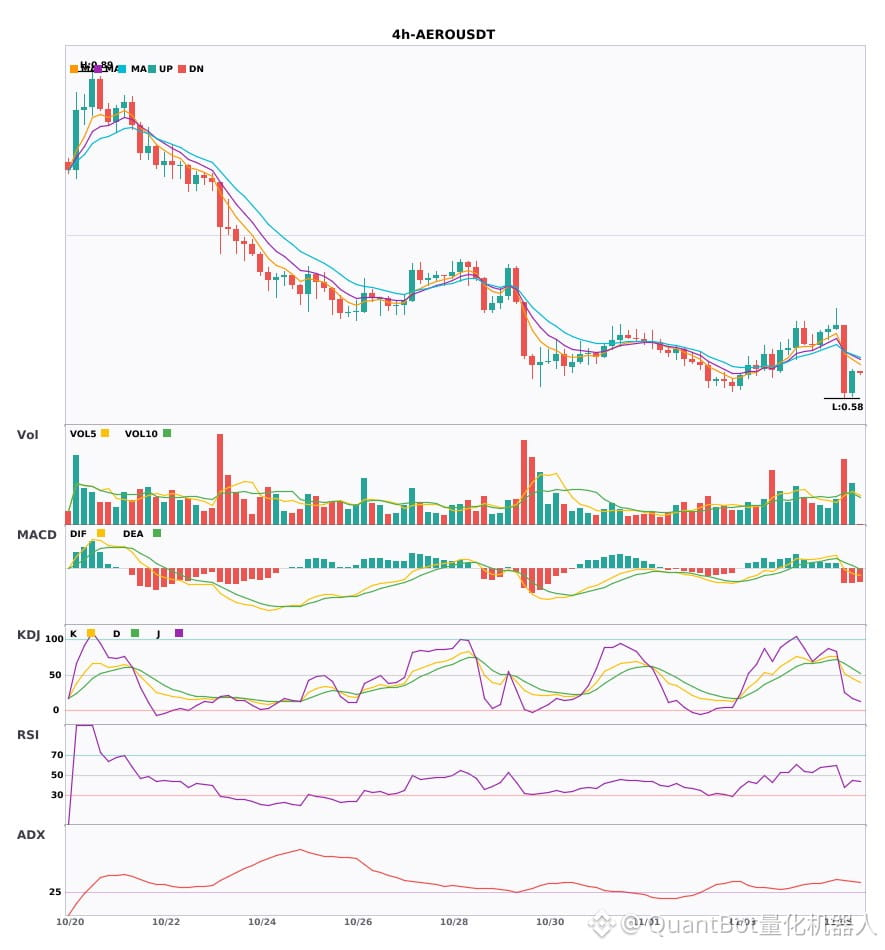
Technical analysis: ADX(42) Strong trending market | MACD is bearish, trend is weak, momentum is strengthening | EMA5 < EMA8 < EMA13, bearish alignment | Increased volume (2.0x)
Price change: 3.5900%
📌 Market update: Binance Will Support the Velodrome Finance (VELODROME) Token Merge to Aerodrome (AERO) and the AERO Contract Swap
📉 $MSTR | 4-hour bearish signal
━━━━━━━━━━━━━━━━━━
Technical analysis: ADX(41) Strong trending market | MACD DIF fell below the zero line, trend turned bearish | EMA5 < EMA8 < EMA13, bearish alignment | Volume surge (3.3x)
Price change: 1.9300%
━━━━━━━━━━━━━━━━━━
#技术分析 #MSTU #AERO #MSTR
📌 The above content is for reference only and does not constitute investment advice
3 4-hour bearish alerts: $MSTU / $AERO / $MSTR
📉 $MSTU | 4-hour bearish signal
━━━━━━━━━━━━━━━━━━
Technical analysis: ADX(42) Strong trending market | MACD is bearish, trend is weak, momentum is strengthening | EMA5 < EMA8 < EMA13, bearish alignment | Volume surge (3.3x)
Price change: 4.2900%
📉 $AERO | 4-hour bearish signal
━━━━━━━━━━━━━━━━━━
Technical analysis: ADX(42) Strong trending market | MACD is bearish, trend is weak, momentum is strengthening | EMA5 < EMA8 < EMA13, bearish alignment | Increased volume (2.0x)
Price change: 3.5900%
📌 Market update: Binance Will Support the Velodrome Finance (VELODROME) Token Merge to Aerodrome (AERO) and the AERO Contract Swap
📉 $MSTR | 4-hour bearish signal
━━━━━━━━━━━━━━━━━━
Technical analysis: ADX(41) Strong trending market | MACD DIF fell below the zero line, trend turned bearish | EMA5 < EMA8 < EMA13, bearish alignment | Volume surge (3.3x)
Price change: 1.9300%
━━━━━━━━━━━━━━━━━━
#技术分析 #MSTU #AERO #MSTR
📌 The above content is for reference only and does not constitute investment advice
📉 $MSTU | 4-hour bearish signal
━━━━━━━━━━━━━━━━━━
Technical analysis: ADX(42) Strong trending market | MACD is bearish, trend is weak, momentum is strengthening | EMA5 < EMA8 < EMA13, bearish alignment | Volume surge (3.3x)
Price change: 4.2900%
📉 $AERO | 4-hour bearish signal
━━━━━━━━━━━━━━━━━━
Technical analysis: ADX(42) Strong trending market | MACD is bearish, trend is weak, momentum is strengthening | EMA5 < EMA8 < EMA13, bearish alignment | Increased volume (2.0x)
Price change: 3.5900%
📌 Market update: Binance Will Support the Velodrome Finance (VELODROME) Token Merge to Aerodrome (AERO) and the AERO Contract Swap
📉 $MSTR | 4-hour bearish signal
━━━━━━━━━━━━━━━━━━
Technical analysis: ADX(41) Strong trending market | MACD DIF fell below the zero line, trend turned bearish | EMA5 < EMA8 < EMA13, bearish alignment | Volume surge (3.3x)
Price change: 1.9300%
━━━━━━━━━━━━━━━━━━
#技术分析 #MSTU #AERO #MSTR
📌 The above content is for reference only and does not constitute investment advice
7
·
--
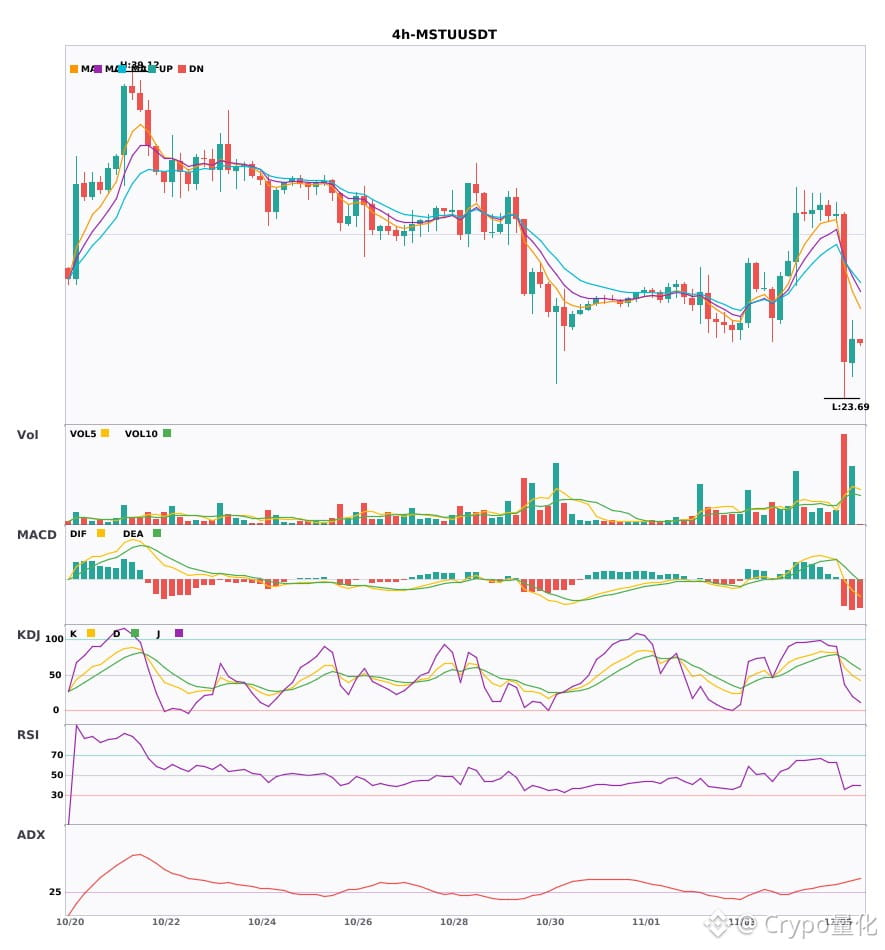
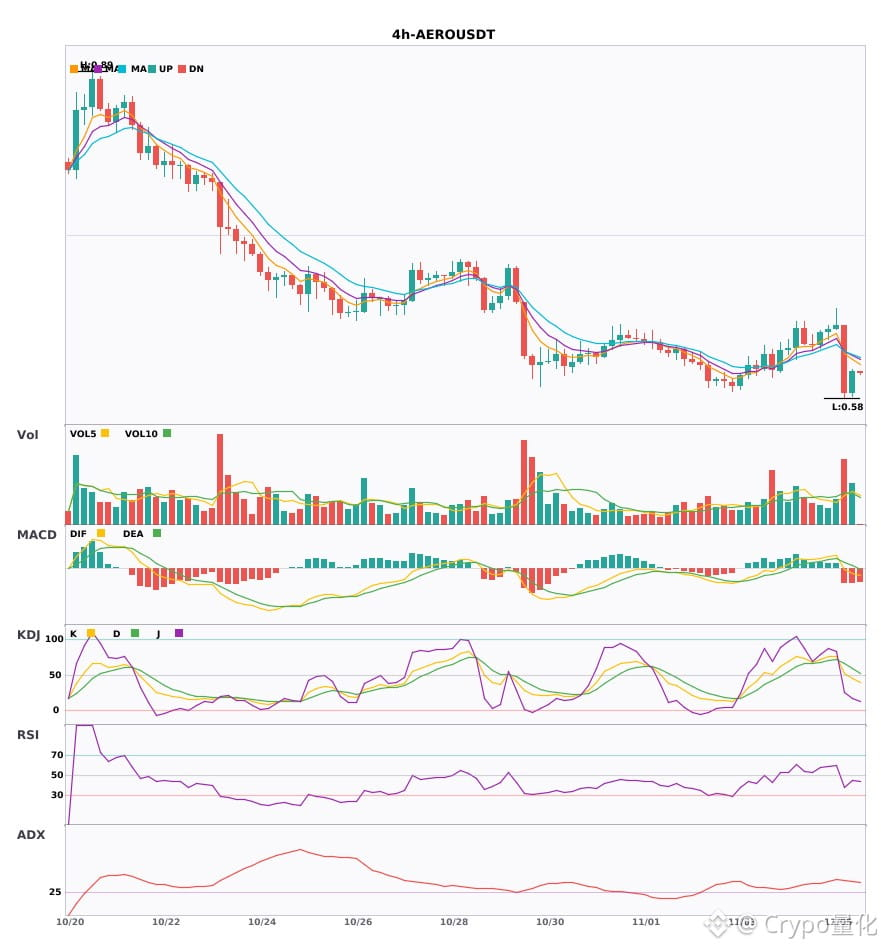
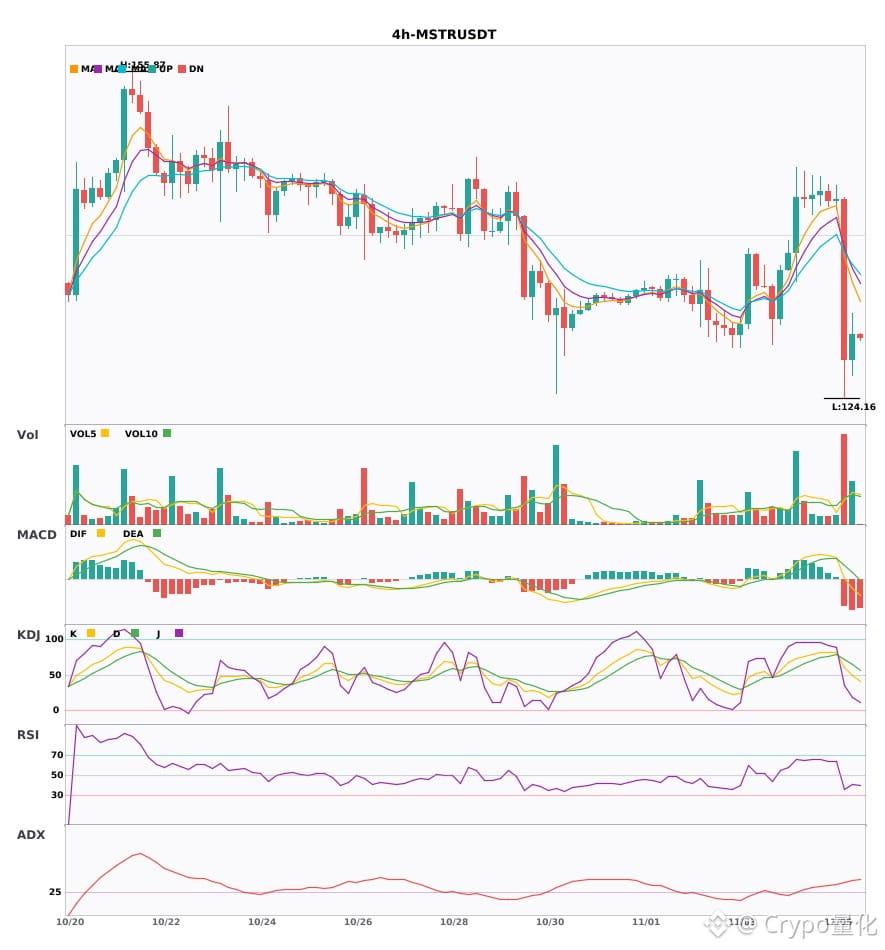
$MSTU / $AERO / $MSTR 4-hour technical indicators are weakening in tandem; watch out for risk 🔥
════════════════════
🟢 $MSTU 4-hour bearish signal
⚠️Technical analysis: ADX(42) indicates a clear trending market | MACD is bearish, the trend is weak, and momentum is increasing | EMA5 < EMA8 < EMA13, bearish alignment | Volume surge (3.3x)
════════════════════
🟢 $AERO 4-hour bearish signal
⚠️Technical analysis: ADX(42) indicates a clear trending market | MACD is bearish, the trend is weak, and momentum is increasing | EMA5 < EMA8 < EMA13, bearish alignment | Volume increase (2.0x)
📢Market update: Binance Will Support the Velodrome Finance (VELODROME) Token Merge to Aerodrome (AERO) and the AERO Contract Swap
════════════════════
🟢 $MSTR 4-hour bearish signal
⚠️Technical analysis: ADX(41) indicates a clear trending market | MACD DIF has fallen below zero, signaling a bearish trend reversal | EMA5 < EMA8 < EMA13, bearish alignment | Volume surge (3.3x)
════════════════════
🔔 Follow for first-hand market alerts 🔔
#技术分析 #MSTU #AERO #MSTR
📌 When trading, watch whether the candlestick patterns confirm
$MSTU / $AERO / $MSTR 4-hour technical indicators are weakening in tandem; watch out for risk 🔥
════════════════════
🟢 $MSTU 4-hour bearish signal
⚠️Technical analysis: ADX(42) indicates a clear trending market | MACD is bearish, the trend is weak, and momentum is increasing | EMA5 < EMA8 < EMA13, bearish alignment | Volume surge (3.3x)
════════════════════
🟢 $AERO 4-hour bearish signal
⚠️Technical analysis: ADX(42) indicates a clear trending market | MACD is bearish, the trend is weak, and momentum is increasing | EMA5 < EMA8 < EMA13, bearish alignment | Volume increase (2.0x)
📢Market update: Binance Will Support the Velodrome Finance (VELODROME) Token Merge to Aerodrome (AERO) and the AERO Contract Swap
════════════════════
🟢 $MSTR 4-hour bearish signal
⚠️Technical analysis: ADX(41) indicates a clear trending market | MACD DIF has fallen below zero, signaling a bearish trend reversal | EMA5 < EMA8 < EMA13, bearish alignment | Volume surge (3.3x)
════════════════════
🔔 Follow for first-hand market alerts 🔔
#技术分析 #MSTU #AERO #MSTR
📌 When trading, watch whether the candlestick patterns confirm
════════════════════
🟢 $MSTU 4-hour bearish signal
⚠️Technical analysis: ADX(42) indicates a clear trending market | MACD is bearish, the trend is weak, and momentum is increasing | EMA5 < EMA8 < EMA13, bearish alignment | Volume surge (3.3x)
════════════════════
🟢 $AERO 4-hour bearish signal
⚠️Technical analysis: ADX(42) indicates a clear trending market | MACD is bearish, the trend is weak, and momentum is increasing | EMA5 < EMA8 < EMA13, bearish alignment | Volume increase (2.0x)
📢Market update: Binance Will Support the Velodrome Finance (VELODROME) Token Merge to Aerodrome (AERO) and the AERO Contract Swap
════════════════════
🟢 $MSTR 4-hour bearish signal
⚠️Technical analysis: ADX(41) indicates a clear trending market | MACD DIF has fallen below zero, signaling a bearish trend reversal | EMA5 < EMA8 < EMA13, bearish alignment | Volume surge (3.3x)
════════════════════
🔔 Follow for first-hand market alerts 🔔
#技术分析 #MSTU #AERO #MSTR
📌 When trading, watch whether the candlestick patterns confirm
12
·
--
MSTU Binance TradFi Perpetual (traditional finance), closed at -9.36% over 5m at 2026-10-30 21:35 Beijing time. At the observation time of 2026-10-30 21:35:01 Beijing time, the current price was 24.97, 24h volume was 8.0262 million, price was below VWAP 27.5473, and volume was 37.3x (low base). This candle dropped sharply. What matters more now is whether the rebound comes with volume; no need to rush into calling a bottom.
Can the rebound reclaim VWAP 27.5473? Do you think this is panic selling, or will the price continue to break down?
Note: This is a traditional finance perpetual, with higher liquidity and gap risks outside trading hours.
#MSTU #Unusual Move Alert
MSTU Binance TradFi Perpetual (traditional finance), closed at -9.36% over 5m at 2026-10-30 21:35 Beijing time. At the observation time of 2026-10-30 21:35:01 Beijing time, the current price was 24.97, 24h volume was 8.0262 million, price was below VWAP 27.5473, and volume was 37.3x (low base). This candle dropped sharply. What matters more now is whether the rebound comes with volume; no need to rush into calling a bottom.
Can the rebound reclaim VWAP 27.5473? Do you think this is panic selling, or will the price continue to break down?
Note: This is a traditional finance perpetual, with higher liquidity and gap risks outside trading hours.
#MSTU #Unusual Move Alert
Can the rebound reclaim VWAP 27.5473? Do you think this is panic selling, or will the price continue to break down?
Note: This is a traditional finance perpetual, with higher liquidity and gap risks outside trading hours.
#MSTU #Unusual Move Alert
4

·
--
Oh my!
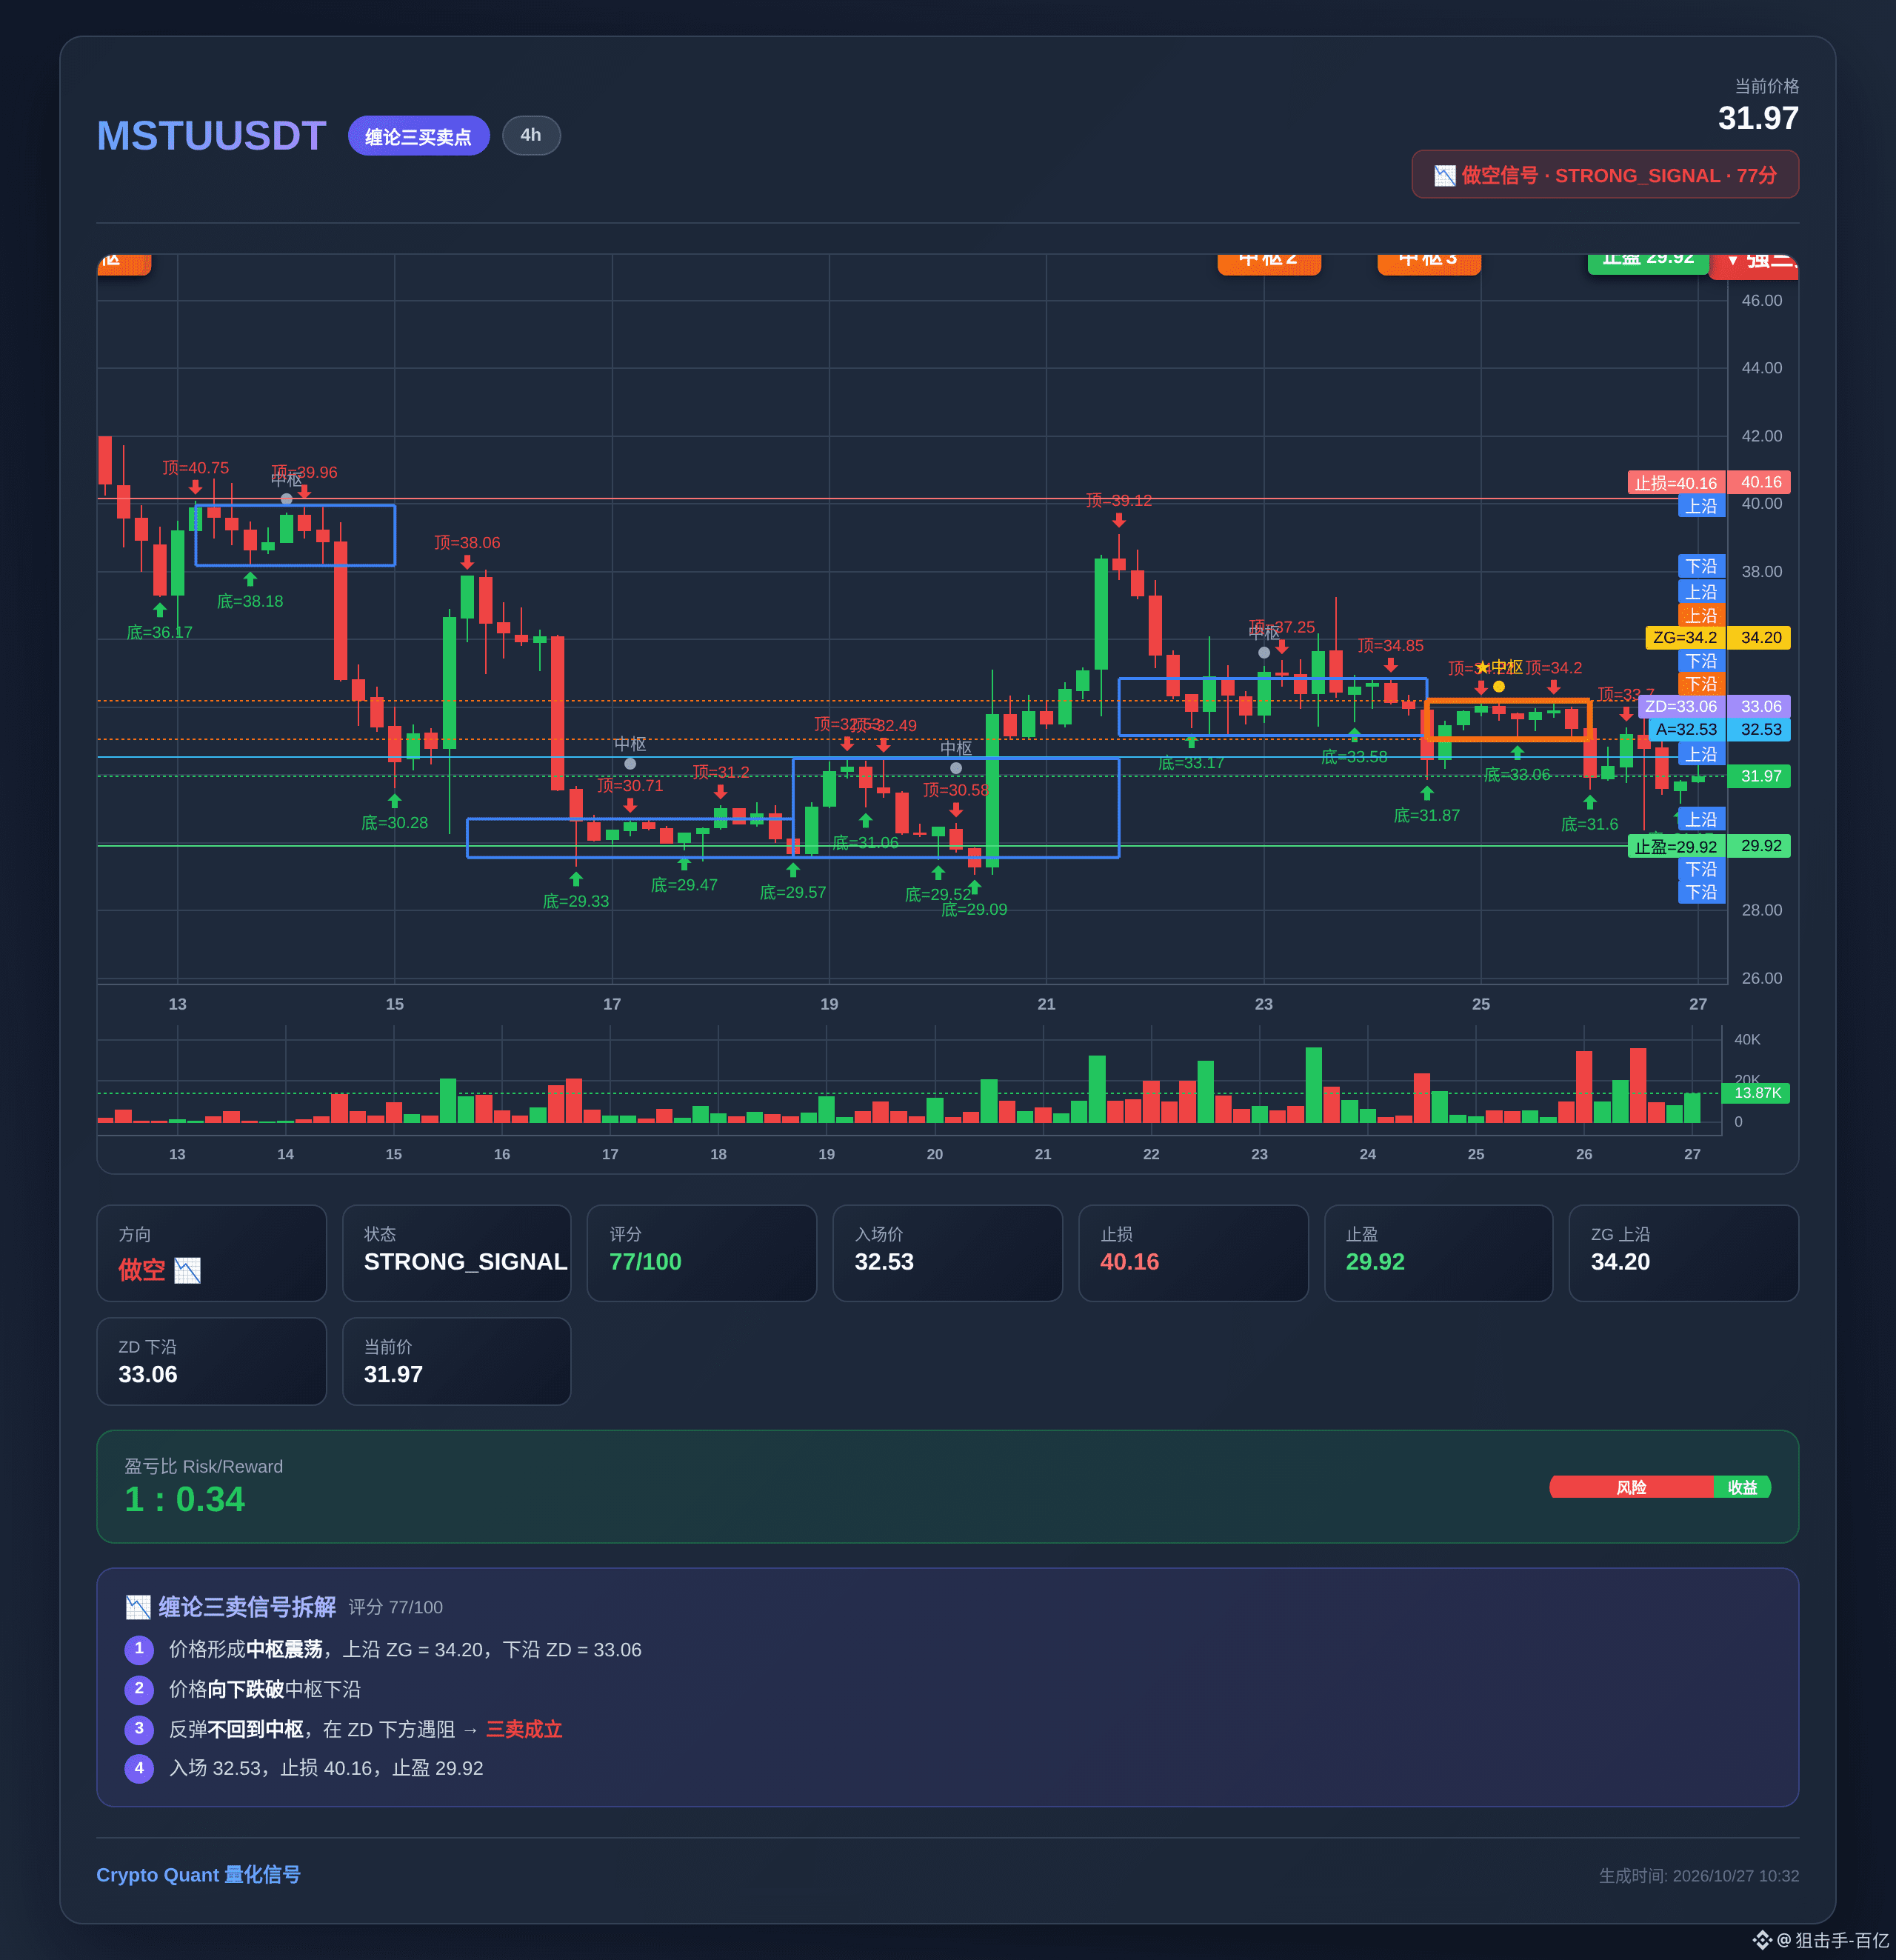
💡 What is a Chan Theory Third Buy? Today, $MSTU will show you
Today, $MSTU gave a textbook Chan Theory Third Buy signal. Let’s break it down:
1️⃣ Price structure: Chan Theory Third Buy formed
2️⃣ Entry: 32.5300
3️⃣ Stop-loss: 40.1598
4️⃣ Take-profit: 29.9166
A 0.34:1 risk-reward ratio—those who know, know 👀
Save this and study it at your own pace 📌
Follow me to learn one trading tip every day ✨
#BTC #炒币 #MSTU #币安 #Pivot Theory
Oh my!
💡 What is a Chan Theory Third Buy? Today, $MSTU will show you
Today, $MSTU gave a textbook Chan Theory Third Buy signal. Let’s break it down:
1️⃣ Price structure: Chan Theory Third Buy formed
2️⃣ Entry: 32.5300
3️⃣ Stop-loss: 40.1598
4️⃣ Take-profit: 29.9166
A 0.34:1 risk-reward ratio—those who know, know 👀
Save this and study it at your own pace 📌
Follow me to learn one trading tip every day ✨
#BTC #炒币 #MSTU #币安 #Pivot Theory
💡 What is a Chan Theory Third Buy? Today, $MSTU will show you
Today, $MSTU gave a textbook Chan Theory Third Buy signal. Let’s break it down:
1️⃣ Price structure: Chan Theory Third Buy formed
2️⃣ Entry: 32.5300
3️⃣ Stop-loss: 40.1598
4️⃣ Take-profit: 29.9166
A 0.34:1 risk-reward ratio—those who know, know 👀
Save this and study it at your own pace 📌
Follow me to learn one trading tip every day ✨
#BTC #炒币 #MSTU #币安 #Pivot Theory
3
·
--
What do you think? Let me know in the comments.
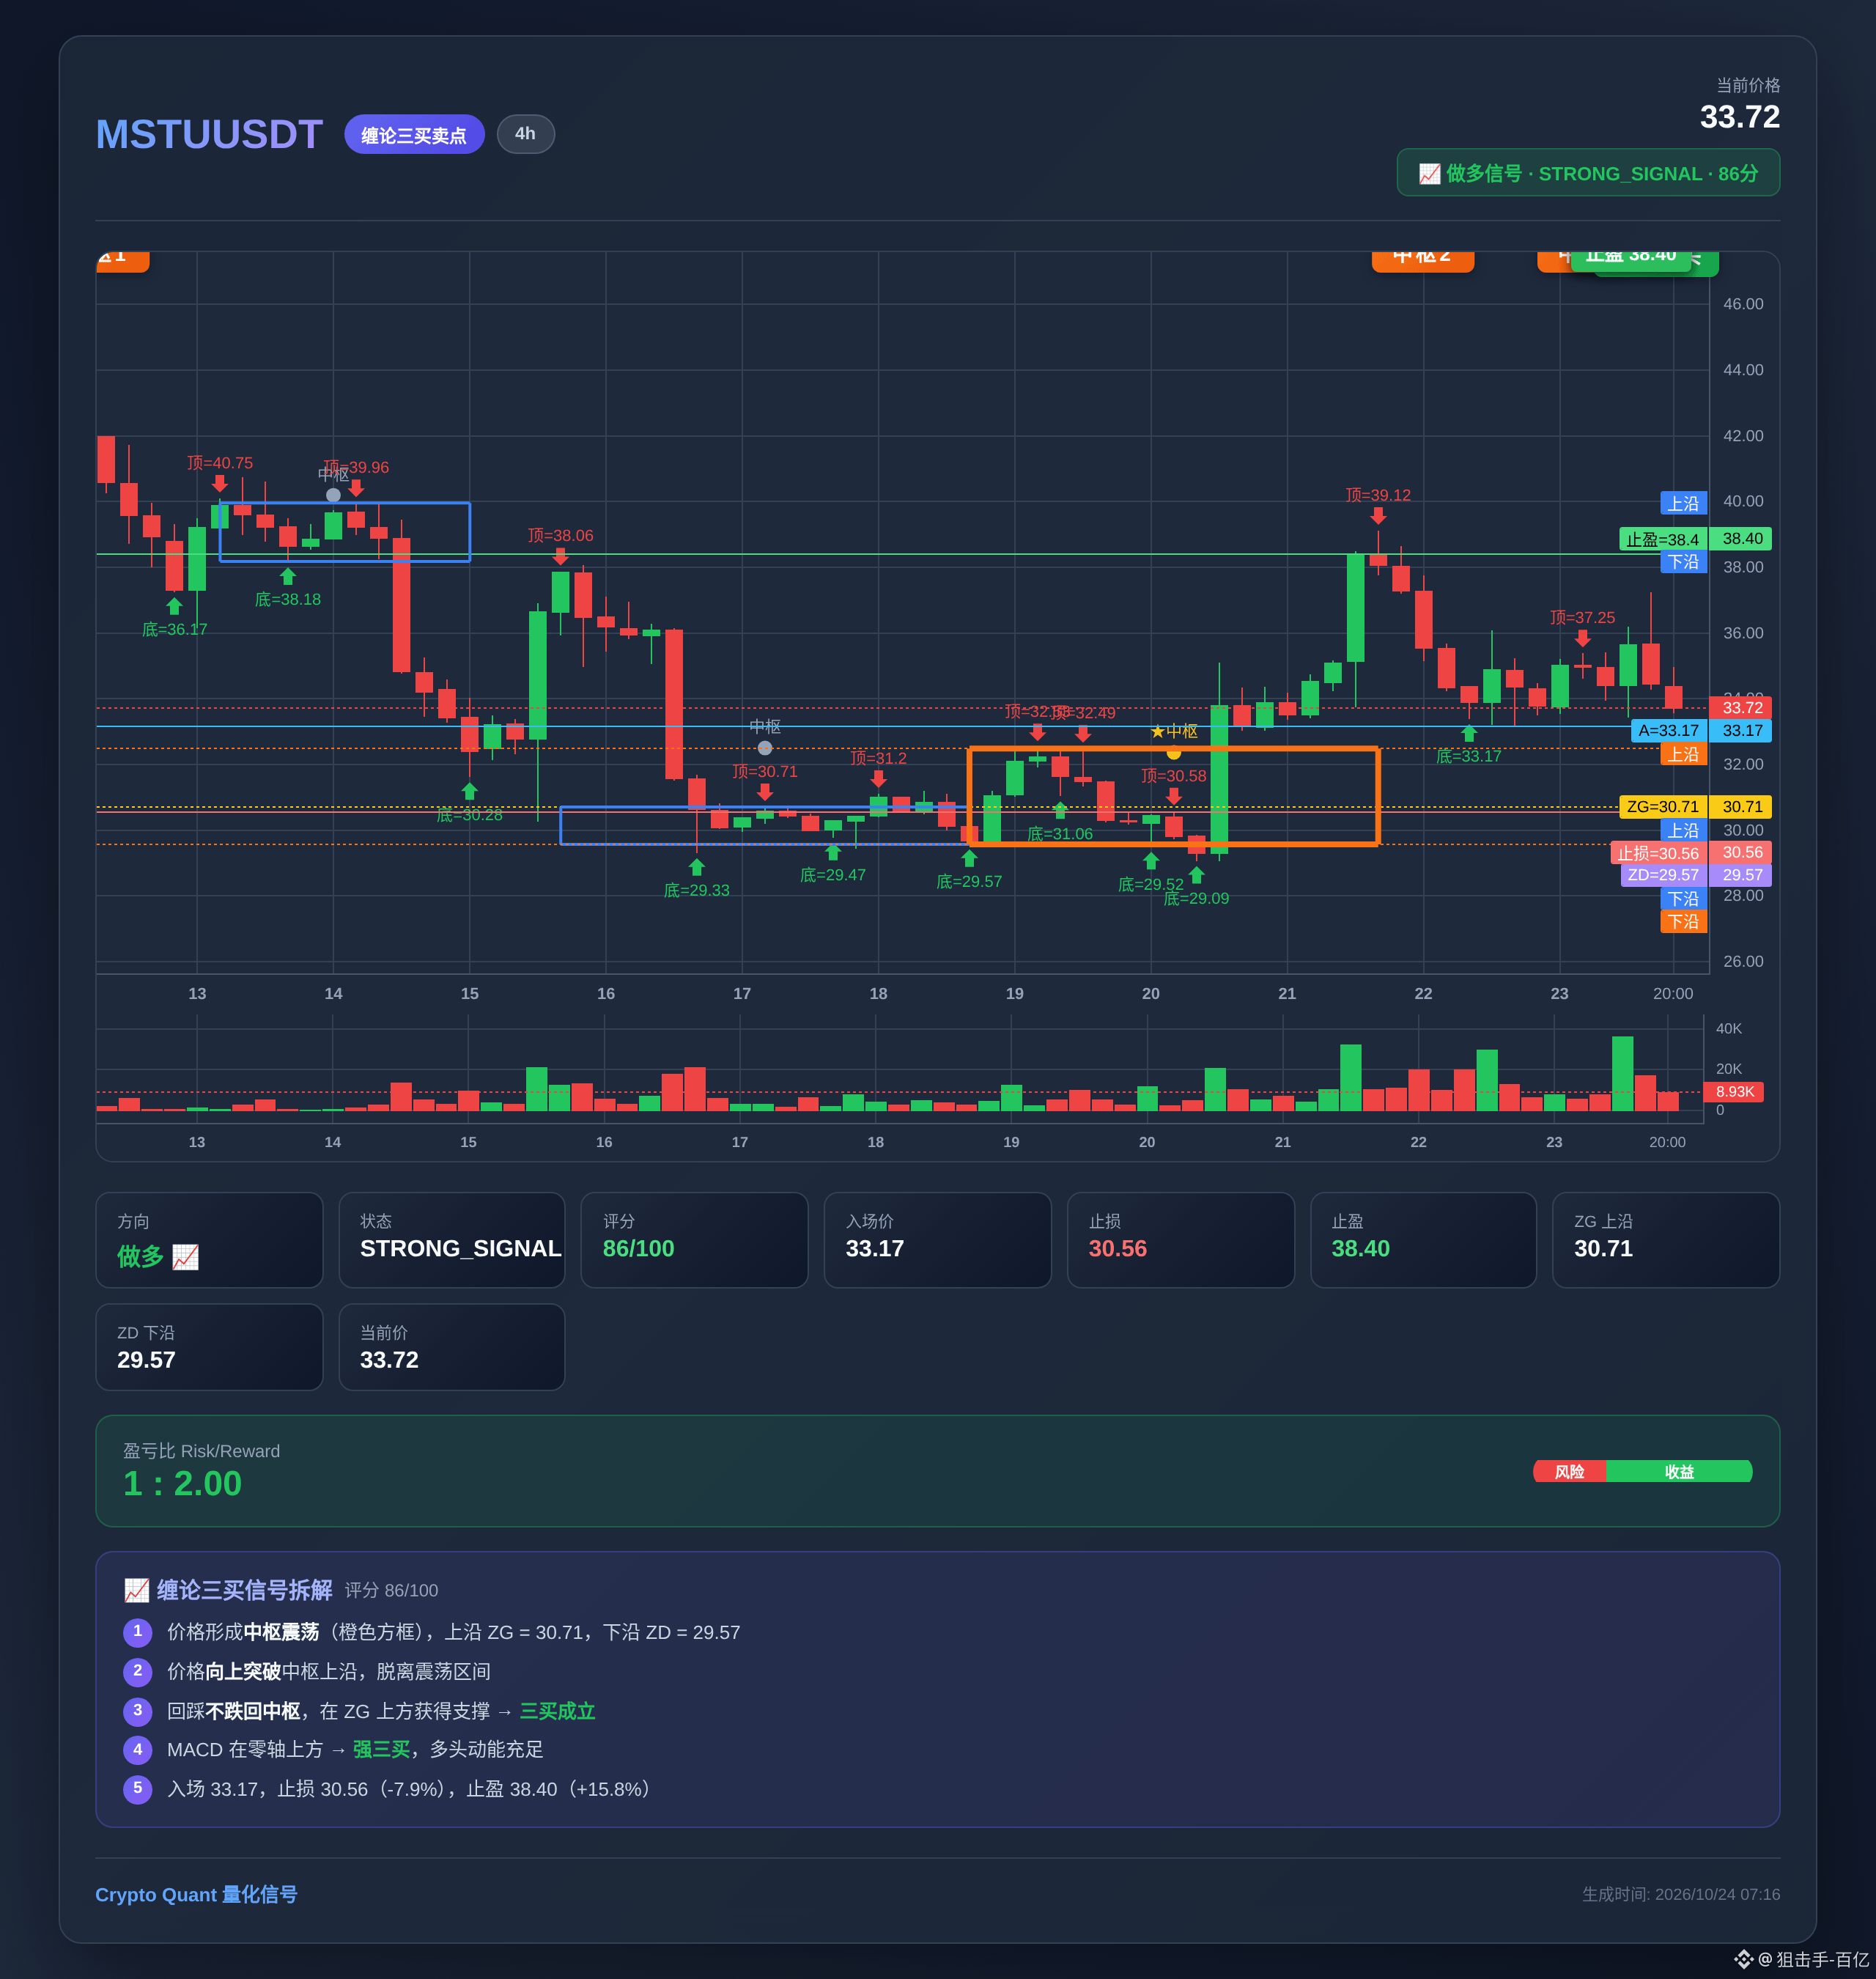
Guys, I’m getting into this long at $MSTU first.
Here’s the reasoning: CHAN strategy, 4h timeframe
Score: 96 points—not bad.
Entry: 33.1700
Stop-loss: 30.5564
Take-profit: 38.3971
Risk/reward ratio: 2.0:1. As long as I don’t lose money, I’m good 😂
Trade at your own risk. I’ll make the first move!
May everyone who likes this double their gains 👍
#缠论交易 #MSTU #牛市 #交易日记 #Binance
What do you think? Let me know in the comments.
Guys, I’m getting into this long at $MSTU first.
Here’s the reasoning: CHAN strategy, 4h timeframe
Score: 96 points—not bad.
Entry: 33.1700
Stop-loss: 30.5564
Take-profit: 38.3971
Risk/reward ratio: 2.0:1. As long as I don’t lose money, I’m good 😂
Trade at your own risk. I’ll make the first move!
May everyone who likes this double their gains 👍
#缠论交易 #MSTU #牛市 #交易日记 #Binance
Guys, I’m getting into this long at $MSTU first.
Here’s the reasoning: CHAN strategy, 4h timeframe
Score: 96 points—not bad.
Entry: 33.1700
Stop-loss: 30.5564
Take-profit: 38.3971
Risk/reward ratio: 2.0:1. As long as I don’t lose money, I’m good 😂
Trade at your own risk. I’ll make the first move!
May everyone who likes this double their gains 👍
#缠论交易 #MSTU #牛市 #交易日记 #Binance
7
·
--
Guess what happens next?
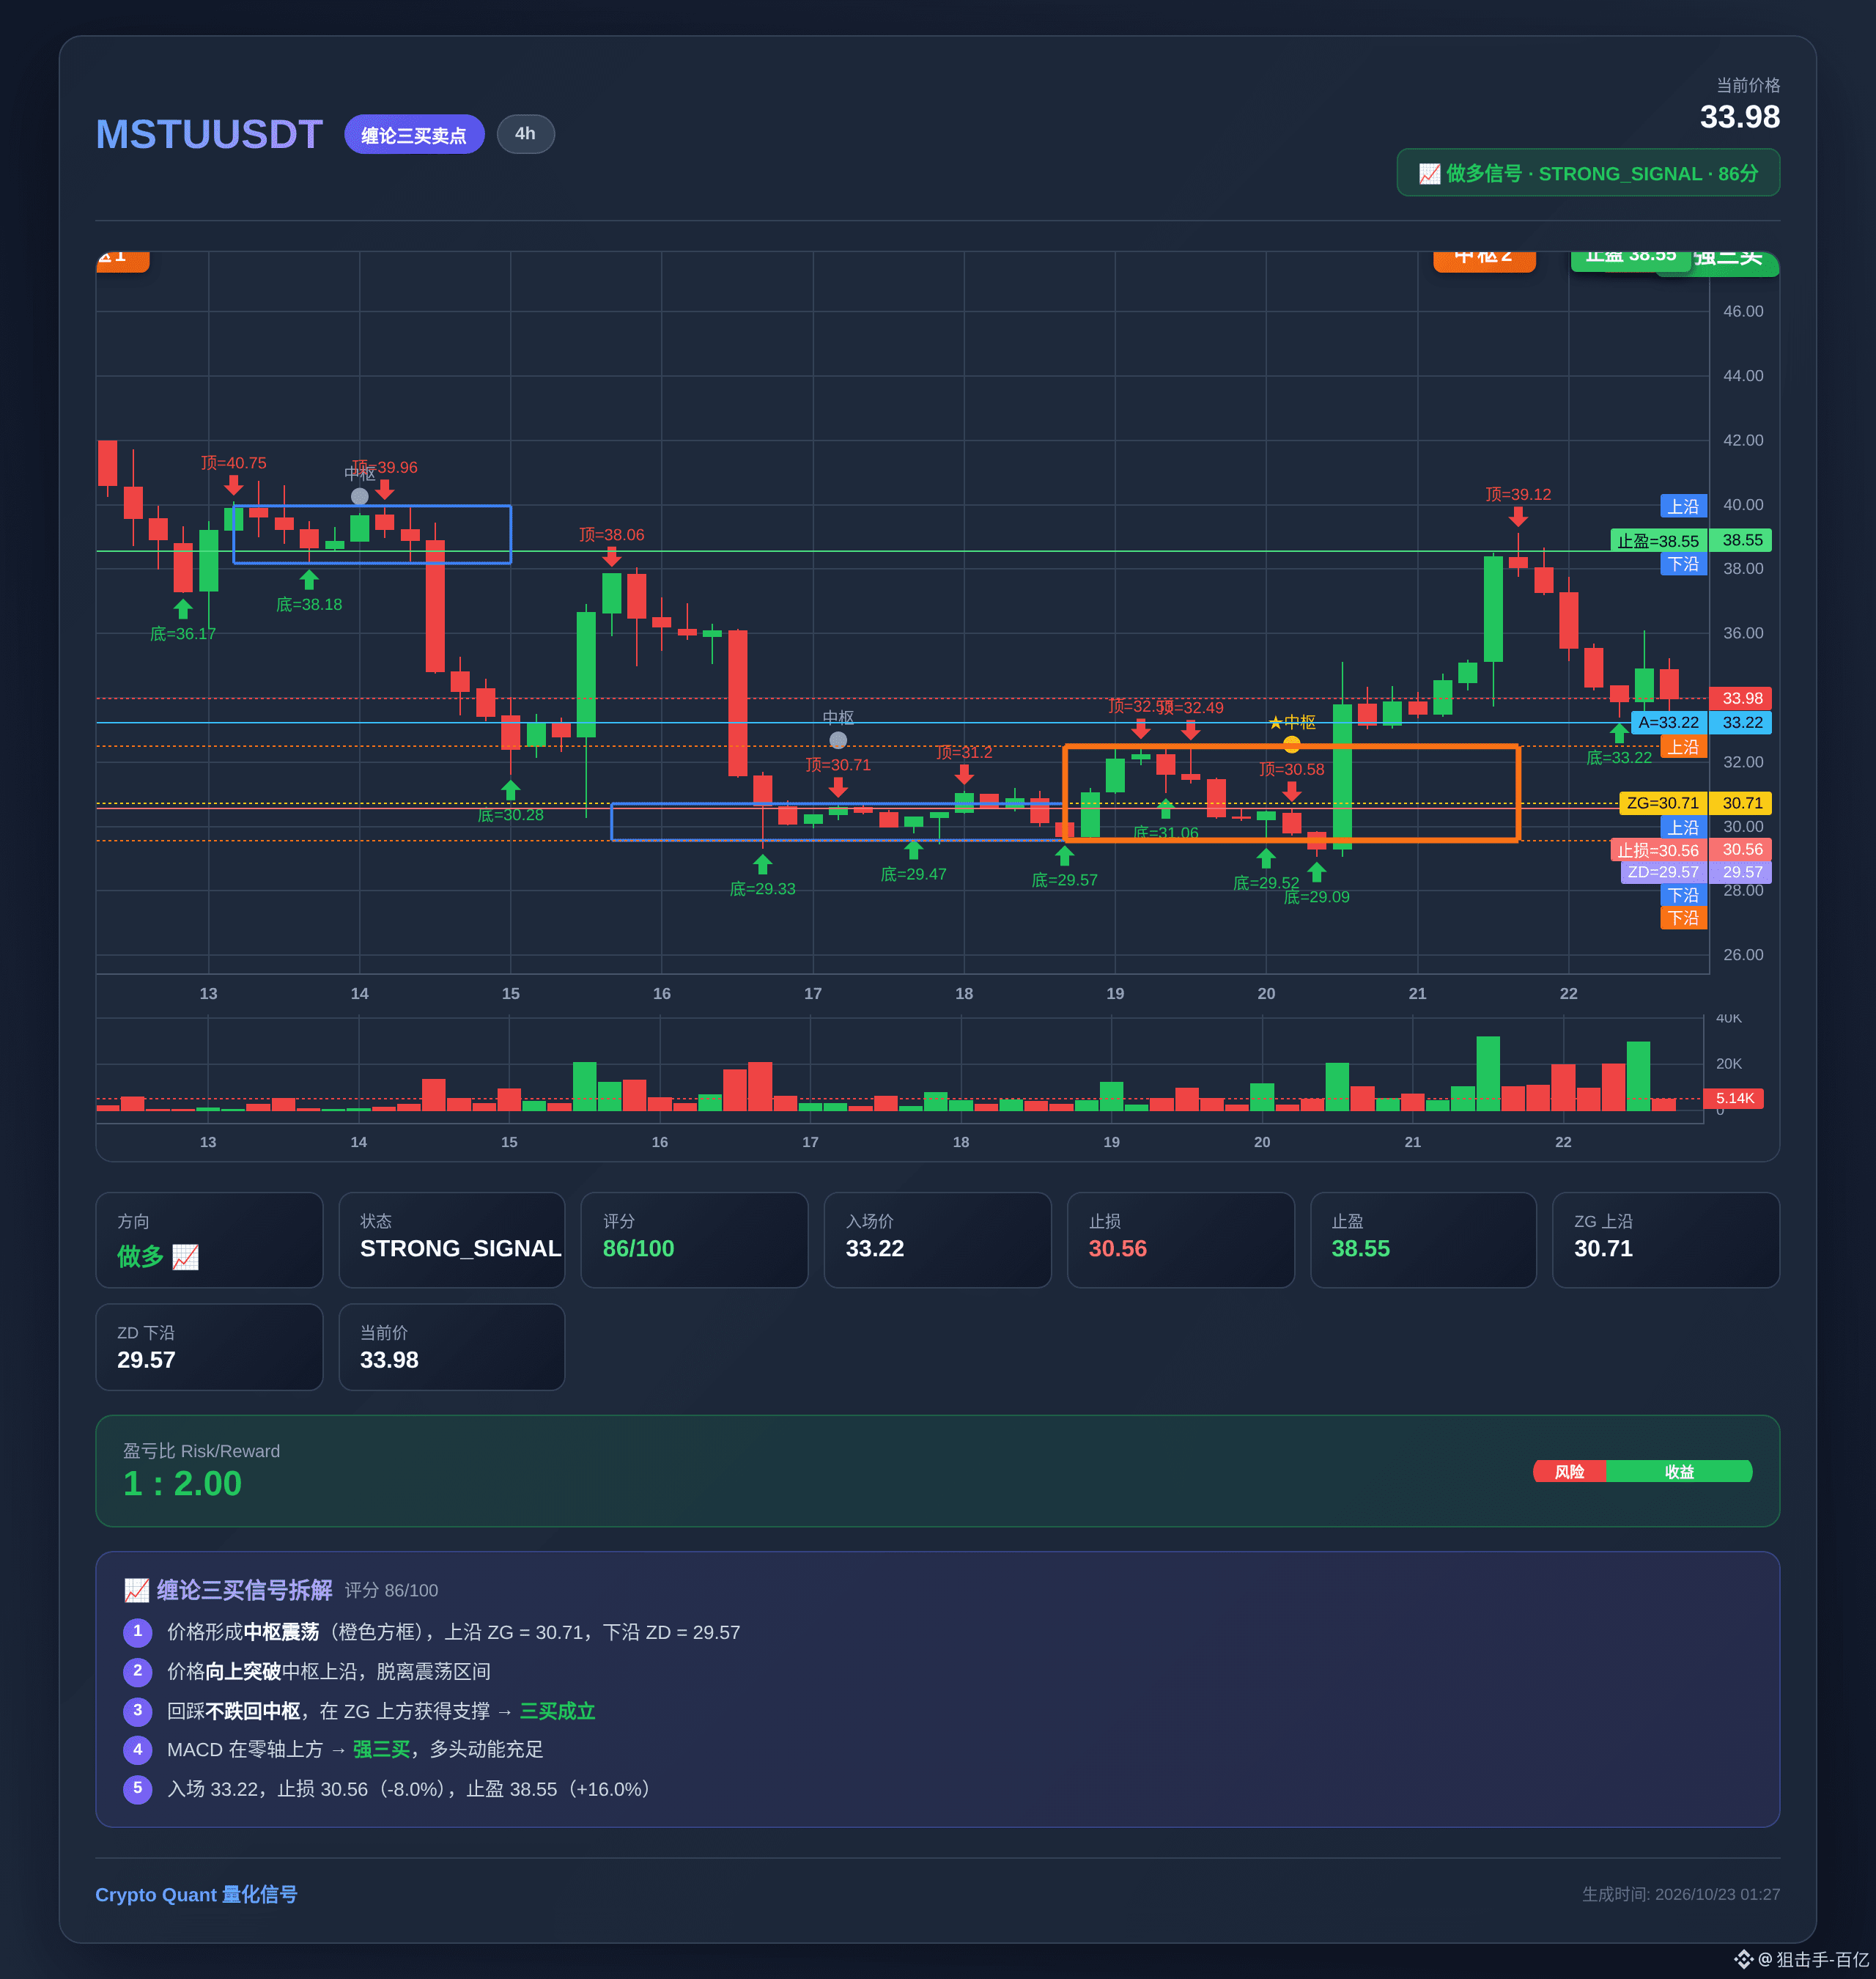
Just spotted a signal on the $MSTU 4h timeframe!
Do you think this move is about to take off?
📍 Current price: 34.1600
🎯 Entry: 33.2200
🛑 Stop loss: 30.5564
💰 Take profit: 38.5471
⚖️ Risk/reward ratio: 2.0 : 1
⭐ Score: 96 points
If you found this useful, give it a like to show your support
#币圈 #MSTU #缠论 #熊市 #GetRich
Guess what happens next?
Just spotted a signal on the $MSTU 4h timeframe!
Do you think this move is about to take off?
📍 Current price: 34.1600
🎯 Entry: 33.2200
🛑 Stop loss: 30.5564
💰 Take profit: 38.5471
⚖️ Risk/reward ratio: 2.0 : 1
⭐ Score: 96 points
If you found this useful, give it a like to show your support
#币圈 #MSTU #缠论 #熊市 #GetRich
Just spotted a signal on the $MSTU 4h timeframe!
Do you think this move is about to take off?
📍 Current price: 34.1600
🎯 Entry: 33.2200
🛑 Stop loss: 30.5564
💰 Take profit: 38.5471
⚖️ Risk/reward ratio: 2.0 : 1
⭐ Score: 96 points
If you found this useful, give it a like to show your support
#币圈 #MSTU #缠论 #熊市 #GetRich
6

·
--
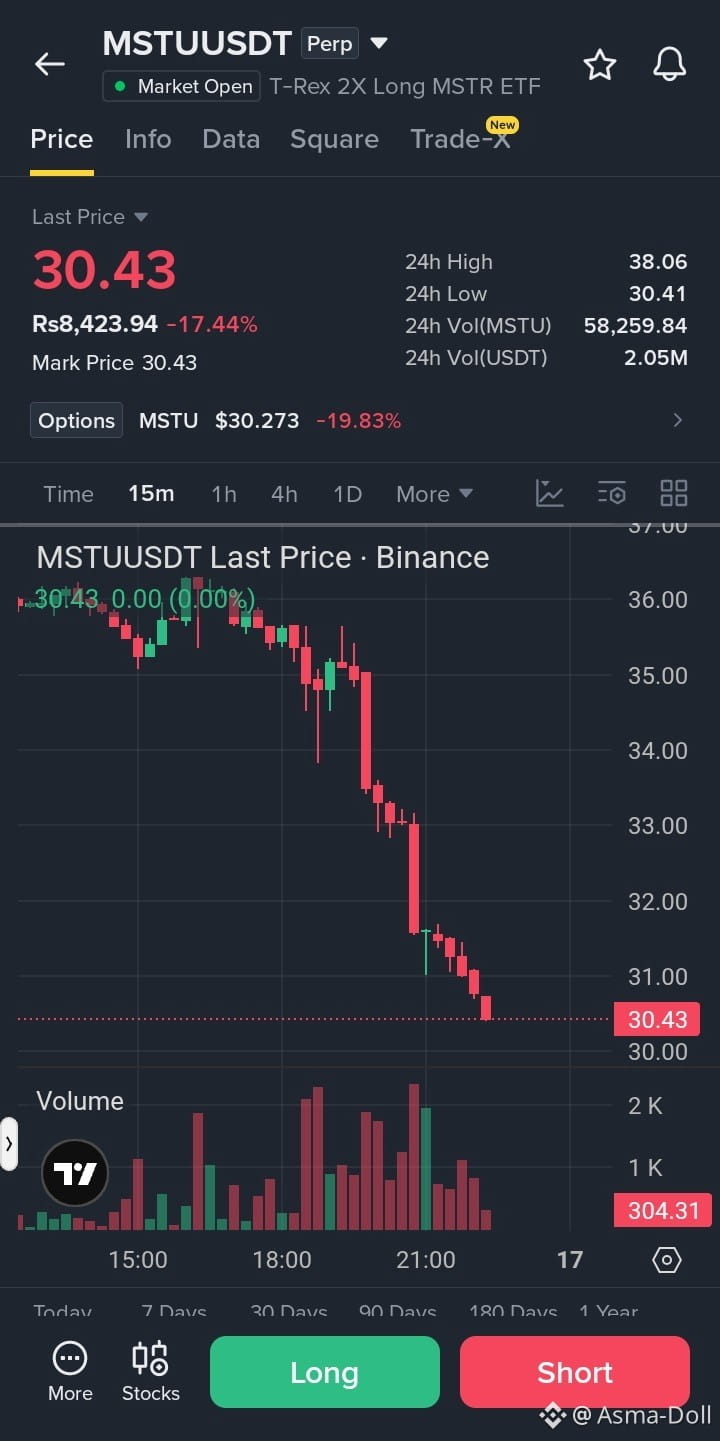
🔴 $MSTU /USDT — SHORT SIGNAL
MSTU (T-Rex 2X Long MSTR ETF)
Direction: SHORT 📉
Entry Zone: $30.50 – $31.20
Stop Loss (SL): $32.40
TP1: $29.80
TP2: $28.80
TP3: $27.50
Trade here $MSTU
{future}(MSTUUSDT)
📊 Analysis
Current Price: $30.43 (-17.44%)
Strong bearish momentum after a sharp sell-off.
Price is trading near the 24h low of $30.41.
A breakdown below $30.40 could trigger further downside.
A relief bounce is possible after such a steep drop.
✅ Confirmation
Wait for a clean break below $30.40 with bearish volume before entering. Avoid chasing the price if it drops sharply without a retest.
⚖️ Risk-to-Reward Summary
Using an entry of $30.80 and SL of $32.40:
Risk: $1.60 per unit
TP1 Reward: $1.00 — R:R 1:0.63
TP2 Reward: $2.00 — R:R 1:1.25
TP3 Reward: $3.30 — R:R 1:2.06
⚠️ Important: MSTU is a 2× leveraged ETF-linked product, so volatility can be extreme. These are illustrative levels based on your supplied snapshot, not verified live signals. TP1 offers a poor risk-to-reward ratio; consider waiting for a better entry rather than chasing the decline.
#MSTU #ShortSignal #CryptoTrading #TechnicalAnalysis #RiskManagement
🔴 $MSTU /USDT — SHORT SIGNAL
MSTU (T-Rex 2X Long MSTR ETF)
Direction: SHORT 📉
Entry Zone: $30.50 – $31.20
Stop Loss (SL): $32.40
TP1: $29.80
TP2: $28.80
TP3: $27.50
Trade here $MSTU
📊 Analysis
Current Price: $30.43 (-17.44%)
Strong bearish momentum after a sharp sell-off.
Price is trading near the 24h low of $30.41.
A breakdown below $30.40 could trigger further downside.
A relief bounce is possible after such a steep drop.
✅ Confirmation
Wait for a clean break below $30.40 with bearish volume before entering. Avoid chasing the price if it drops sharply without a retest.
⚖️ Risk-to-Reward Summary
Using an entry of $30.80 and SL of $32.40:
Risk: $1.60 per unit
TP1 Reward: $1.00 — R:R 1:0.63
TP2 Reward: $2.00 — R:R 1:1.25
TP3 Reward: $3.30 — R:R 1:2.06
⚠️ Important: MSTU is a 2× leveraged ETF-linked product, so volatility can be extreme. These are illustrative levels based on your supplied snapshot, not verified live signals. TP1 offers a poor risk-to-reward ratio; consider waiting for a better entry rather than chasing the decline.
#MSTU #ShortSignal #CryptoTrading #TechnicalAnalysis #RiskManagement
MSTU (T-Rex 2X Long MSTR ETF)
Direction: SHORT 📉
Entry Zone: $30.50 – $31.20
Stop Loss (SL): $32.40
TP1: $29.80
TP2: $28.80
TP3: $27.50
Trade here $MSTU
📊 Analysis
Current Price: $30.43 (-17.44%)
Strong bearish momentum after a sharp sell-off.
Price is trading near the 24h low of $30.41.
A breakdown below $30.40 could trigger further downside.
A relief bounce is possible after such a steep drop.
✅ Confirmation
Wait for a clean break below $30.40 with bearish volume before entering. Avoid chasing the price if it drops sharply without a retest.
⚖️ Risk-to-Reward Summary
Using an entry of $30.80 and SL of $32.40:
Risk: $1.60 per unit
TP1 Reward: $1.00 — R:R 1:0.63
TP2 Reward: $2.00 — R:R 1:1.25
TP3 Reward: $3.30 — R:R 1:2.06
⚠️ Important: MSTU is a 2× leveraged ETF-linked product, so volatility can be extreme. These are illustrative levels based on your supplied snapshot, not verified live signals. TP1 offers a poor risk-to-reward ratio; consider waiting for a better entry rather than chasing the decline.
#MSTU #ShortSignal #CryptoTrading #TechnicalAnalysis #RiskManagement
1
77

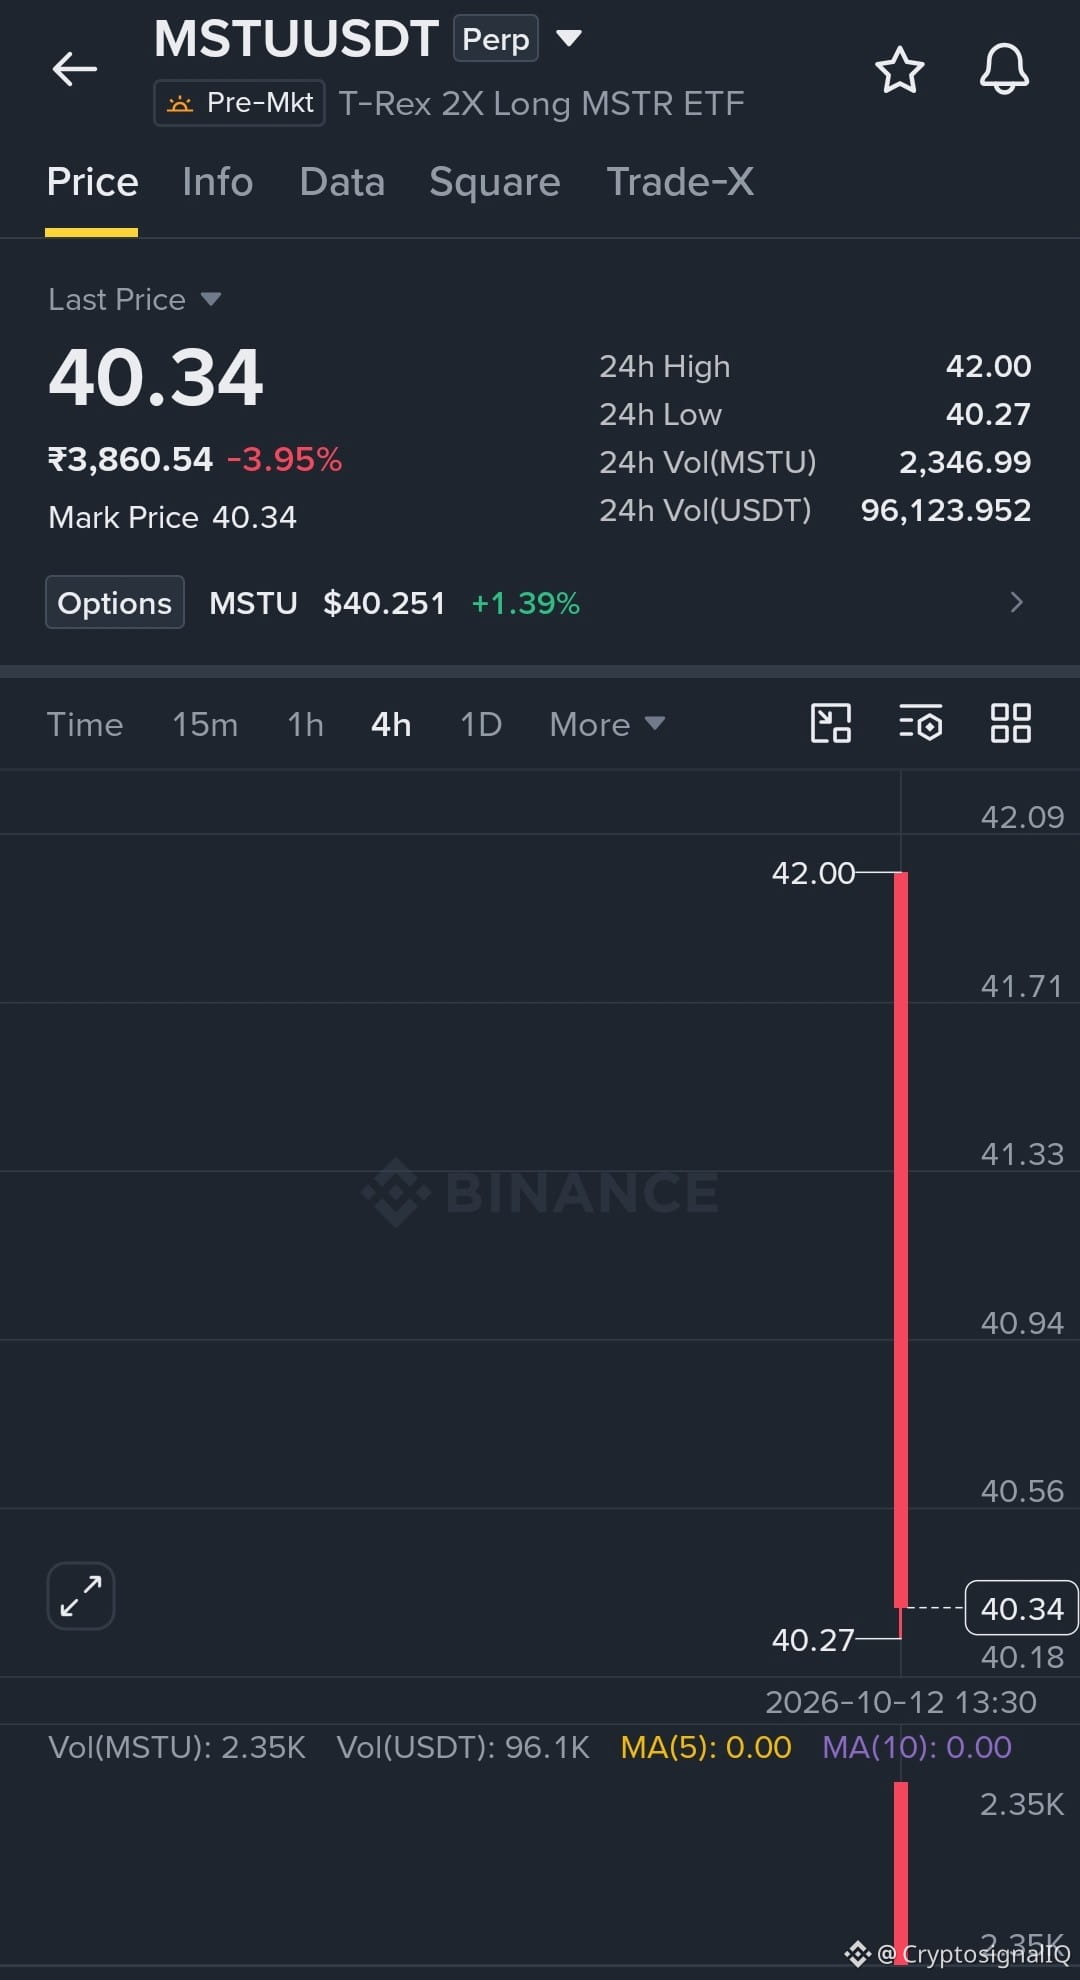
$MSTU — Following a brand-new perpetual contract listing on Binance Futures, price hit a 42.00 session high before pulling back to 40.34 with a -3.95% shift as initial listing volatility settles!
* Entry: 39.00–40.20
* TP1: 42.50
* TP2: 45.00
* TP3: 48.50
* SL: 37.80
Fresh listings bring heavy price swings. Watch for a steady support floor to form before making your next move.
Trade #MSTU here
{future}(MSTUUSDT)
$GTC
{future}(GTCUSDT)
$RSR
{future}(RSRUSDT)
$MSTU — Following a brand-new perpetual contract listing on Binance Futures, price hit a 42.00 session high before pulling back to 40.34 with a -3.95% shift as initial listing volatility settles!
* Entry: 39.00–40.20
* TP1: 42.50
* TP2: 45.00
* TP3: 48.50
* SL: 37.80
Fresh listings bring heavy price swings. Watch for a steady support floor to form before making your next move.
Trade #MSTU here
$GTC
$RSR
* Entry: 39.00–40.20
* TP1: 42.50
* TP2: 45.00
* TP3: 48.50
* SL: 37.80
Fresh listings bring heavy price swings. Watch for a steady support floor to form before making your next move.
Trade #MSTU here
$GTC
$RSR
176

⚡ TRADFI MEETS CRYPTO MOMENTUM AS $MSTU PERPETUALS HIT THE ORDER BOOKS! 💥
The bridge between traditional finance and round-the-clock liquidity just expanded in a major way. 🏦 Traders now command direct USDⓈ-margined exposure to high-beta vehicles like 2x MicroStrategy ETF-linked $MSTU and $ZCSH with up to 20x leverage. 📊
⚡ When institutional momentum assets unlock 24/7 price discovery, cross-market flows and funding dynamics get aggressive fast. 💡 Smart capital thrives where market volatility meets continuous liquidity.
🤔 Which of these new TradFi contracts are you hunting on the charts first? 👇
⚠️ Not financial advice. Always manage your risk. 🛡️
🏷️ #MSTU #ZCSH #TradFi #FuturesTrading #Crypto
⚡ 🦈
⚡ TRADFI MEETS CRYPTO MOMENTUM AS $MSTU PERPETUALS HIT THE ORDER BOOKS! 💥
The bridge between traditional finance and round-the-clock liquidity just expanded in a major way. 🏦 Traders now command direct USDⓈ-margined exposure to high-beta vehicles like 2x MicroStrategy ETF-linked $MSTU and $ZCSH with up to 20x leverage. 📊
⚡ When institutional momentum assets unlock 24/7 price discovery, cross-market flows and funding dynamics get aggressive fast. 💡 Smart capital thrives where market volatility meets continuous liquidity.
🤔 Which of these new TradFi contracts are you hunting on the charts first? 👇
⚠️ Not financial advice. Always manage your risk. 🛡️
🏷️ #MSTU #ZCSH #TradFi #FuturesTrading #Crypto
⚡ 🦈
The bridge between traditional finance and round-the-clock liquidity just expanded in a major way. 🏦 Traders now command direct USDⓈ-margined exposure to high-beta vehicles like 2x MicroStrategy ETF-linked $MSTU and $ZCSH with up to 20x leverage. 📊
⚡ When institutional momentum assets unlock 24/7 price discovery, cross-market flows and funding dynamics get aggressive fast. 💡 Smart capital thrives where market volatility meets continuous liquidity.
🤔 Which of these new TradFi contracts are you hunting on the charts first? 👇
⚠️ Not financial advice. Always manage your risk. 🛡️
🏷️ #MSTU #ZCSH #TradFi #FuturesTrading #Crypto
⚡ 🦈

186

INSTITUTIONAL LIQUIDITY MEETS TRADFI WITH $MSTU PERPETUAL EXPANSION 🦈 ⚡
Institutional capital pathways continue to blur as TradFi synthetic liquidity integrates directly into derivative order books. 🌊 Offering continuous USDⓈ-margined exposure to structured vehicles like $MSTU and $SNPS introduces immense tactical volatility into the market.
🔍 Smart money thrives on cross-market arbitrage and high-beta expansion, especially where structural leverage bridges traditional equity flows with digital asset mechanics. 💡 Which TradFi contract are you watching closely to exploit structural inefficiencies this week? 👇
⚠️ Not financial advice. Always manage your risk. 🛡️
🏷️ #MSTU #FuturesTrading #TradFi #SmartMoney #Crypto
🎯 🦈
INSTITUTIONAL LIQUIDITY MEETS TRADFI WITH $MSTU PERPETUAL EXPANSION 🦈 ⚡
Institutional capital pathways continue to blur as TradFi synthetic liquidity integrates directly into derivative order books. 🌊 Offering continuous USDⓈ-margined exposure to structured vehicles like $MSTU and $SNPS introduces immense tactical volatility into the market.
🔍 Smart money thrives on cross-market arbitrage and high-beta expansion, especially where structural leverage bridges traditional equity flows with digital asset mechanics. 💡 Which TradFi contract are you watching closely to exploit structural inefficiencies this week? 👇
⚠️ Not financial advice. Always manage your risk. 🛡️
🏷️ #MSTU #FuturesTrading #TradFi #SmartMoney #Crypto
🎯 🦈
Institutional capital pathways continue to blur as TradFi synthetic liquidity integrates directly into derivative order books. 🌊 Offering continuous USDⓈ-margined exposure to structured vehicles like $MSTU and $SNPS introduces immense tactical volatility into the market.
🔍 Smart money thrives on cross-market arbitrage and high-beta expansion, especially where structural leverage bridges traditional equity flows with digital asset mechanics. 💡 Which TradFi contract are you watching closely to exploit structural inefficiencies this week? 👇
⚠️ Not financial advice. Always manage your risk. 🛡️
🏷️ #MSTU #FuturesTrading #TradFi #SmartMoney #Crypto
🎯 🦈

98

·
--
⚡ INSTITUTIONAL EXPANSION BRINGS $MSTU AND TRADFI PERPETUAL CONTRACTS TO THE DERIVATIVES ARENA 🦈
New capital conduits are officially opening as four high-profile TradFi assets receive U-margined perpetual listings, led by the high-beta $MSTU and $ZCSH contracts with up to 20x leverage. 🌊
This bridge between legacy equity volatility and perpetual order flow creates fresh liquidity pools for sophisticated traders seeking macro hedging tools and structural efficiency. 📊
Funding intervals will settle every eight hours as institutional market makers step in to establish the initial basis spread. 💬 Which of these new synthetic listings offers the cleanest risk-to-reward for your strategy? 👇
⚠️ Not financial advice. Always manage your risk. 🛡️
🏷️ #MSTU #ZCSH #Perpetuals #TradFi #CryptoTrading
🎯 🦈
⚡ INSTITUTIONAL EXPANSION BRINGS $MSTU AND TRADFI PERPETUAL CONTRACTS TO THE DERIVATIVES ARENA 🦈
New capital conduits are officially opening as four high-profile TradFi assets receive U-margined perpetual listings, led by the high-beta $MSTU and $ZCSH contracts with up to 20x leverage. 🌊
This bridge between legacy equity volatility and perpetual order flow creates fresh liquidity pools for sophisticated traders seeking macro hedging tools and structural efficiency. 📊
Funding intervals will settle every eight hours as institutional market makers step in to establish the initial basis spread. 💬 Which of these new synthetic listings offers the cleanest risk-to-reward for your strategy? 👇
⚠️ Not financial advice. Always manage your risk. 🛡️
🏷️ #MSTU #ZCSH #Perpetuals #TradFi #CryptoTrading
🎯 🦈
New capital conduits are officially opening as four high-profile TradFi assets receive U-margined perpetual listings, led by the high-beta $MSTU and $ZCSH contracts with up to 20x leverage. 🌊
This bridge between legacy equity volatility and perpetual order flow creates fresh liquidity pools for sophisticated traders seeking macro hedging tools and structural efficiency. 📊
Funding intervals will settle every eight hours as institutional market makers step in to establish the initial basis spread. 💬 Which of these new synthetic listings offers the cleanest risk-to-reward for your strategy? 👇
⚠️ Not financial advice. Always manage your risk. 🛡️
🏷️ #MSTU #ZCSH #Perpetuals #TradFi #CryptoTrading
🎯 🦈
40

·
--
⚡ INSTITUTIONAL VOLATILITY UNLOCKED AS $MSTU AND TRADFI PERPS HIT THE ORDER BOOKS! 💥
TradFi momentum meets crypto leverage as new U-margined perpetual contracts drop for high-beta plays like $MSTU and $ZCSH . 🌊 Institutional risk appetite is bridging directly into the 24/7 liquidity pool, offering aggressive traders up to 20x leverage to trade equity volatility without leaving the derivatives desk.
📊 Leveraged MicroStrategy exposure entering the market will spark sharp volatility sweeps around traditional equity opens. 💡 Cross-asset order flow is tightening, offering nimble traders serious multi-market momentum. Are you hunting volatility on $MSTU perps or sticking strictly to pure crypto charts? 👇
⚠️ Not financial advice. Always manage your risk. 🛡️
🏷️ #MSTU #TradFi #Futures #CryptoTrading #Derivatives
🎯 🦈
⚡ INSTITUTIONAL VOLATILITY UNLOCKED AS $MSTU AND TRADFI PERPS HIT THE ORDER BOOKS! 💥
TradFi momentum meets crypto leverage as new U-margined perpetual contracts drop for high-beta plays like $MSTU and $ZCSH . 🌊 Institutional risk appetite is bridging directly into the 24/7 liquidity pool, offering aggressive traders up to 20x leverage to trade equity volatility without leaving the derivatives desk.
📊 Leveraged MicroStrategy exposure entering the market will spark sharp volatility sweeps around traditional equity opens. 💡 Cross-asset order flow is tightening, offering nimble traders serious multi-market momentum. Are you hunting volatility on $MSTU perps or sticking strictly to pure crypto charts? 👇
⚠️ Not financial advice. Always manage your risk. 🛡️
🏷️ #MSTU #TradFi #Futures #CryptoTrading #Derivatives
🎯 🦈
TradFi momentum meets crypto leverage as new U-margined perpetual contracts drop for high-beta plays like $MSTU and $ZCSH . 🌊 Institutional risk appetite is bridging directly into the 24/7 liquidity pool, offering aggressive traders up to 20x leverage to trade equity volatility without leaving the derivatives desk.
📊 Leveraged MicroStrategy exposure entering the market will spark sharp volatility sweeps around traditional equity opens. 💡 Cross-asset order flow is tightening, offering nimble traders serious multi-market momentum. Are you hunting volatility on $MSTU perps or sticking strictly to pure crypto charts? 👇
⚠️ Not financial advice. Always manage your risk. 🛡️
🏷️ #MSTU #TradFi #Futures #CryptoTrading #Derivatives
🎯 🦈
25


·
--
Bullish
$MSTU.ETF
{etf_us}(MSTU.ETF)
#MSTU ⚠️ High Risk Warning: MSTU (T-Rex 2X Long MSTR Daily Target ETF) is a highly volatile, leveraged instrument that tracking double the daily moves of MicroStrategy; compounding mechanics can lead to massive or total capital loss.
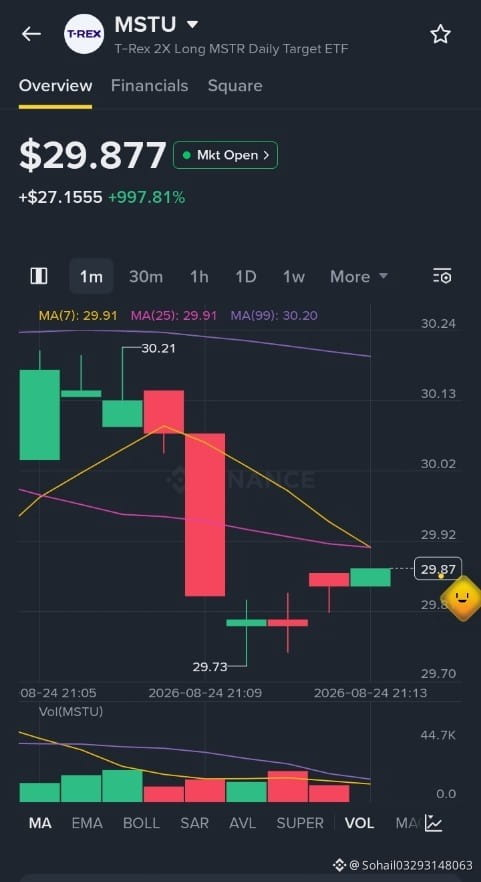
Current Status: The ETF trades at $2.73, riding a massive short-term 58.72% rally over the last week despite a steep -95% loss over the past year.
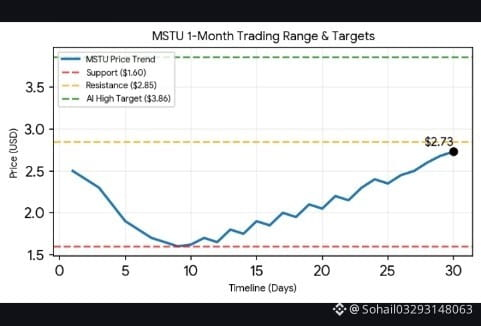
Technical Analysis: Shares are currently testing the upper bound of a wide $1.60 to $2.85 monthly consolidation box backed by a strong surge in buying volume.
Price Targets: AI-driven consensus outlines an immediate target average of $2.71, spanning a pessimistic floor of $1.50 up to a high-momentum ceiling of $3.86.
Strategic Outlook: Given the sudden vertical extension, aggressive buyers should anticipate a short-term pullback toward the middle of the trading channel before a sustainable trend reversal occurs.
#SamsungFalls8.97%DraggingKospiDown3.24%
#BrentDrops1.87%
#BitcoinOpenInterestFallsToTwoMonthLow
#BitcoinRises23.6%Weekly
$MSTU.ETF
#MSTU ⚠️ High Risk Warning: MSTU (T-Rex 2X Long MSTR Daily Target ETF) is a highly volatile, leveraged instrument that tracking double the daily moves of MicroStrategy; compounding mechanics can lead to massive or total capital loss.
Current Status: The ETF trades at $2.73, riding a massive short-term 58.72% rally over the last week despite a steep -95% loss over the past year.
Technical Analysis: Shares are currently testing the upper bound of a wide $1.60 to $2.85 monthly consolidation box backed by a strong surge in buying volume.
Price Targets: AI-driven consensus outlines an immediate target average of $2.71, spanning a pessimistic floor of $1.50 up to a high-momentum ceiling of $3.86.
Strategic Outlook: Given the sudden vertical extension, aggressive buyers should anticipate a short-term pullback toward the middle of the trading channel before a sustainable trend reversal occurs.
#SamsungFalls8.97%DraggingKospiDown3.24%
#BrentDrops1.87%
#BitcoinOpenInterestFallsToTwoMonthLow
#BitcoinRises23.6%Weekly
#MSTU ⚠️ High Risk Warning: MSTU (T-Rex 2X Long MSTR Daily Target ETF) is a highly volatile, leveraged instrument that tracking double the daily moves of MicroStrategy; compounding mechanics can lead to massive or total capital loss.
Current Status: The ETF trades at $2.73, riding a massive short-term 58.72% rally over the last week despite a steep -95% loss over the past year.
Technical Analysis: Shares are currently testing the upper bound of a wide $1.60 to $2.85 monthly consolidation box backed by a strong surge in buying volume.
Price Targets: AI-driven consensus outlines an immediate target average of $2.71, spanning a pessimistic floor of $1.50 up to a high-momentum ceiling of $3.86.
Strategic Outlook: Given the sudden vertical extension, aggressive buyers should anticipate a short-term pullback toward the middle of the trading channel before a sustainable trend reversal occurs.
#SamsungFalls8.97%DraggingKospiDown3.24%
#BrentDrops1.87%
#BitcoinOpenInterestFallsToTwoMonthLow
#BitcoinRises23.6%Weekly
MSTRB+0.12%
MSTUETF-3.17%
3
1.9k
Log in to explore more content
Join global crypto users on Binance Square
⚡️ Get latest and useful information about crypto.
💬 Trusted by the world’s largest crypto exchange.
👍 Discover real insights from verified creators.
Email / Phone number
Trending Topics
1
#JobsReportRaisesHikeOdds
6,321 views
224 Discussing
2
#US Data Center Rules May Constrain AI Expansion
1,220 views
37 Discussing
3
#CanUSStocksReboundAfterNonfarmPayrolls?
16,997 views
472 Discussing
4
#BinanceReopensWithdrawalsForMoreAssets
1.2M views
6,566 Discussing
5
#$2TWipedOutHedgeFundsFaceLiquidation
6,664 views
61 Discussing
6
#USNovemberMichiganExpectationsIndexPrelimAt50.9
0 views
23 Discussing
7
#AnthropicIPOValuationDoubts
46,345 views
806 Discussing
8
#OilPlungesBelow$100
2,066 views
23 Discussing
9
#USMidtermsCouldShakeUpUS-IranTies
12,999 views
249 Discussing
10
#RussianCentralBankNamesBTCETHUSDTForNonQualifiedInvestors
120 views
3 Discussing