

#luna2
luna2
792,466 views
2,070 Discussing
Hot
Latest

$LUNA2 - Short Opportunity 💎
{future}(LUNA2USDT)
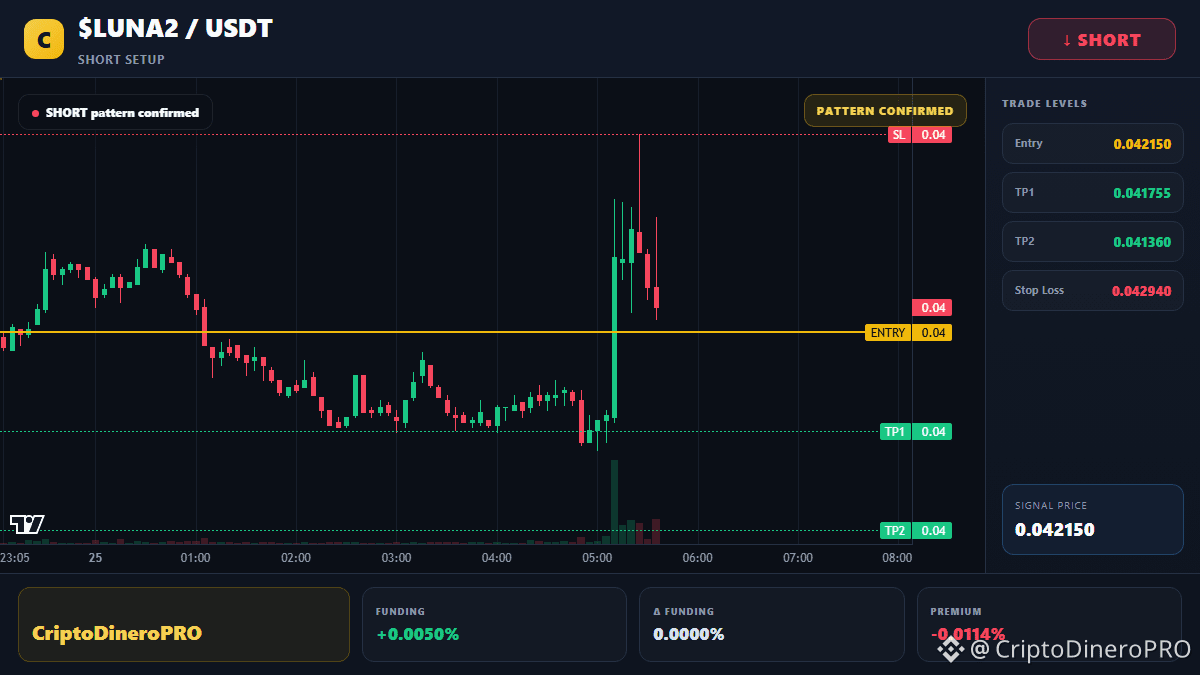
📍 Entry: 0.042150
🛑 Stop Loss: Above 0.042940
🎯 Targets:
• TP1: 0.041755
• TP2: Below 0.041360
DYOR.
#LUNA2 #LUNA2USDT
$LUNA2 - Short Opportunity 💎
📍 Entry: 0.042150
🛑 Stop Loss: Above 0.042940
🎯 Targets:
• TP1: 0.041755
• TP2: Below 0.041360
DYOR.
#LUNA2 #LUNA2USDT
📍 Entry: 0.042150
🛑 Stop Loss: Above 0.042940
🎯 Targets:
• TP1: 0.041755
• TP2: Below 0.041360
DYOR.
#LUNA2 #LUNA2USDT
28

·
--
🟢 $LUNA2 SMASHES THROUGH RESISTANCE TO DELIVER A MASSIVE PROFIT RUN! 💥
That setup on $LUNA2 just printed clean green as buyers took total control of the order flow. When momentum builds off the lower timeframe base, smart money shifts into high gear and clears out the overhead sell walls with zero hesitation. 📊
Patience in executing high-probability structures always pays off when the market expands. ⚡ Risk management was tight, and the trajectory unfolded exactly as anticipated as volume surged through key resistance. 💡
💬 Did you lock in your gains on this expansion wave or are you letting a trailing piece run higher? 👇
⚠️ Not financial advice. Always manage your risk. 🛡️
🏷️ #LUNA2 #Altcoins #Profit #Breakout #Crypto
🔥 💎
3

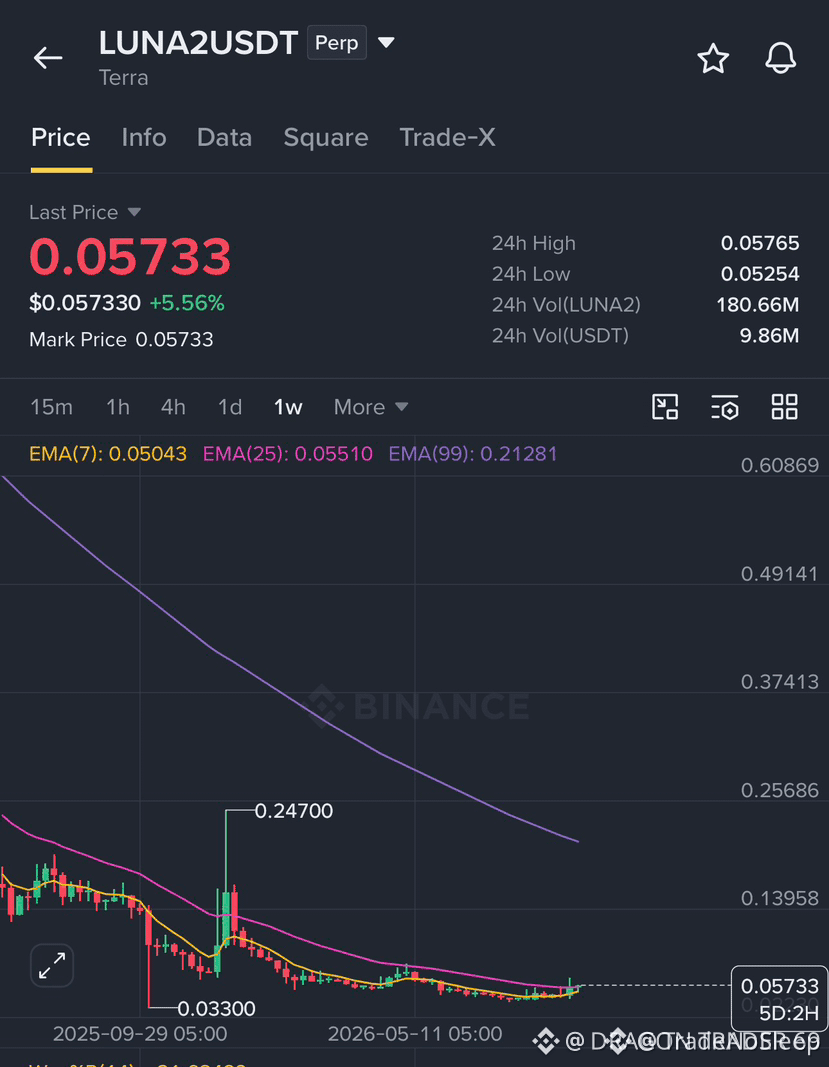
🚀 $LUNA2 ON THE VERGE OF AN ULTRA PUMP? 📈
The recent spike to $0.24 acted like a teaser, a pre‑pump that just burned through thin liquidity, leaving a fresh order block hungry for the next wave. 📊 Smart money already stacked on the buy side, and the depth chart shows a widening gap ready to be filled.
If the sellers get swept, we could see a rapid thrust toward the next resistance, and volume should roar as the whales flip the script. ⚡ Keep your eyes on the order flow and be ready to ride the surge when the breakout fires. 💡
💬 Are you positioned to catch the next LUNA2 surge or waiting for the liquidity sweep to confirm? 👇
⚠️ Not financial advice. Always manage your risk. 🛡️
🏷️ #LUNA2 #LongSetup #Momentum #Crypto
🔥 💎
9

$LUNA2 LONG
Can this setup hold at the average as the price moves upward, or will the risk of a reversal prove stronger?
The trajectory is based on calculating successive upward steps, with a protective level as a safeguard. If the market begins to follow a positive scenario, the first take-profit can be considered at the nearest level, leaving room for further upside potential closer to the upper boundary, while the protective barrier helps control a possible drawdown.
➡️Entry point: 0.04474
🎯Take profit 1: 0.04540961 (+1.50%)
🎯Take profit 2: 0.04615922 (+3.17%)
🎯Take profit 3: 0.04728363 (+5.69%)
🛡Protection: 0.04353559 (-2.69%)
⚠️ This is not financial advice. Trade at your own risk. DYOR.
#LUNA2 #altcoins #cryptotrading 📈
$LUNA2
17

·
--
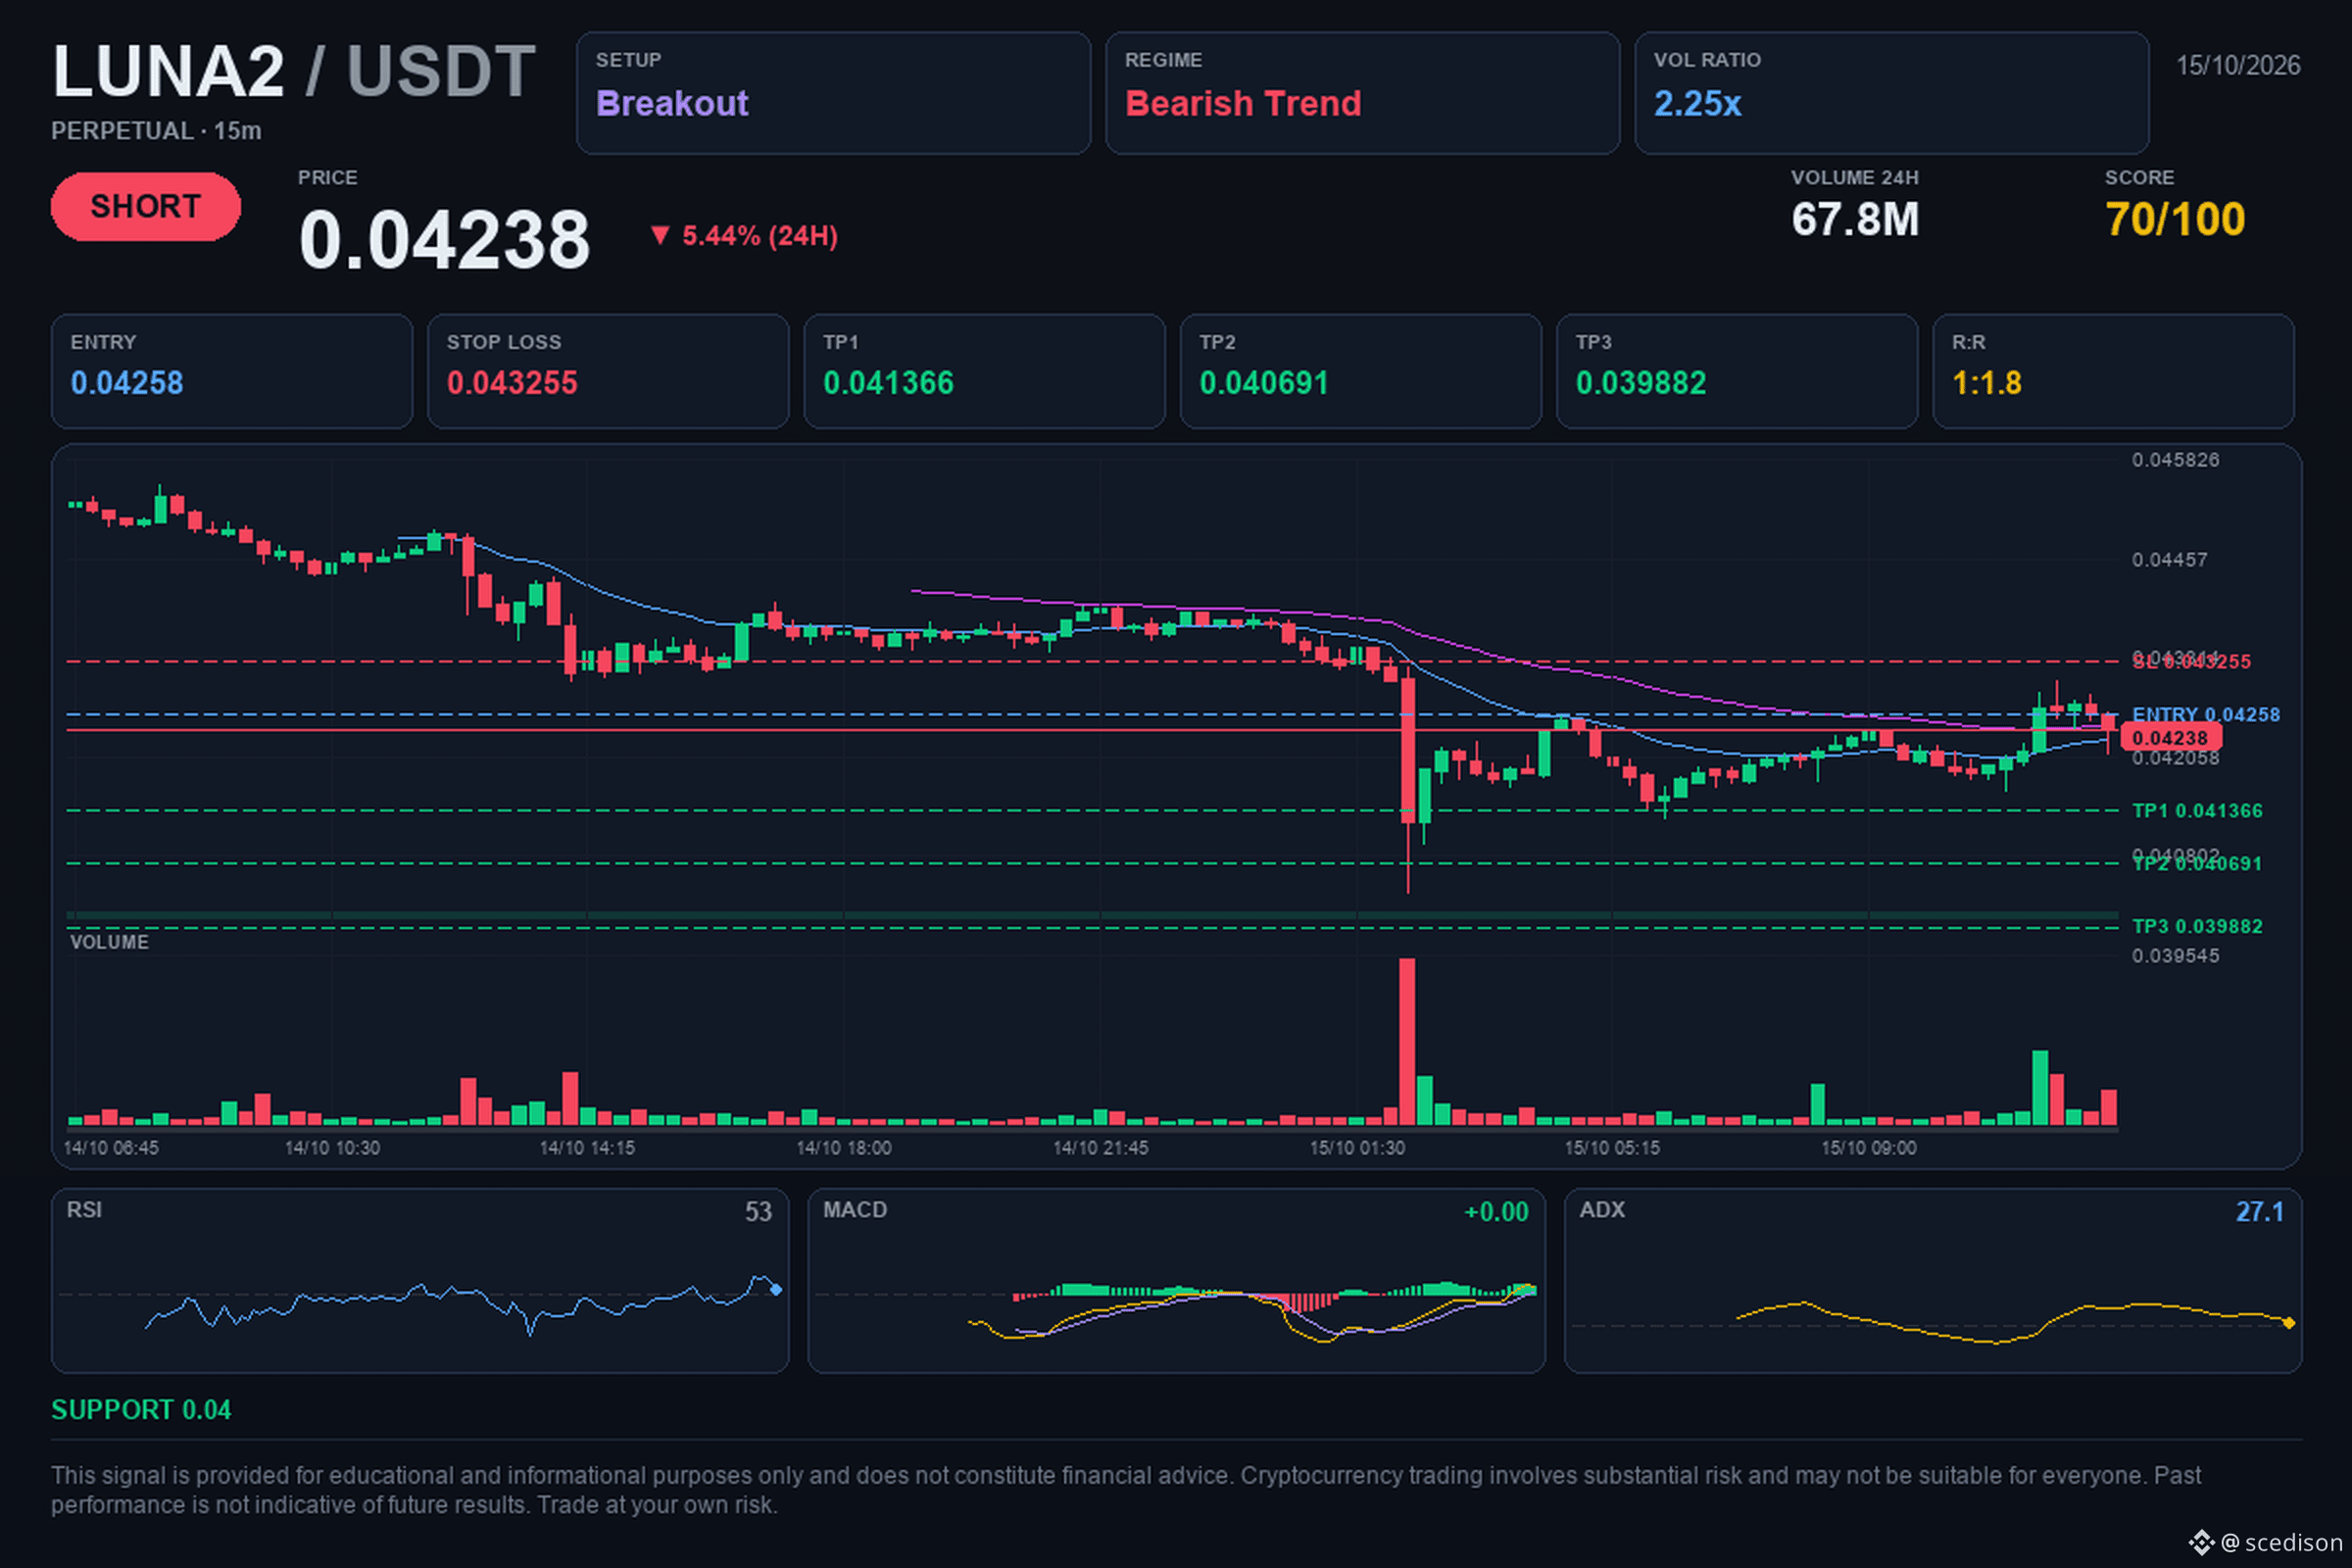
📢 $LUNA2 / USDT | 🔴 SHORT | ⭐ 71%
🎯 Target: $0.04136582. Will it reach it?
🎯 Trading levels:
🔴 Entry: $0.04258
🛑 Stop Loss: $0.043255
🏁 TP1: $0.041366
🏁 TP2: $0.040691
🏁 TP3: $0.039882
📈 Analysis:
The asset shows a consolidated bearish structure on daily and four-hour timeframes, marked by the formation of lower highs. A significant increase in trading volume, above average, is evident, along with a break of key levels that reinforces the current selling pressure. Volatility is in an expansion phase, suggesting a stronger market move.
⚖️ Risk/Reward: 1:1.8
⏱️ Timeframe: 15M
💭 The bearish structure is confirmed when the price breaks previous support levels, indicating that sellers are in control of the move.
#crypto #LUNA2 #trading #Bearish
💡 This analysis is for educational purposes and does not constitute financial advice. Do your own research and make decisions calmly.
13

·
--
⚡ $LUNA2 COMPRESSING ABOVE DEMAND AFTER IMPULSE EXPANSION 📈
Entry: 0.05616 🟢
Target: 0.0578432 🚀
Stop Loss: 0.0544768 ⚠️
Price is currently consolidating following an impulsive expansion, allowing institutional order flow to rebalance above the key demand block. 📊 Disciplined operators wait for execution inside the retest zone rather than chasing breakout momentum directly into immediate resistance.
🔍 Scenario invalidation sits clearly below 0.0544768, establishing a high-convexity setup toward upper structural efficiency zones. 💡 Position sizing and patient entry execution remain critical while liquidity builds across the range. 💬 Are you setting limit orders at the retest level or waiting for secondary market structure confirmation? 👇
⚠️ Not financial advice. Always manage your risk. 🛡️
🏷️ #LUNA2 #Crypto #SmartMoney #Altcoins #MarketStructure
🎯 🦈
15

·
--
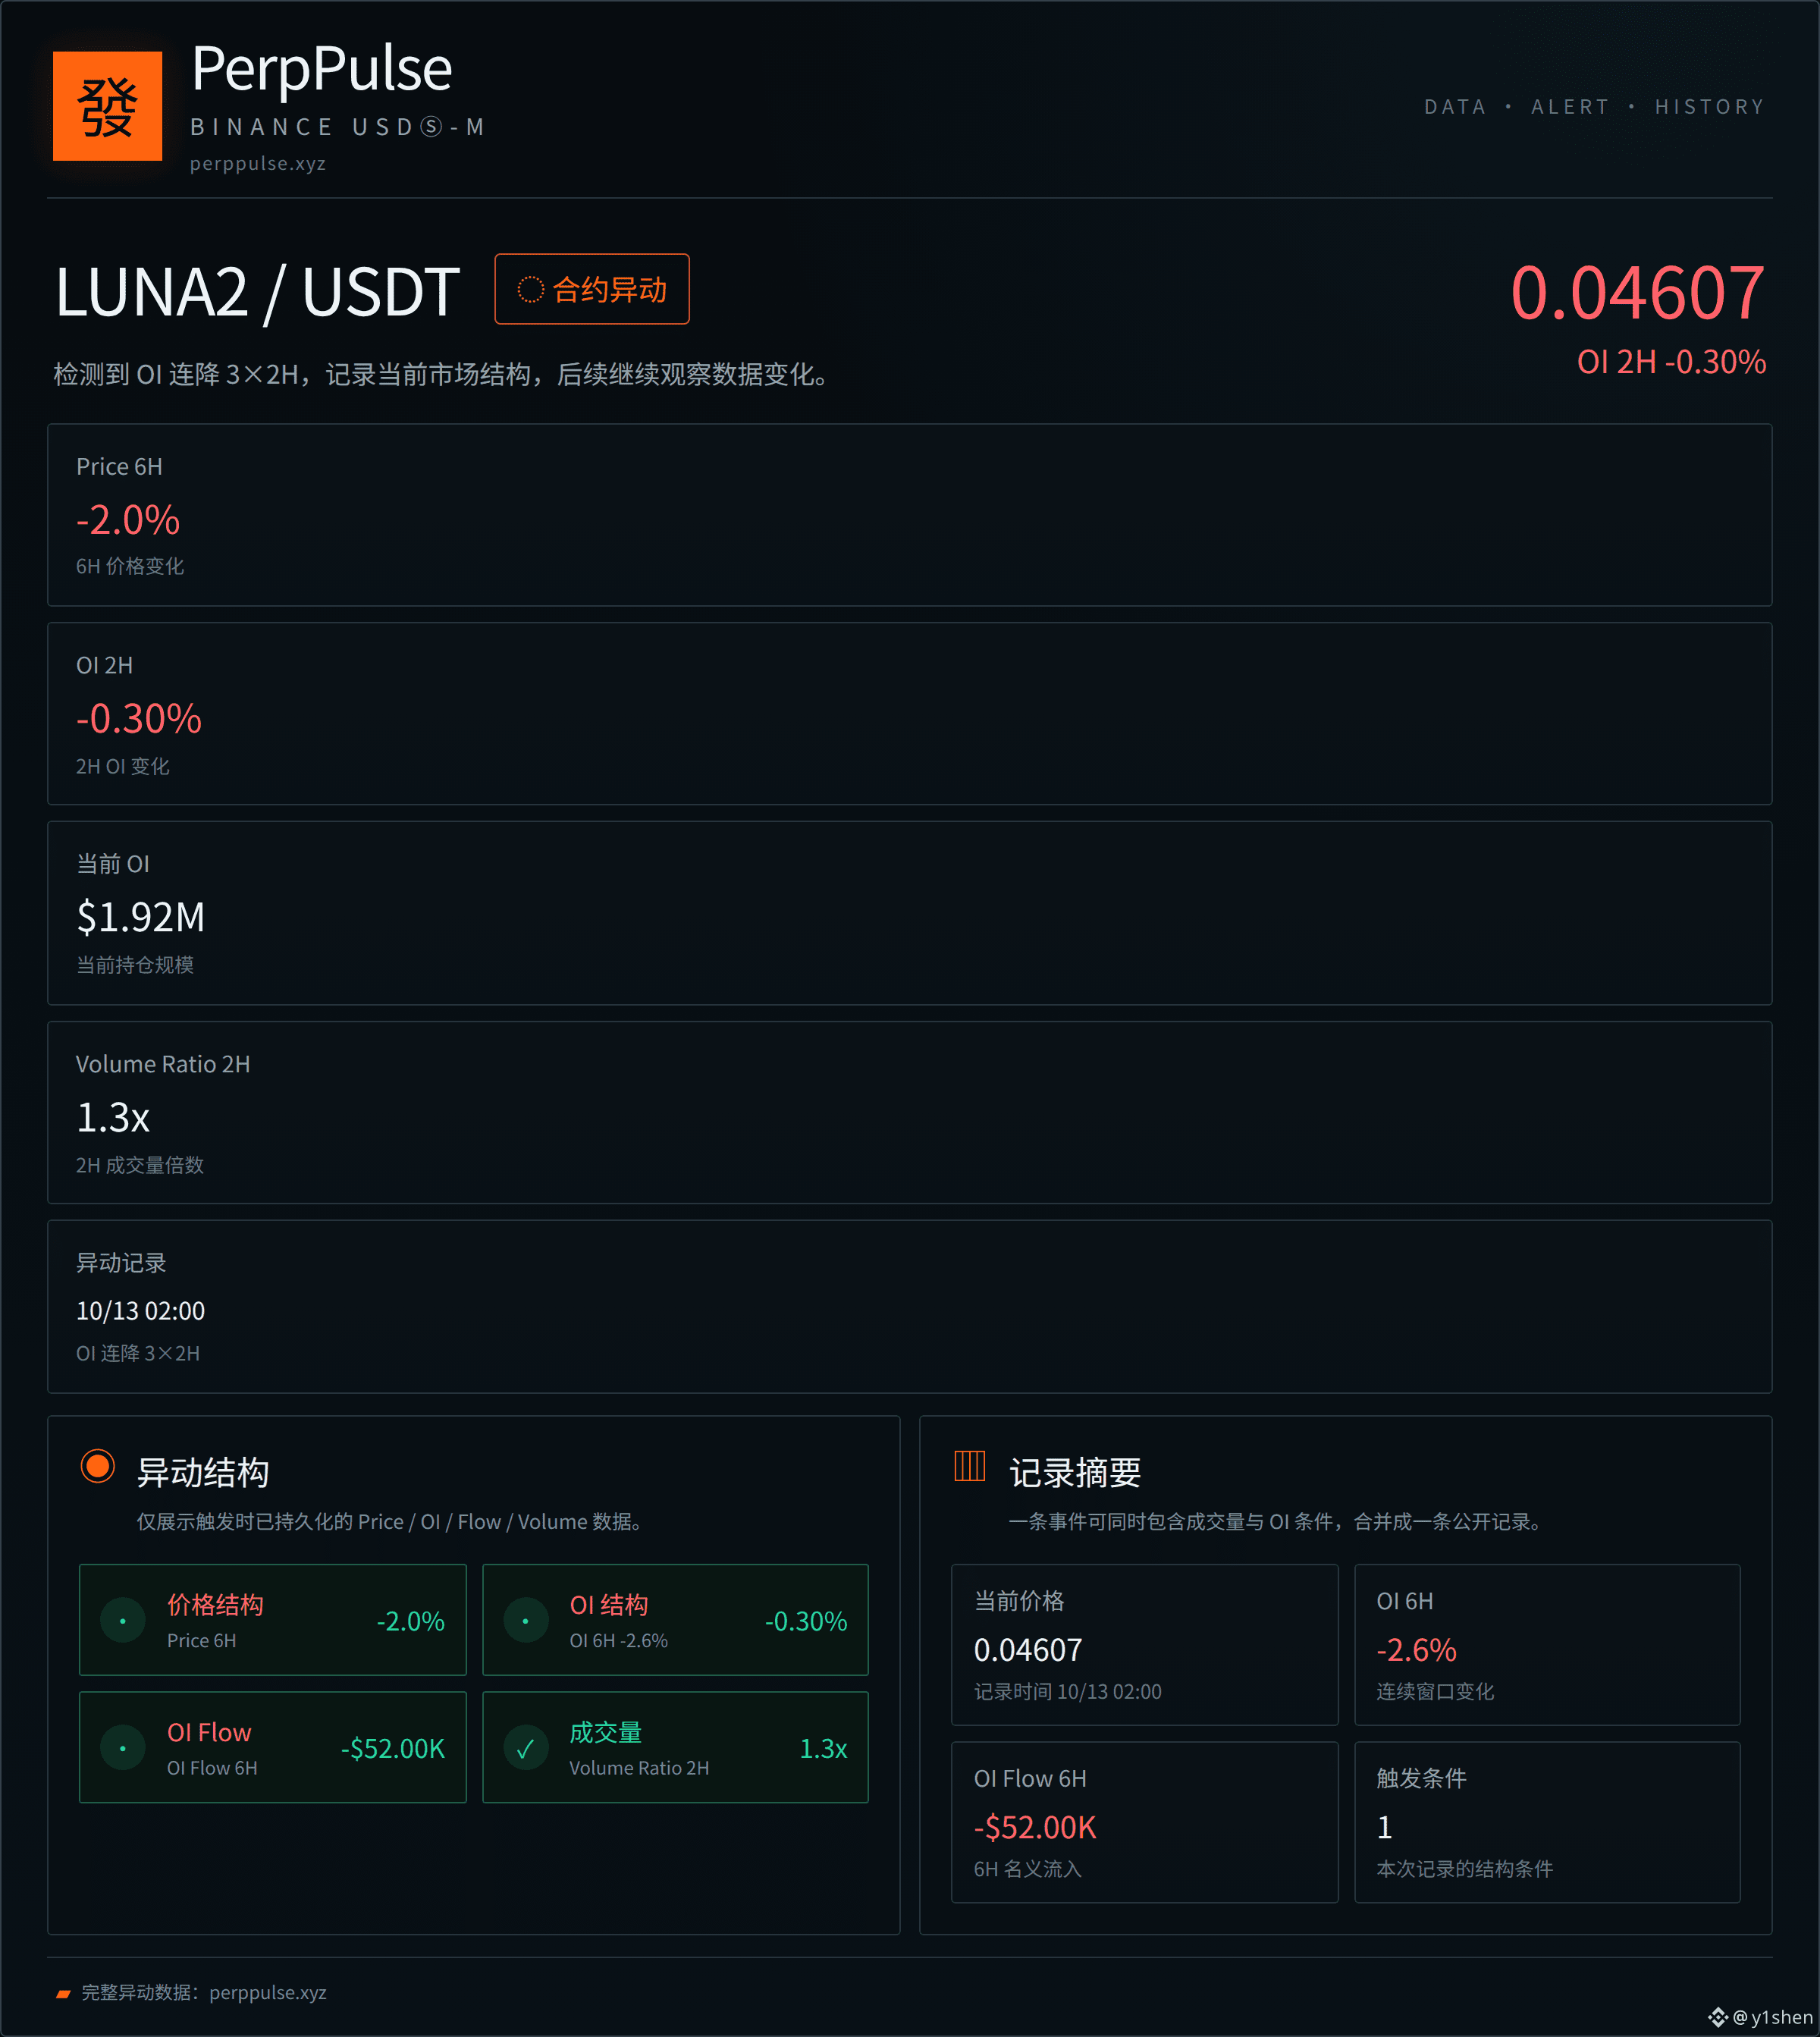
A few hours ago, the system first recorded a contract structure change at $LUNA2 : OI declined for 3×2H.
The only actual condition recorded this time was one: open interest fell continuously across three 2-hour windows. On the same timeline, the 2H volume ratio was about 1.3, OI 6-hour change was -2.6%, price 6-hour change was -2.0%, and the current observation level was 0.04607. No stronger OI Flow condition was confirmed, and no continuous 3×2H OI Flow condition was recorded either.
What is worth noticing is that price and open interest weakened together; this was the objectively recorded combination in this segment, rather than a simple fluctuation in trading volume. It shows that during this period, the exit of leveraged positions and the price pullback happened at the same time.
As for whether this is a phase adjustment or a longer structural shift, the current data is still not enough to draw a conclusion. For now, place this recorded level and the 6-hour magnitude of change on the watchlist and wait for more signals from subsequent windows.
$LUNA2 #LUNA2 #Crypto
📌 Verifiable record
Type: OI declined for 3×2H
Record time: 2026-10-13 02:00 +0800
Record level: 0.04607
Price 6H: -2.0%
OI 2H: -0.3%
OI 6H: -2.6%
OI Flow 6H: -52456.98
Vol 2H: 1.3x
Full anomaly data: perppulse.xyz
4
$LUNA2 LONG
1. If the scenario continues upward, consider the specified trade boundary as a protective stop.
2. The initial target marks the first specified target, while the subsequent targets extend the move.
➡️Entry point: 0.04802
🎯Take profit 1: 0.04893372 (+1.90%)
🎯Take profit 2: 0.04986744 (+3.85%)
🎯Take profit 3: 0.05126802 (+6.76%)
❌Stop-loss: 0.04659942 (-2.96%)
⚠️ This is not financial advice. Trade at your own risk. DYOR.
#LUNA2 #WLD #Worldcoin 📈
$LUNA2
34

·
--
Bearish
LUNA2 longs lost $3K around $0.05078.
This downside sweep keeps lower liquidity in play.
$LUNA2
{future}(LUNA2USDT)
$GTC
{future}(GTCUSDT)
$RLC
{future}(RLCUSDT)
🔴 LIQUIDITY ZONE HIT 🔴
Long liquidation spotted 🧨
$3.0033K cleared at $0.05078
Downside liquidity swept — watch reaction 👀
🎯 TP Targets:
TP1: ~$0.05027
TP2: ~$0.04976
TP3: ~$0.04926
#LUNA2
LUNA2 longs lost $3K around $0.05078.
This downside sweep keeps lower liquidity in play.
$LUNA2
$GTC
$RLC
🔴 LIQUIDITY ZONE HIT 🔴
Long liquidation spotted 🧨
$3.0033K cleared at $0.05078
Downside liquidity swept — watch reaction 👀
🎯 TP Targets:
TP1: ~$0.05027
TP2: ~$0.04976
TP3: ~$0.04926
#LUNA2
This downside sweep keeps lower liquidity in play.
$LUNA2
$GTC
$RLC
🔴 LIQUIDITY ZONE HIT 🔴
Long liquidation spotted 🧨
$3.0033K cleared at $0.05078
Downside liquidity swept — watch reaction 👀
🎯 TP Targets:
TP1: ~$0.05027
TP2: ~$0.04976
TP3: ~$0.04926
#LUNA2
129
$LUNA2 LONG
1. Buyers are focused on developing an upward movement, maintaining control over price action near the key position-building zone.
2. A consistent upward move increases the chances of overcoming intermediate targets without deep pullbacks.
3. The bullish sentiment remains as long as the quotes are above the protective levels.
🏁Entry: 0.05201
💰Target 1: 0.05278191 (+1.48%)
💰Target 2: 0.05363382 (+3.12%)
💰Target 3: 0.05491168 (+5.58%)
⛔️Stop: 0.05065214 (-2.61%)
⚠️ This is not financial advice. Trade at your own risk. DYOR.
#LUNA2 #CryptoNews #BTC 📈
$LUNA2
16
$LUNA2 LONG
1. Buyers hold initiative within the current range, setting the stage for further growth.
2. The local price action structure remains bullish as long as quotes stay above the protective levels.
3. The plan assumes a gradual achievement of the outlined targets as the upward impulse develops.
➡️Entry point: 0.05453
💰Target 1: 0.05551434 (+1.81%)
💰Target 2: 0.05652868 (+3.67%)
💰Target 3: 0.05805018 (+6.46%)
❌Stop-loss: 0.05297849 (-2.85%)
⚠️ This is not financial advice. Trade at your own risk. DYOR.
#LUNA2 #TradingSignals #MarketAnalysis 📈
$LUNA2
36

·
--
🚀 $LUNA2 PREPARED FOR AN ULTRA PUMP? 📈
Smart money has already cleared a demand block at 0.24, turning it into a pre‑pump springboard. The recent absorption of sell orders signals a liquidity hunt, and the order block is now primed for a fresh influx of capital. 📊
On‑chain inflows are ticking up, and the 4H chart reveals a widening fair‑value gap that the market will likely fill on breakout. Keep an eye on volume spikes and the next order‑block retest as the catalyst for the next thrust. 🦈 ⚡
💬 Are you loading your position now or waiting for the next liquidity sweep? 👇
⚠️ Not financial advice. Always manage your risk. 🛡️
🏷️ #LUNA2 #LongSetup #Pump #SmartMoney #Crypto
🔥 💎
9

·
--
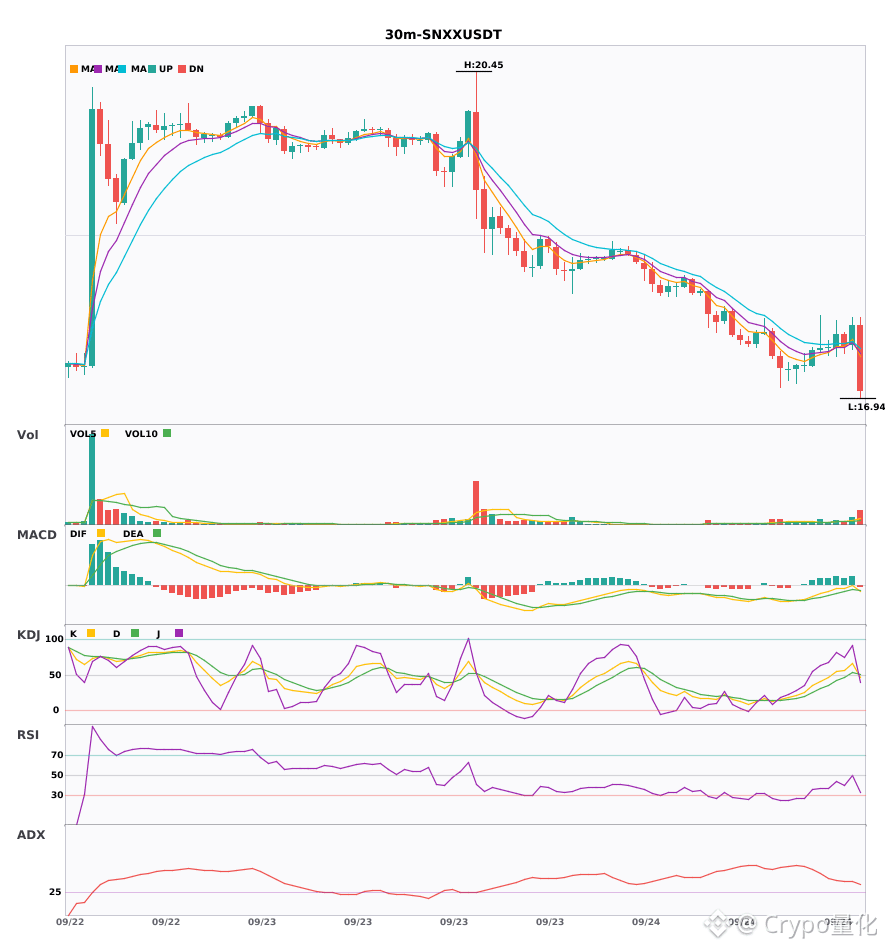
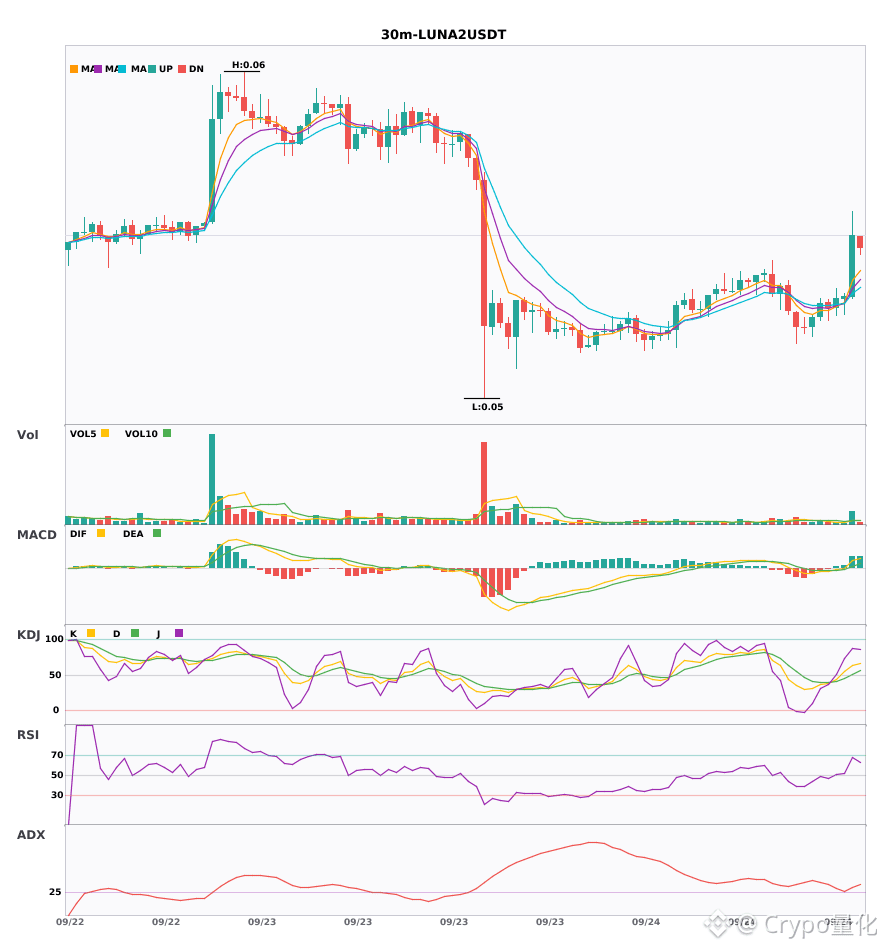
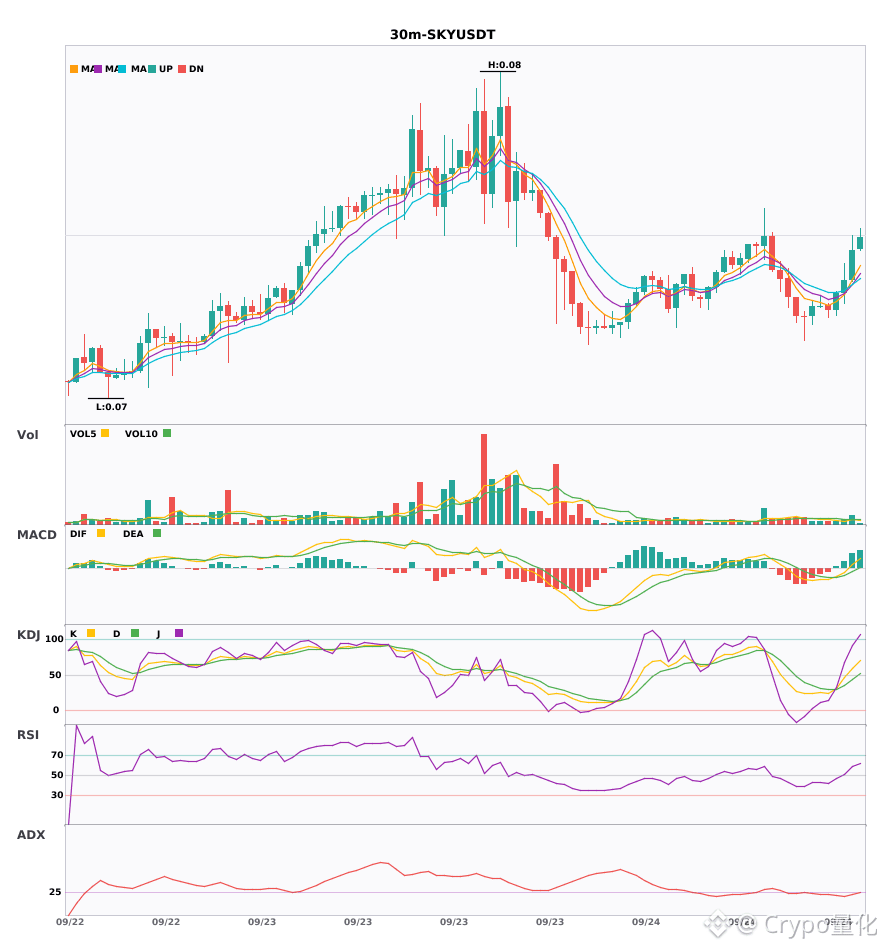
$SNXX / $LUNA2 / $SKY 30 minutes, bullish heads disperse together—who has the strongest breakout power?🔥
════════════════════
🔴 $SNXX 30 minutes Bullish signal
⚠️ Technicals: ADX 38 indicates a strong trend. After the MACD golden cross, it breaks above the zero line and turns bullish. Moving averages are sticking together, building up momentum for a potential move. The K line crossing above D has not entered overbought territory, and volume has increased by 1.9x.
════════════════════
🔴 $LUNA2 30 minutes Bullish signal
⚠️ Technicals: ADX 33 shows a clearly trending market. The MACD golden cross comes with expanding red histogram bars. Moving averages are arranged bullishly, diverging upward. The K line crossing above D has not entered overbought territory, and trading volume has increased by 2.8x.
════════════════════
🔴 $SKY 30 minutes Bullish signal
⚠️ Technicals: The trend is just forming. MACD breaks out with increased volume above the zero line and turns bullish. The short-term moving averages have just produced a golden cross. Volume has increased by 1.7x—can consider entry.
════════════════════
🔔 Follow to get the first-hand market action alerts 🔔
#技术分析 #SNXX #LUNA2 #SKY
📌 When trading, pay attention to whether the candlestick pattern fits
════════════════════
🔴 $SNXX 30 minutes Bullish signal
⚠️ Technicals: ADX 38 indicates a strong trend. After the MACD golden cross, it breaks above the zero line and turns bullish. Moving averages are sticking together, building up momentum for a potential move. The K line crossing above D has not entered overbought territory, and volume has increased by 1.9x.
════════════════════
🔴 $LUNA2 30 minutes Bullish signal
⚠️ Technicals: ADX 33 shows a clearly trending market. The MACD golden cross comes with expanding red histogram bars. Moving averages are arranged bullishly, diverging upward. The K line crossing above D has not entered overbought territory, and trading volume has increased by 2.8x.
════════════════════
🔴 $SKY 30 minutes Bullish signal
⚠️ Technicals: The trend is just forming. MACD breaks out with increased volume above the zero line and turns bullish. The short-term moving averages have just produced a golden cross. Volume has increased by 1.7x—can consider entry.
════════════════════
🔔 Follow to get the first-hand market action alerts 🔔
#技术分析 #SNXX #LUNA2 #SKY
📌 When trading, pay attention to whether the candlestick pattern fits
73
·
--
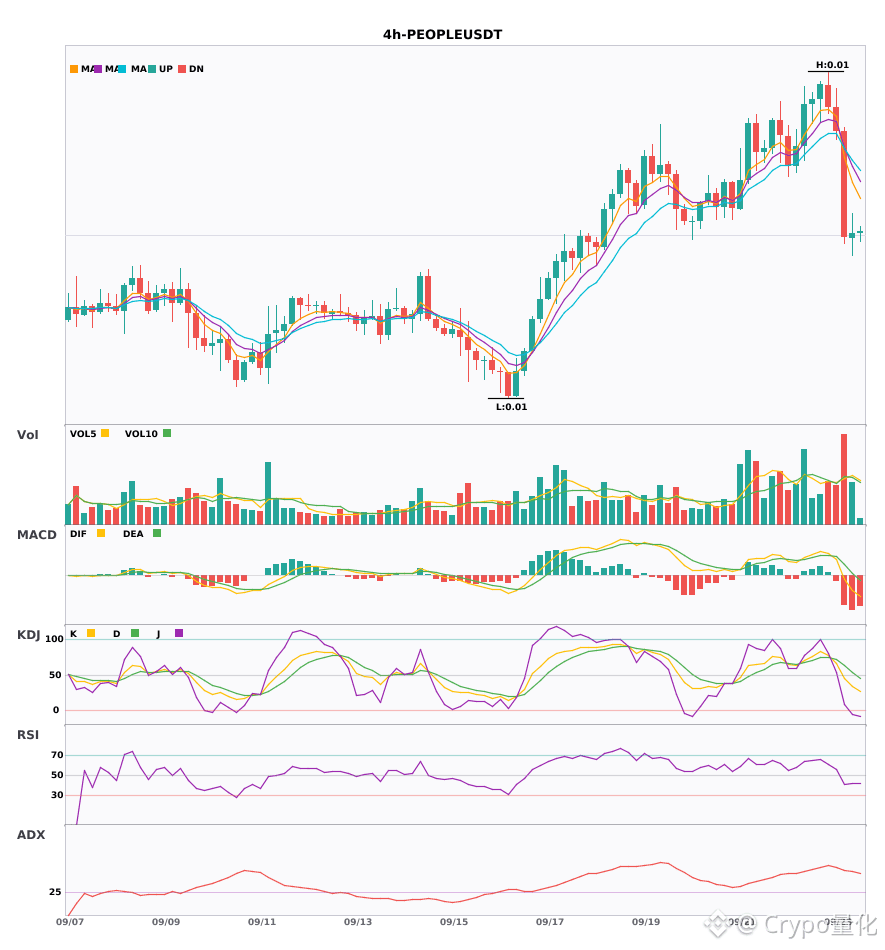
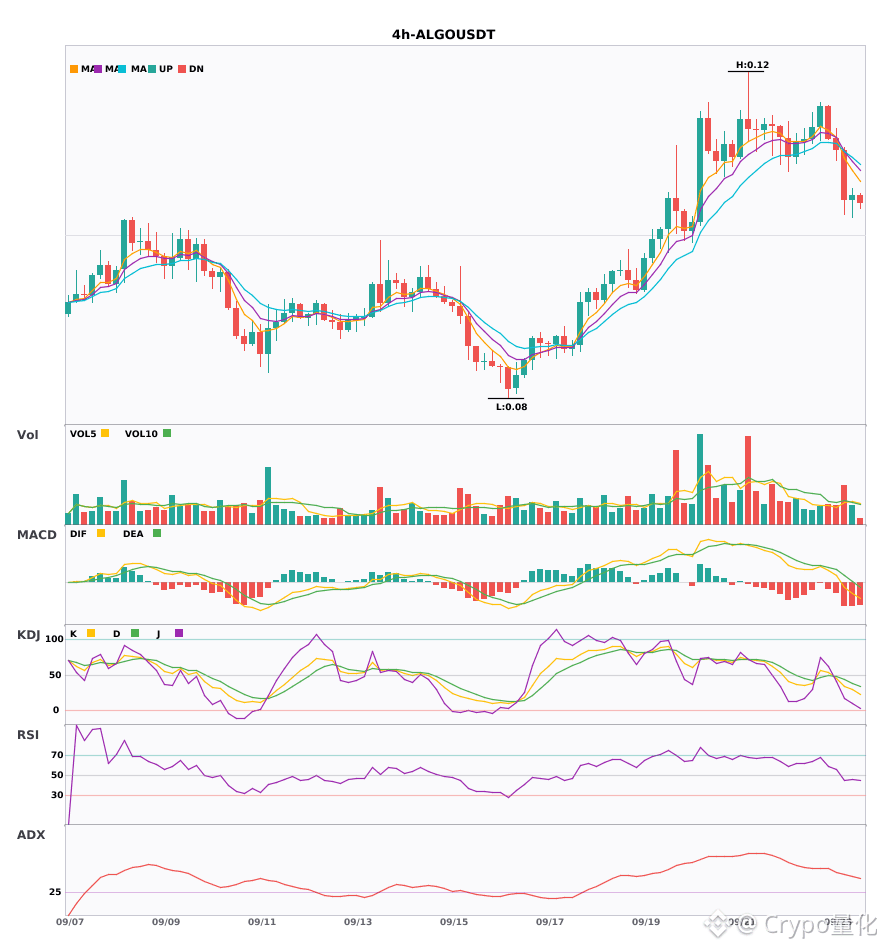
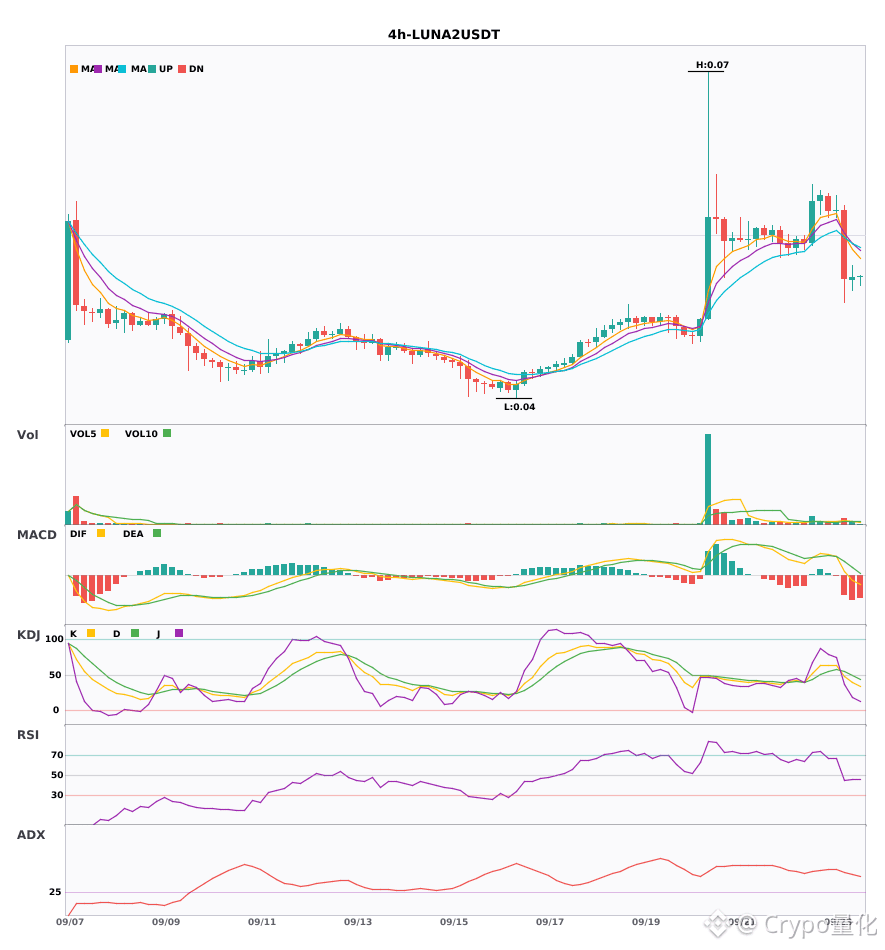
$PEOPLE $ALGO $LUNA2 4 hours resonance shifts to short—everyone is showing bearish signals 🔥
════════════════════
🟢 $PEOPLE 4 hours bearish signal
⚠️ Technicals: ADX reached 50—trend is strong; watch for an overheated pullback. MACD bearish momentum is relatively weak, but downside momentum is strengthening. 5/8/13 EMA are stacked bearishly, with volume up 1.9x.
════════════════════
🟢 $ALGO 4 hours bearish signal
⚠️ Technicals: ADX (41) shows a clear trending market. MACD is running in bearish mode—trend is weak; momentum is increasing. EMA5 is below EMA8, which is below EMA13—bearish alignment. KDJ is weak and bearish dominates (K is 29.2, D is 38.7). Trading volume expands (1.6x).
════════════════════
🟢 $LUNA2 4 hours bearish signal
⚠️ Technicals: ADX (45) indicates a clear trending market. MACD DIF breaks below the zero line—trend turns bearish. EMA5 is below EMA8, which is below EMA13—bearish alignment. KDJ is weak and bearish dominates (K is 39.2, D is 49.4). Trading volume expands (2.1x).
════════════════════
🔔 Watch for first-hand intraday updates on unusual moves 🔔
#技术分析 #PEOPLE #ALGO #LUNA2
📌 When trading, pay attention to whether the candlestick patterns match
════════════════════
🟢 $PEOPLE 4 hours bearish signal
⚠️ Technicals: ADX reached 50—trend is strong; watch for an overheated pullback. MACD bearish momentum is relatively weak, but downside momentum is strengthening. 5/8/13 EMA are stacked bearishly, with volume up 1.9x.
════════════════════
🟢 $ALGO 4 hours bearish signal
⚠️ Technicals: ADX (41) shows a clear trending market. MACD is running in bearish mode—trend is weak; momentum is increasing. EMA5 is below EMA8, which is below EMA13—bearish alignment. KDJ is weak and bearish dominates (K is 29.2, D is 38.7). Trading volume expands (1.6x).
════════════════════
🟢 $LUNA2 4 hours bearish signal
⚠️ Technicals: ADX (45) indicates a clear trending market. MACD DIF breaks below the zero line—trend turns bearish. EMA5 is below EMA8, which is below EMA13—bearish alignment. KDJ is weak and bearish dominates (K is 39.2, D is 49.4). Trading volume expands (2.1x).
════════════════════
🔔 Watch for first-hand intraday updates on unusual moves 🔔
#技术分析 #PEOPLE #ALGO #LUNA2
📌 When trading, pay attention to whether the candlestick patterns match
276

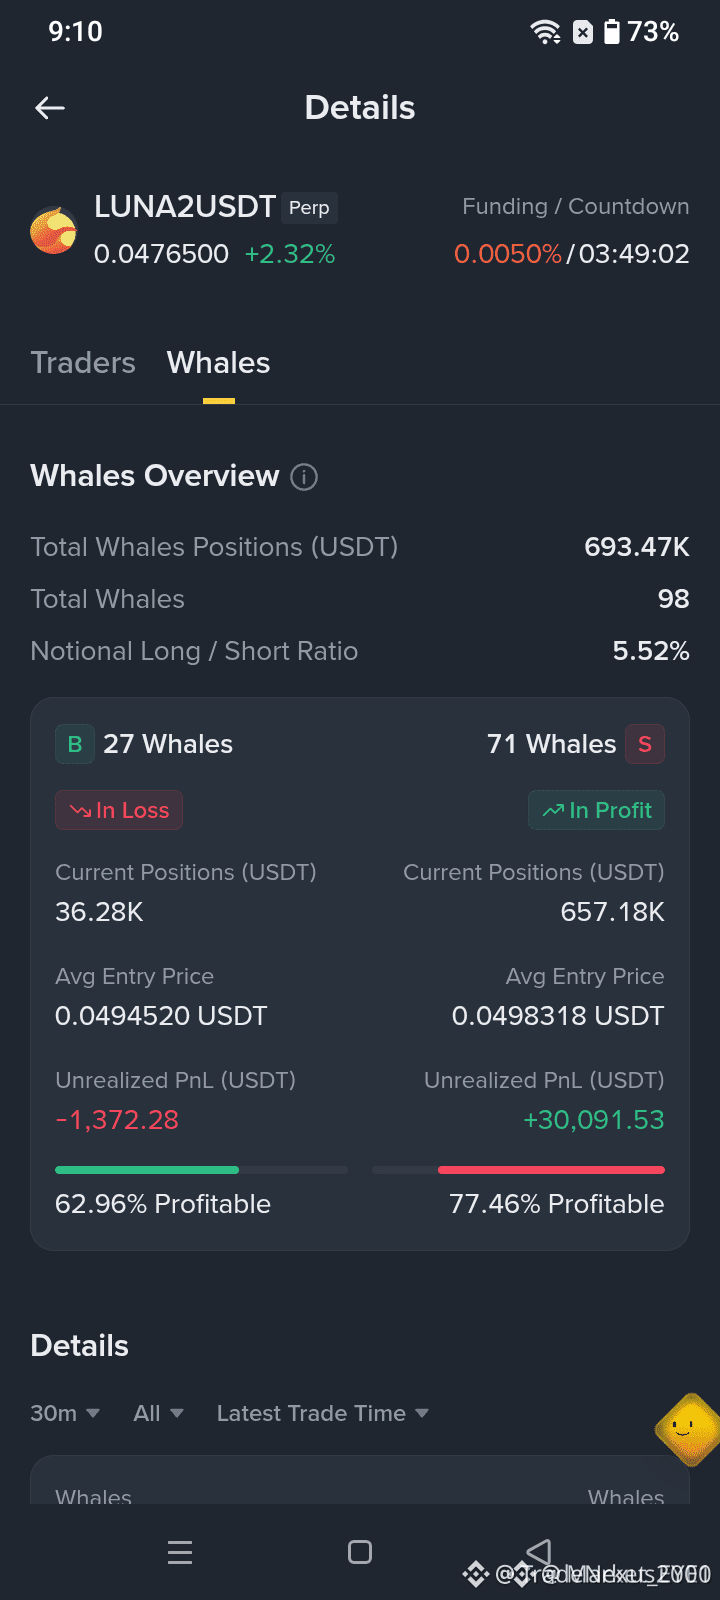
$LUNA2 71 WHALES SHORTING – SMARTER MONEY ALREADY POSITIONED? 🐳
On-chain data reveals 71 distinct whale wallets actively shorting $LUNA2 while retail sentiment remains bullish. Short positions have been building on top-tier exchanges over the past 48 hours, signaling a distribution phase rather than accumulation.
Smart money consistently leads by reading liquidity clusters, not price alone. Are you tracking the order flow or just the chart?
Not financial advice. Always manage your risk.
#LUNA2 #ShortSetup #WhaleActivity #CryptoAnalysis
🎯
29

$LUNA2 Four-hour-level bullish structure established; key technical indicator signals verified.
📈 $LUNA2 | 4-hour bullish signal
━━━━━━━━━━━━━━━━━━
Technical analysis: ADX (26) confirms trend formation, and the MACD bullish crossover above zero releases momentum. EMA5 crosses above EMA8, while the KDJ golden cross confirms the short-term bullish trend. Trading volume increases significantly by 4.8 times.
Price movement: 2.8400%
━━━━━━━━━━━━━━━━━━
#技术分析 #LUNA2
📌 The content above is for reference only and does not constitute investment advice
77

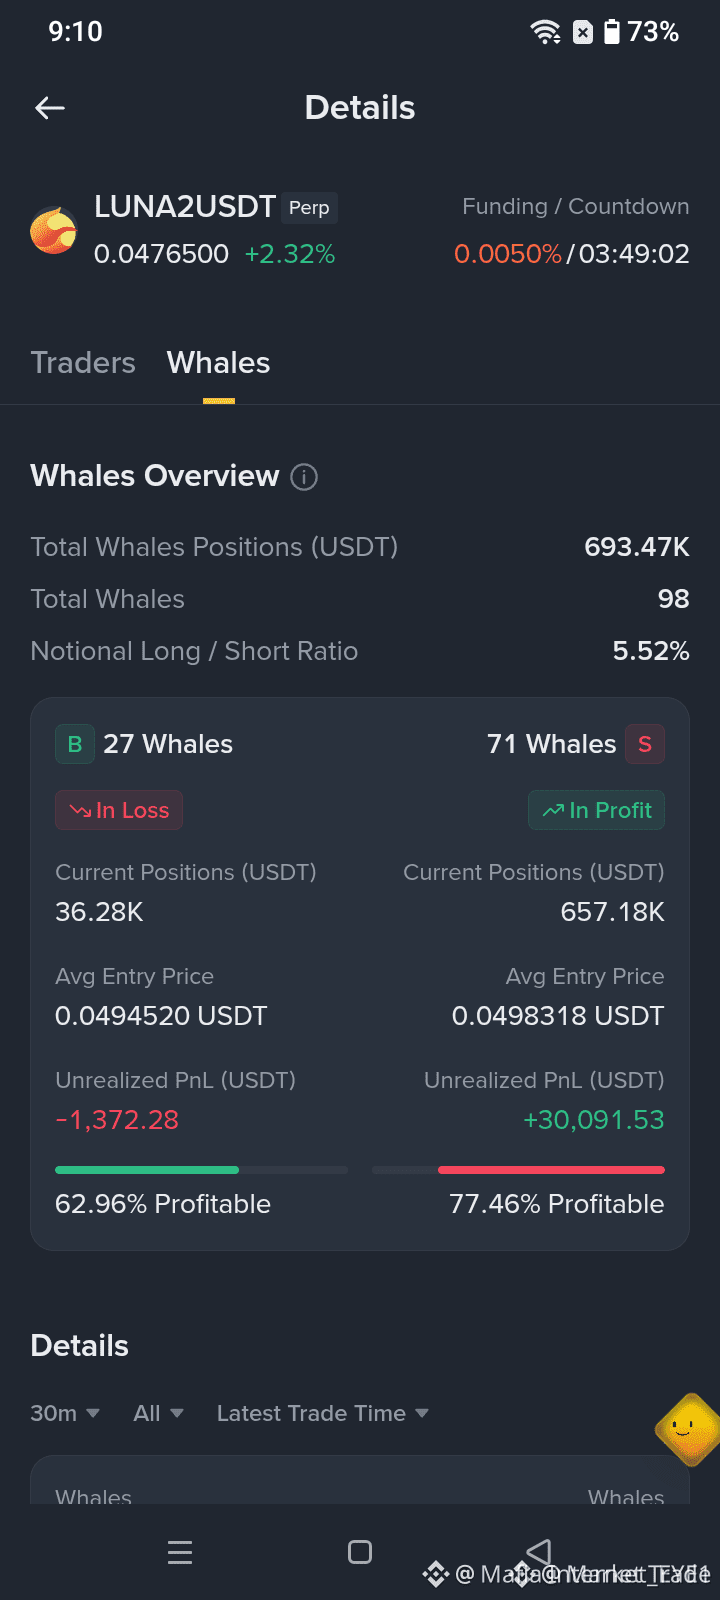
$LUNA2 WHALES ARE SHORTING WHILE THE CROWD IS DISTRACTED 🐳
71 whales have piled into heavy shorts on LUNA2, and they're already taking profits while retail chases the noise. The volume divergence tells me the smart money is positioned ahead of a potential move.
If these whales are unwinding their shorts into strength, that's a signal worth watching. The bid/ask spread is tightening on top-tier exchanges, and momentum is slowing against the trend.
Are you following the whales or getting caught in the crowd?
Not financial advice. Always manage your risk.
#LUNA2 #WhaleActivity #ShortSetup #Crypto #Trading
🐳
53
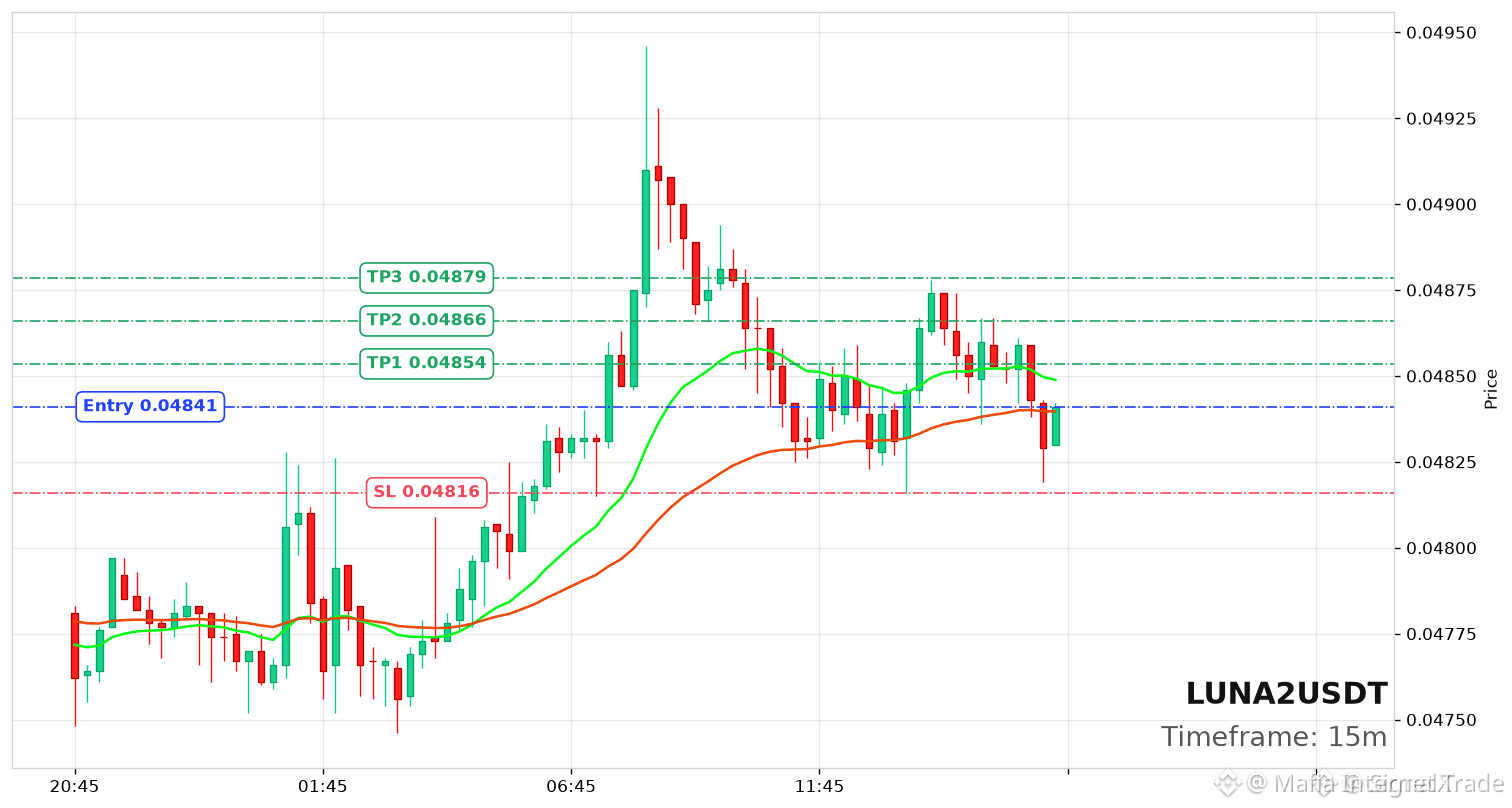
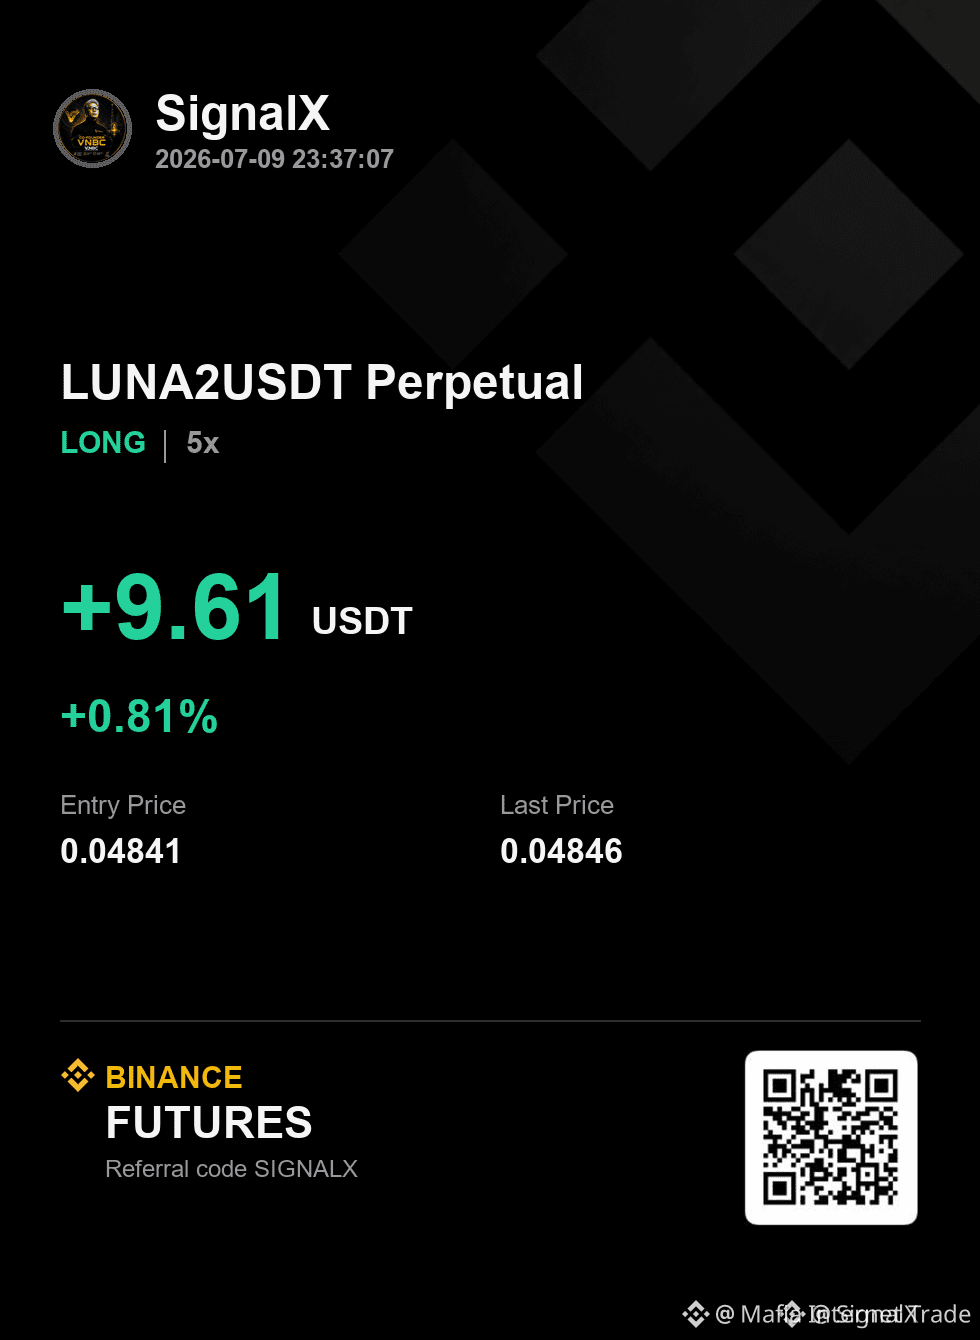
$LUNA2 IS SHOWING A BULLISH EMA CROSS WITH 80% CONFIDENCE 🔥
Entry: 0.04841 🔥
Target: 0.04879 🚀
Stop Loss: 0.04816 ⚠️
The EMA20 just crossed above the EMA50 on the 1H, and the RSI sits at 47.3 — barely above oversold with plenty of room to run. This alignment has led to quick 3-5% flips in the past week alone.
The risk-to-reward is tight here, but that 80% higher-timeframe bias means momentum is on our side. Are you taking this entry or waiting for a retest?
Not financial advice. Always manage your risk.
#LUNA2 #LongSetup #Altcoin #Breakout #Crypto
🔥
51

·
--
Bullish
The short squeeze pick up steam on this extension leg.
Bears throwing in the towel as open interest drops.
$LUNA2
{future}(LUNA2USDT)
🟢 LIQUIDITY ZONE HIT 🟢
Short liquidation spotted 🧨
$8.245K cleared at $0.05107
Upside liquidity swept — watch reaction 👀
🎯 TP Targets:
TP1: ~$0.05158
TP2: ~$0.05209
TP3: ~$0.05260
#luna2
The short squeeze pick up steam on this extension leg.
Bears throwing in the towel as open interest drops.
$LUNA2
🟢 LIQUIDITY ZONE HIT 🟢
Short liquidation spotted 🧨
$8.245K cleared at $0.05107
Upside liquidity swept — watch reaction 👀
🎯 TP Targets:
TP1: ~$0.05158
TP2: ~$0.05209
TP3: ~$0.05260
#luna2
Bears throwing in the towel as open interest drops.
$LUNA2
🟢 LIQUIDITY ZONE HIT 🟢
Short liquidation spotted 🧨
$8.245K cleared at $0.05107
Upside liquidity swept — watch reaction 👀
🎯 TP Targets:
TP1: ~$0.05158
TP2: ~$0.05209
TP3: ~$0.05260
#luna2
150
·
--
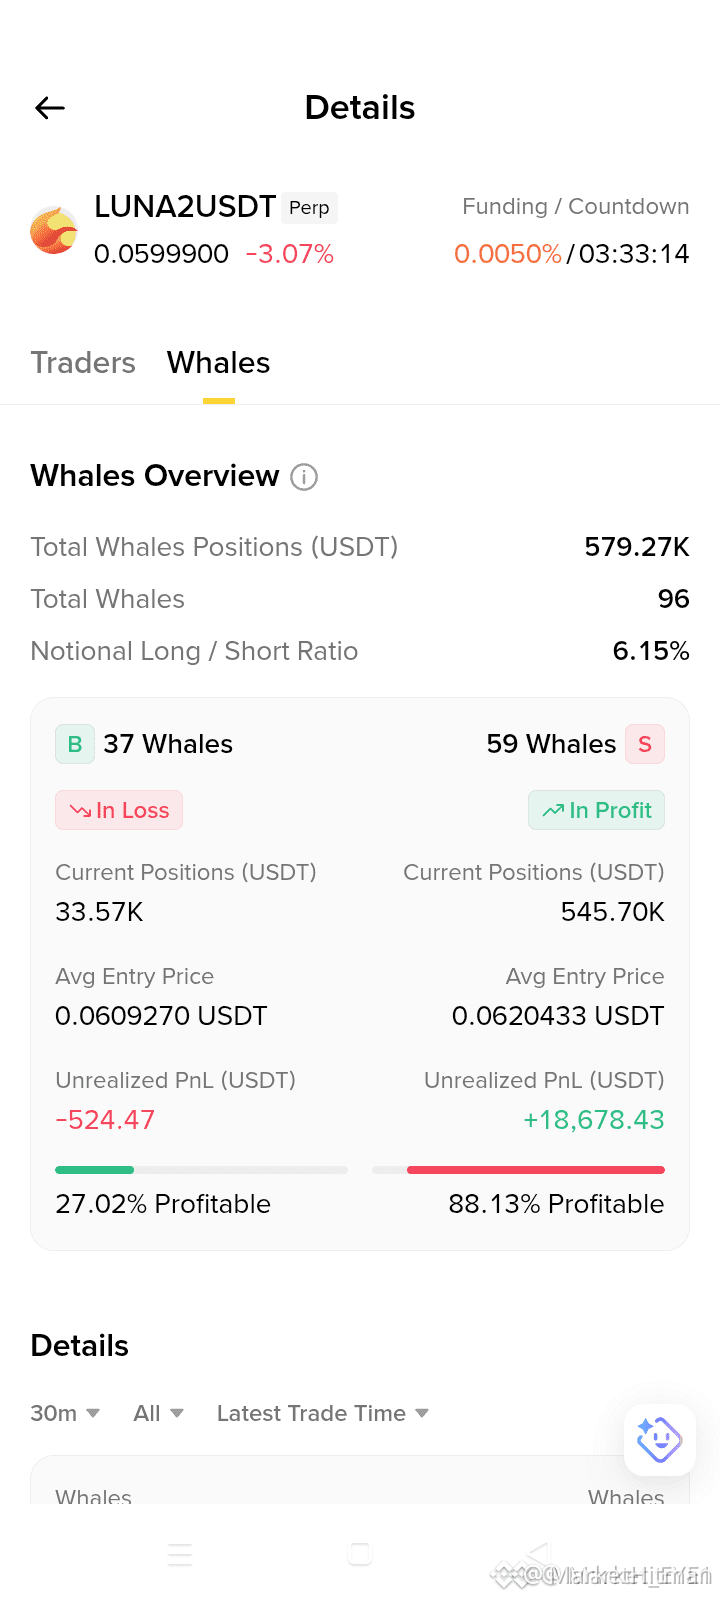
$LUNA2 WHALE SHORTS BUILD AS RETAIL BUYS THE DIP ⚠️
Whale positioning on $LUNA2 shows a clear short-side skew, with 59 of 96 tracked large accounts reportedly short and over $545K in open exposure. Unrealized gains and a high reported win rate suggest momentum currently favors larger accounts, but crowded positioning can reverse quickly if liquidity shifts.
Retail dip-buying against whale-heavy short exposure creates a fragile setup. Serious traders should watch funding, open interest, and liquidation zones before assuming continuation.
Not financial advice. Manage your risk.
#LUNA2 #CryptoTrading #Altcoins #BinanceSquare #MarketAnalysis
⚡
{future}(LUNA2USDT)
$LUNA2 WHALE SHORTS BUILD AS RETAIL BUYS THE DIP ⚠️
Whale positioning on $LUNA2 shows a clear short-side skew, with 59 of 96 tracked large accounts reportedly short and over $545K in open exposure. Unrealized gains and a high reported win rate suggest momentum currently favors larger accounts, but crowded positioning can reverse quickly if liquidity shifts.
Retail dip-buying against whale-heavy short exposure creates a fragile setup. Serious traders should watch funding, open interest, and liquidation zones before assuming continuation.
Not financial advice. Manage your risk.
#LUNA2 #CryptoTrading #Altcoins #BinanceSquare #MarketAnalysis
⚡
72
Log in to explore more content
Join global crypto users on Binance Square
⚡️ Get latest and useful information about crypto.
💬 Trusted by the world’s largest crypto exchange.
👍 Discover real insights from verified creators.
Email / Phone number
Trending Topics
1
#BinancePick
2.5M views
136,552 Discussing
2
#EarningsSeason
4.9M views
23,745 Discussing
3
#ElectrumWalletBugLetRogueServersStealFunds
903 views
77 Discussing
4
#ArgentineCourtDismissesLIBRACaseAgainstMilei
8,057 views
192 Discussing
5
#SKHynixReportedlyPlansSpecialDividendFromKioxiaStakeSale
1,918 views
28 Discussing
6
#KeystoneWebsiteBreachExposesBuyersShippingAddresses
959 views
18 Discussing
7
#USQ3GDPAndSeptemberPCEDueNextWeek
79,180 views
1,005 Discussing
8
#SouthKoreaDelaysCryptoIncomeTax
147,401 views
1,056 Discussing
9
#ElectrumFixesHighRiskExploitInVersionsBefore4.8.3
65,484 views
762 Discussing
10
#SouthKoreaPlansToRegulateStablecoinsUnderFXLaw
63,355 views
677 Discussing