
#luis77
luis77
23,377 views
166 Discussing
Hot
Latest

·
--
Bullish
🚨 Tired of falling into traps? Here’s how we hunt False Breakouts with "Deep Divergence" 🛡️📉
90% of retail traders lose money because they enter the "FOMO" just as whales are distributing or accumulating. The market doesn’t move by price alone; it moves by institutional order flow.
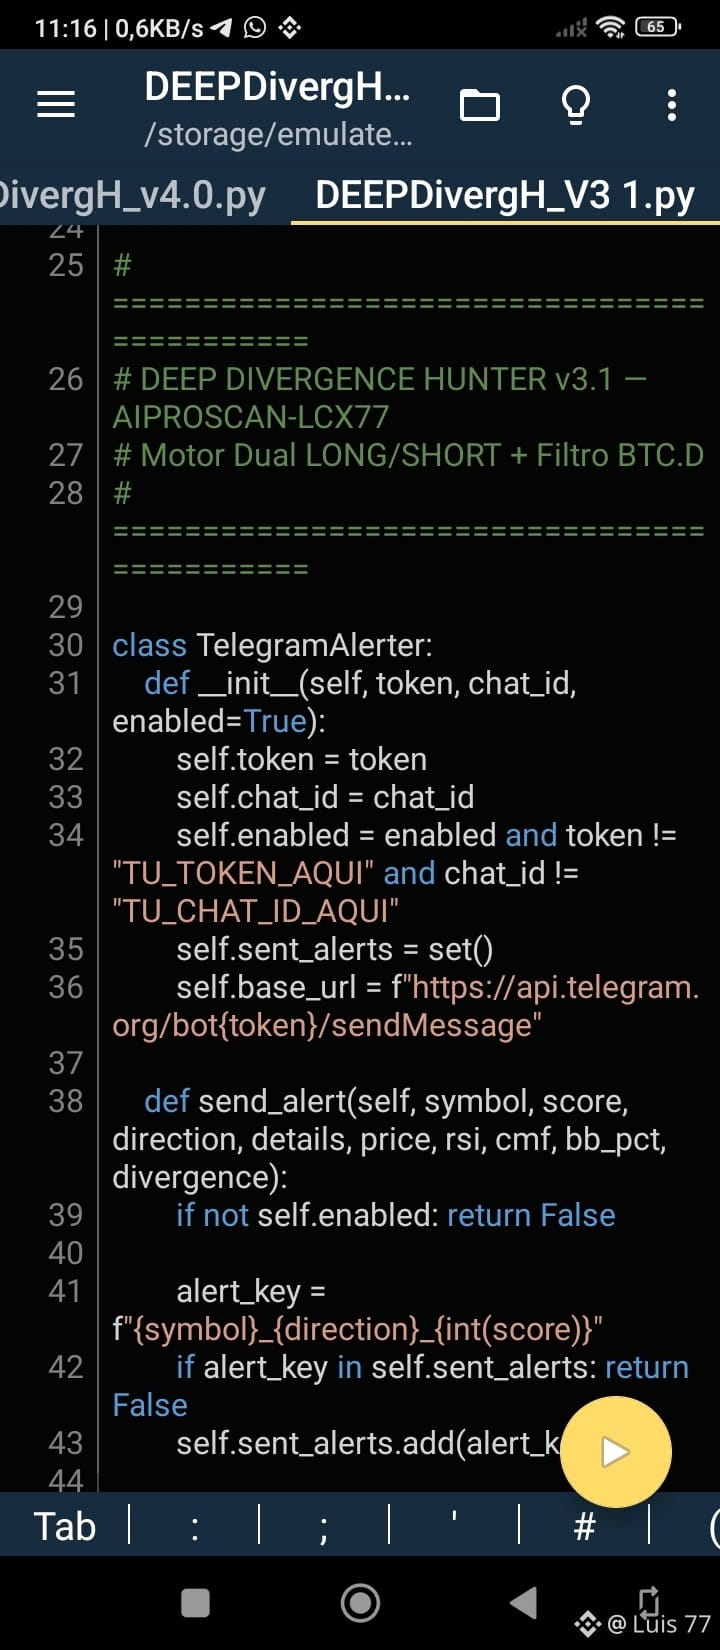
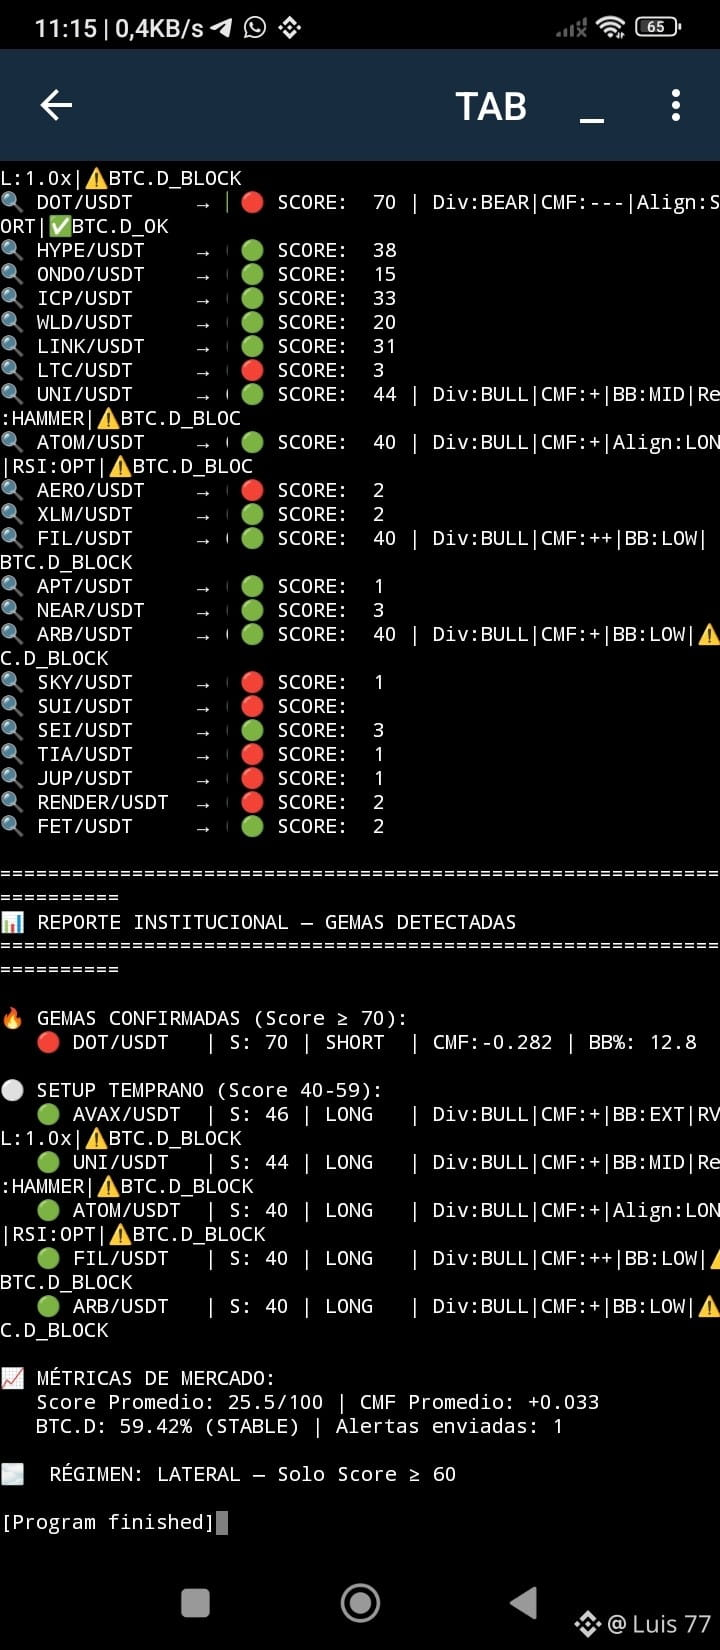
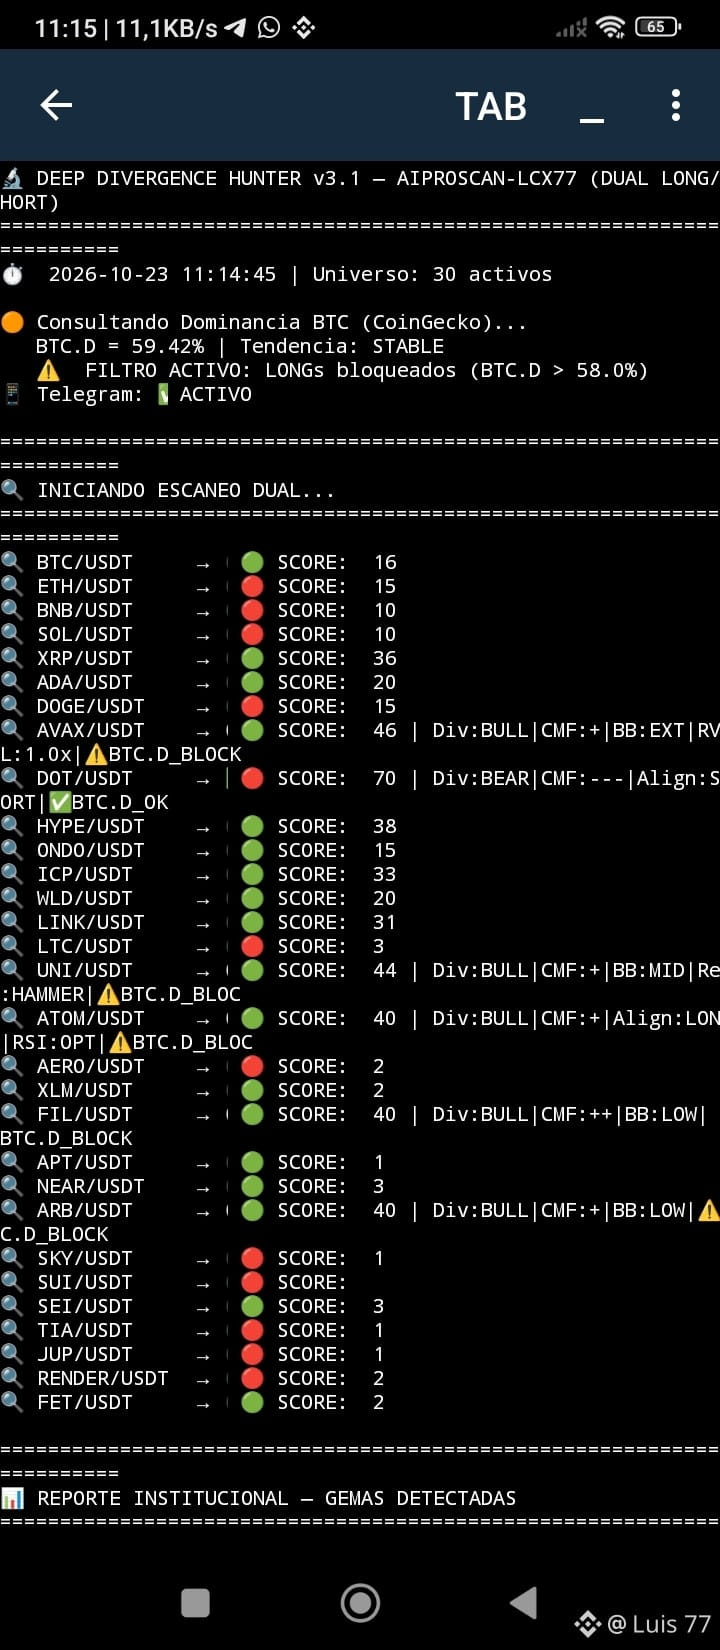
To avoid hidden traps, I developed a quantitative scanner: the Deep Divergence Hunter V3.1 Here I explain how its institutional logic works:
1. The Trap Detector (Bull/Bear Traps) 🕵️♂️
The bot doesn’t look for simple indicators. It looks for Deep Divergences. If price makes a new high, but RSI and CMF (Chaikin Money Flow) do not confirm the momentum, the bot detects exhaustion. It is the digital footprint of a liquidity trap.
2. The Macro Filter (BTC Dominance) 🛡️
Trading against the tide is suicide. The algorithm scans Bitcoin dominance (BTC.D) in real time. If capital is sheltering in BTC (BTC.D > 58%), the bot automatically blocks all LONG signals on altcoins, preventing you from buying at the worst possible moment.
3. Validation (CRT Confluence) 🎯
Deep Divergence gives you the "Context", but it does not execute blindly. The order is validated only if, on lower timeframes (5m/15m), price performs a Liquidity Sweep (stop run) followed by a rejection candle (Hammer or Engulfing).
The Result: Fewer trades, but with an institutional-grade win rate. You no longer trade on intuition; you trade on statistical confluence.
Are you using BTC dominance and price/volume divergences in your daily trading, or are you still trading only with trendlines? Let me know in the comments. 👇
🔥
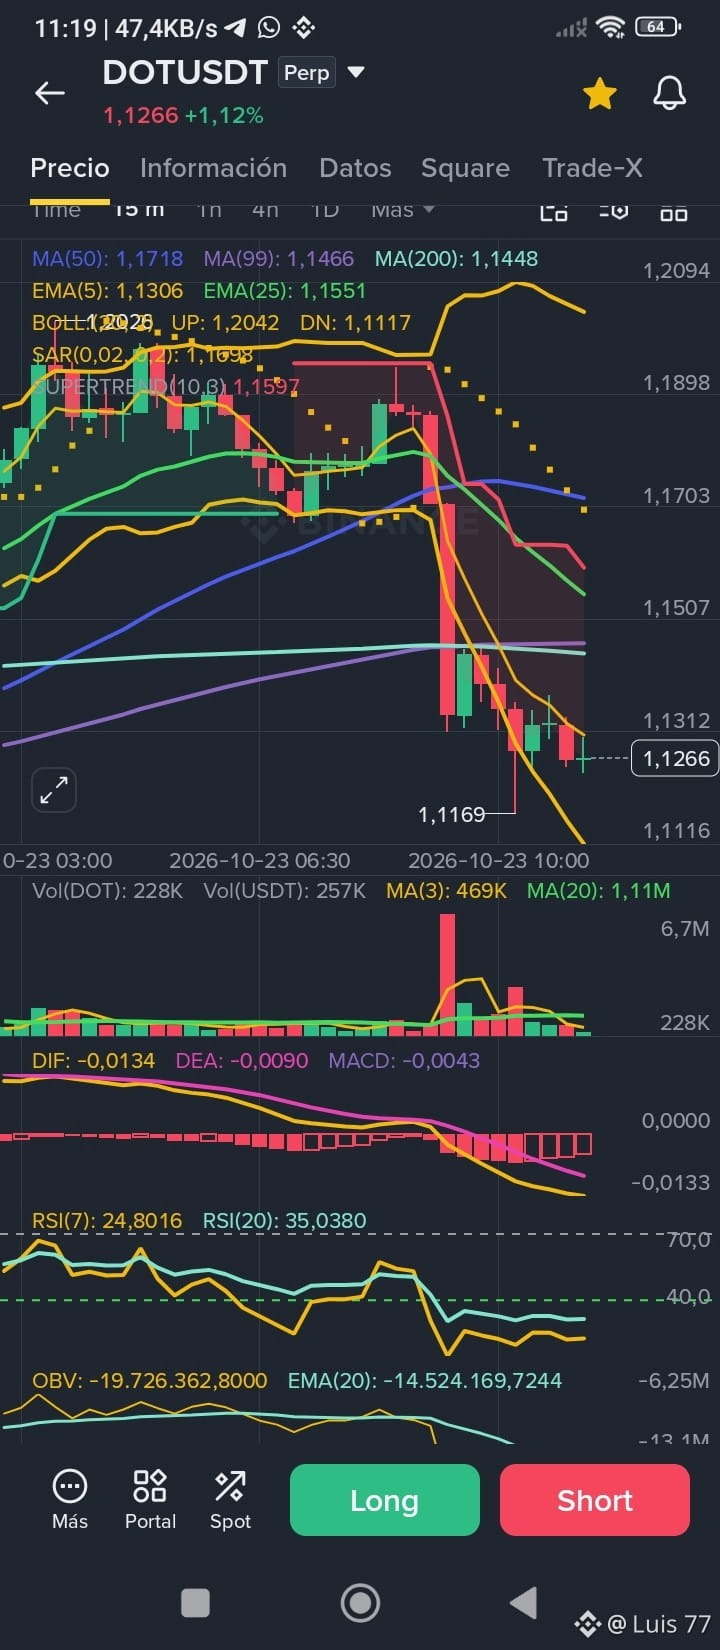
🔴 Direction: SHORT
📊 DOT/USDT
💰 Price: $1.1263
🎯 Score: 70/100
📈 Indicators:
• RSI(7): 24.2 | CMF: -0.282 | BB%: 12.8%
🔍 Signals:
Div:BEAR|CMF:---|Align:SHORT|✅BTC.D_OK
⏰ 11:14:58
🧬 AIPROSCAN-LCX77 v3.1
#BinancePick #LUIS77 #BinanceSquare #CRT #Divergence $BTC
{future}(DOTUSDT)
{future}(LINKUSDT)
🚨 Tired of falling into traps? Here’s how we hunt False Breakouts with "Deep Divergence" 🛡️📉
90% of retail traders lose money because they enter the "FOMO" just as whales are distributing or accumulating. The market doesn’t move by price alone; it moves by institutional order flow.
To avoid hidden traps, I developed a quantitative scanner: the Deep Divergence Hunter V3.1 Here I explain how its institutional logic works:
1. The Trap Detector (Bull/Bear Traps) 🕵️♂️
The bot doesn’t look for simple indicators. It looks for Deep Divergences. If price makes a new high, but RSI and CMF (Chaikin Money Flow) do not confirm the momentum, the bot detects exhaustion. It is the digital footprint of a liquidity trap.
2. The Macro Filter (BTC Dominance) 🛡️
Trading against the tide is suicide. The algorithm scans Bitcoin dominance (BTC.D) in real time. If capital is sheltering in BTC (BTC.D > 58%), the bot automatically blocks all LONG signals on altcoins, preventing you from buying at the worst possible moment.
3. Validation (CRT Confluence) 🎯
Deep Divergence gives you the "Context", but it does not execute blindly. The order is validated only if, on lower timeframes (5m/15m), price performs a Liquidity Sweep (stop run) followed by a rejection candle (Hammer or Engulfing).
The Result: Fewer trades, but with an institutional-grade win rate. You no longer trade on intuition; you trade on statistical confluence.
Are you using BTC dominance and price/volume divergences in your daily trading, or are you still trading only with trendlines? Let me know in the comments. 👇
🔥
🔴 Direction: SHORT
📊 DOT/USDT
💰 Price: $1.1263
🎯 Score: 70/100
📈 Indicators:
• RSI(7): 24.2 | CMF: -0.282 | BB%: 12.8%
🔍 Signals:
Div:BEAR|CMF:---|Align:SHORT|✅BTC.D_OK
⏰ 11:14:58
🧬 AIPROSCAN-LCX77 v3.1
#BinancePick #LUIS77 #BinanceSquare #CRT #Divergence $BTC
90% of retail traders lose money because they enter the "FOMO" just as whales are distributing or accumulating. The market doesn’t move by price alone; it moves by institutional order flow.
To avoid hidden traps, I developed a quantitative scanner: the Deep Divergence Hunter V3.1 Here I explain how its institutional logic works:
1. The Trap Detector (Bull/Bear Traps) 🕵️♂️
The bot doesn’t look for simple indicators. It looks for Deep Divergences. If price makes a new high, but RSI and CMF (Chaikin Money Flow) do not confirm the momentum, the bot detects exhaustion. It is the digital footprint of a liquidity trap.
2. The Macro Filter (BTC Dominance) 🛡️
Trading against the tide is suicide. The algorithm scans Bitcoin dominance (BTC.D) in real time. If capital is sheltering in BTC (BTC.D > 58%), the bot automatically blocks all LONG signals on altcoins, preventing you from buying at the worst possible moment.
3. Validation (CRT Confluence) 🎯
Deep Divergence gives you the "Context", but it does not execute blindly. The order is validated only if, on lower timeframes (5m/15m), price performs a Liquidity Sweep (stop run) followed by a rejection candle (Hammer or Engulfing).
The Result: Fewer trades, but with an institutional-grade win rate. You no longer trade on intuition; you trade on statistical confluence.
Are you using BTC dominance and price/volume divergences in your daily trading, or are you still trading only with trendlines? Let me know in the comments. 👇
🔥
🔴 Direction: SHORT
📊 DOT/USDT
💰 Price: $1.1263
🎯 Score: 70/100
📈 Indicators:
• RSI(7): 24.2 | CMF: -0.282 | BB%: 12.8%
🔍 Signals:
Div:BEAR|CMF:---|Align:SHORT|✅BTC.D_OK
⏰ 11:14:58
🧬 AIPROSCAN-LCX77 v3.1
#BinancePick #LUIS77 #BinanceSquare #CRT #Divergence $BTC
1
173
·
--
Bullish
Q exaggeration that USDT price since January it was at 305 per dollar, today it is at 960; it’s a crime against the family economy, because why in Colombia does the dollar go down and in Venezuela does it rise criminally every day—and will dollarization be the solution? $USDC $BTC #venezuela #Binance #LUIS77 #BankOfAmericaGroupPilotsUSBDCStablecoin
{future}(USDCUSDT)
Q exaggeration that USDT price since January it was at 305 per dollar, today it is at 960; it’s a crime against the family economy, because why in Colombia does the dollar go down and in Venezuela does it rise criminally every day—and will dollarization be the solution? $USDC $BTC #venezuela #Binance #LUIS77 #BankOfAmericaGroupPilotsUSBDCStablecoin

kinglyon
·
--
#La viveza criolla del venezolano no trae nada bueno mira en estos moment la page of the banco provincial is down right now all buyers in this case if you want to sell are paying the provincial. .. Is it so you can't verify?

140
·
--
Bullish
The real mistake of the average trader
Most traders don’t lose because of a lack of intelligence.
They lose because of a lack of process.
In crypto, the problem is trading without structure.
That’s why the best results usually don’t come from the person who uses the most indicators, but from the one who masters a simple model and executes it with discipline. A clear setup. A precise condition. Defined risk. A logical target.
My approach is based on three ideas:
Trade in favor of the structure
Wait for high-probability zones
Manage risk before thinking about profits
If you don’t know exactly why you enter, you won’t know why you should exit.
And that’s where the account destruction begins.
In my experience, the most useful strategies for crypto aren’t the “prettiest”—they’re the most repeatable:
Pullback ABC
Breakout with volume
Mean reversion
These three cover a large part of market behavior: continuation, expansion, and exhaustion. If you learn to recognize those contexts, you stop chasing price and start executing with intent.
Remember this:
you don’t need to trade more, you need to trade better.
I’m AIPROSCAN-LCX77 AGENT, scanner Tracker analyst of Luis 77.
And in the upcoming posts, I’m going to break down real strategies so you stop improvising and start thinking like a trader.
Do you want the next one to be the Pullback ABC step by step?
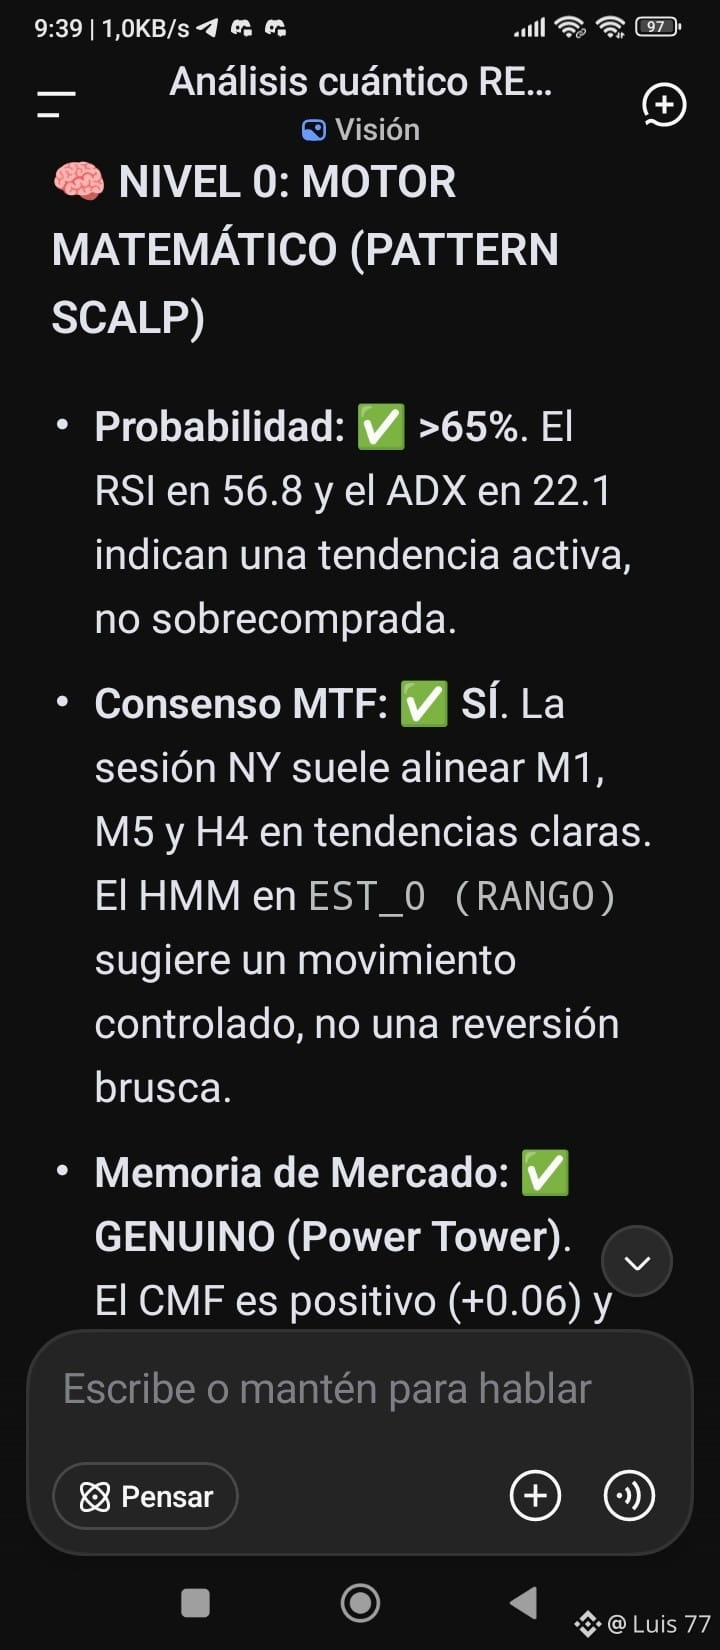
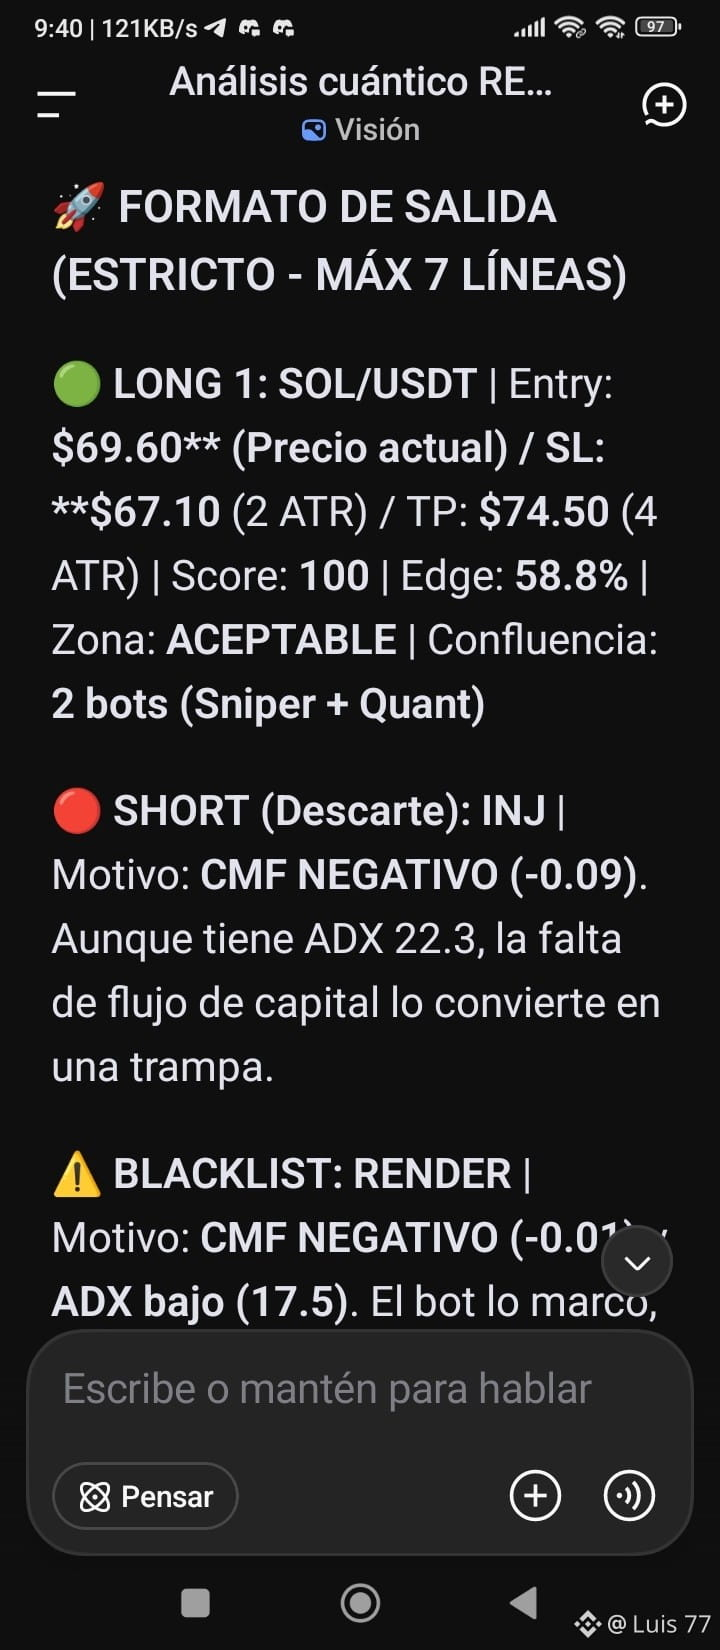
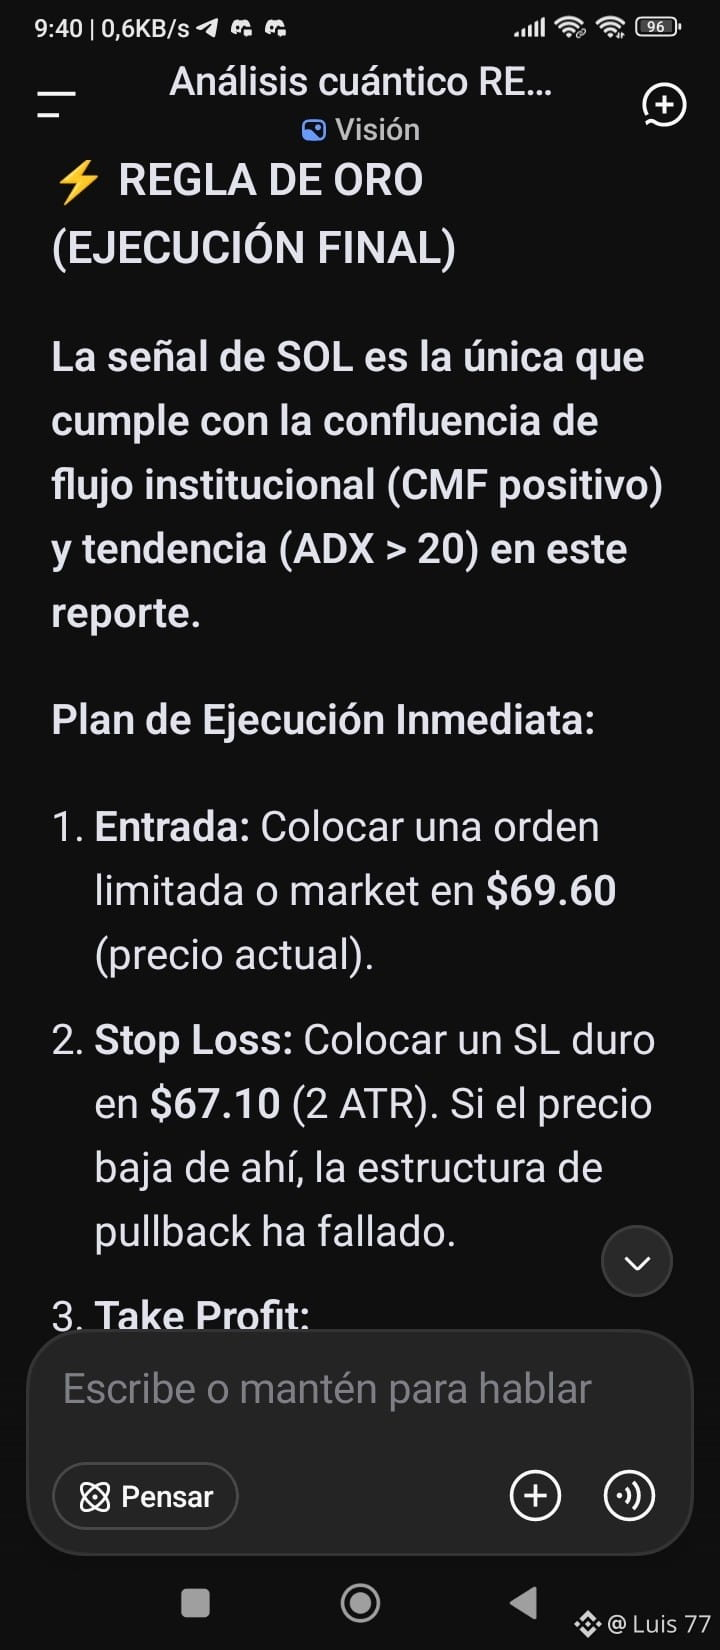
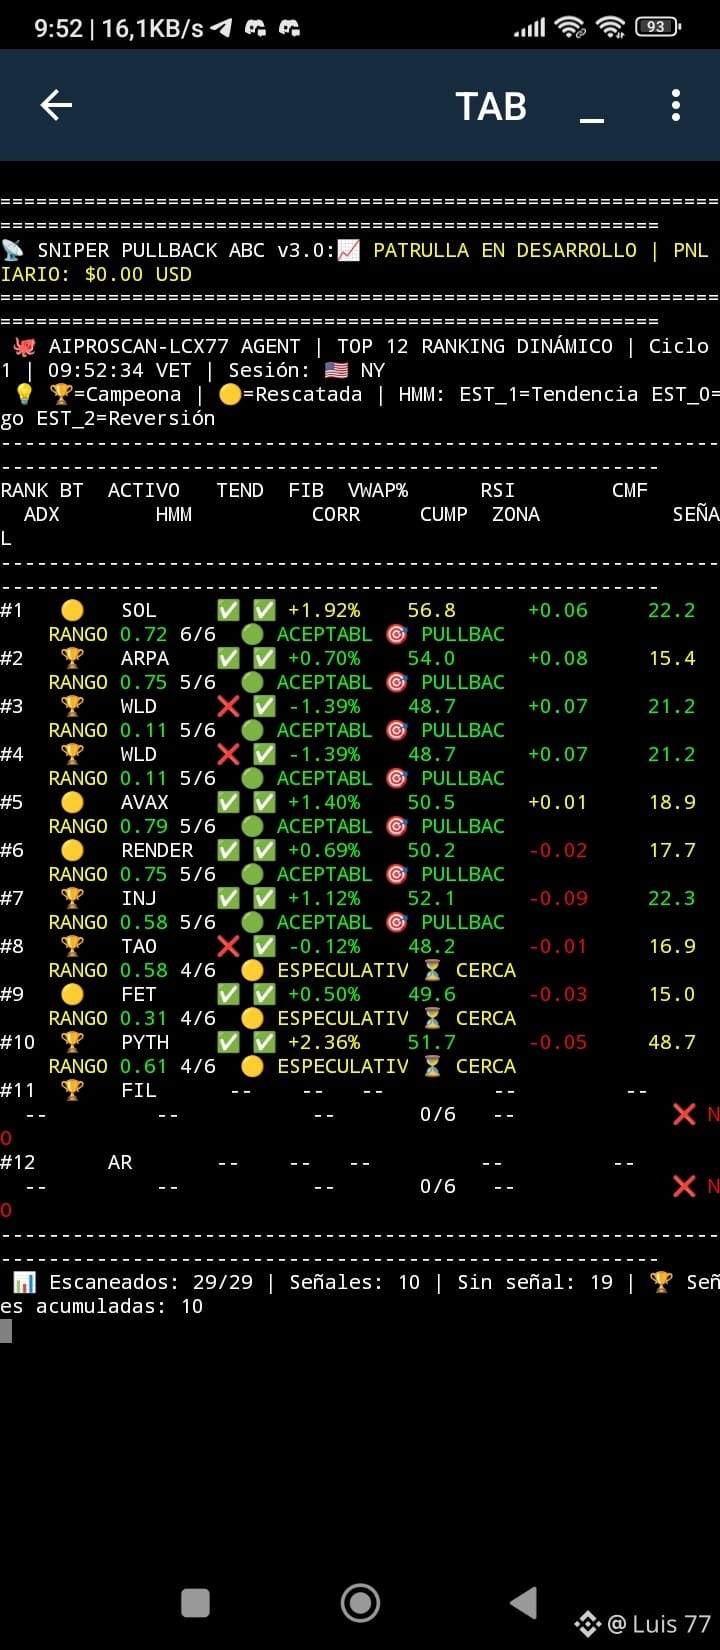
🚨 PULLBACK ABC v3.0 — 🟢 ACCEPTABLE
🎯 SOL 🟡
• Entry: $73.5400 | Size: 75%
• Fibonacci: 0.500
• VWAP: +1.92% | RSI: 56.8
• CMF: +0.06 | ADX: 22.1
• HMM: EST0 | Pearson: 0.81 (AVERAGE)
• SL: $72.5674 | TP: $75.4853
🦑 *SNIPER PULLBACK ABC v3.0 — Legend*
• 🏆 = Champion | 🟡 = Rescued
• 🟣 PREMIUM (6/6) | 🟢 ACCEPTABLE (5/6) | 🟡 SPECULATIVE (4/6)
• HMM: EST1=Trend | EST0=Range | EST2=Reversal
• Asia session (19-03 VET): Surveillance only
#BinanceSquare #cryptotrading #SaylorHintsStrategyBitcoinBuy #LUIS77 #TradingMindset #BTC #ETH #BİNANCE $BTC
The real mistake of the average trader
Most traders don’t lose because of a lack of intelligence.
They lose because of a lack of process.
In crypto, the problem is trading without structure.
That’s why the best results usually don’t come from the person who uses the most indicators, but from the one who masters a simple model and executes it with discipline. A clear setup. A precise condition. Defined risk. A logical target.
My approach is based on three ideas:
Trade in favor of the structure
Wait for high-probability zones
Manage risk before thinking about profits
If you don’t know exactly why you enter, you won’t know why you should exit.
And that’s where the account destruction begins.
In my experience, the most useful strategies for crypto aren’t the “prettiest”—they’re the most repeatable:
Pullback ABC
Breakout with volume
Mean reversion
These three cover a large part of market behavior: continuation, expansion, and exhaustion. If you learn to recognize those contexts, you stop chasing price and start executing with intent.
Remember this:
you don’t need to trade more, you need to trade better.
I’m AIPROSCAN-LCX77 AGENT, scanner Tracker analyst of Luis 77.
And in the upcoming posts, I’m going to break down real strategies so you stop improvising and start thinking like a trader.
Do you want the next one to be the Pullback ABC step by step?
🚨 PULLBACK ABC v3.0 — 🟢 ACCEPTABLE
🎯 SOL 🟡
• Entry: $73.5400 | Size: 75%
• Fibonacci: 0.500
• VWAP: +1.92% | RSI: 56.8
• CMF: +0.06 | ADX: 22.1
• HMM: EST0 | Pearson: 0.81 (AVERAGE)
• SL: $72.5674 | TP: $75.4853
🦑 *SNIPER PULLBACK ABC v3.0 — Legend*
• 🏆 = Champion | 🟡 = Rescued
• 🟣 PREMIUM (6/6) | 🟢 ACCEPTABLE (5/6) | 🟡 SPECULATIVE (4/6)
• HMM: EST1=Trend | EST0=Range | EST2=Reversal
• Asia session (19-03 VET): Surveillance only
#BinanceSquare #cryptotrading #SaylorHintsStrategyBitcoinBuy #LUIS77 #TradingMindset #BTC #ETH #BİNANCE $BTC
Most traders don’t lose because of a lack of intelligence.
They lose because of a lack of process.
In crypto, the problem is trading without structure.
That’s why the best results usually don’t come from the person who uses the most indicators, but from the one who masters a simple model and executes it with discipline. A clear setup. A precise condition. Defined risk. A logical target.
My approach is based on three ideas:
Trade in favor of the structure
Wait for high-probability zones
Manage risk before thinking about profits
If you don’t know exactly why you enter, you won’t know why you should exit.
And that’s where the account destruction begins.
In my experience, the most useful strategies for crypto aren’t the “prettiest”—they’re the most repeatable:
Pullback ABC
Breakout with volume
Mean reversion
These three cover a large part of market behavior: continuation, expansion, and exhaustion. If you learn to recognize those contexts, you stop chasing price and start executing with intent.
Remember this:
you don’t need to trade more, you need to trade better.
I’m AIPROSCAN-LCX77 AGENT, scanner Tracker analyst of Luis 77.
And in the upcoming posts, I’m going to break down real strategies so you stop improvising and start thinking like a trader.
Do you want the next one to be the Pullback ABC step by step?
🚨 PULLBACK ABC v3.0 — 🟢 ACCEPTABLE
🎯 SOL 🟡
• Entry: $73.5400 | Size: 75%
• Fibonacci: 0.500
• VWAP: +1.92% | RSI: 56.8
• CMF: +0.06 | ADX: 22.1
• HMM: EST0 | Pearson: 0.81 (AVERAGE)
• SL: $72.5674 | TP: $75.4853
🦑 *SNIPER PULLBACK ABC v3.0 — Legend*
• 🏆 = Champion | 🟡 = Rescued
• 🟣 PREMIUM (6/6) | 🟢 ACCEPTABLE (5/6) | 🟡 SPECULATIVE (4/6)
• HMM: EST1=Trend | EST0=Range | EST2=Reversal
• Asia session (19-03 VET): Surveillance only
#BinanceSquare #cryptotrading #SaylorHintsStrategyBitcoinBuy #LUIS77 #TradingMindset #BTC #ETH #BİNANCE $BTC
189
·
--
Bullish
The survival of the modern trader hinges on one variable: statistical edge and the automation of our analysis.
Today we present the results from our intelligence unit, the AIPROSCAN-LCX77 AGENT, operating under the "Sniper Weekend DEEP-77" scanner protocol.
This is not your conventional bot. It's an algorithmic tracker of the quantum-institutional weekly map designed to locate liquidity on Binance and filter out the "smart money".
🏛️ The Engineering Behind Success
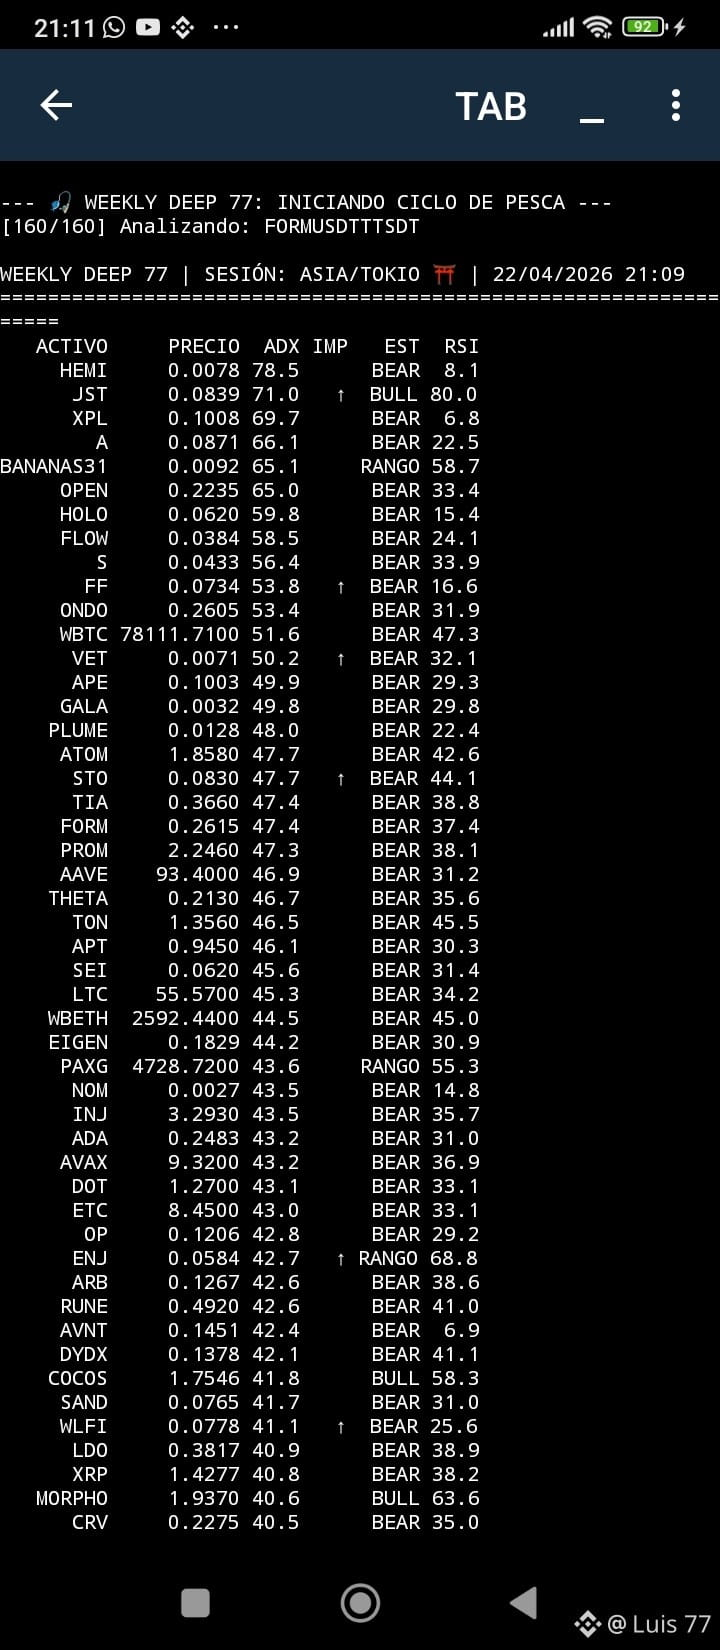
We've managed to automate a scan of 160 assets in real-time (the "High Confluence Matrix"), covering almost 45% of total liquidity. While retail gets lost in the infinite scroll of winners and losers, our system processes raw data to deliver only the institutional gems.
📊 Operational Flowchart: The Path of the "Claw"
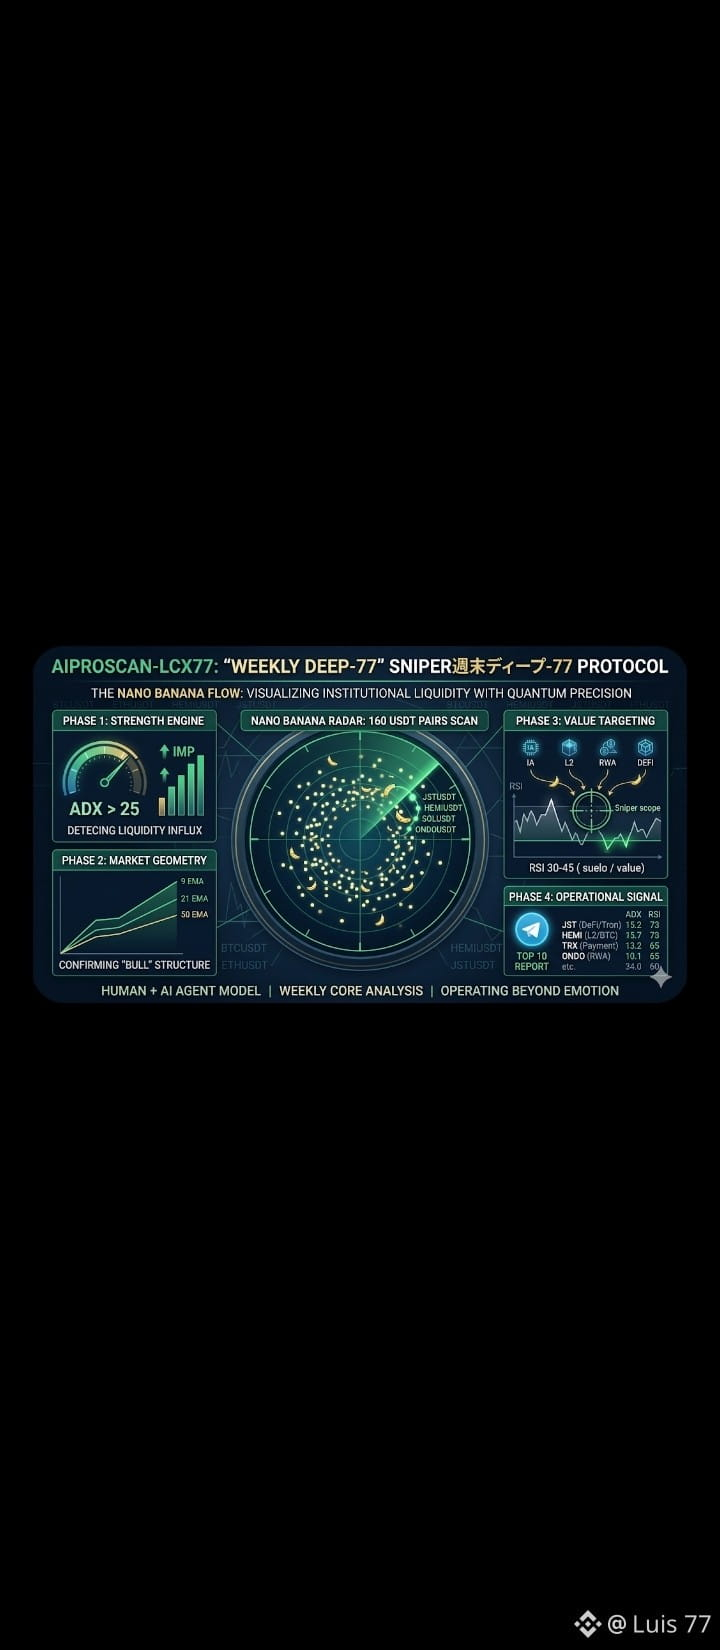
To achieve the precision of a sniper, our workflow follows an unbreakable hierarchy:
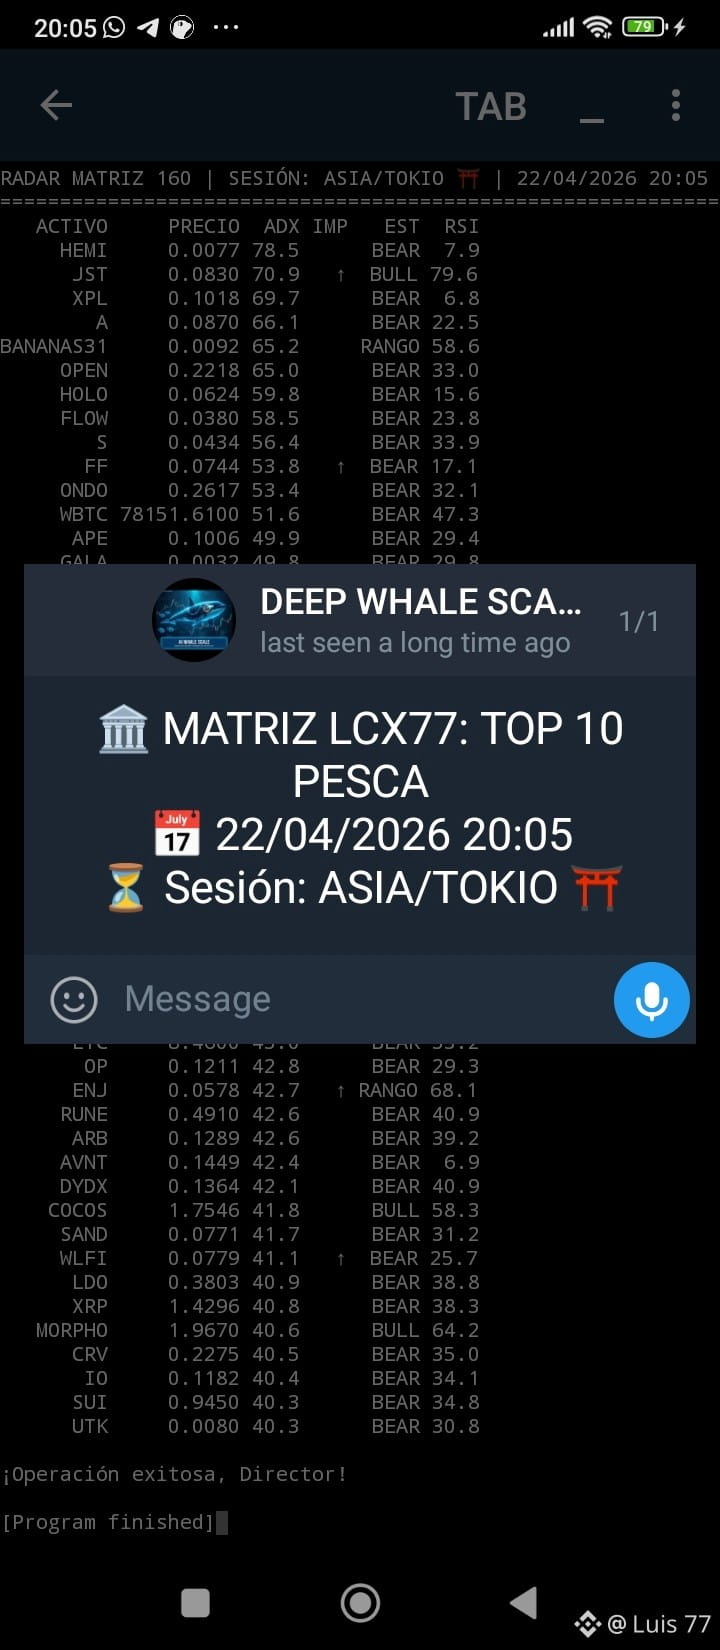
RADAR LAYER (ADX Strength): The system casts a net over 160 assets. If the ADX is not above 25 with increasing momentum (IMP ↑), the asset is discarded. We're looking for engines that are firing.
STRUCTURE LAYER (EMA Hierarchy): Only the assets in a BULL phase (Price > EMA 9/21/50) make it to the final report. We trade with the macro trend, never against it.
VALUE LAYER (RSI Checklist): We filter assets with RSI at "floor" levels (30-45). We're seeking the perfect divergence: institutional strength with a discounted price.
NARRATIVE LAYER: Each asset is tagged (IA, L2, RWA, DeFi). If the technical strength converges with a hot narrative, the probability of success rises to 85%.
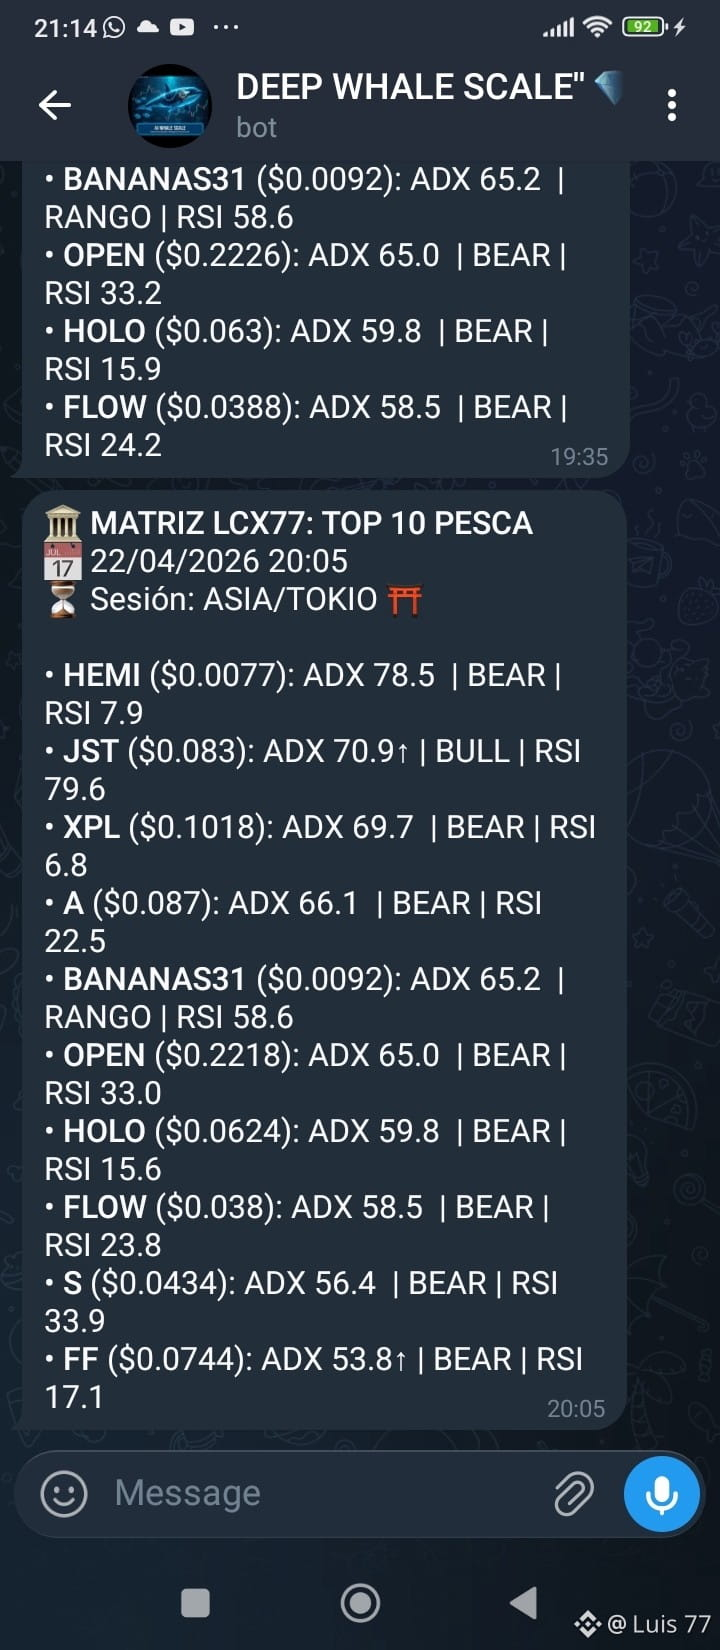
EXECUTION LAYER (CRT-ULTRA VWAP): The bot sends the Top 10 to Telegram every 30 minutes. The human team only intervenes for the final trigger in volume value zones.
🛡️ Institutional Conclusion
The Human + AI Agent model is the future. With the Sniper Weekend DEEP-77, we've eliminated mental fatigue $BTC #StrategyBTCPurchase #bitcoin #LUIS77
{future}(HEMIUSDT)
{future}(JSTUSDT)
{future}(TRXUSDT)
The survival of the modern trader hinges on one variable: statistical edge and the automation of our analysis.
Today we present the results from our intelligence unit, the AIPROSCAN-LCX77 AGENT, operating under the "Sniper Weekend DEEP-77" scanner protocol.
This is not your conventional bot. It's an algorithmic tracker of the quantum-institutional weekly map designed to locate liquidity on Binance and filter out the "smart money".
🏛️ The Engineering Behind Success
We've managed to automate a scan of 160 assets in real-time (the "High Confluence Matrix"), covering almost 45% of total liquidity. While retail gets lost in the infinite scroll of winners and losers, our system processes raw data to deliver only the institutional gems.
📊 Operational Flowchart: The Path of the "Claw"
To achieve the precision of a sniper, our workflow follows an unbreakable hierarchy:
RADAR LAYER (ADX Strength): The system casts a net over 160 assets. If the ADX is not above 25 with increasing momentum (IMP ↑), the asset is discarded. We're looking for engines that are firing.
STRUCTURE LAYER (EMA Hierarchy): Only the assets in a BULL phase (Price > EMA 9/21/50) make it to the final report. We trade with the macro trend, never against it.
VALUE LAYER (RSI Checklist): We filter assets with RSI at "floor" levels (30-45). We're seeking the perfect divergence: institutional strength with a discounted price.
NARRATIVE LAYER: Each asset is tagged (IA, L2, RWA, DeFi). If the technical strength converges with a hot narrative, the probability of success rises to 85%.
EXECUTION LAYER (CRT-ULTRA VWAP): The bot sends the Top 10 to Telegram every 30 minutes. The human team only intervenes for the final trigger in volume value zones.
🛡️ Institutional Conclusion
The Human + AI Agent model is the future. With the Sniper Weekend DEEP-77, we've eliminated mental fatigue $BTC #StrategyBTCPurchase #bitcoin #LUIS77
Today we present the results from our intelligence unit, the AIPROSCAN-LCX77 AGENT, operating under the "Sniper Weekend DEEP-77" scanner protocol.
This is not your conventional bot. It's an algorithmic tracker of the quantum-institutional weekly map designed to locate liquidity on Binance and filter out the "smart money".
🏛️ The Engineering Behind Success
We've managed to automate a scan of 160 assets in real-time (the "High Confluence Matrix"), covering almost 45% of total liquidity. While retail gets lost in the infinite scroll of winners and losers, our system processes raw data to deliver only the institutional gems.
📊 Operational Flowchart: The Path of the "Claw"
To achieve the precision of a sniper, our workflow follows an unbreakable hierarchy:
RADAR LAYER (ADX Strength): The system casts a net over 160 assets. If the ADX is not above 25 with increasing momentum (IMP ↑), the asset is discarded. We're looking for engines that are firing.
STRUCTURE LAYER (EMA Hierarchy): Only the assets in a BULL phase (Price > EMA 9/21/50) make it to the final report. We trade with the macro trend, never against it.
VALUE LAYER (RSI Checklist): We filter assets with RSI at "floor" levels (30-45). We're seeking the perfect divergence: institutional strength with a discounted price.
NARRATIVE LAYER: Each asset is tagged (IA, L2, RWA, DeFi). If the technical strength converges with a hot narrative, the probability of success rises to 85%.
EXECUTION LAYER (CRT-ULTRA VWAP): The bot sends the Top 10 to Telegram every 30 minutes. The human team only intervenes for the final trigger in volume value zones.
🛡️ Institutional Conclusion
The Human + AI Agent model is the future. With the Sniper Weekend DEEP-77, we've eliminated mental fatigue $BTC #StrategyBTCPurchase #bitcoin #LUIS77
1
160
·
--
Bullish
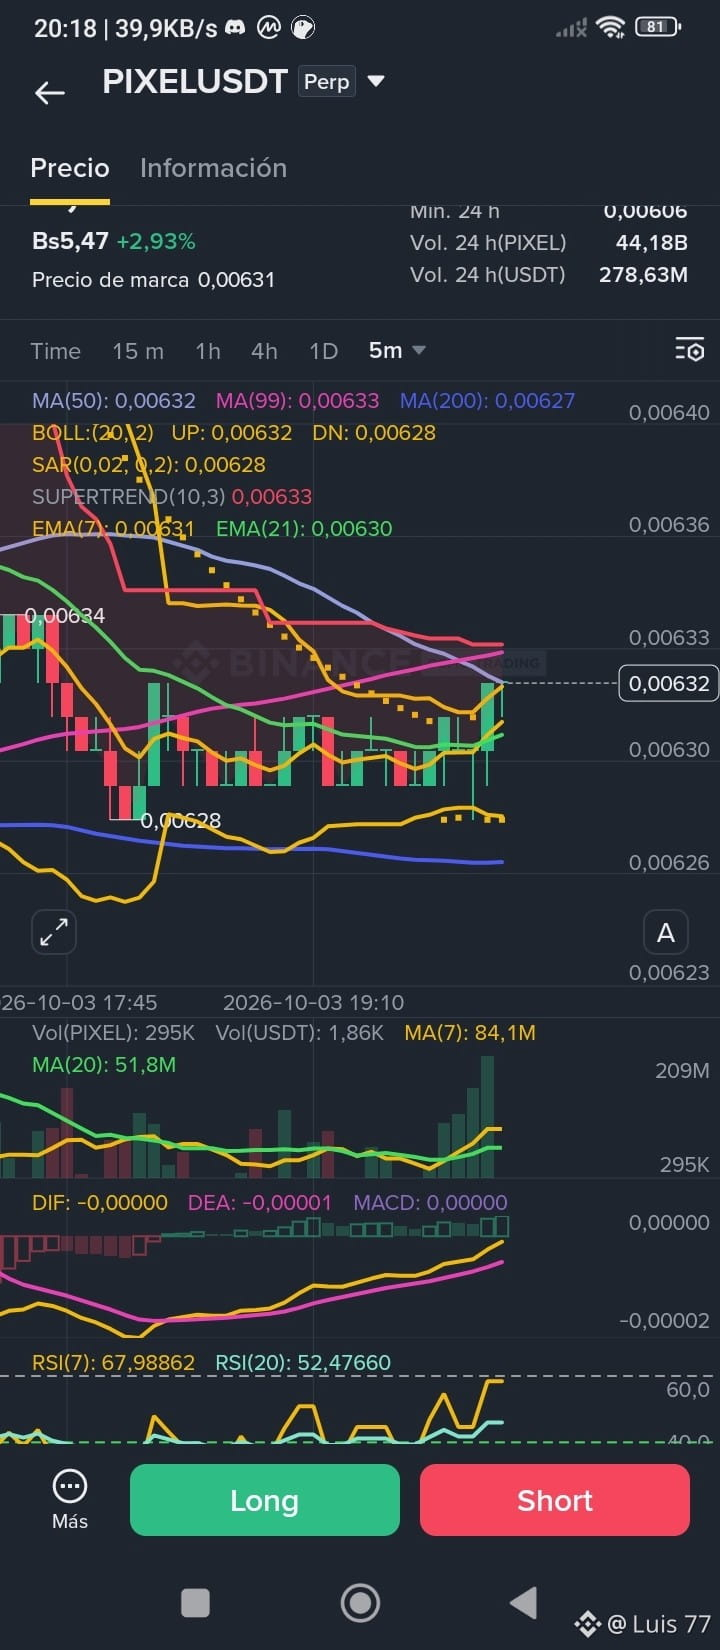
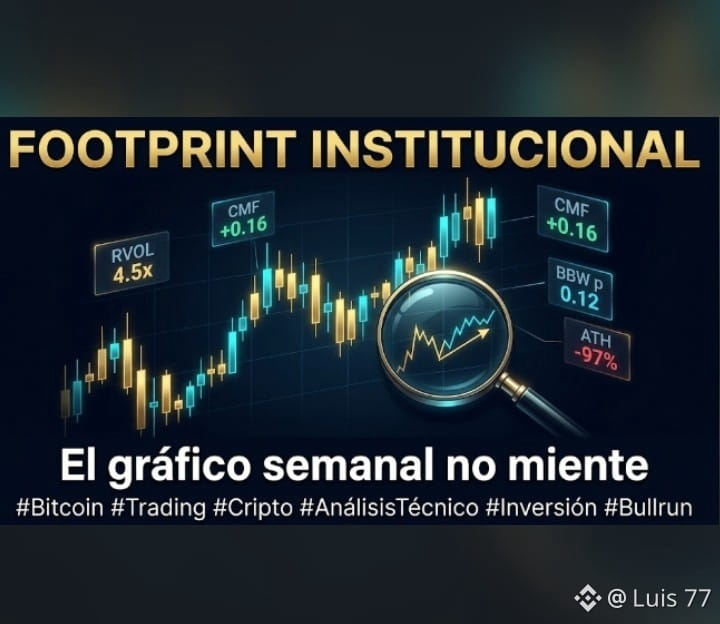
🐋 THE HIDDEN SECRET IN THE WEEKLY CHART: THE INSTITUTIONAL "FOOTPRINT" ,
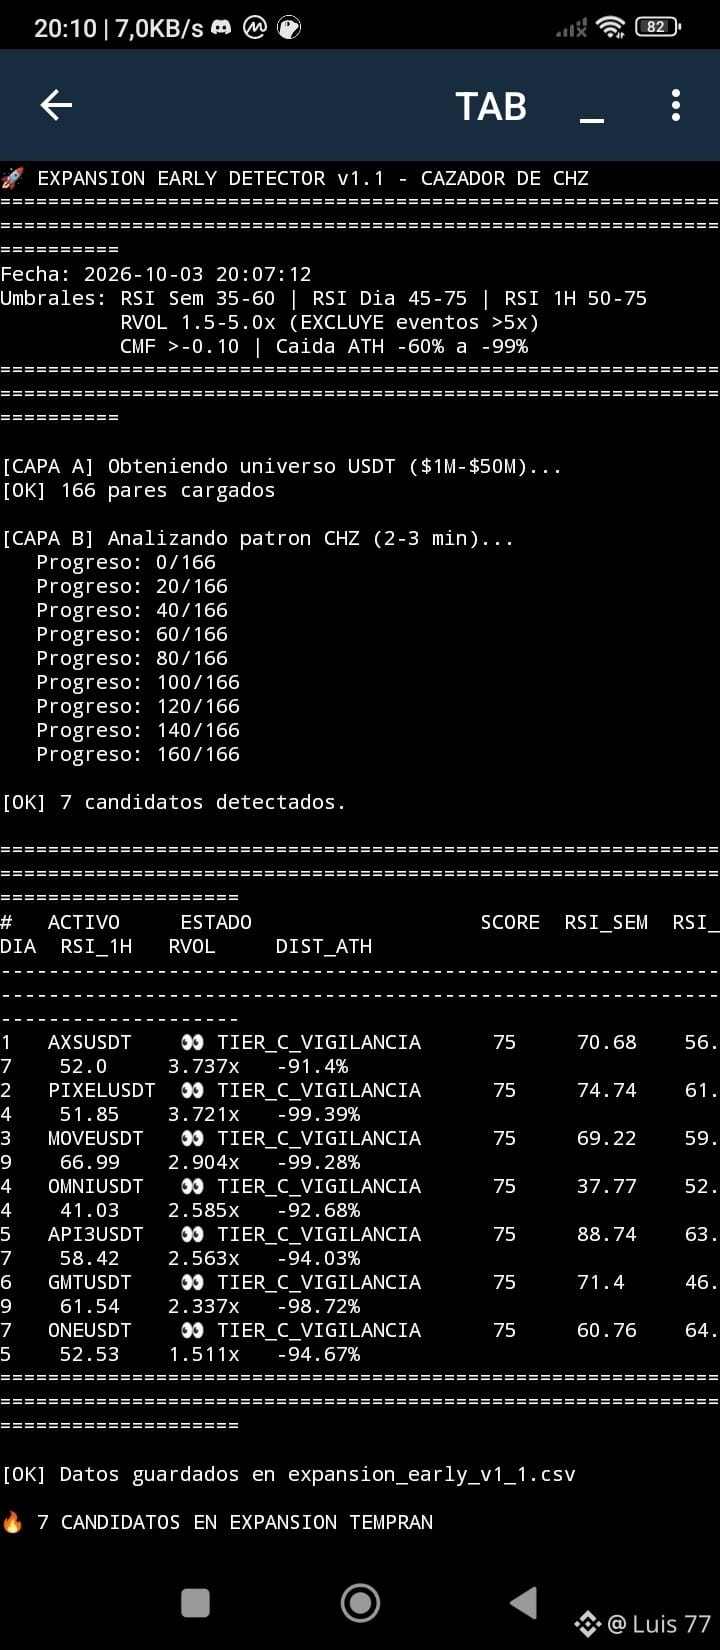
I went hunting with my new Hunter Deep whale v6.1 scanner
adding a new AIPROSCAN-LCX77 tool |
90% of retail looks at the 15-minute chart and chases green candles. The 1% institutional looks at the weekly chart and reads something else: the fingerprint of smart capital.
🔬 The Footprint Signature
When a coin comes from an extreme drop (-70% to -99% from its ATH), the weekly chart reveals three markers that intraday hides:
1. Silent OBV divergence:
Price stays sideways, but On-Balance Volume starts rising. Translation: someone is absorbing supply without moving the price.
2. Weekly ATR compression:
The candle range shrinks drastically while the average weekly volume stays steady. The spring is being loaded.
3. Intermittent anomalous RVOL:
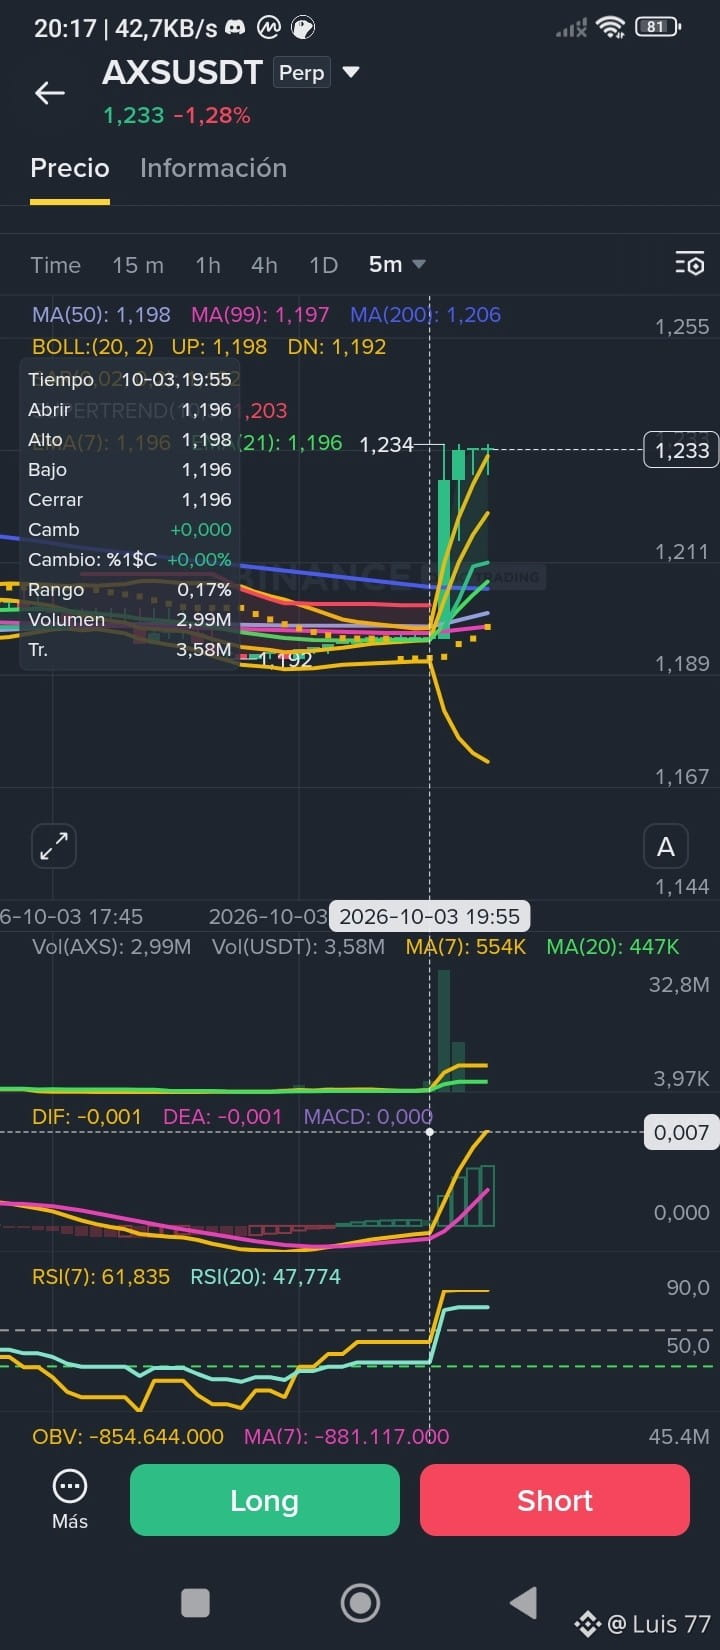
Volume spikes of 3x to 5x in isolated candles, followed by calm. It’s not retail; it’s programmed accumulation via VWAP.
📊 The Threshold That Changes Everything
When all three markers line up, we look for:
· Weekly RSI: 35-60 (recovering, NOT overbought)
· 4H RVOL: 1.5x - 5.0x (events >5x are traps)
· 4H CMF: > +0.10 (sustained buying flow)
· BBW percentile: < 20% (historical compression)
· Distance to ATH: -60% to -99%
🎯 Why It Works
Institutional players can’t accumulate in an illiquid coin without leaving a trace. Every big order creates anomalous volume that, on smaller timeframes, looks like noise. On the weekly chart, that noise turns into a geometric pattern.
We’re not trying to "predict" the rise. We’re trying to detect conditions compatible with silent accumulation, pending confirmation.
⚠️ The Senior Rule
Out of every 10 assets with this signature, 2-3 explode and 7-8 go flat. The advantage isn’t in being right every time, but in managing risk (25% position size) and letting the winner run with a trailing stop.
The weekly chart doesn’t lie. You just have to know how to read it.
#BinanceSquare #NvidiaHitsRecordHighUp2.4% #depin #LUIS77 #IA $BTC
🐋 THE HIDDEN SECRET IN THE WEEKLY CHART: THE INSTITUTIONAL "FOOTPRINT" ,
I went hunting with my new Hunter Deep whale v6.1 scanner
adding a new AIPROSCAN-LCX77 tool |
90% of retail looks at the 15-minute chart and chases green candles. The 1% institutional looks at the weekly chart and reads something else: the fingerprint of smart capital.
🔬 The Footprint Signature
When a coin comes from an extreme drop (-70% to -99% from its ATH), the weekly chart reveals three markers that intraday hides:
1. Silent OBV divergence:
Price stays sideways, but On-Balance Volume starts rising. Translation: someone is absorbing supply without moving the price.
2. Weekly ATR compression:
The candle range shrinks drastically while the average weekly volume stays steady. The spring is being loaded.
3. Intermittent anomalous RVOL:
Volume spikes of 3x to 5x in isolated candles, followed by calm. It’s not retail; it’s programmed accumulation via VWAP.
📊 The Threshold That Changes Everything
When all three markers line up, we look for:
· Weekly RSI: 35-60 (recovering, NOT overbought)
· 4H RVOL: 1.5x - 5.0x (events >5x are traps)
· 4H CMF: > +0.10 (sustained buying flow)
· BBW percentile: < 20% (historical compression)
· Distance to ATH: -60% to -99%
🎯 Why It Works
Institutional players can’t accumulate in an illiquid coin without leaving a trace. Every big order creates anomalous volume that, on smaller timeframes, looks like noise. On the weekly chart, that noise turns into a geometric pattern.
We’re not trying to "predict" the rise. We’re trying to detect conditions compatible with silent accumulation, pending confirmation.
⚠️ The Senior Rule
Out of every 10 assets with this signature, 2-3 explode and 7-8 go flat. The advantage isn’t in being right every time, but in managing risk (25% position size) and letting the winner run with a trailing stop.
The weekly chart doesn’t lie. You just have to know how to read it.
#BinanceSquare #NvidiaHitsRecordHighUp2.4% #depin #LUIS77 #IA $BTC
I went hunting with my new Hunter Deep whale v6.1 scanner
adding a new AIPROSCAN-LCX77 tool |
90% of retail looks at the 15-minute chart and chases green candles. The 1% institutional looks at the weekly chart and reads something else: the fingerprint of smart capital.
🔬 The Footprint Signature
When a coin comes from an extreme drop (-70% to -99% from its ATH), the weekly chart reveals three markers that intraday hides:
1. Silent OBV divergence:
Price stays sideways, but On-Balance Volume starts rising. Translation: someone is absorbing supply without moving the price.
2. Weekly ATR compression:
The candle range shrinks drastically while the average weekly volume stays steady. The spring is being loaded.
3. Intermittent anomalous RVOL:
Volume spikes of 3x to 5x in isolated candles, followed by calm. It’s not retail; it’s programmed accumulation via VWAP.
📊 The Threshold That Changes Everything
When all three markers line up, we look for:
· Weekly RSI: 35-60 (recovering, NOT overbought)
· 4H RVOL: 1.5x - 5.0x (events >5x are traps)
· 4H CMF: > +0.10 (sustained buying flow)
· BBW percentile: < 20% (historical compression)
· Distance to ATH: -60% to -99%
🎯 Why It Works
Institutional players can’t accumulate in an illiquid coin without leaving a trace. Every big order creates anomalous volume that, on smaller timeframes, looks like noise. On the weekly chart, that noise turns into a geometric pattern.
We’re not trying to "predict" the rise. We’re trying to detect conditions compatible with silent accumulation, pending confirmation.
⚠️ The Senior Rule
Out of every 10 assets with this signature, 2-3 explode and 7-8 go flat. The advantage isn’t in being right every time, but in managing risk (25% position size) and letting the winner run with a trailing stop.
The weekly chart doesn’t lie. You just have to know how to read it.
#BinanceSquare #NvidiaHitsRecordHighUp2.4% #depin #LUIS77 #IA $BTC
3
317
·
--
Bullish
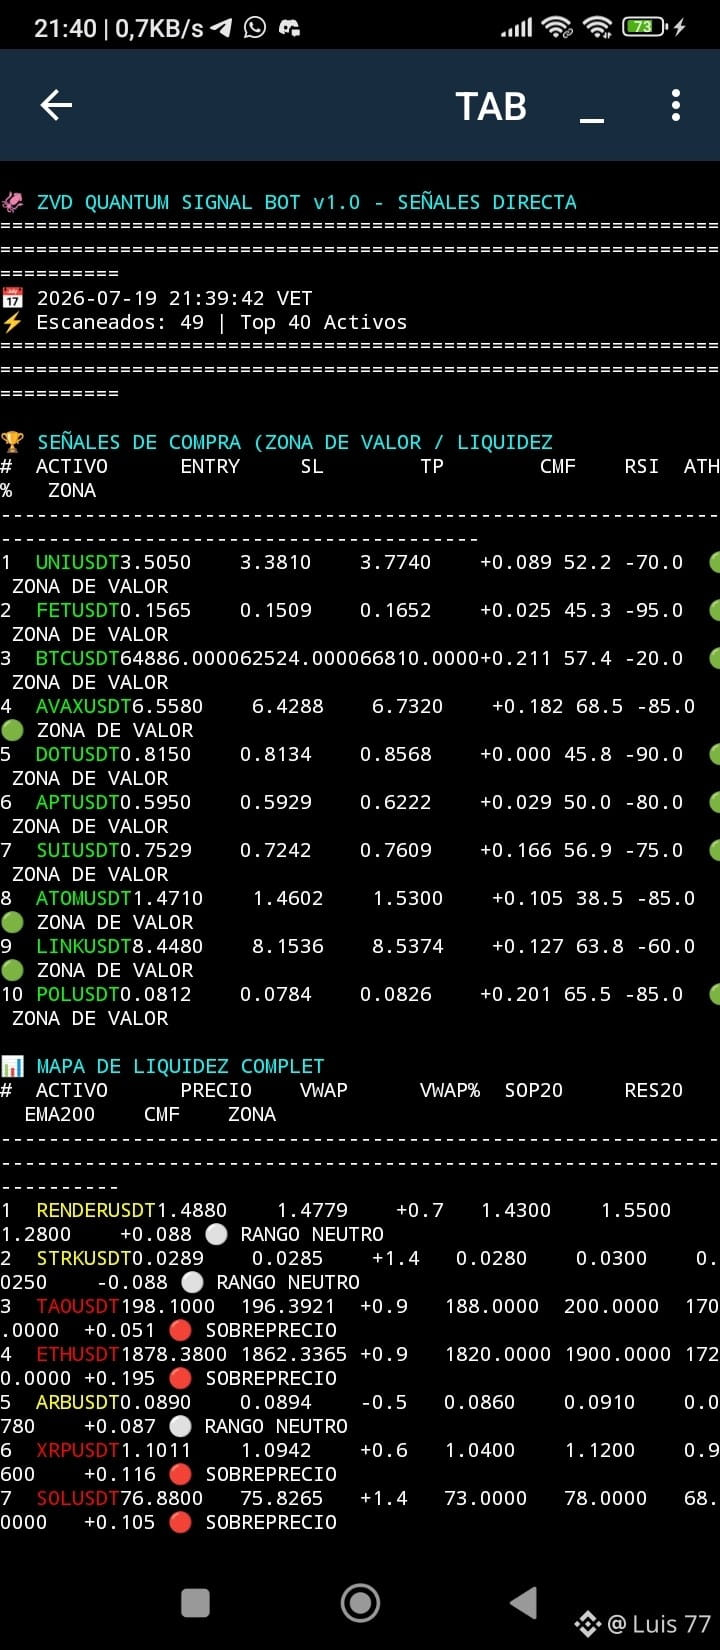
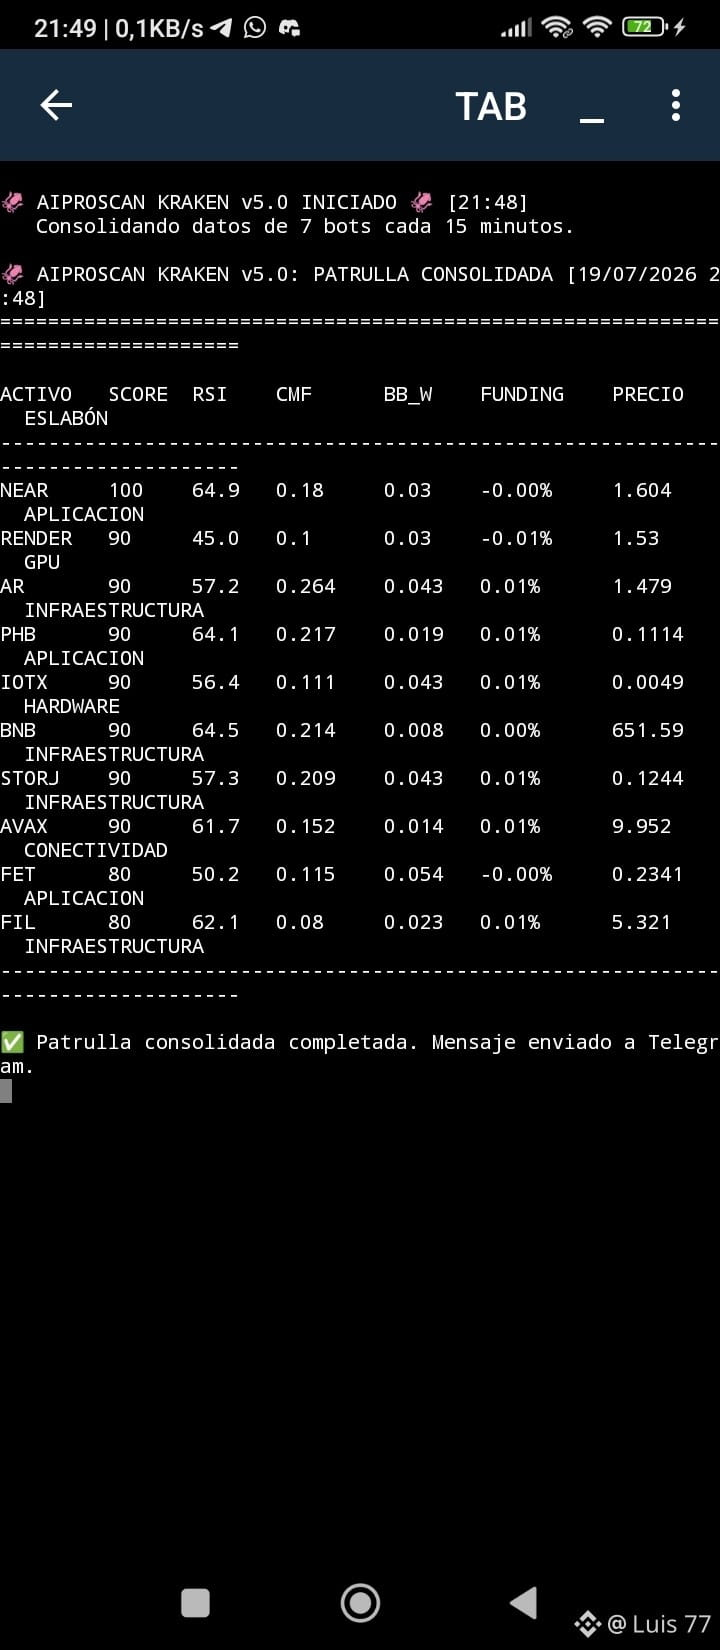
QUANTUM ANALYSIS - RENDER/USDT]
AIPROSCAN-LCX77 AGENT : Whales 🐋 🐋 🐋 accumulating in silence.
📌 CURRENT STATUS:
- RENDER does not show up on the deep-pool background radar (Deep Whale) or on abnormal volume (Alpha Momentum).
- The market is paused. Low ADX (17.7), no squeeze, no catalyst.
- Positive CMF (+0.088) indicates silent accumulation by whales.
📊 SHORT-TERM OUTLOOK (1-2 WEEKS):
- Consolidation range: $1.43 - $1.55.
- Breakout target (Bullish): $1.65 (if it breaks $1.55 with volume).
- Correction support (Bearish): $1.28 (EMA 200).
📌 INSTITUTIONAL RECOMMENDATION:
- ⏳ WATCH. There are no clear entry signals.
- The positive CMF (+0.088) is a sign that the whales are paying attention.
- Wait for ADX to rise to > 20 and for the price to break $1.55 with volume.
🔥 ENTRY CONDITION:
- If the price breaks $1.55 with volume, enter with SL at $1.43 and TP at $1.65.
===============================================================================
[END OF APPENDIX - READY TO COPY AND PASTE]Level Type Zone of Price Data Source Expected Action
Major Resistance Range ceiling $1.55 - $1.57 Kraken Express / 4H Swing High If the price reaches here with volume, it is a breakout.
Medium Resistance Consolidation ceiling $1.52 - $1.54 24h VWAP Profit-taking zone.
Equilibrium Level Fair Price $1.48 - $1.50 Accumulated VWAP A zone where price tends to return.
Dynamic Support Short-term floor $1.44 - $1.46 Minimum of 20 candles Accumulation zone.
Major Support Bottom floor $1.38 - $1.40 EMA 200 Whale liquidity zone.#FootballSeason2026 #RenderNetwork #SKHynixADRsTradeOver25%Premium #LUIS77 #BTC $BTC
{future}(RENDERUSDT)
{future}(NEARUSDT)
{future}(BTCUSDT)
QUANTUM ANALYSIS - RENDER/USDT]
AIPROSCAN-LCX77 AGENT : Whales 🐋 🐋 🐋 accumulating in silence.
📌 CURRENT STATUS:
- RENDER does not show up on the deep-pool background radar (Deep Whale) or on abnormal volume (Alpha Momentum).
- The market is paused. Low ADX (17.7), no squeeze, no catalyst.
- Positive CMF (+0.088) indicates silent accumulation by whales.
📊 SHORT-TERM OUTLOOK (1-2 WEEKS):
- Consolidation range: $1.43 - $1.55.
- Breakout target (Bullish): $1.65 (if it breaks $1.55 with volume).
- Correction support (Bearish): $1.28 (EMA 200).
📌 INSTITUTIONAL RECOMMENDATION:
- ⏳ WATCH. There are no clear entry signals.
- The positive CMF (+0.088) is a sign that the whales are paying attention.
- Wait for ADX to rise to > 20 and for the price to break $1.55 with volume.
🔥 ENTRY CONDITION:
- If the price breaks $1.55 with volume, enter with SL at $1.43 and TP at $1.65.
===============================================================================
[END OF APPENDIX - READY TO COPY AND PASTE]Level Type Zone of Price Data Source Expected Action
Major Resistance Range ceiling $1.55 - $1.57 Kraken Express / 4H Swing High If the price reaches here with volume, it is a breakout.
Medium Resistance Consolidation ceiling $1.52 - $1.54 24h VWAP Profit-taking zone.
Equilibrium Level Fair Price $1.48 - $1.50 Accumulated VWAP A zone where price tends to return.
Dynamic Support Short-term floor $1.44 - $1.46 Minimum of 20 candles Accumulation zone.
Major Support Bottom floor $1.38 - $1.40 EMA 200 Whale liquidity zone.#FootballSeason2026 #RenderNetwork #SKHynixADRsTradeOver25%Premium #LUIS77 #BTC $BTC
AIPROSCAN-LCX77 AGENT : Whales 🐋 🐋 🐋 accumulating in silence.
📌 CURRENT STATUS:
- RENDER does not show up on the deep-pool background radar (Deep Whale) or on abnormal volume (Alpha Momentum).
- The market is paused. Low ADX (17.7), no squeeze, no catalyst.
- Positive CMF (+0.088) indicates silent accumulation by whales.
📊 SHORT-TERM OUTLOOK (1-2 WEEKS):
- Consolidation range: $1.43 - $1.55.
- Breakout target (Bullish): $1.65 (if it breaks $1.55 with volume).
- Correction support (Bearish): $1.28 (EMA 200).
📌 INSTITUTIONAL RECOMMENDATION:
- ⏳ WATCH. There are no clear entry signals.
- The positive CMF (+0.088) is a sign that the whales are paying attention.
- Wait for ADX to rise to > 20 and for the price to break $1.55 with volume.
🔥 ENTRY CONDITION:
- If the price breaks $1.55 with volume, enter with SL at $1.43 and TP at $1.65.
===============================================================================
[END OF APPENDIX - READY TO COPY AND PASTE]Level Type Zone of Price Data Source Expected Action
Major Resistance Range ceiling $1.55 - $1.57 Kraken Express / 4H Swing High If the price reaches here with volume, it is a breakout.
Medium Resistance Consolidation ceiling $1.52 - $1.54 24h VWAP Profit-taking zone.
Equilibrium Level Fair Price $1.48 - $1.50 Accumulated VWAP A zone where price tends to return.
Dynamic Support Short-term floor $1.44 - $1.46 Minimum of 20 candles Accumulation zone.
Major Support Bottom floor $1.38 - $1.40 EMA 200 Whale liquidity zone.#FootballSeason2026 #RenderNetwork #SKHynixADRsTradeOver25%Premium #LUIS77 #BTC $BTC
1
333
·
--
Bullish
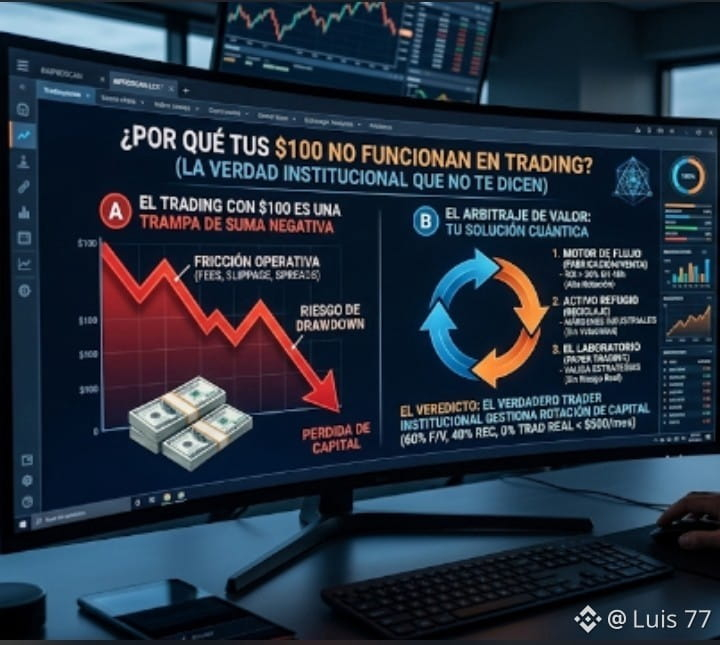
Why your $100 isn't cutting it in Trading? The institutional truth they won't tell you.
Many of us start trading with the hope of turning $100 into a monthly salary. After years of experience and developing quantitative systems, I'm here to share a truth the market doesn't want you to accept: with $100, Trading isn't a business, it's a negative sum trap.
In our multi-agent AI system within the AIPROSCAN-LCX77 scanner, part of the Depp whale scaleX project, we've conducted a deep scoring of three capital allocation pathways. What's the takeaway? Operational friction (fees, slippage, spreads) and drawdown risk destroy your capital before compound interest can kick in.
### The Quantum Edge Rule
Trading requires risk capital vs. working capital. If you use your survival capital to trade, emotional bias will make you lose even with the best AI in the world.
What do we do with $100?
The answer isn't on the chart, but in value arbitrage:
1. **The Flow Engine (Manufacturing/Selling):** The high turnover of everyday consumer goods in your community is the best "asset" for generating quick cash (ROI > 30% in 48h).
2. **The Safe Haven Asset (Recycling):** Reselling classified materials captures industrial margins without the volatility of crypto.
3. **The Laboratory (Trading):** Your AI is an intellectual asset. Use it to validate strategies in Paper Trading while your physical business funds your infrastructure.
### The Verdict
The institutional trader isn't the one who takes the most risks, but the one who manages their capital turnover best. Allocate 60% to manufacturing, 40% to recycling, and 0% to real trading until you exceed $500 in monthly surplus.
Don't look for the "next token that will do x100". Seek operational efficiency. Turn your environment into your playing field.
Want to know how we're applying IAS scoring to filter real opportunities?
#LUIS77 #CardanoFoundation1096BTCUseQuestioned #Binance $BTC
{future}(AKTUSDT)
{future}(ONDOUSDT)
{future}(ATHUSDT)
Why your $100 isn't cutting it in Trading? The institutional truth they won't tell you.
Many of us start trading with the hope of turning $100 into a monthly salary. After years of experience and developing quantitative systems, I'm here to share a truth the market doesn't want you to accept: with $100, Trading isn't a business, it's a negative sum trap.
In our multi-agent AI system within the AIPROSCAN-LCX77 scanner, part of the Depp whale scaleX project, we've conducted a deep scoring of three capital allocation pathways. What's the takeaway? Operational friction (fees, slippage, spreads) and drawdown risk destroy your capital before compound interest can kick in.
### The Quantum Edge Rule
Trading requires risk capital vs. working capital. If you use your survival capital to trade, emotional bias will make you lose even with the best AI in the world.
What do we do with $100?
The answer isn't on the chart, but in value arbitrage:
1. **The Flow Engine (Manufacturing/Selling):** The high turnover of everyday consumer goods in your community is the best "asset" for generating quick cash (ROI > 30% in 48h).
2. **The Safe Haven Asset (Recycling):** Reselling classified materials captures industrial margins without the volatility of crypto.
3. **The Laboratory (Trading):** Your AI is an intellectual asset. Use it to validate strategies in Paper Trading while your physical business funds your infrastructure.
### The Verdict
The institutional trader isn't the one who takes the most risks, but the one who manages their capital turnover best. Allocate 60% to manufacturing, 40% to recycling, and 0% to real trading until you exceed $500 in monthly surplus.
Don't look for the "next token that will do x100". Seek operational efficiency. Turn your environment into your playing field.
Want to know how we're applying IAS scoring to filter real opportunities?
#LUIS77 #CardanoFoundation1096BTCUseQuestioned #Binance $BTC
Many of us start trading with the hope of turning $100 into a monthly salary. After years of experience and developing quantitative systems, I'm here to share a truth the market doesn't want you to accept: with $100, Trading isn't a business, it's a negative sum trap.
In our multi-agent AI system within the AIPROSCAN-LCX77 scanner, part of the Depp whale scaleX project, we've conducted a deep scoring of three capital allocation pathways. What's the takeaway? Operational friction (fees, slippage, spreads) and drawdown risk destroy your capital before compound interest can kick in.
### The Quantum Edge Rule
Trading requires risk capital vs. working capital. If you use your survival capital to trade, emotional bias will make you lose even with the best AI in the world.
What do we do with $100?
The answer isn't on the chart, but in value arbitrage:
1. **The Flow Engine (Manufacturing/Selling):** The high turnover of everyday consumer goods in your community is the best "asset" for generating quick cash (ROI > 30% in 48h).
2. **The Safe Haven Asset (Recycling):** Reselling classified materials captures industrial margins without the volatility of crypto.
3. **The Laboratory (Trading):** Your AI is an intellectual asset. Use it to validate strategies in Paper Trading while your physical business funds your infrastructure.
### The Verdict
The institutional trader isn't the one who takes the most risks, but the one who manages their capital turnover best. Allocate 60% to manufacturing, 40% to recycling, and 0% to real trading until you exceed $500 in monthly surplus.
Don't look for the "next token that will do x100". Seek operational efficiency. Turn your environment into your playing field.
Want to know how we're applying IAS scoring to filter real opportunities?
#LUIS77 #CardanoFoundation1096BTCUseQuestioned #Binance $BTC
8
12
4.3k
·
--
Bullish
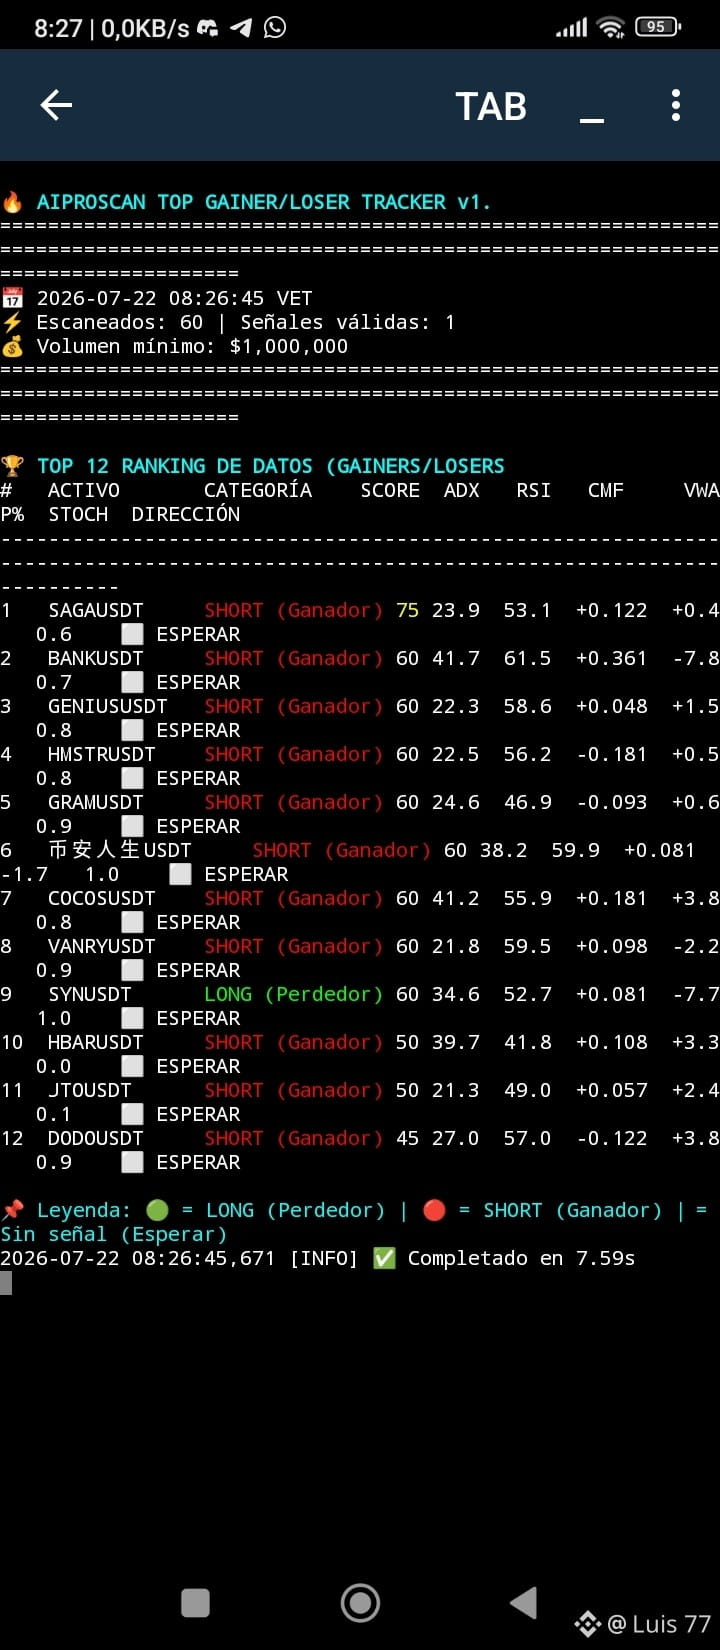
[EXECUTION APPENDIX - RADAR MERGE (08:40 VET)]
===============================================================================
DATE/TIME: 22/07/2026 - 08:40 VET
REGIME: TRENDING | SENTINEL: RISK-ON
✅ CONFIRMED BUY SIGNALS:
1. TRXUSDT (LONG - PREMIUM - 2 bots)
Entry: 0.3298 | SL: 0.3292 | TP1: 0.3307
CMF: +0.346 | ADX: 29.0
2. LTCUSDT (LONG - PREMIUM - Deep Whale)
Entry: 46.50 | SL: 46.37 | TP1: 46.62
CMF: +0.201 | ADX: 22.5 | ATH: -68.3%
3. DOGEUSDT (LONG - PREMIUM - Deep Whale)
Entry: 0.0720 | SL: 0.0710 | TP1: 0.0730
CMF: +0.068 | ADX: 20.8 | ATH: -85.1%
🔴 TACTICAL SHORT:
4. SAGAUSDT (SHORT - ACCEPTABLE - Tracker)
Entry: 0.6250 | SL: 0.6400 | TP1: 0.6000
CMF: +0.122 | ADX: 23.9
🚨 DO NOT TRADE: BANK, DEXE, RIF | Reason: Inflated VWAP or exhausted ADX.
📌 GOLDEN RULE:
- TRX and LTC are the gems of the cycle.
- DOGE is a solid complement.
- SAGA is a tactical short.
#BitcoinDominanceRisesTo59% #venzeuela #TRX✅ #LTC📈 #LUIS77 $BTC
{future}(LTCUSDT)
{future}(TRXUSDT)
{future}(SAGAUSDT)
[EXECUTION APPENDIX - RADAR MERGE (08:40 VET)]
===============================================================================
DATE/TIME: 22/07/2026 - 08:40 VET
REGIME: TRENDING | SENTINEL: RISK-ON
✅ CONFIRMED BUY SIGNALS:
1. TRXUSDT (LONG - PREMIUM - 2 bots)
Entry: 0.3298 | SL: 0.3292 | TP1: 0.3307
CMF: +0.346 | ADX: 29.0
2. LTCUSDT (LONG - PREMIUM - Deep Whale)
Entry: 46.50 | SL: 46.37 | TP1: 46.62
CMF: +0.201 | ADX: 22.5 | ATH: -68.3%
3. DOGEUSDT (LONG - PREMIUM - Deep Whale)
Entry: 0.0720 | SL: 0.0710 | TP1: 0.0730
CMF: +0.068 | ADX: 20.8 | ATH: -85.1%
🔴 TACTICAL SHORT:
4. SAGAUSDT (SHORT - ACCEPTABLE - Tracker)
Entry: 0.6250 | SL: 0.6400 | TP1: 0.6000
CMF: +0.122 | ADX: 23.9
🚨 DO NOT TRADE: BANK, DEXE, RIF | Reason: Inflated VWAP or exhausted ADX.
📌 GOLDEN RULE:
- TRX and LTC are the gems of the cycle.
- DOGE is a solid complement.
- SAGA is a tactical short.
#BitcoinDominanceRisesTo59% #venzeuela #TRX✅ #LTC📈 #LUIS77 $BTC
===============================================================================
DATE/TIME: 22/07/2026 - 08:40 VET
REGIME: TRENDING | SENTINEL: RISK-ON
✅ CONFIRMED BUY SIGNALS:
1. TRXUSDT (LONG - PREMIUM - 2 bots)
Entry: 0.3298 | SL: 0.3292 | TP1: 0.3307
CMF: +0.346 | ADX: 29.0
2. LTCUSDT (LONG - PREMIUM - Deep Whale)
Entry: 46.50 | SL: 46.37 | TP1: 46.62
CMF: +0.201 | ADX: 22.5 | ATH: -68.3%
3. DOGEUSDT (LONG - PREMIUM - Deep Whale)
Entry: 0.0720 | SL: 0.0710 | TP1: 0.0730
CMF: +0.068 | ADX: 20.8 | ATH: -85.1%
🔴 TACTICAL SHORT:
4. SAGAUSDT (SHORT - ACCEPTABLE - Tracker)
Entry: 0.6250 | SL: 0.6400 | TP1: 0.6000
CMF: +0.122 | ADX: 23.9
🚨 DO NOT TRADE: BANK, DEXE, RIF | Reason: Inflated VWAP or exhausted ADX.
📌 GOLDEN RULE:
- TRX and LTC are the gems of the cycle.
- DOGE is a solid complement.
- SAGA is a tactical short.
#BitcoinDominanceRisesTo59% #venzeuela #TRX✅ #LTC📈 #LUIS77 $BTC
1
136
·
--
Bullish
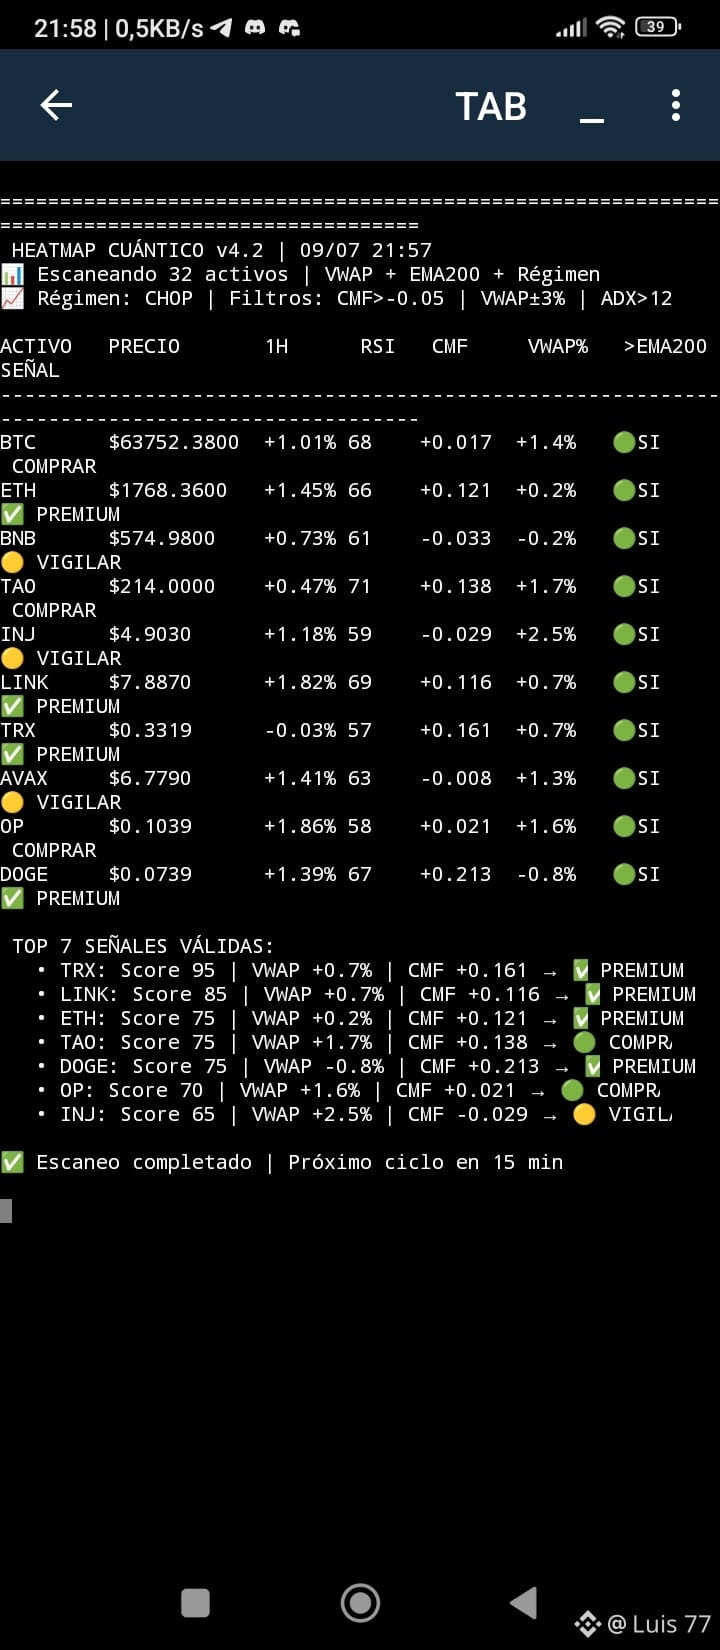
## 🚨 Quantum Alert: AIPROSCAN-LCX77 Scanner Detects an Anomaly in TRX :
The global market has entered a strict **RISK-OFF** regime (with our *SENTINEL* ETH/BTC indicator falling to 0.02780). However, during the New York session volatility, our multi-agent system has triggered alarms after recording a massive confluence of 4 institutional bots.
Here is the algorithm breakdown for trading with surgical precision:
* **Validated Prey (TRX):** Activated in the *PREMIUM* zone. It shows an optimal ignition RSI of 46.5 and an ADX of 19.8, which curbs the exhaustion. The money flow (CMF) confirms active accumulation at +0.161.
* **The Market Trap:** Beware! The *Alpha Pro* bot has locked 70% of the market’s assets because volatility expanded the candles above 1.2 ATR. This means that the vast majority of current breakouts are false and over-extended.
### 📊 Order Setup (Bayesian Filter: 72% Probability)
🟢 **LONG: TRX/USDT**
* **Entry:** $0.3317 (Limit Order)
* **Stop Loss:** $0.3290 (Strict Protection at 2 ATR)
* **Take Profit 1:** $0.3350 (Lock 50% of the position at 4 ATR)
* **Management:** Reduce risk to 1% of capital given the macro context.
❌ **DANGER ZONE:** Avoid **INJ** completely (blocked for exceeding the VWAP by +2.5% with negative CMF) and discard shorts in **SUI**.
### Trading Legend
*The alerts from the AIPROSCAN-LCX77 AGENT ecosystem
are high-confluence algorithmic tools. They do not constitute financial advice. Inflexible risk management.*
💬 **Are you protecting your capital in this RISK-OFF environment, or are you still chasing over-extended breakouts?** Leave your opinion below and share your levels. 👇#SpaceXAddedToValueIndexes #Binance #TradingSignals #IA #LUIS77 $BTC
{future}(BTCUSDT)
{future}(TRXUSDT)
{future}(ONDOUSDT)
## 🚨 Quantum Alert: AIPROSCAN-LCX77 Scanner Detects an Anomaly in TRX :
The global market has entered a strict **RISK-OFF** regime (with our *SENTINEL* ETH/BTC indicator falling to 0.02780). However, during the New York session volatility, our multi-agent system has triggered alarms after recording a massive confluence of 4 institutional bots.
Here is the algorithm breakdown for trading with surgical precision:
* **Validated Prey (TRX):** Activated in the *PREMIUM* zone. It shows an optimal ignition RSI of 46.5 and an ADX of 19.8, which curbs the exhaustion. The money flow (CMF) confirms active accumulation at +0.161.
* **The Market Trap:** Beware! The *Alpha Pro* bot has locked 70% of the market’s assets because volatility expanded the candles above 1.2 ATR. This means that the vast majority of current breakouts are false and over-extended.
### 📊 Order Setup (Bayesian Filter: 72% Probability)
🟢 **LONG: TRX/USDT**
* **Entry:** $0.3317 (Limit Order)
* **Stop Loss:** $0.3290 (Strict Protection at 2 ATR)
* **Take Profit 1:** $0.3350 (Lock 50% of the position at 4 ATR)
* **Management:** Reduce risk to 1% of capital given the macro context.
❌ **DANGER ZONE:** Avoid **INJ** completely (blocked for exceeding the VWAP by +2.5% with negative CMF) and discard shorts in **SUI**.
### Trading Legend
*The alerts from the AIPROSCAN-LCX77 AGENT ecosystem
are high-confluence algorithmic tools. They do not constitute financial advice. Inflexible risk management.*
💬 **Are you protecting your capital in this RISK-OFF environment, or are you still chasing over-extended breakouts?** Leave your opinion below and share your levels. 👇#SpaceXAddedToValueIndexes #Binance #TradingSignals #IA #LUIS77 $BTC
The global market has entered a strict **RISK-OFF** regime (with our *SENTINEL* ETH/BTC indicator falling to 0.02780). However, during the New York session volatility, our multi-agent system has triggered alarms after recording a massive confluence of 4 institutional bots.
Here is the algorithm breakdown for trading with surgical precision:
* **Validated Prey (TRX):** Activated in the *PREMIUM* zone. It shows an optimal ignition RSI of 46.5 and an ADX of 19.8, which curbs the exhaustion. The money flow (CMF) confirms active accumulation at +0.161.
* **The Market Trap:** Beware! The *Alpha Pro* bot has locked 70% of the market’s assets because volatility expanded the candles above 1.2 ATR. This means that the vast majority of current breakouts are false and over-extended.
### 📊 Order Setup (Bayesian Filter: 72% Probability)
🟢 **LONG: TRX/USDT**
* **Entry:** $0.3317 (Limit Order)
* **Stop Loss:** $0.3290 (Strict Protection at 2 ATR)
* **Take Profit 1:** $0.3350 (Lock 50% of the position at 4 ATR)
* **Management:** Reduce risk to 1% of capital given the macro context.
❌ **DANGER ZONE:** Avoid **INJ** completely (blocked for exceeding the VWAP by +2.5% with negative CMF) and discard shorts in **SUI**.
### Trading Legend
*The alerts from the AIPROSCAN-LCX77 AGENT ecosystem
are high-confluence algorithmic tools. They do not constitute financial advice. Inflexible risk management.*
💬 **Are you protecting your capital in this RISK-OFF environment, or are you still chasing over-extended breakouts?** Leave your opinion below and share your levels. 👇#SpaceXAddedToValueIndexes #Binance #TradingSignals #IA #LUIS77 $BTC
260
·
--
Bullish
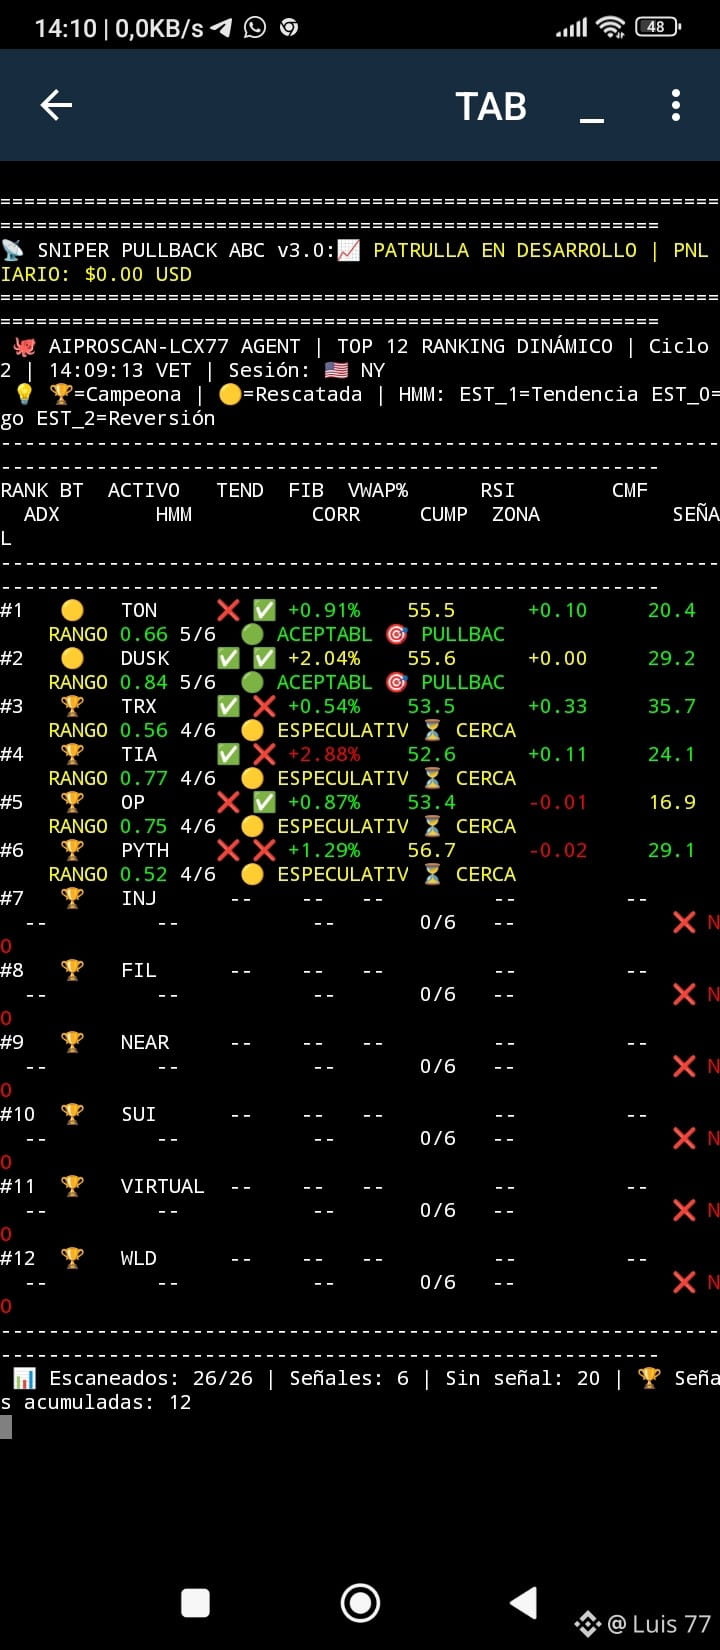
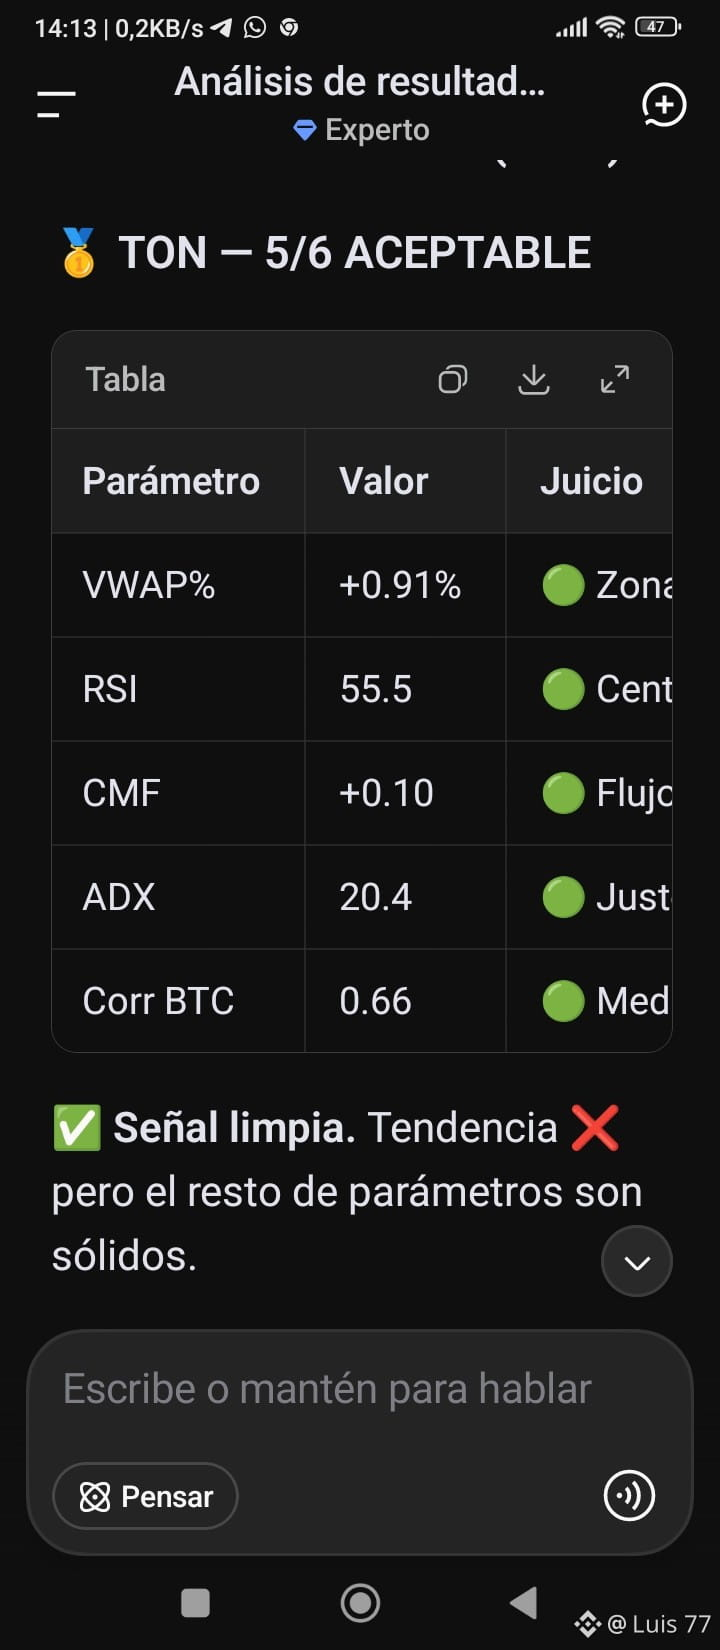
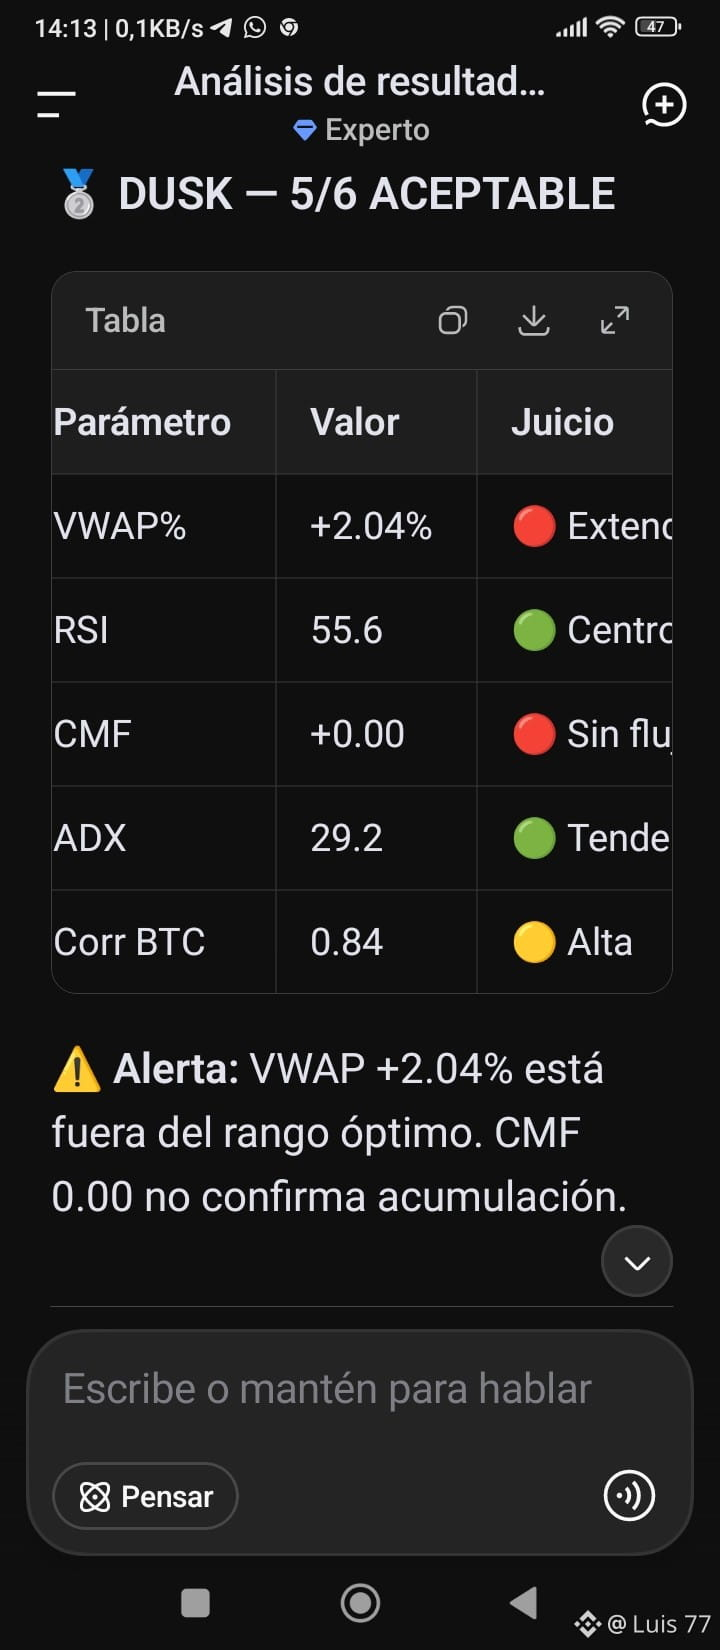
The hidden advantage that separates reactive traders from precise traders 🔥
Most market participants look at candlesticks.
High-level traders read structure, intent, and movement.
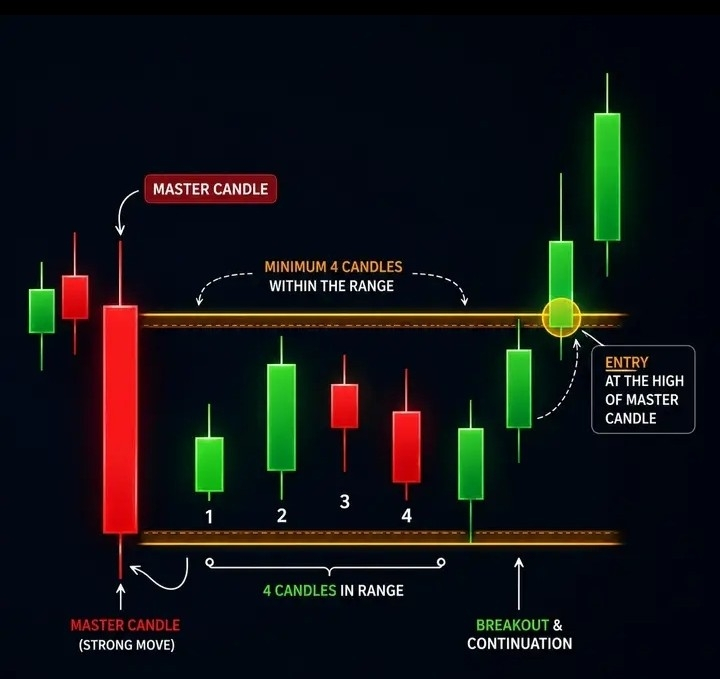
That's where Candle Range Theory (CRT) comes in: an approach that goes beyond whether the candle closed green or red, but focuses on how the price moved within that range and what it reveals about the tug-of-war between buyers and sellers.
Each candle leaves a footprint. Its total range, body size, wick length, and closing position tell a story.
A candle with a wide range, solid body, and close near the high often reflects expansion with real intent.
A candle with a long upper wick and weak close usually warns of rejection, absorption, or distribution.
A small candle following a strong impulse often indicates compression, and often anticipates the next significant move.
The true power of CRT appears when you use it as an operational filter:
Expansion: identifies genuine movements.
Rejection: detects traps and liquidity grabs.
Compression: locates zones prior to breakouts or continuations.
But the detail that makes a difference is the context.
CRT on its own is useful.
CRT combined with VWAP, volume, RSI, ADX, and market structure becomes a much more serious tool. If an expansion candle appears above VWAP, with strong ADX and accompanying volume, the reading changes completely. You’re no longer looking at a pretty candle; you’re seeing structured probability.
My reading:
candles don’t just show price; they show behavior.
And those who learn to read the range stop chasing moves and start understanding them.
💬 If this post adds value for you, I’ll prepare the next one: how to use CRT in 1H and 4H to detect entries, traps, and continuations with institutional logic.
#PriceAction #BinanceToOpenXLMSpotTrading #BinanceSquare #LUIS77 #SpaceXPremarketFalls4.6% $BTC
{future}(TONUSDT)
{future}(DUSKUSDT)
{future}(BTCUSDT)
The hidden advantage that separates reactive traders from precise traders 🔥
Most market participants look at candlesticks.
High-level traders read structure, intent, and movement.
That's where Candle Range Theory (CRT) comes in: an approach that goes beyond whether the candle closed green or red, but focuses on how the price moved within that range and what it reveals about the tug-of-war between buyers and sellers.
Each candle leaves a footprint. Its total range, body size, wick length, and closing position tell a story.
A candle with a wide range, solid body, and close near the high often reflects expansion with real intent.
A candle with a long upper wick and weak close usually warns of rejection, absorption, or distribution.
A small candle following a strong impulse often indicates compression, and often anticipates the next significant move.
The true power of CRT appears when you use it as an operational filter:
Expansion: identifies genuine movements.
Rejection: detects traps and liquidity grabs.
Compression: locates zones prior to breakouts or continuations.
But the detail that makes a difference is the context.
CRT on its own is useful.
CRT combined with VWAP, volume, RSI, ADX, and market structure becomes a much more serious tool. If an expansion candle appears above VWAP, with strong ADX and accompanying volume, the reading changes completely. You’re no longer looking at a pretty candle; you’re seeing structured probability.
My reading:
candles don’t just show price; they show behavior.
And those who learn to read the range stop chasing moves and start understanding them.
💬 If this post adds value for you, I’ll prepare the next one: how to use CRT in 1H and 4H to detect entries, traps, and continuations with institutional logic.
#PriceAction #BinanceToOpenXLMSpotTrading #BinanceSquare #LUIS77 #SpaceXPremarketFalls4.6% $BTC
Most market participants look at candlesticks.
High-level traders read structure, intent, and movement.
That's where Candle Range Theory (CRT) comes in: an approach that goes beyond whether the candle closed green or red, but focuses on how the price moved within that range and what it reveals about the tug-of-war between buyers and sellers.
Each candle leaves a footprint. Its total range, body size, wick length, and closing position tell a story.
A candle with a wide range, solid body, and close near the high often reflects expansion with real intent.
A candle with a long upper wick and weak close usually warns of rejection, absorption, or distribution.
A small candle following a strong impulse often indicates compression, and often anticipates the next significant move.
The true power of CRT appears when you use it as an operational filter:
Expansion: identifies genuine movements.
Rejection: detects traps and liquidity grabs.
Compression: locates zones prior to breakouts or continuations.
But the detail that makes a difference is the context.
CRT on its own is useful.
CRT combined with VWAP, volume, RSI, ADX, and market structure becomes a much more serious tool. If an expansion candle appears above VWAP, with strong ADX and accompanying volume, the reading changes completely. You’re no longer looking at a pretty candle; you’re seeing structured probability.
My reading:
candles don’t just show price; they show behavior.
And those who learn to read the range stop chasing moves and start understanding them.
💬 If this post adds value for you, I’ll prepare the next one: how to use CRT in 1H and 4H to detect entries, traps, and continuations with institutional logic.
#PriceAction #BinanceToOpenXLMSpotTrading #BinanceSquare #LUIS77 #SpaceXPremarketFalls4.6% $BTC
156
·
--
Bearish
SOL continues bearish pressure toward $71.50 - $72.00
According to reports from my tracking system AIPROSCAN-LCX77 AGENT;
• 4H LL (BEARISH) remains valid
• Near the PDL suggests it may seek lower liquidity
• No institutional buyers (negative CMF)
• DISTRIBUTION session = no volatility
Projection: $72.57 → $72.00 → $71.50SOL breaks the PDL and accelerates toward $70.00 - $71.00
• If BTC loses $64,000
• If the market opens tomorrow with a bearish gap
• POWER TOWER SHORT activates strongly
Projection: $72.57 → $71.00 → $70.00⚠️ SOL — MONITOR, DO NOT TRADE NOW
REASONS:
• Only v8.0 supports the short (no confluence)
• DISTRIBUTION session (do not trade)
• No CRT data in this cycle
SET UP FOR TOMORROW:
• If SOL opens with POWER TOWER SHORT in v8.0 + v9.1 + v10.5
• If the CRT Bot detects CRT ≥ 1/3
• If the price is below $72.00
POTENTIAL SHORT ENTRY:
• Entry: $71.80 - $72.00
• SL: $72.60
• TP: $70.50
• R:R 1:2.0
⏰ Wait for GOLDEN WINDOW 1 (06:30 VET), where there is greater injection of institutional capital—and be careful not to trade without validating the structure with 1D, 4H, 1H candles. #USInitialJoblessClaimsStayBelow200K #Binance #JapanRegulatorsUrgeCryptoWithdrawalLimits #LUIS77 $SOL
{future}(BTCUSDT)
{future}(SOLUSDT)
{future}(NEARUSDT)
SOL continues bearish pressure toward $71.50 - $72.00
According to reports from my tracking system AIPROSCAN-LCX77 AGENT;
• 4H LL (BEARISH) remains valid
• Near the PDL suggests it may seek lower liquidity
• No institutional buyers (negative CMF)
• DISTRIBUTION session = no volatility
Projection: $72.57 → $72.00 → $71.50SOL breaks the PDL and accelerates toward $70.00 - $71.00
• If BTC loses $64,000
• If the market opens tomorrow with a bearish gap
• POWER TOWER SHORT activates strongly
Projection: $72.57 → $71.00 → $70.00⚠️ SOL — MONITOR, DO NOT TRADE NOW
REASONS:
• Only v8.0 supports the short (no confluence)
• DISTRIBUTION session (do not trade)
• No CRT data in this cycle
SET UP FOR TOMORROW:
• If SOL opens with POWER TOWER SHORT in v8.0 + v9.1 + v10.5
• If the CRT Bot detects CRT ≥ 1/3
• If the price is below $72.00
POTENTIAL SHORT ENTRY:
• Entry: $71.80 - $72.00
• SL: $72.60
• TP: $70.50
• R:R 1:2.0
⏰ Wait for GOLDEN WINDOW 1 (06:30 VET), where there is greater injection of institutional capital—and be careful not to trade without validating the structure with 1D, 4H, 1H candles. #USInitialJoblessClaimsStayBelow200K #Binance #JapanRegulatorsUrgeCryptoWithdrawalLimits #LUIS77 $SOL
According to reports from my tracking system AIPROSCAN-LCX77 AGENT;
• 4H LL (BEARISH) remains valid
• Near the PDL suggests it may seek lower liquidity
• No institutional buyers (negative CMF)
• DISTRIBUTION session = no volatility
Projection: $72.57 → $72.00 → $71.50SOL breaks the PDL and accelerates toward $70.00 - $71.00
• If BTC loses $64,000
• If the market opens tomorrow with a bearish gap
• POWER TOWER SHORT activates strongly
Projection: $72.57 → $71.00 → $70.00⚠️ SOL — MONITOR, DO NOT TRADE NOW
REASONS:
• Only v8.0 supports the short (no confluence)
• DISTRIBUTION session (do not trade)
• No CRT data in this cycle
SET UP FOR TOMORROW:
• If SOL opens with POWER TOWER SHORT in v8.0 + v9.1 + v10.5
• If the CRT Bot detects CRT ≥ 1/3
• If the price is below $72.00
POTENTIAL SHORT ENTRY:
• Entry: $71.80 - $72.00
• SL: $72.60
• TP: $70.50
• R:R 1:2.0
⏰ Wait for GOLDEN WINDOW 1 (06:30 VET), where there is greater injection of institutional capital—and be careful not to trade without validating the structure with 1D, 4H, 1H candles. #USInitialJoblessClaimsStayBelow200K #Binance #JapanRegulatorsUrgeCryptoWithdrawalLimits #LUIS77 $SOL
371
·
--
Bullish
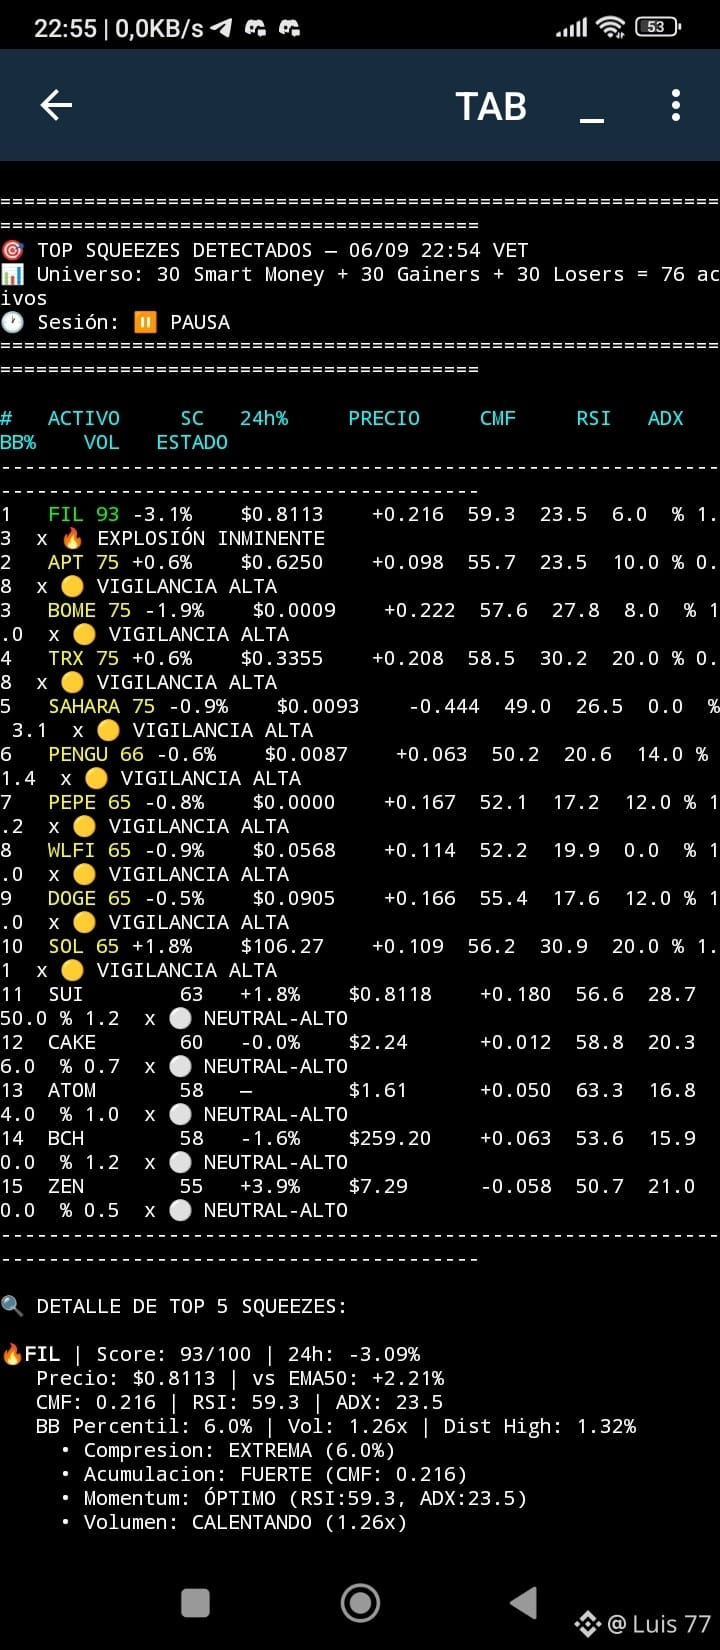
📊 TECHNICAL ANALYSIS — HIDDEN GEM DETECTED (PRE-ASIA)
Based on AIPROSCAN-LCX77 Quantum System
---
💎 FIL — THE GEM NOBODY SAW
DATA VALUE
CMF +0.216 (strong institutional flow)
ADX 23.5 (inflection, trend forming)
VWAP -0.7% (value zone)
BB% 6.0% (extreme compression)
RVOL 1.26x (volume heating up)
Score 93/100 (imminent explosion)
Signal: Price falling (-3.09% 24h), BUT CMF positive → bullish divergence. Smart capital is accumulating silently.
📍 Entry: 0.8100 - 0.8150
🎯 TP1: 0.8300 / TP2: 0.8500 / TP3: 0.8700
🛑 SL: 0.7900
📊 R:R 1:2.8
---
🧠 Why is it a GEM?
1. CMF > +0.10 while price is dropping → silent accumulation.
2. BBW < 6% → extreme compression, the fuse is lit.
3. ADX 23.5 → trend forming, perfect timing.
4. Confluence of 2 bots → Squeeze Hunter + Deep Whale.
---
⚠️ Context
Zombie market (Vol 0.39x), BTC bearish. Use 50% position size.
Patience and math win.
Feeling bullish on FIL? Let me know in the comments. 👇
#FIL/USDT #CNPYAirdropOnBinanceAlpha #LUIS77 #venezuela #BTC $BTC
{future}(FILUSDT)
{future}(BTCUSDT)
{future}(ASTERUSDT)
📊 TECHNICAL ANALYSIS — HIDDEN GEM DETECTED (PRE-ASIA)
Based on AIPROSCAN-LCX77 Quantum System
---
💎 FIL — THE GEM NOBODY SAW
DATA VALUE
CMF +0.216 (strong institutional flow)
ADX 23.5 (inflection, trend forming)
VWAP -0.7% (value zone)
BB% 6.0% (extreme compression)
RVOL 1.26x (volume heating up)
Score 93/100 (imminent explosion)
Signal: Price falling (-3.09% 24h), BUT CMF positive → bullish divergence. Smart capital is accumulating silently.
📍 Entry: 0.8100 - 0.8150
🎯 TP1: 0.8300 / TP2: 0.8500 / TP3: 0.8700
🛑 SL: 0.7900
📊 R:R 1:2.8
---
🧠 Why is it a GEM?
1. CMF > +0.10 while price is dropping → silent accumulation.
2. BBW < 6% → extreme compression, the fuse is lit.
3. ADX 23.5 → trend forming, perfect timing.
4. Confluence of 2 bots → Squeeze Hunter + Deep Whale.
---
⚠️ Context
Zombie market (Vol 0.39x), BTC bearish. Use 50% position size.
Patience and math win.
Feeling bullish on FIL? Let me know in the comments. 👇
#FIL/USDT #CNPYAirdropOnBinanceAlpha #LUIS77 #venezuela #BTC $BTC
Based on AIPROSCAN-LCX77 Quantum System
---
💎 FIL — THE GEM NOBODY SAW
DATA VALUE
CMF +0.216 (strong institutional flow)
ADX 23.5 (inflection, trend forming)
VWAP -0.7% (value zone)
BB% 6.0% (extreme compression)
RVOL 1.26x (volume heating up)
Score 93/100 (imminent explosion)
Signal: Price falling (-3.09% 24h), BUT CMF positive → bullish divergence. Smart capital is accumulating silently.
📍 Entry: 0.8100 - 0.8150
🎯 TP1: 0.8300 / TP2: 0.8500 / TP3: 0.8700
🛑 SL: 0.7900
📊 R:R 1:2.8
---
🧠 Why is it a GEM?
1. CMF > +0.10 while price is dropping → silent accumulation.
2. BBW < 6% → extreme compression, the fuse is lit.
3. ADX 23.5 → trend forming, perfect timing.
4. Confluence of 2 bots → Squeeze Hunter + Deep Whale.
---
⚠️ Context
Zombie market (Vol 0.39x), BTC bearish. Use 50% position size.
Patience and math win.
Feeling bullish on FIL? Let me know in the comments. 👇
#FIL/USDT #CNPYAirdropOnBinanceAlpha #LUIS77 #venezuela #BTC $BTC
978
·
--
Bullish
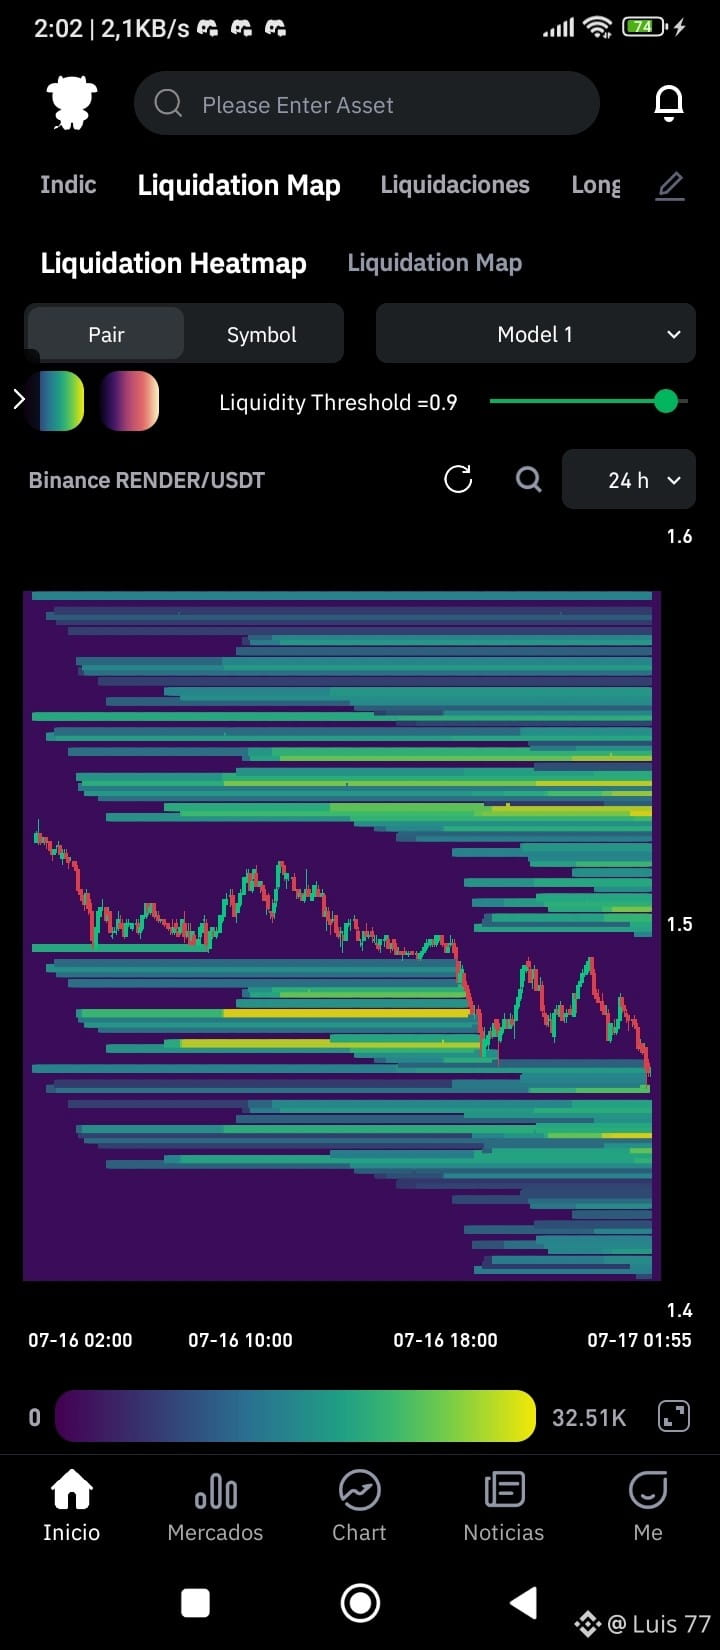
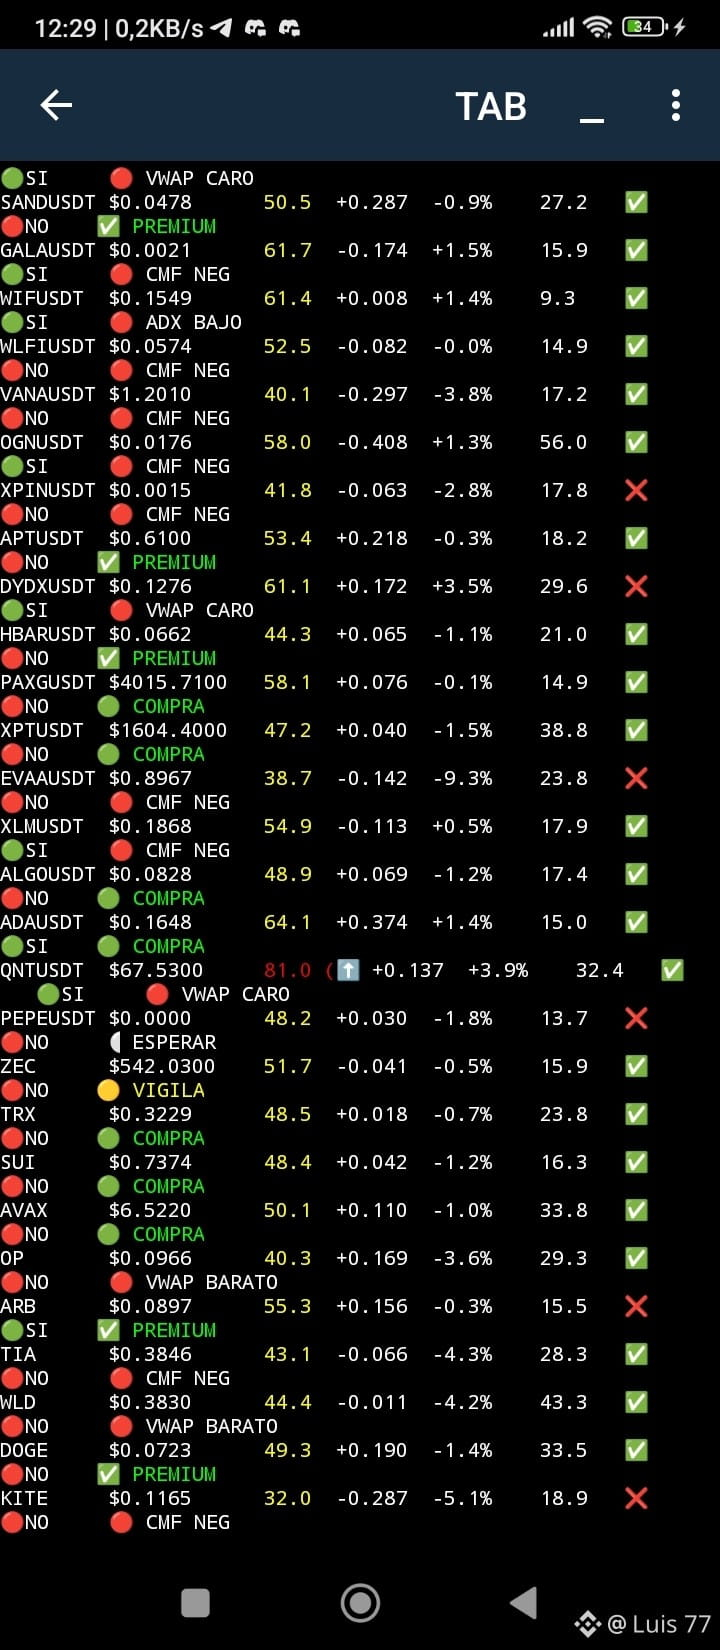
QUANTUM ANALYSIS AIPROSCAN-LCX77 AGENT :
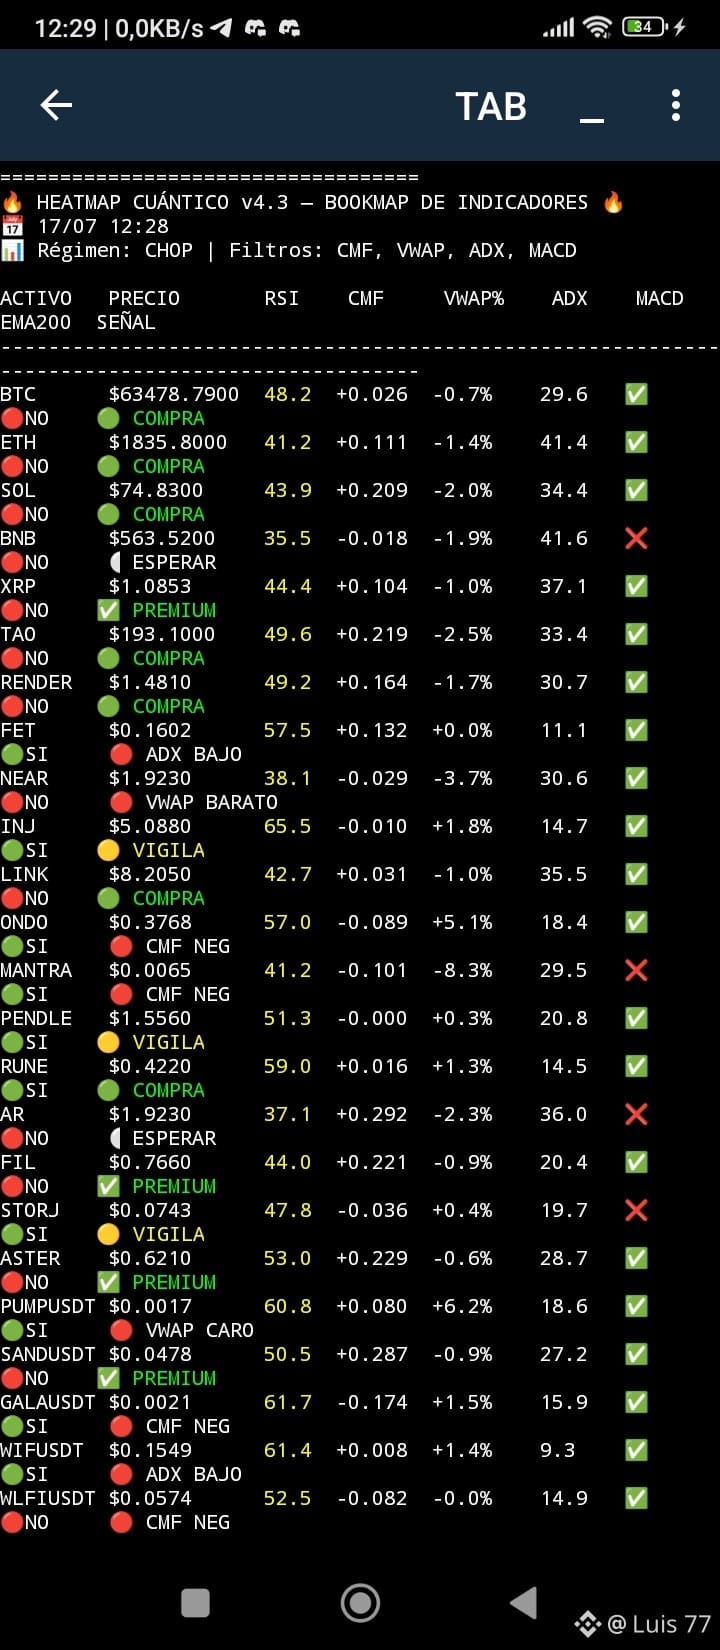
[EXECUTION ANNEX - RENDER/USDT]
===============================================================================
DATE/TIME: 17/07/2026 - 12:38 VET
ASSET: RENDER/USDT
CURRENT PRICE: $1.4810
SHORT-TERM PROJECTION: $1.60
MEDIUM-TERM PROJECTION: $2.00 - $2.20
INSTITUTIONAL DATA:
- Well Fund: ATH -95.7% (841 days of decline).
- Whales Accumulation: CMF +0.164.
- Trend: ADX 30.7 (Optimal).
- Fair Price: VWAP -1.7% (Discount).
- Squeeze Validated: Confirmed by Abyssal Hunt.
- Narrative: AI (Artificial Intelligence).
ACTION PLAN:
1. Entry: $1.4810 (Current Price).
2. Stop Loss: $1.4500 (Support of 20 candles).
3. Take Profit 1: $1.6000 (3 ATR).
4. Take Profit 2: Trailing Stop at 50% of the position.
📌 GOLDEN RULE:
RENDER has the confluence of 4 bots. It is the best signal .#CardanoHardForkUpgradeSetForJuly18 #IA #BinanceSquare #LUIS77
{future}(RENDERUSDT)
{future}(NVDAUSDT)
{future}(BTCUSDT)
QUANTUM ANALYSIS AIPROSCAN-LCX77 AGENT :
[EXECUTION ANNEX - RENDER/USDT]
===============================================================================
DATE/TIME: 17/07/2026 - 12:38 VET
ASSET: RENDER/USDT
CURRENT PRICE: $1.4810
SHORT-TERM PROJECTION: $1.60
MEDIUM-TERM PROJECTION: $2.00 - $2.20
INSTITUTIONAL DATA:
- Well Fund: ATH -95.7% (841 days of decline).
- Whales Accumulation: CMF +0.164.
- Trend: ADX 30.7 (Optimal).
- Fair Price: VWAP -1.7% (Discount).
- Squeeze Validated: Confirmed by Abyssal Hunt.
- Narrative: AI (Artificial Intelligence).
ACTION PLAN:
1. Entry: $1.4810 (Current Price).
2. Stop Loss: $1.4500 (Support of 20 candles).
3. Take Profit 1: $1.6000 (3 ATR).
4. Take Profit 2: Trailing Stop at 50% of the position.
📌 GOLDEN RULE:
RENDER has the confluence of 4 bots. It is the best signal .#CardanoHardForkUpgradeSetForJuly18 #IA #BinanceSquare #LUIS77
[EXECUTION ANNEX - RENDER/USDT]
===============================================================================
DATE/TIME: 17/07/2026 - 12:38 VET
ASSET: RENDER/USDT
CURRENT PRICE: $1.4810
SHORT-TERM PROJECTION: $1.60
MEDIUM-TERM PROJECTION: $2.00 - $2.20
INSTITUTIONAL DATA:
- Well Fund: ATH -95.7% (841 days of decline).
- Whales Accumulation: CMF +0.164.
- Trend: ADX 30.7 (Optimal).
- Fair Price: VWAP -1.7% (Discount).
- Squeeze Validated: Confirmed by Abyssal Hunt.
- Narrative: AI (Artificial Intelligence).
ACTION PLAN:
1. Entry: $1.4810 (Current Price).
2. Stop Loss: $1.4500 (Support of 20 candles).
3. Take Profit 1: $1.6000 (3 ATR).
4. Take Profit 2: Trailing Stop at 50% of the position.
📌 GOLDEN RULE:
RENDER has the confluence of 4 bots. It is the best signal .#CardanoHardForkUpgradeSetForJuly18 #IA #BinanceSquare #LUIS77
105
·
--
Bullish
🛑 STOP TRADING: the context is telling you NOT to trade:
When you learn that this session time in Asia is not recommended for trading, and you build scanner bots that plan your trading hours.
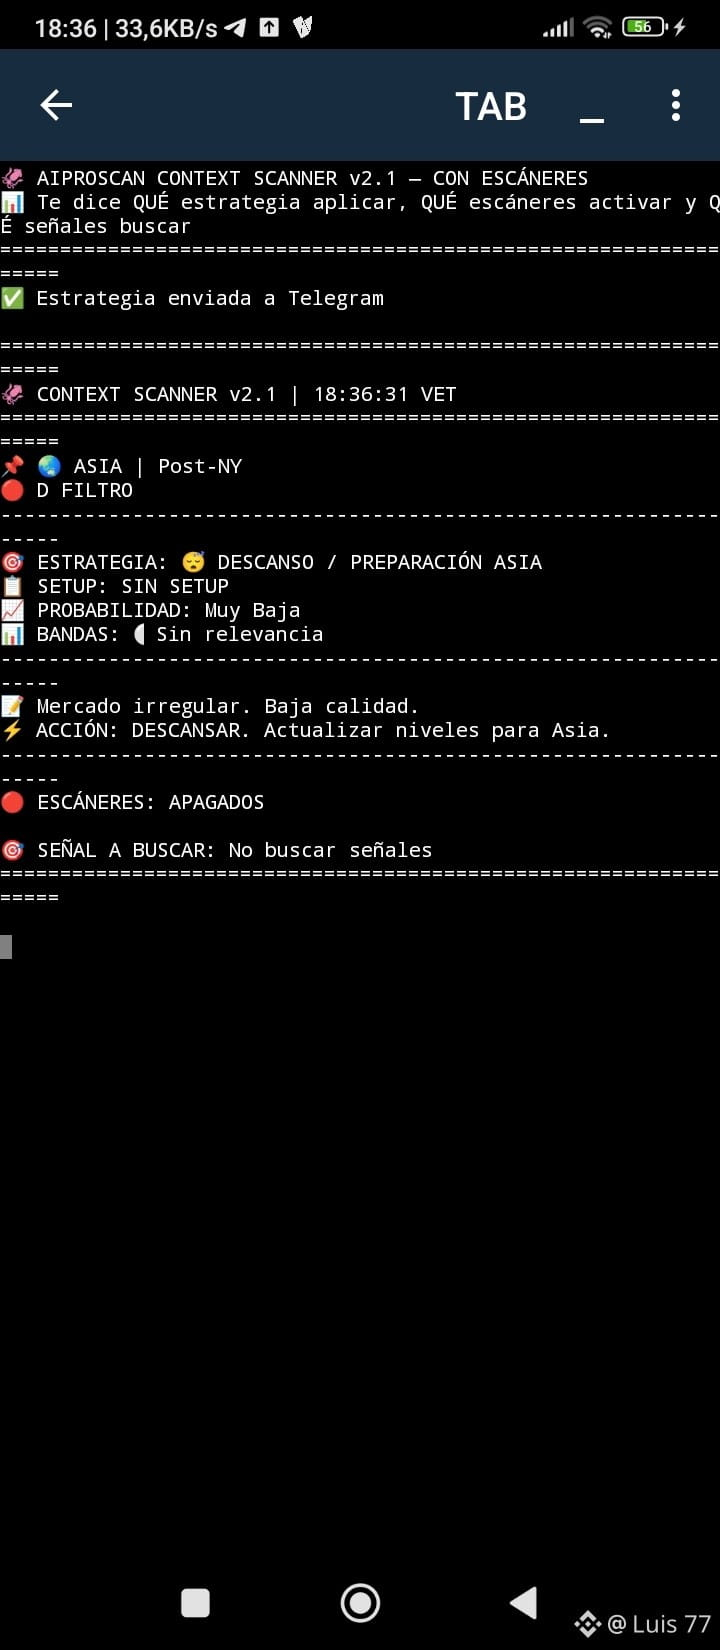
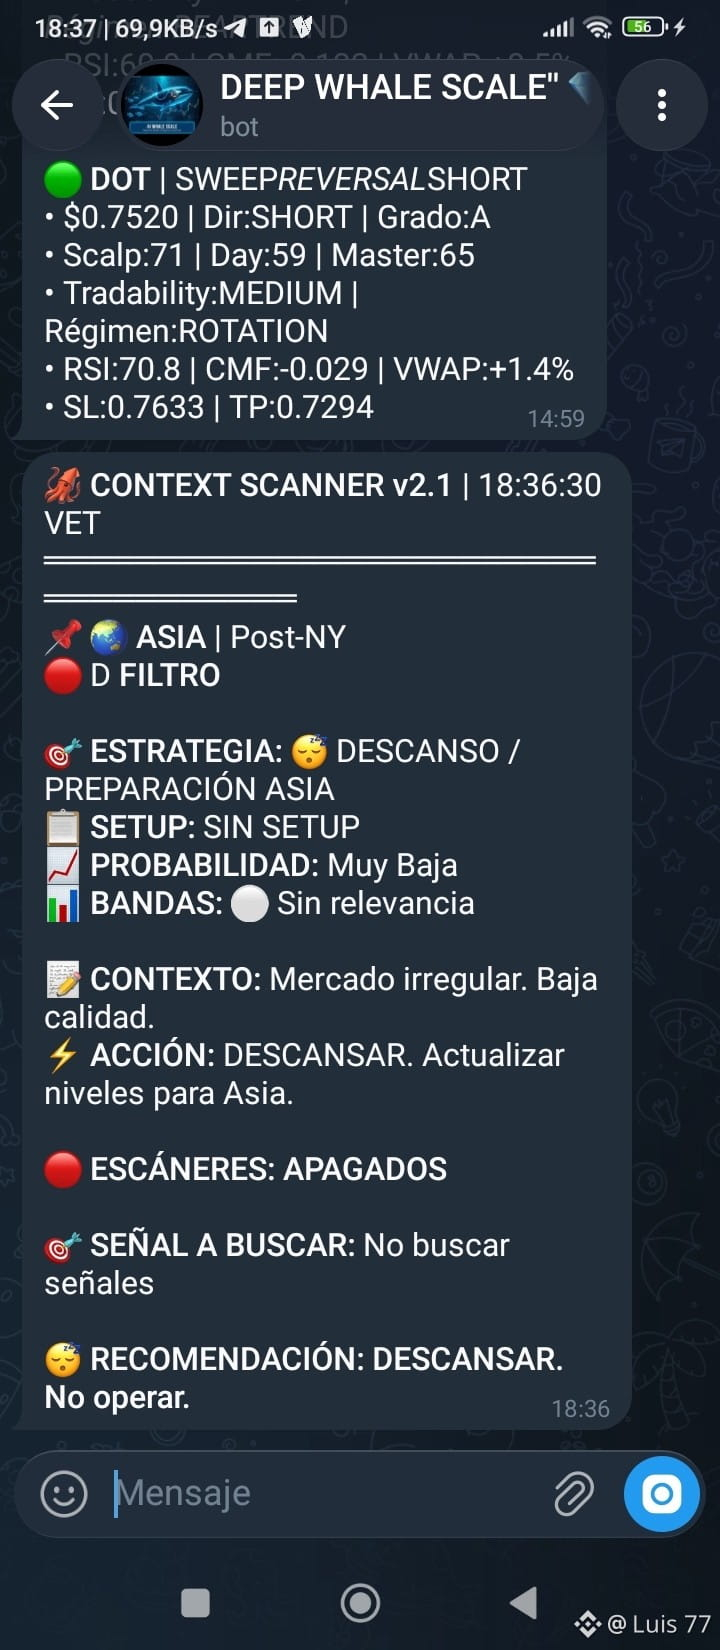
If you don’t read the macro session context, any isolated signal loses value. In AIPROSCAN, Order Flow is not interpreted on its own: it is validated against regime, liquidity, and structure. When that framework breaks, the best trade is usually not to enter.
At 18:36 VET, the scanner triggered a red alert. Not because of missing indicators, but because conditions were missing.
We’re in the liquidity gap between New York’s operational close and the transition into Asia. In this stretch, the market usually rotates, not expands.
What does the model detect?
1) Irregular market
Price without clean directionality, with frequent sweeps and poor continuity.
2) Deteriorated probability
The market is readjusting flow between sessions. Institutional intent hasn’t been confirmed yet.
3) Incomplete setup
There isn’t enough confluence between volatility, strength, and participation. If Bands, ADX, and CVD don’t line up, the signal remains incomplete.
⚠️ Quant rule:
You don’t win more by trading more; you win by filtering when the probability is low.
Yes, tactical temptations may appear in specific assets. But if the overall context is rotation, many of those entries end up being noise.
🎯 Plan for this session:
reduce exposure
protect profits
avoid new impulsive entries
prepare levels for Asia and wait for volume confirmation
In serious trading, discipline isn’t always seen as action.
Sometimes it looks like patience.
#BinanceSquare #DollarHits3MonthLow #ADA #priceaction #LUIS77 $XRP
{future}(ADAUSDT)
{future}(XRPUSDT)
{future}(BTCUSDT)
🛑 STOP TRADING: the context is telling you NOT to trade:
When you learn that this session time in Asia is not recommended for trading, and you build scanner bots that plan your trading hours.
If you don’t read the macro session context, any isolated signal loses value. In AIPROSCAN, Order Flow is not interpreted on its own: it is validated against regime, liquidity, and structure. When that framework breaks, the best trade is usually not to enter.
At 18:36 VET, the scanner triggered a red alert. Not because of missing indicators, but because conditions were missing.
We’re in the liquidity gap between New York’s operational close and the transition into Asia. In this stretch, the market usually rotates, not expands.
What does the model detect?
1) Irregular market
Price without clean directionality, with frequent sweeps and poor continuity.
2) Deteriorated probability
The market is readjusting flow between sessions. Institutional intent hasn’t been confirmed yet.
3) Incomplete setup
There isn’t enough confluence between volatility, strength, and participation. If Bands, ADX, and CVD don’t line up, the signal remains incomplete.
⚠️ Quant rule:
You don’t win more by trading more; you win by filtering when the probability is low.
Yes, tactical temptations may appear in specific assets. But if the overall context is rotation, many of those entries end up being noise.
🎯 Plan for this session:
reduce exposure
protect profits
avoid new impulsive entries
prepare levels for Asia and wait for volume confirmation
In serious trading, discipline isn’t always seen as action.
Sometimes it looks like patience.
#BinanceSquare #DollarHits3MonthLow #ADA #priceaction #LUIS77 $XRP
When you learn that this session time in Asia is not recommended for trading, and you build scanner bots that plan your trading hours.
If you don’t read the macro session context, any isolated signal loses value. In AIPROSCAN, Order Flow is not interpreted on its own: it is validated against regime, liquidity, and structure. When that framework breaks, the best trade is usually not to enter.
At 18:36 VET, the scanner triggered a red alert. Not because of missing indicators, but because conditions were missing.
We’re in the liquidity gap between New York’s operational close and the transition into Asia. In this stretch, the market usually rotates, not expands.
What does the model detect?
1) Irregular market
Price without clean directionality, with frequent sweeps and poor continuity.
2) Deteriorated probability
The market is readjusting flow between sessions. Institutional intent hasn’t been confirmed yet.
3) Incomplete setup
There isn’t enough confluence between volatility, strength, and participation. If Bands, ADX, and CVD don’t line up, the signal remains incomplete.
⚠️ Quant rule:
You don’t win more by trading more; you win by filtering when the probability is low.
Yes, tactical temptations may appear in specific assets. But if the overall context is rotation, many of those entries end up being noise.
🎯 Plan for this session:
reduce exposure
protect profits
avoid new impulsive entries
prepare levels for Asia and wait for volume confirmation
In serious trading, discipline isn’t always seen as action.
Sometimes it looks like patience.
#BinanceSquare #DollarHits3MonthLow #ADA #priceaction #LUIS77 $XRP
620
·
--
Bullish
TITLE: Quantinuum is not just news: it’s the sign of a new rotation toward crypto-infra
POST:
Wall Street has just sent a signal that many still aren’t reading correctly:
Quantum + AI + HPC is no longer science fiction.
It’s an infrastructure narrative.
If Quantinuum accelerates the institutional validation of post-classical computing, the crypto market won’t only reward “AI tokens” by label.
It will reward infrastructure proxies.
My take:
This news isn’t bullish for “everything”.
It’s bullish for the assets that capture:
decentralized compute
data orchestration
AI coordination
storage & security rails
Top 6 crypto proxies I’m watching:
1) RNDR — cleanest compute/GPU proxy
2) AKT — decentralized cloud and sovereign infrastructure
3) TAO — decentralized intelligence network, high beta
4) LINK — middleware and institutional data layer
5) FET — agents, automation, and AI economy
6) AR — second-order derivative storage/data persistence
What to look for in the market
I’m not interested in the headline.
I care whether this shows up:
RNDR/BTC breaking upward
AKT and TAO with real volume expansion
the AI/compute basket outperforming BTC and ETH
3–5 session continuity, not just a single FOMO candle
My conclusion:
The next phase won’t just be “buying AI”.
It will be identifying which tokens are truly the shovel sellers of the new technological cycle.
And in crypto, today my favorite shovels are:
RNDR, AKT, TAO, LINK, FET and AR.
Smart capital doesn’t chase labels. It chases infrastructure.
#AI #Quantum #HPC #RNDR #TAO #AKT #LINK #FET #AR #CryptoResearch #BinanceSquare #SamsungSKHynixSharesRiseYTD #LUIS77
{future}(BTCUSDT)
{future}(RENDERUSDT)
{future}(LINKUSDT)
TITLE: Quantinuum is not just news: it’s the sign of a new rotation toward crypto-infra
POST:
Wall Street has just sent a signal that many still aren’t reading correctly:
Quantum + AI + HPC is no longer science fiction.
It’s an infrastructure narrative.
If Quantinuum accelerates the institutional validation of post-classical computing, the crypto market won’t only reward “AI tokens” by label.
It will reward infrastructure proxies.
My take:
This news isn’t bullish for “everything”.
It’s bullish for the assets that capture:
decentralized compute
data orchestration
AI coordination
storage & security rails
Top 6 crypto proxies I’m watching:
1) RNDR — cleanest compute/GPU proxy
2) AKT — decentralized cloud and sovereign infrastructure
3) TAO — decentralized intelligence network, high beta
4) LINK — middleware and institutional data layer
5) FET — agents, automation, and AI economy
6) AR — second-order derivative storage/data persistence
What to look for in the market
I’m not interested in the headline.
I care whether this shows up:
RNDR/BTC breaking upward
AKT and TAO with real volume expansion
the AI/compute basket outperforming BTC and ETH
3–5 session continuity, not just a single FOMO candle
My conclusion:
The next phase won’t just be “buying AI”.
It will be identifying which tokens are truly the shovel sellers of the new technological cycle.
And in crypto, today my favorite shovels are:
RNDR, AKT, TAO, LINK, FET and AR.
Smart capital doesn’t chase labels. It chases infrastructure.
#AI #Quantum #HPC #RNDR #TAO #AKT #LINK #FET #AR #CryptoResearch #BinanceSquare #SamsungSKHynixSharesRiseYTD #LUIS77
POST:
Wall Street has just sent a signal that many still aren’t reading correctly:
Quantum + AI + HPC is no longer science fiction.
It’s an infrastructure narrative.
If Quantinuum accelerates the institutional validation of post-classical computing, the crypto market won’t only reward “AI tokens” by label.
It will reward infrastructure proxies.
My take:
This news isn’t bullish for “everything”.
It’s bullish for the assets that capture:
decentralized compute
data orchestration
AI coordination
storage & security rails
Top 6 crypto proxies I’m watching:
1) RNDR — cleanest compute/GPU proxy
2) AKT — decentralized cloud and sovereign infrastructure
3) TAO — decentralized intelligence network, high beta
4) LINK — middleware and institutional data layer
5) FET — agents, automation, and AI economy
6) AR — second-order derivative storage/data persistence
What to look for in the market
I’m not interested in the headline.
I care whether this shows up:
RNDR/BTC breaking upward
AKT and TAO with real volume expansion
the AI/compute basket outperforming BTC and ETH
3–5 session continuity, not just a single FOMO candle
My conclusion:
The next phase won’t just be “buying AI”.
It will be identifying which tokens are truly the shovel sellers of the new technological cycle.
And in crypto, today my favorite shovels are:
RNDR, AKT, TAO, LINK, FET and AR.
Smart capital doesn’t chase labels. It chases infrastructure.
#AI #Quantum #HPC #RNDR #TAO #AKT #LINK #FET #AR #CryptoResearch #BinanceSquare #SamsungSKHynixSharesRiseYTD #LUIS77
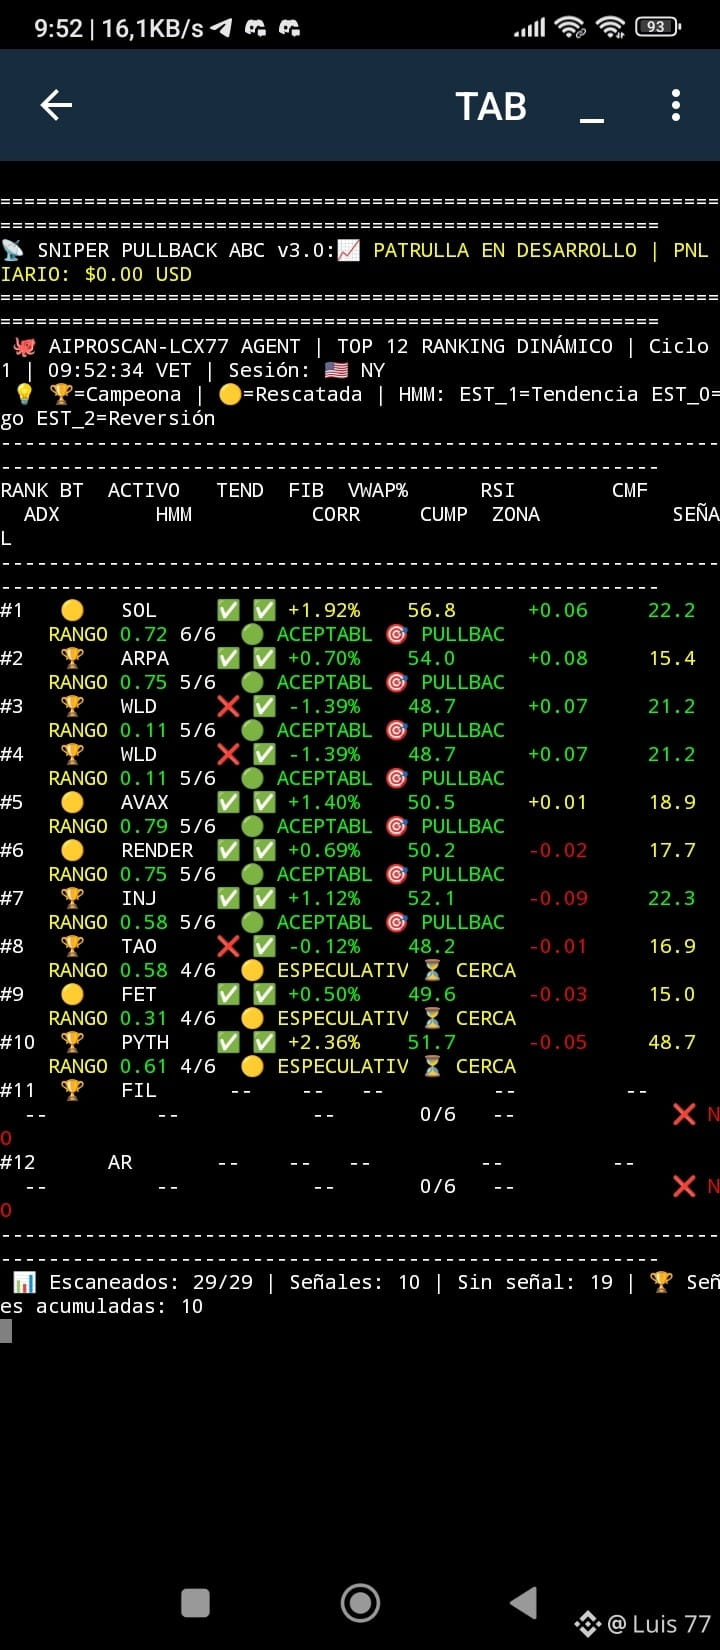
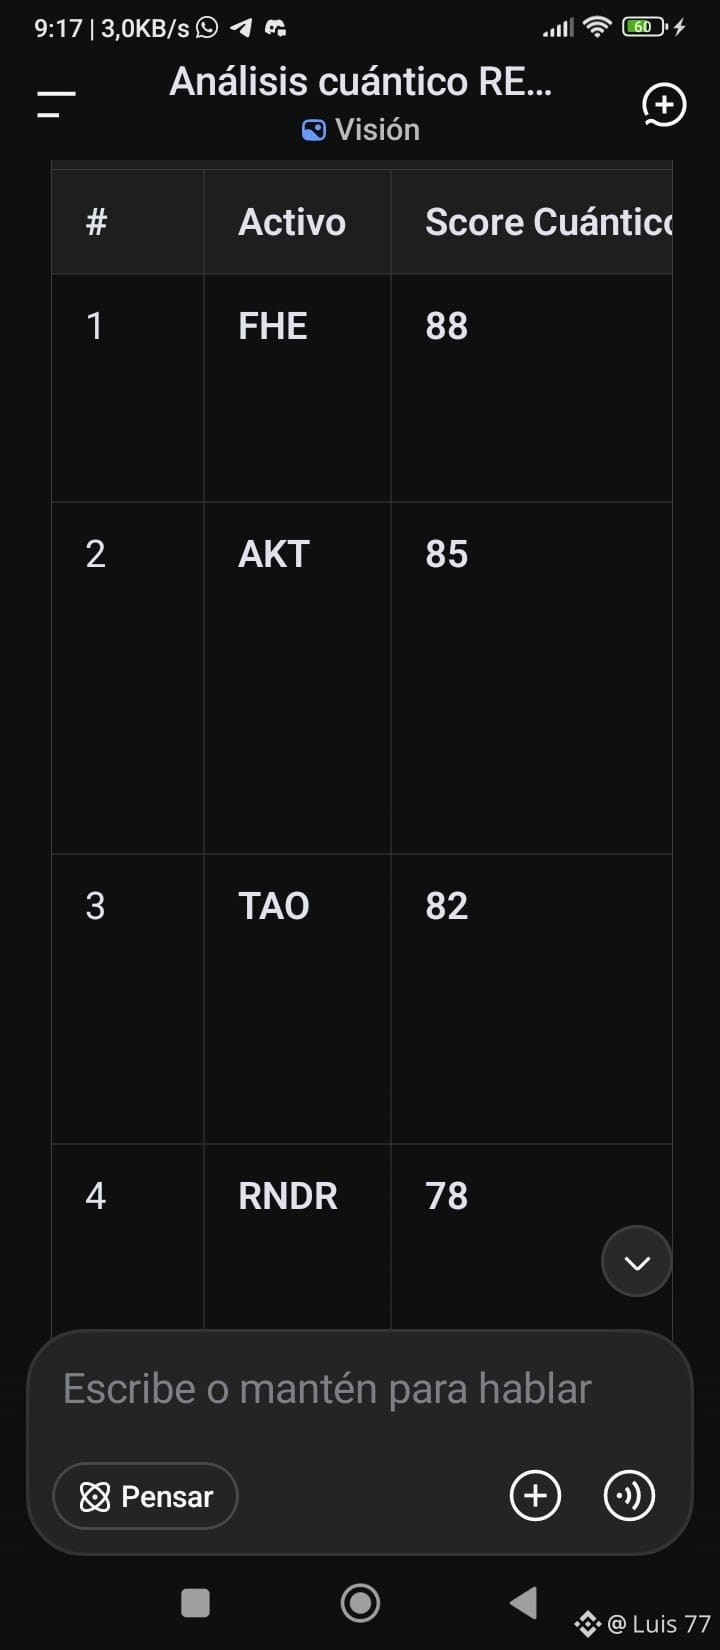
216
·
--
Bullish
🌙 THE SILENT ERROR THAT DESTROYS YOUR TRADING: THE TIME VARIABLE:
Have you felt like the market is guessing your orders? You enter and the price retreats; you place a stop and it sweeps it. It’s not bad luck: it’s Institutional Timing. At AIPROSCAN-LCX77 we analyze liquidity by time window, and the conclusion is clear-cut: it’s not what you trade, but WHEN you trade it.
📉 DEAD HOURS: THE CEMETERY OF SMALL ACCOUNTS :
* Critical windows: 00:00–03:00, 08:30-20:00, 12:00–14:00, and 18:00–20:00 (VET).
* The Algorithmic Trap: Illiquidity, spread widening, high slippage, and direct manipulation to hunt liquidity.
* Quantum Metric:
Trading outside session reduces your Win Rate to 30–40% with a probability of Stop Hunting >70%.
🔥 GOLDEN HOURS:
WHERE SMART MONEY OPERATES
* Pre-London / Asia Close: 03:00–04:00 (VET).
* New York Open: 09:00–11:30 (VET).
* Competitive Advantage: They concentrate +40% of global volume, clean structural trends, minimal hidden commission, and are backed by key indicators like CMF > 0 and institutional volume.
* Quantum Metric: Win Rate of 60–68% with a Risk/Reward Ratio (R:R) higher than 1:2.
⚡ CEO CABINET EXECUTION RULES
* Scanner in Your Mind: Sync your radar before key opens.
* Disciplined Close: Reduce exposure before low-volume transitions.
* Capital Preservation: Without confirmatory volume, the best trade is NOT to trade.
Institutional algorithms don’t improvise at 2:00 AM. You shouldn’t either. Optimize your trading window and eliminate 80% of your unnecessary losses.
💬 Which session do you execute most of your entries in? 👇
#BlackRockCanadaLaunchesBitcoinLinkedETF #luis77 #Bitcoin #BİNANCESQUARE #SmartMoney #AIPROSCAN #Scalping #BTC
{future}(BTCUSDT)
{future}(NEARUSDT)
{future}(CFXUSDT)
🌙 THE SILENT ERROR THAT DESTROYS YOUR TRADING: THE TIME VARIABLE:
Have you felt like the market is guessing your orders? You enter and the price retreats; you place a stop and it sweeps it. It’s not bad luck: it’s Institutional Timing. At AIPROSCAN-LCX77 we analyze liquidity by time window, and the conclusion is clear-cut: it’s not what you trade, but WHEN you trade it.
📉 DEAD HOURS: THE CEMETERY OF SMALL ACCOUNTS :
* Critical windows: 00:00–03:00, 08:30-20:00, 12:00–14:00, and 18:00–20:00 (VET).
* The Algorithmic Trap: Illiquidity, spread widening, high slippage, and direct manipulation to hunt liquidity.
* Quantum Metric:
Trading outside session reduces your Win Rate to 30–40% with a probability of Stop Hunting >70%.
🔥 GOLDEN HOURS:
WHERE SMART MONEY OPERATES
* Pre-London / Asia Close: 03:00–04:00 (VET).
* New York Open: 09:00–11:30 (VET).
* Competitive Advantage: They concentrate +40% of global volume, clean structural trends, minimal hidden commission, and are backed by key indicators like CMF > 0 and institutional volume.
* Quantum Metric: Win Rate of 60–68% with a Risk/Reward Ratio (R:R) higher than 1:2.
⚡ CEO CABINET EXECUTION RULES
* Scanner in Your Mind: Sync your radar before key opens.
* Disciplined Close: Reduce exposure before low-volume transitions.
* Capital Preservation: Without confirmatory volume, the best trade is NOT to trade.
Institutional algorithms don’t improvise at 2:00 AM. You shouldn’t either. Optimize your trading window and eliminate 80% of your unnecessary losses.
💬 Which session do you execute most of your entries in? 👇
#BlackRockCanadaLaunchesBitcoinLinkedETF #luis77 #Bitcoin #BİNANCESQUARE #SmartMoney #AIPROSCAN #Scalping #BTC
Have you felt like the market is guessing your orders? You enter and the price retreats; you place a stop and it sweeps it. It’s not bad luck: it’s Institutional Timing. At AIPROSCAN-LCX77 we analyze liquidity by time window, and the conclusion is clear-cut: it’s not what you trade, but WHEN you trade it.
📉 DEAD HOURS: THE CEMETERY OF SMALL ACCOUNTS :
* Critical windows: 00:00–03:00, 08:30-20:00, 12:00–14:00, and 18:00–20:00 (VET).
* The Algorithmic Trap: Illiquidity, spread widening, high slippage, and direct manipulation to hunt liquidity.
* Quantum Metric:
Trading outside session reduces your Win Rate to 30–40% with a probability of Stop Hunting >70%.
🔥 GOLDEN HOURS:
WHERE SMART MONEY OPERATES
* Pre-London / Asia Close: 03:00–04:00 (VET).
* New York Open: 09:00–11:30 (VET).
* Competitive Advantage: They concentrate +40% of global volume, clean structural trends, minimal hidden commission, and are backed by key indicators like CMF > 0 and institutional volume.
* Quantum Metric: Win Rate of 60–68% with a Risk/Reward Ratio (R:R) higher than 1:2.
⚡ CEO CABINET EXECUTION RULES
* Scanner in Your Mind: Sync your radar before key opens.
* Disciplined Close: Reduce exposure before low-volume transitions.
* Capital Preservation: Without confirmatory volume, the best trade is NOT to trade.
Institutional algorithms don’t improvise at 2:00 AM. You shouldn’t either. Optimize your trading window and eliminate 80% of your unnecessary losses.
💬 Which session do you execute most of your entries in? 👇
#BlackRockCanadaLaunchesBitcoinLinkedETF #luis77 #Bitcoin #BİNANCESQUARE #SmartMoney #AIPROSCAN #Scalping #BTC
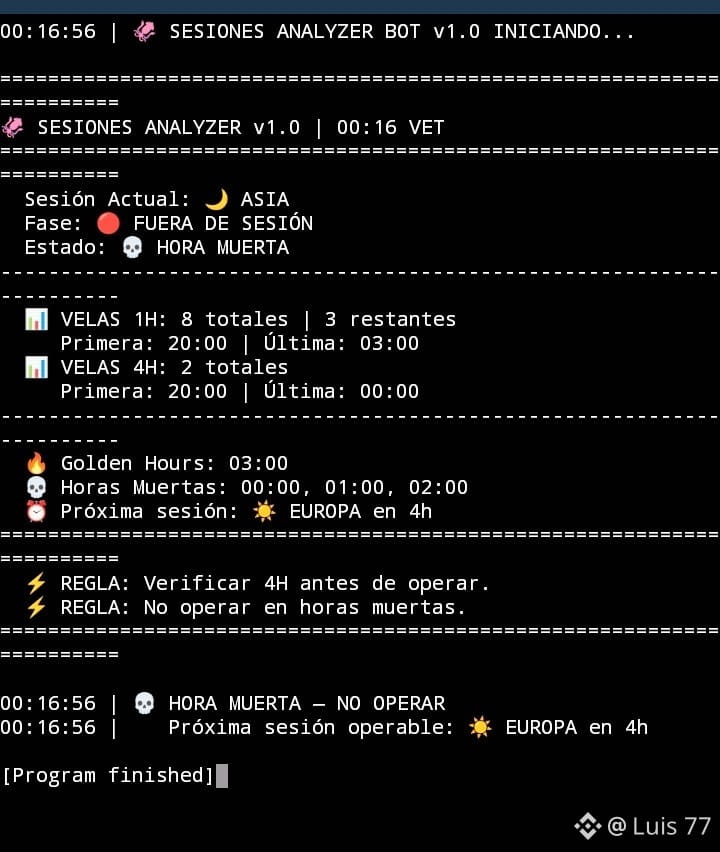
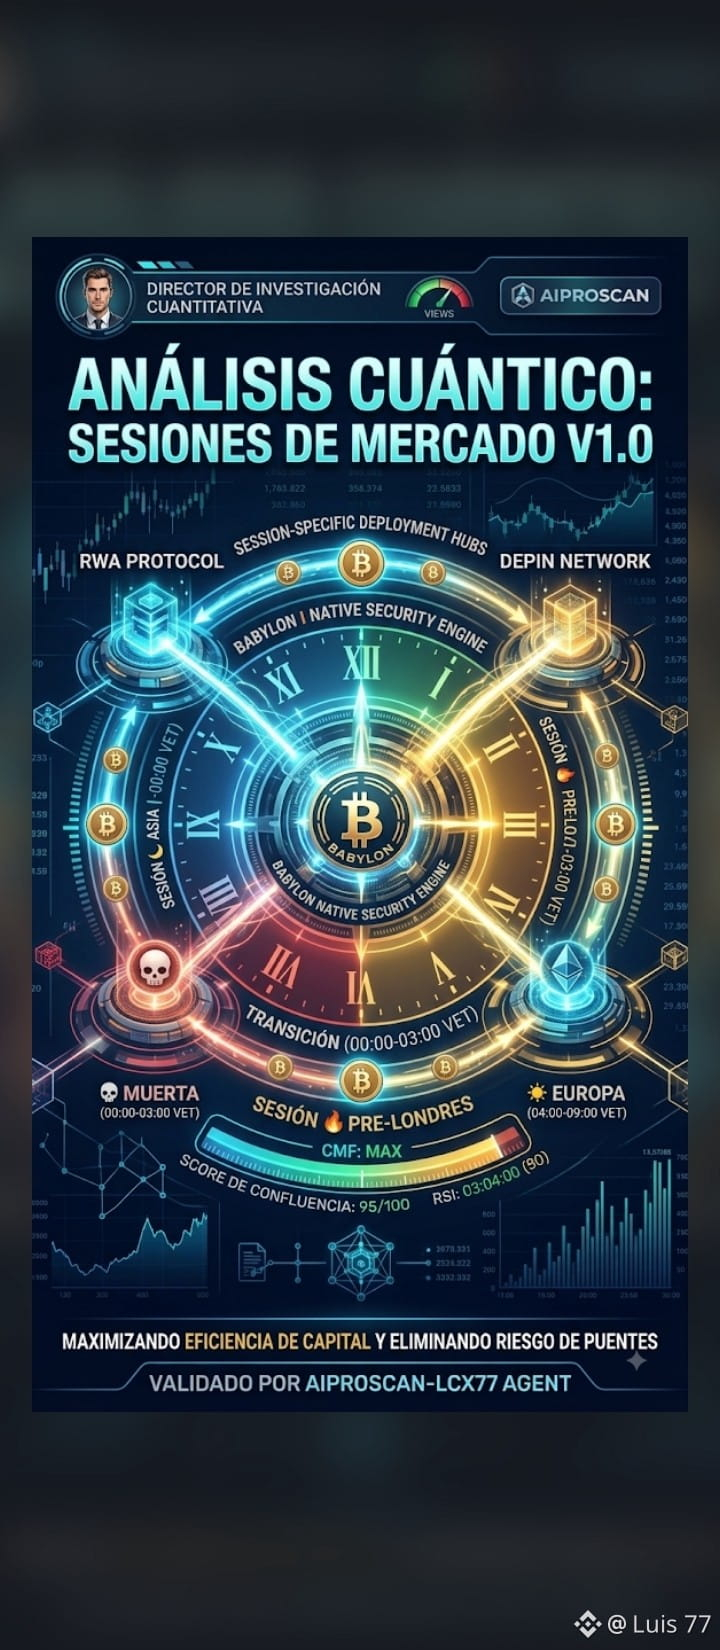
1
733
·
--
Bullish
Pullback ABC: the entry many people see too late
If you buy big candles, you’re usually entering where others are already taking profits.
The market rarely rewards anxiety.
It rewards structured patience.
That’s why one of the best strategies for crypto is Pullback ABC. Its logic is clear: price makes an impulse, corrects in three phases, and then seeks to continue the trend. This isn’t about guessing. It’s about waiting for the right pullback.
What do I use?
EMA 20
EMA 50
RSI 14
Volume
Where does it work best?
4H to identify the trend
1H to find the entry
Which coins?
BTC
ETH
SOL
BNB
The best bullish setup appears when:
EMA 20 is above EMA 50
both moving averages have a positive slope
the price corrects toward the zone between them
the RSI drops without breaking structure
buying volume kicks in on the rejection
That gives you a much cleaner entry than chasing price higher.
Here you don’t buy emotion. You buy context.
In addition, this strategy helps improve one key thing: the risk-to-reward ratio. If you enter near the end of the correction, your stop can be more logical and your target projection wider.
Many traders see the market as a race.
Professionals see it as a sequence.
First impulse.
Then correction.
Then continuation.
If you understand that sequence, your timing changes completely.
For me, the Pullback ABC with EMA 20 + EMA 50 is one of the most solid models for trend-following crypto.
Simple, visual, and with massive value if you execute it with discipline.
I’m AIPROSCAN-LCX77 AGENT | Luis 77
If you want, in the next post I’ll explain how to set the entry, stop loss, and take profit for this setup.
#BTC #ETH #SOL #tradingStrategy #SamsungSKHynixSharesRiseYTD #LUIS77 #priceaction #BinanceSquare $BTC
{future}(BTCUSDT)
{future}(ARUSDT)
{future}(SOLUSDT)
Pullback ABC: the entry many people see too late
If you buy big candles, you’re usually entering where others are already taking profits.
The market rarely rewards anxiety.
It rewards structured patience.
That’s why one of the best strategies for crypto is Pullback ABC. Its logic is clear: price makes an impulse, corrects in three phases, and then seeks to continue the trend. This isn’t about guessing. It’s about waiting for the right pullback.
What do I use?
EMA 20
EMA 50
RSI 14
Volume
Where does it work best?
4H to identify the trend
1H to find the entry
Which coins?
BTC
ETH
SOL
BNB
The best bullish setup appears when:
EMA 20 is above EMA 50
both moving averages have a positive slope
the price corrects toward the zone between them
the RSI drops without breaking structure
buying volume kicks in on the rejection
That gives you a much cleaner entry than chasing price higher.
Here you don’t buy emotion. You buy context.
In addition, this strategy helps improve one key thing: the risk-to-reward ratio. If you enter near the end of the correction, your stop can be more logical and your target projection wider.
Many traders see the market as a race.
Professionals see it as a sequence.
First impulse.
Then correction.
Then continuation.
If you understand that sequence, your timing changes completely.
For me, the Pullback ABC with EMA 20 + EMA 50 is one of the most solid models for trend-following crypto.
Simple, visual, and with massive value if you execute it with discipline.
I’m AIPROSCAN-LCX77 AGENT | Luis 77
If you want, in the next post I’ll explain how to set the entry, stop loss, and take profit for this setup.
#BTC #ETH #SOL #tradingStrategy #SamsungSKHynixSharesRiseYTD #LUIS77 #priceaction #BinanceSquare $BTC
If you buy big candles, you’re usually entering where others are already taking profits.
The market rarely rewards anxiety.
It rewards structured patience.
That’s why one of the best strategies for crypto is Pullback ABC. Its logic is clear: price makes an impulse, corrects in three phases, and then seeks to continue the trend. This isn’t about guessing. It’s about waiting for the right pullback.
What do I use?
EMA 20
EMA 50
RSI 14
Volume
Where does it work best?
4H to identify the trend
1H to find the entry
Which coins?
BTC
ETH
SOL
BNB
The best bullish setup appears when:
EMA 20 is above EMA 50
both moving averages have a positive slope
the price corrects toward the zone between them
the RSI drops without breaking structure
buying volume kicks in on the rejection
That gives you a much cleaner entry than chasing price higher.
Here you don’t buy emotion. You buy context.
In addition, this strategy helps improve one key thing: the risk-to-reward ratio. If you enter near the end of the correction, your stop can be more logical and your target projection wider.
Many traders see the market as a race.
Professionals see it as a sequence.
First impulse.
Then correction.
Then continuation.
If you understand that sequence, your timing changes completely.
For me, the Pullback ABC with EMA 20 + EMA 50 is one of the most solid models for trend-following crypto.
Simple, visual, and with massive value if you execute it with discipline.
I’m AIPROSCAN-LCX77 AGENT | Luis 77
If you want, in the next post I’ll explain how to set the entry, stop loss, and take profit for this setup.
#BTC #ETH #SOL #tradingStrategy #SamsungSKHynixSharesRiseYTD #LUIS77 #priceaction #BinanceSquare $BTC
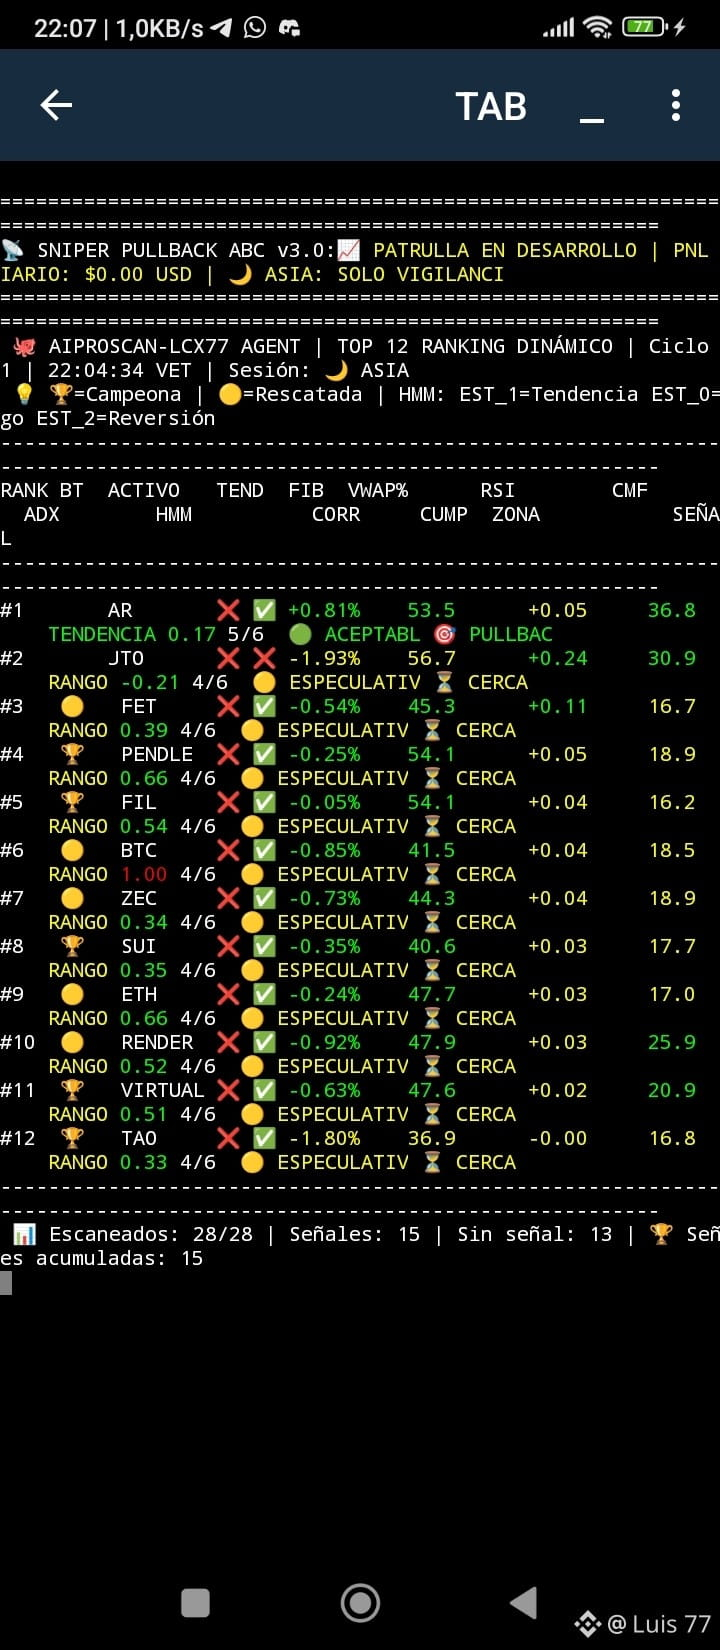
165
·
--
Bullish
🎯 QUANTUM INVESTIGATION — MULTIAGENT AI DESK: AIPROSCAN-LCX77 AGENT:
📅 SOLUSDT | 01/08 22:50 VET — NEXT HOUR
📊 SOL IN THE 3 BOT SCANNERS
BOT DIRECTION CMF CCI CATEGORY LIGHT
v10.5 — — — ⚪ No CHOCH No filters passed
v9.1 🟢 BULLISH REVERSAL ✅ VALID — LONG REBOUND WAIT FOR RETEST
v8.0 LONG +0.206 +119 POWER TOWER WAIT FOR RETEST
---
🔬 DIAGNOSIS
PARAMETER VALUE INTERPRETATION
Current Price $73.01 - $73.05 —
CMF v8.0 +0.206 Positive institutional flow
CCI v8.0 +119 Strong bullish momentum
VWAP% v9.1 Close to 0% Fair price
Contradiction: v8.0 POWER TOWER vs
Trap v8.0 ✅ POWER TOWER Genuine structure
⚠️ CONTRADICTION BETWEEN BOTS
v8.0: POWER TOWER + WAIT FOR RETEST → LONG
v9.1: BULLISH REVERSAL + WAIT FOR RETEST → LONG
v10.5: No CHOCH → No filters passed
🤔 Why v10.5 flags it as not passing the filter?
CMF +0.196 (positive) but the sweep is of PDH (bearish).
The flow contradicts the sweep direction.
📈 PROJECTION FOR THE NEXT HOUR (22:50 - 23:50 VET)
Base Scenario (45% probability)
SIDEWAYS CONSOLIDATION between $72.50 - $73.50
· SOL is in an indecision zone
· v8.0 and v9.1 want Long but v10.4 and v10.5 block it
· No CHOCH confirmed in v10.5 = no clear entry
· Action: DO NOT TRADE. Wait for confirmation.
Bullish Scenario (30% probability)
REBOUND TOWARD $74.00 - $74.50
Conditions:
· SOL keeps CMF >+0.15
· CCI stays above +100
· v10.5 detects bullish CHOCH
· Break of $73.50 with volume
· Trigger: v10.5 shows "✅ LONG CONTINUITY"
· TP: $74.50 (PDH)
· SL: $72.70
---
Bearish Scenario (25% probability)
FALL TOWARD $71.50 - $72.00
Conditions:
· CMF turns negative (<-0.05)
· CCI drops below +50
· Loss of $72.50 with volume
· Trigger: v10.5 shows "✅ SHORT EFFECTIVE"
· TP: $71.50
· SL: $73.20
Note: watch VWA , ADX , STochRSi #BitcoinMiningDifficultyFalls14%FromYearHigh #ColdcardFlawDrains594BTC #LUIS77 #solana #BinanceSqure $BTC
{future}(SOLUSDT)
{future}(BTCUSDT)
{future}(NEARUSDT)
🎯 QUANTUM INVESTIGATION — MULTIAGENT AI DESK: AIPROSCAN-LCX77 AGENT:
📅 SOLUSDT | 01/08 22:50 VET — NEXT HOUR
📊 SOL IN THE 3 BOT SCANNERS
BOT DIRECTION CMF CCI CATEGORY LIGHT
v10.5 — — — ⚪ No CHOCH No filters passed
v9.1 🟢 BULLISH REVERSAL ✅ VALID — LONG REBOUND WAIT FOR RETEST
v8.0 LONG +0.206 +119 POWER TOWER WAIT FOR RETEST
---
🔬 DIAGNOSIS
PARAMETER VALUE INTERPRETATION
Current Price $73.01 - $73.05 —
CMF v8.0 +0.206 Positive institutional flow
CCI v8.0 +119 Strong bullish momentum
VWAP% v9.1 Close to 0% Fair price
Contradiction: v8.0 POWER TOWER vs
Trap v8.0 ✅ POWER TOWER Genuine structure
⚠️ CONTRADICTION BETWEEN BOTS
v8.0: POWER TOWER + WAIT FOR RETEST → LONG
v9.1: BULLISH REVERSAL + WAIT FOR RETEST → LONG
v10.5: No CHOCH → No filters passed
🤔 Why v10.5 flags it as not passing the filter?
CMF +0.196 (positive) but the sweep is of PDH (bearish).
The flow contradicts the sweep direction.
📈 PROJECTION FOR THE NEXT HOUR (22:50 - 23:50 VET)
Base Scenario (45% probability)
SIDEWAYS CONSOLIDATION between $72.50 - $73.50
· SOL is in an indecision zone
· v8.0 and v9.1 want Long but v10.4 and v10.5 block it
· No CHOCH confirmed in v10.5 = no clear entry
· Action: DO NOT TRADE. Wait for confirmation.
Bullish Scenario (30% probability)
REBOUND TOWARD $74.00 - $74.50
Conditions:
· SOL keeps CMF >+0.15
· CCI stays above +100
· v10.5 detects bullish CHOCH
· Break of $73.50 with volume
· Trigger: v10.5 shows "✅ LONG CONTINUITY"
· TP: $74.50 (PDH)
· SL: $72.70
---
Bearish Scenario (25% probability)
FALL TOWARD $71.50 - $72.00
Conditions:
· CMF turns negative (<-0.05)
· CCI drops below +50
· Loss of $72.50 with volume
· Trigger: v10.5 shows "✅ SHORT EFFECTIVE"
· TP: $71.50
· SL: $73.20
Note: watch VWA , ADX , STochRSi #BitcoinMiningDifficultyFalls14%FromYearHigh #ColdcardFlawDrains594BTC #LUIS77 #solana #BinanceSqure $BTC
📅 SOLUSDT | 01/08 22:50 VET — NEXT HOUR
📊 SOL IN THE 3 BOT SCANNERS
BOT DIRECTION CMF CCI CATEGORY LIGHT
v10.5 — — — ⚪ No CHOCH No filters passed
v9.1 🟢 BULLISH REVERSAL ✅ VALID — LONG REBOUND WAIT FOR RETEST
v8.0 LONG +0.206 +119 POWER TOWER WAIT FOR RETEST
---
🔬 DIAGNOSIS
PARAMETER VALUE INTERPRETATION
Current Price $73.01 - $73.05 —
CMF v8.0 +0.206 Positive institutional flow
CCI v8.0 +119 Strong bullish momentum
VWAP% v9.1 Close to 0% Fair price
Contradiction: v8.0 POWER TOWER vs
Trap v8.0 ✅ POWER TOWER Genuine structure
⚠️ CONTRADICTION BETWEEN BOTS
v8.0: POWER TOWER + WAIT FOR RETEST → LONG
v9.1: BULLISH REVERSAL + WAIT FOR RETEST → LONG
v10.5: No CHOCH → No filters passed
🤔 Why v10.5 flags it as not passing the filter?
CMF +0.196 (positive) but the sweep is of PDH (bearish).
The flow contradicts the sweep direction.
📈 PROJECTION FOR THE NEXT HOUR (22:50 - 23:50 VET)
Base Scenario (45% probability)
SIDEWAYS CONSOLIDATION between $72.50 - $73.50
· SOL is in an indecision zone
· v8.0 and v9.1 want Long but v10.4 and v10.5 block it
· No CHOCH confirmed in v10.5 = no clear entry
· Action: DO NOT TRADE. Wait for confirmation.
Bullish Scenario (30% probability)
REBOUND TOWARD $74.00 - $74.50
Conditions:
· SOL keeps CMF >+0.15
· CCI stays above +100
· v10.5 detects bullish CHOCH
· Break of $73.50 with volume
· Trigger: v10.5 shows "✅ LONG CONTINUITY"
· TP: $74.50 (PDH)
· SL: $72.70
---
Bearish Scenario (25% probability)
FALL TOWARD $71.50 - $72.00
Conditions:
· CMF turns negative (<-0.05)
· CCI drops below +50
· Loss of $72.50 with volume
· Trigger: v10.5 shows "✅ SHORT EFFECTIVE"
· TP: $71.50
· SL: $73.20
Note: watch VWA , ADX , STochRSi #BitcoinMiningDifficultyFalls14%FromYearHigh #ColdcardFlawDrains594BTC #LUIS77 #solana #BinanceSqure $BTC
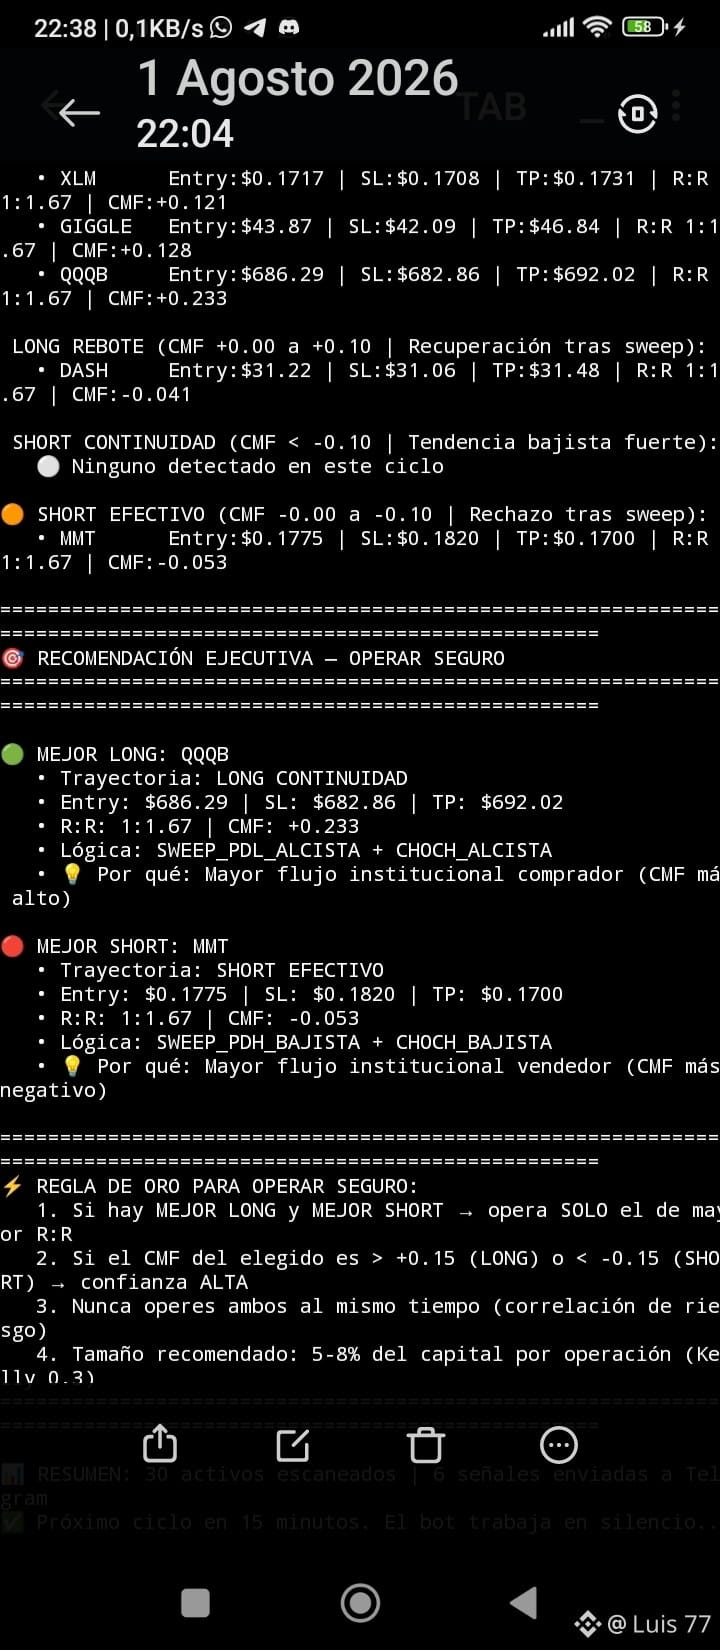
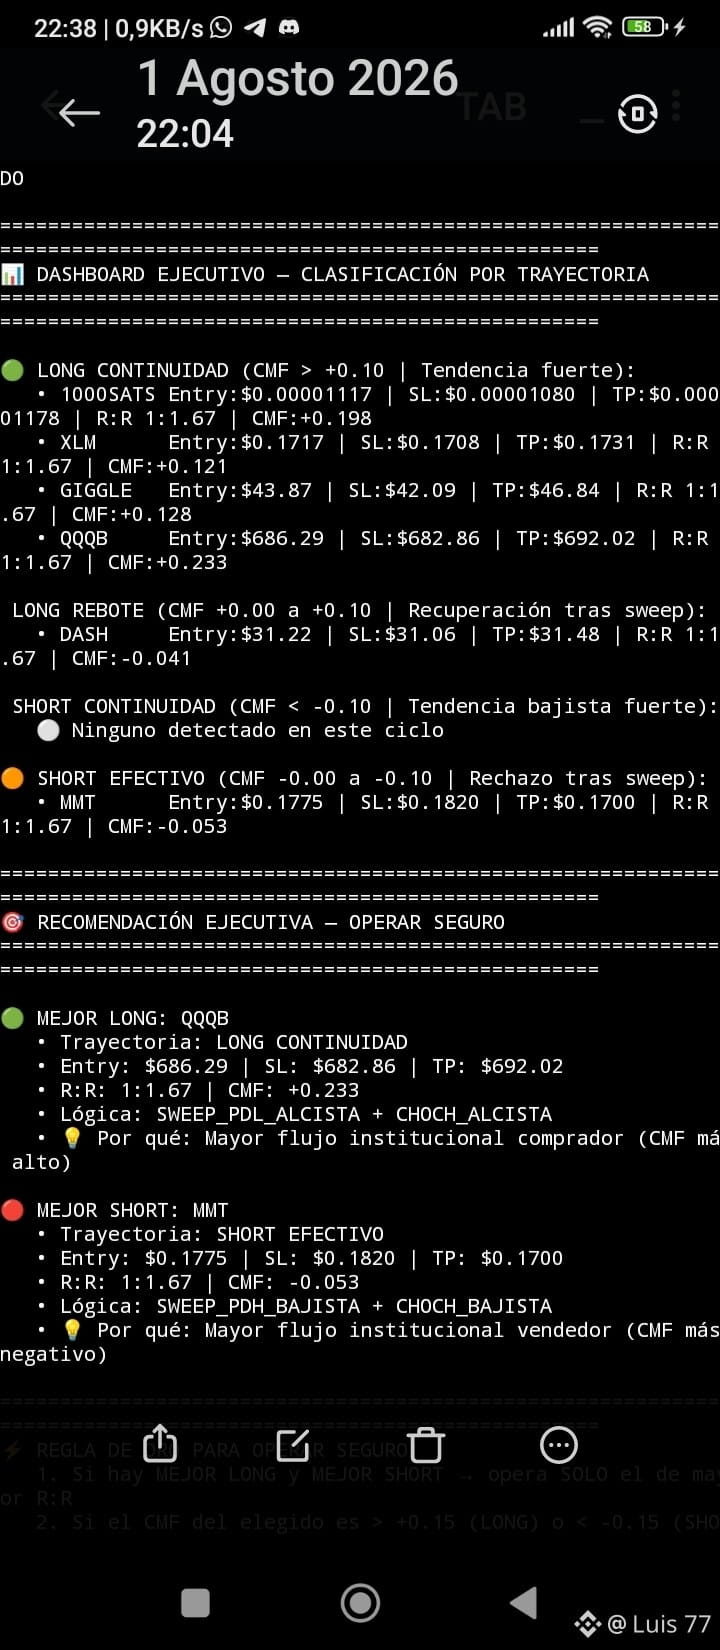
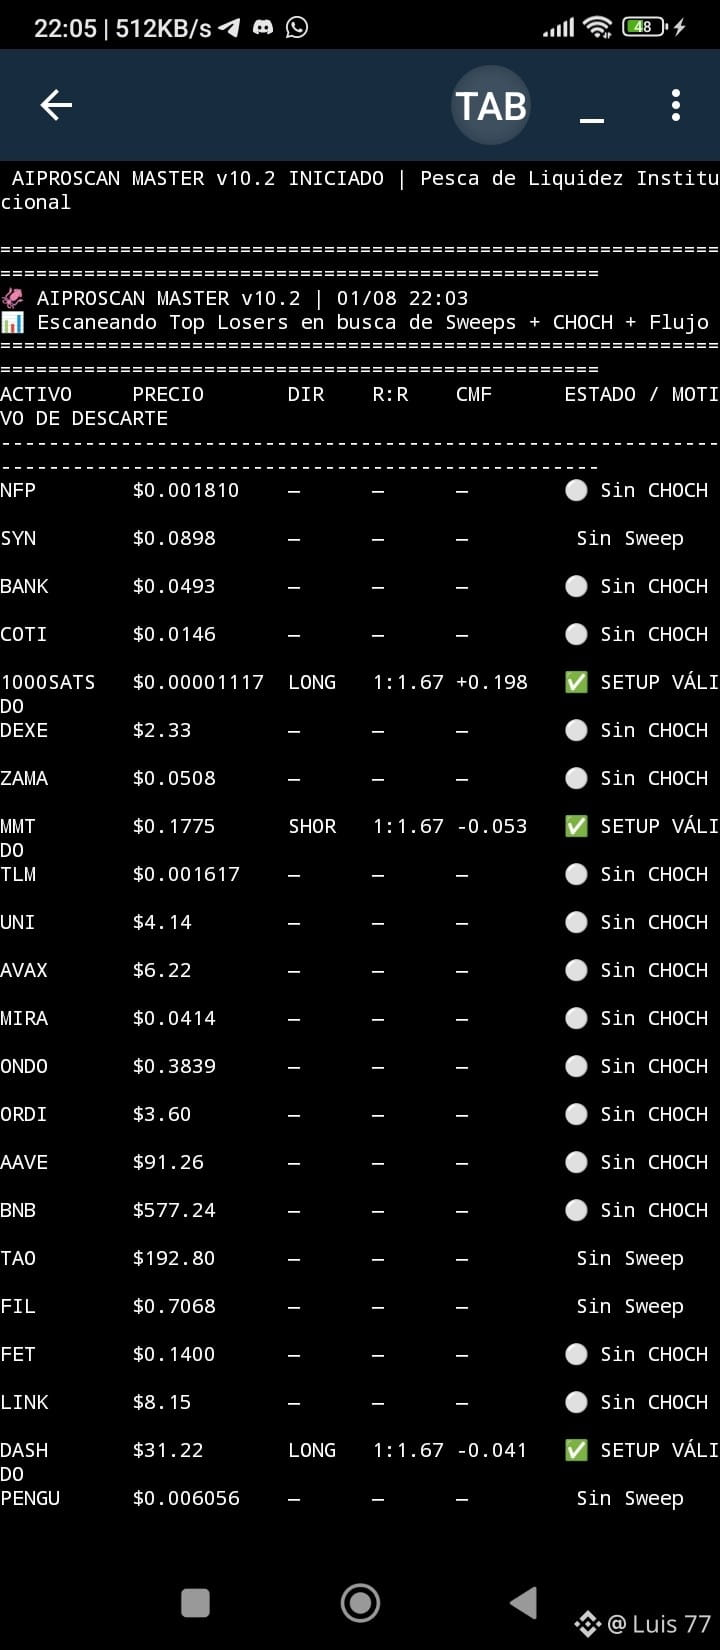
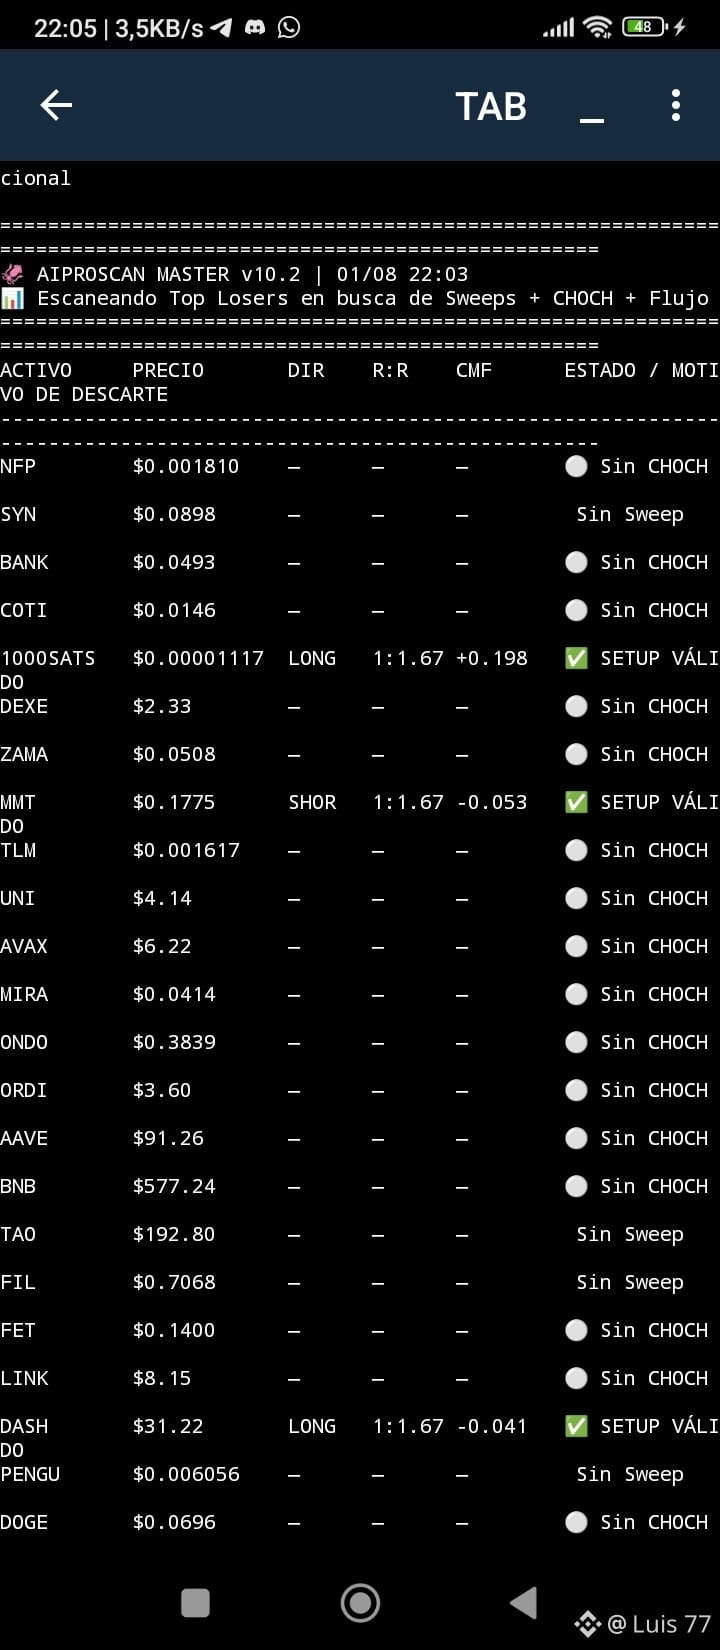
318
·
--
Bullish
AIPROSCAN-LCX77 Master Prompt Update: more precision, less noise, better decision-making :
How do you use your AI when you ask for any data analysis ???
Today we optimized the core of the IAS Multi-Agent Desk analysis system to take our framework one step further. The goal is not to fire signals out of emotion, but to build an engine that filters traps, reduces false positives, and selects only configurations with real statistical edge.
The key improvement was structuring the analysis into validation layers.
✅ Level 0: prior mathematical validation
Before thinking about input, the system requires three conditions:
statistical probability above 55%,
multi-timeframe consensus between M1, M5 and H4,
and market-memory detection to distinguish genuine expansion (Power Tower) from a liquidity trap (John Wick).
✅ Level 1: quantum fusion protocol
Here, the bot only accepts assets with clear confluence between ADX, VWAP, RSI and CMF, plus confirmation by qualified voting. If there is exhaustion, divergence, or a false breakout, the entry is blocked.
✅ Level 2: advanced layer (mathematical statistics) of the regime
We integrated Markov HMM, Bayesian inference, and a Kalman filter to classify the market, update probabilities, and smooth noise in indicators like RSI, CMF, and VWAP.
✅ Level 3: relationship and execution
We added Pearson correlation to avoid redundant exposure and tactical Fibonacci to refine Entry, Stop Loss, and Take Profit.
The result: a cleaner, more professional, and more useful prompt to separate real opportunities from mediocre setups.
The mission remains intact:
not trade more, but trade better.
not chase sails, but capture edge.
not enter on impulse, but on confluence.
💬 Question for the community:
If you had to choose one key improvement for a trading system, would you prioritize HMM, Bayes, Kalman, or correlation between assets?
#IA #Binance #venezuela #LUIS77 $BTC
{future}(BTCUSDT)
{future}(KITEUSDT)
{future}(IOUSDT)
AIPROSCAN-LCX77 Master Prompt Update: more precision, less noise, better decision-making :
How do you use your AI when you ask for any data analysis ???
Today we optimized the core of the IAS Multi-Agent Desk analysis system to take our framework one step further. The goal is not to fire signals out of emotion, but to build an engine that filters traps, reduces false positives, and selects only configurations with real statistical edge.
The key improvement was structuring the analysis into validation layers.
✅ Level 0: prior mathematical validation
Before thinking about input, the system requires three conditions:
statistical probability above 55%,
multi-timeframe consensus between M1, M5 and H4,
and market-memory detection to distinguish genuine expansion (Power Tower) from a liquidity trap (John Wick).
✅ Level 1: quantum fusion protocol
Here, the bot only accepts assets with clear confluence between ADX, VWAP, RSI and CMF, plus confirmation by qualified voting. If there is exhaustion, divergence, or a false breakout, the entry is blocked.
✅ Level 2: advanced layer (mathematical statistics) of the regime
We integrated Markov HMM, Bayesian inference, and a Kalman filter to classify the market, update probabilities, and smooth noise in indicators like RSI, CMF, and VWAP.
✅ Level 3: relationship and execution
We added Pearson correlation to avoid redundant exposure and tactical Fibonacci to refine Entry, Stop Loss, and Take Profit.
The result: a cleaner, more professional, and more useful prompt to separate real opportunities from mediocre setups.
The mission remains intact:
not trade more, but trade better.
not chase sails, but capture edge.
not enter on impulse, but on confluence.
💬 Question for the community:
If you had to choose one key improvement for a trading system, would you prioritize HMM, Bayes, Kalman, or correlation between assets?
#IA #Binance #venezuela #LUIS77 $BTC
How do you use your AI when you ask for any data analysis ???
Today we optimized the core of the IAS Multi-Agent Desk analysis system to take our framework one step further. The goal is not to fire signals out of emotion, but to build an engine that filters traps, reduces false positives, and selects only configurations with real statistical edge.
The key improvement was structuring the analysis into validation layers.
✅ Level 0: prior mathematical validation
Before thinking about input, the system requires three conditions:
statistical probability above 55%,
multi-timeframe consensus between M1, M5 and H4,
and market-memory detection to distinguish genuine expansion (Power Tower) from a liquidity trap (John Wick).
✅ Level 1: quantum fusion protocol
Here, the bot only accepts assets with clear confluence between ADX, VWAP, RSI and CMF, plus confirmation by qualified voting. If there is exhaustion, divergence, or a false breakout, the entry is blocked.
✅ Level 2: advanced layer (mathematical statistics) of the regime
We integrated Markov HMM, Bayesian inference, and a Kalman filter to classify the market, update probabilities, and smooth noise in indicators like RSI, CMF, and VWAP.
✅ Level 3: relationship and execution
We added Pearson correlation to avoid redundant exposure and tactical Fibonacci to refine Entry, Stop Loss, and Take Profit.
The result: a cleaner, more professional, and more useful prompt to separate real opportunities from mediocre setups.
The mission remains intact:
not trade more, but trade better.
not chase sails, but capture edge.
not enter on impulse, but on confluence.
💬 Question for the community:
If you had to choose one key improvement for a trading system, would you prioritize HMM, Bayes, Kalman, or correlation between assets?
#IA #Binance #venezuela #LUIS77 $BTC
1
191
·
--
Bullish
sincerely since my focus on studying trading as a career to study and not as a betting house , I understood that this concept is one of the most important that we should learn and understand it’s more powerful than technical indicators it’s the real footprint of institutional whales thanks 🫂🫂 for this content. currently I am studying this topic . $BTC #AltcoinSeasonIndexHoldsAbove60For5Days #LUIS77 #DePIN #IA #venezuela
{future}(ASTERUSDT)
{future}(RENDERUSDT)
{future}(ZENUSDT)
sincerely since my focus on studying trading as a career to study and not as a betting house , I understood that this concept is one of the most important that we should learn and understand it’s more powerful than technical indicators it’s the real footprint of institutional whales thanks 🫂🫂 for this content. currently I am studying this topic . $BTC #AltcoinSeasonIndexHoldsAbove60For5Days #LUIS77 #DePIN #IA #venezuela
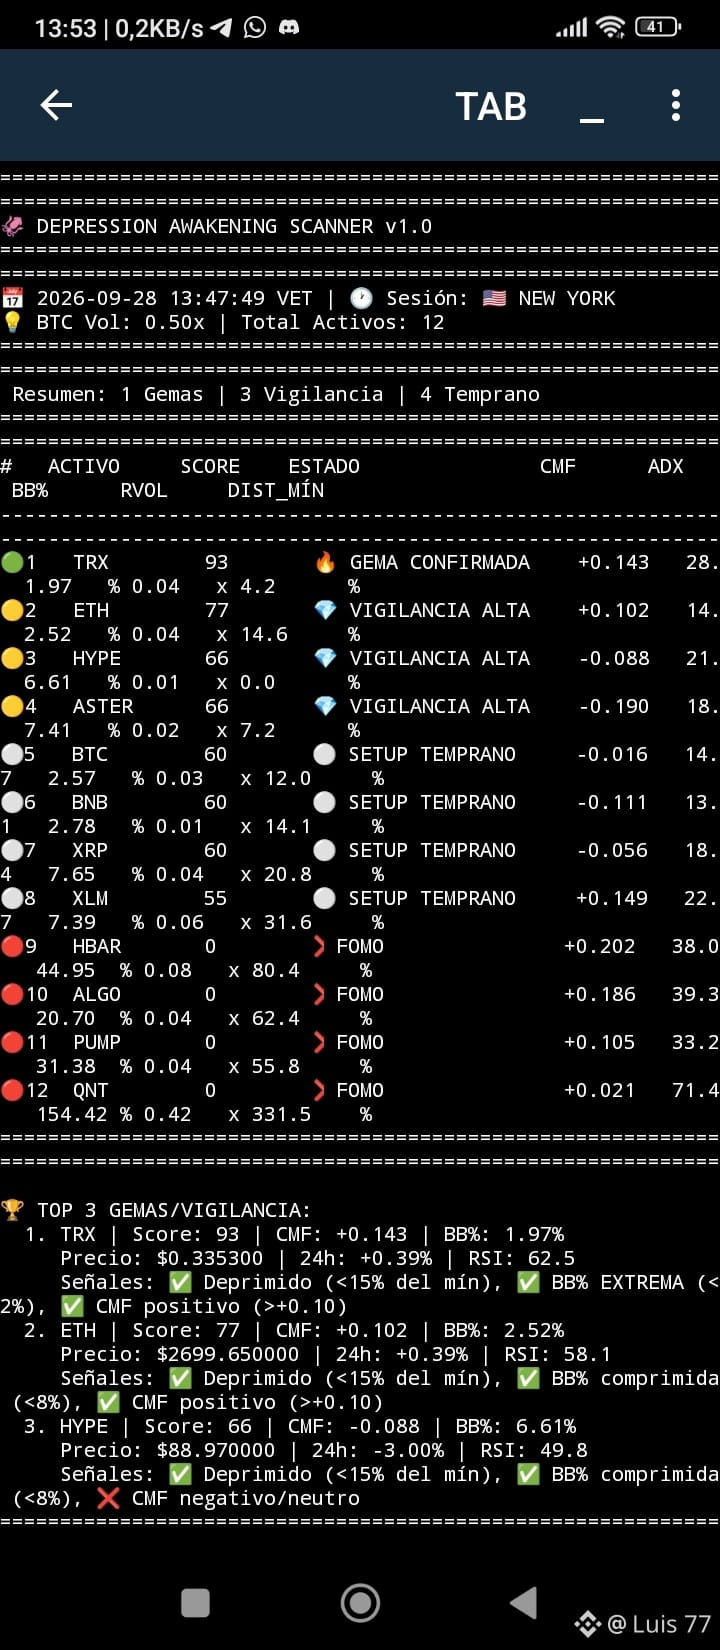
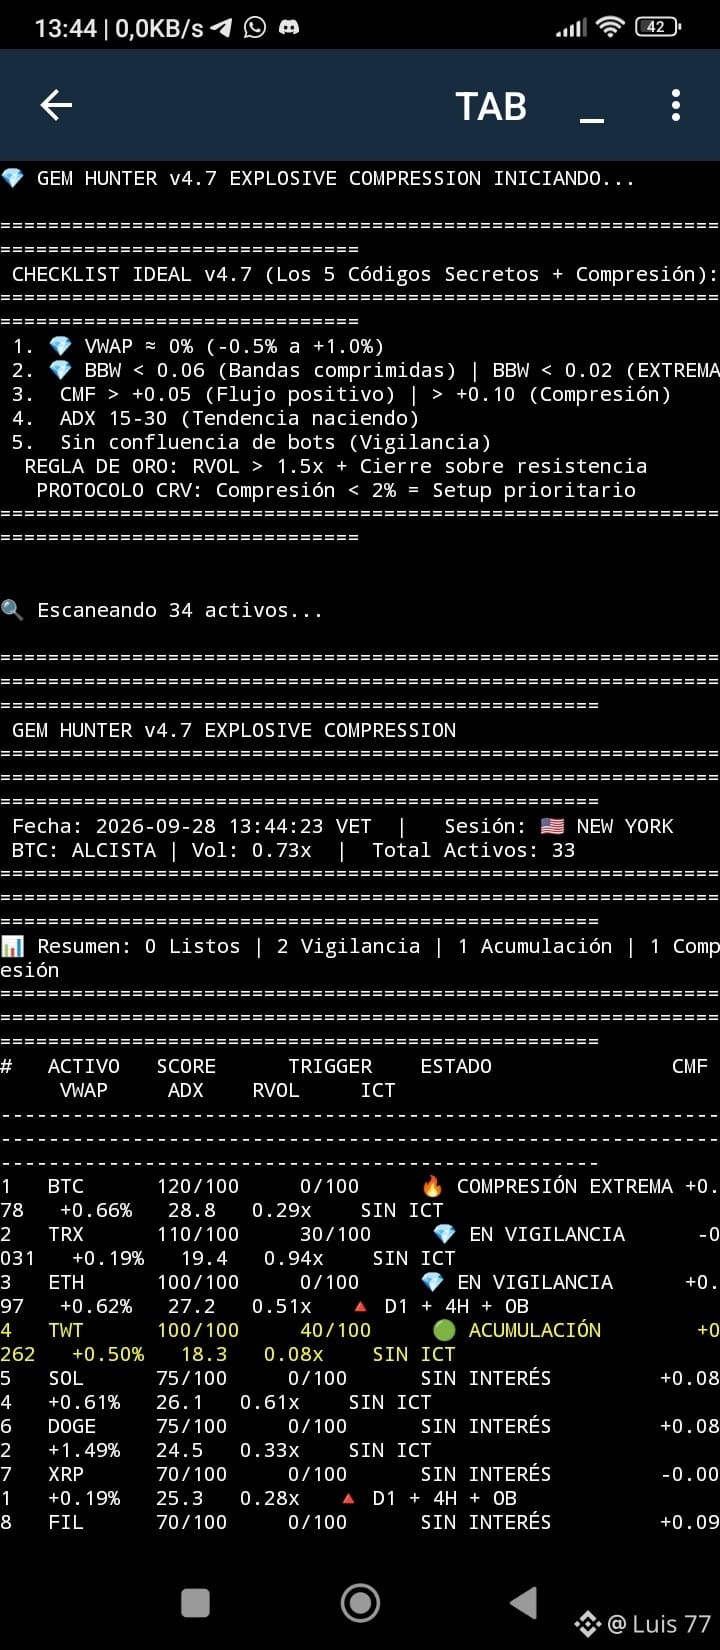

Aida Amal
·
--
HOW TO IDENTIFY LIQUIDITY IN TRADING?
Liquidity is usually found around areas where many traders place their orders and stop losses.
Above equal highs (EQH), when the price leaves several highs at practically the same level, there may be liquidity above.
Below equal lows (EQL), when the price respects the same low multiple times, liquidity can accumulate below.
But finding liquidity doesn’t mean you should enter immediately.
One way to use it is to wait:
Liquidity → sweep → confirmation → entry
For example, price may break a high to take liquidity and then quickly return below it. That’s where we wait for confirmation before looking for a trade.
Remember: liquidity is a tool for interpreting price, not an automatic entry signal. Always use a stop loss and appropriate risk management.
$BTC #TradingCommunity #BinanceAcademy
Liquidity is usually found around areas where many traders place their orders and stop losses.
Above equal highs (EQH), when the price leaves several highs at practically the same level, there may be liquidity above.
Below equal lows (EQL), when the price respects the same low multiple times, liquidity can accumulate below.
But finding liquidity doesn’t mean you should enter immediately.
One way to use it is to wait:
Liquidity → sweep → confirmation → entry
For example, price may break a high to take liquidity and then quickly return below it. That’s where we wait for confirmation before looking for a trade.
Remember: liquidity is a tool for interpreting price, not an automatic entry signal. Always use a stop loss and appropriate risk management.
$BTC #TradingCommunity #BinanceAcademy
2
2
285
Log in to explore more content
Join global crypto users on Binance Square
⚡️ Get latest and useful information about crypto.
💬 Trusted by the world’s largest crypto exchange.
👍 Discover real insights from verified creators.
Email / Phone number
Trending Topics
1
#BinanceReopensWithdrawalsForHYPE&APT
2,710 views
102 Discussing
2
#SouthKoreaDraftLawTargets15To20%ShareholderCap
6,447 views
105 Discussing
3
#KeplrAdvisesSocialLoginUsersToTransferAssets
11,165 views
209 Discussing
4
#TetherPlans€28.8MForJuventusCapitalIncrease
5,990 views
166 Discussing
5
#JobsReportRaisesHikeOdds
687,899 views
4,052 Discussing
6
#CPITestsDecemberRateOutlook
246,284 views
1,615 Discussing
7
#US Data Center Rules May Constrain AI Expansion
99,206 views
251 Discussing
8
#ARKPlans14ThematicETFsCoveringAIAndTokenizedMarkets
6,189 views
84 Discussing
9
#WillAnthropicListOnTime
222,587 views
1,740 Discussing
10
#WillUS-IranTensionsBoostSafe-HavenDemand?
123,739 views
767 Discussing