

#ltcusdt
ltcusdt
903,157 views
2,549 Discussing
Hot
Latest

LTC is charging above 78, the momentum is screaming for a fresh leg up.
🟢 $LTC LONG 📈
Entry → $54.9650-$55.0750
Stop → $53.3694 (-3.0%)
TP1 → $55.8453 (+1.5%)
TP2 → $57.7710 (+5.0%)
R/R 1:1.7 • Confidence 64%
A clear change of character broke the down swing, the order block and fair value gap line up, and the CVD spikes confirm buying pressure. The price is sitting on the overlap of the OB and FVG, creating a point of interest that’s begging for a breakout.
A 3.0% stop is relatively tight, so stick to low‑single‑digit leverage.
Take half profit around the first target as soon as the candle clears the 84‑86 zone.
Not financial advice — trade only what you can afford to lose 🙏
$LTC #LTCUSDT #FedWatch #TradingSignals #Write2Earn
5
LTC is snapping back above the 2‑month swing point, reclaiming momentum as the market eyes the next bullish wave.
🟢 $LTC LONG 📈
Entry → $55.7342-$55.8458
Stop → $54.1163 (-3.0%)
TP1 → $56.6268 (+1.5%)
TP2 → $58.5795 (+5.0%)
R/R 1:1.7 • Confidence 65%
The CHoCH on the 1‑hour chart broke the descending structure, and the CVD surge confirmed buying pressure. A fresh FVG lines up with an order block that’s holding, creating a POI where the OB and FVG overlap. With price now testing the block’s upper edge, the confluence pushes the odds in our favor.
A 3.0% stop is relatively tight on this swing, so keep leverage modest – 2‑3× is prudent.
Take a partial at the first profit target around the next resistance level to lock in gains.
DYOR — this isn't financial advice, size your risk accordingly 🙏
$LTC #LTCUSDT #FedWatch #TradingSignals #Write2Earn
1
LTC is holding just above the recent swing low. The market feels primed for a move up.
🟢 $LTC LONG 📈
Entry $58.7712-$58.8888 | SL $57.0651 (-3.0%) | TP1 $59.7124 (+1.5%) | TP2 $61.7715 (+5.0%) | R/R 1:1.7 | Conf 64%
We got a CHoCH break on the 1‑hour, backed by a bullish CVD spike. A clear FVG lines up with a strong OB, creating a POI where the two overlap. The structure is flipping higher, so the long looks clean.
A 3.0% stop is fairly tight, so stick to 5‑10x leverage at most.
Consider taking half profit once price hits the first target around the next resistance.
Not financial advice — trade only what you can afford to lose 🙏
$LTC #LTCUSDT #earningsseason #TradingSignals #Write2Earn
8

·
--
Bullish
⚔️🔥 #LTC EN FUTURES: EPISODE 2 — THE MARKET PULLS BACK, BUT THE BATTLE CONTINUES
A true soldier doesn’t brag about victories too soon. 🪖📉
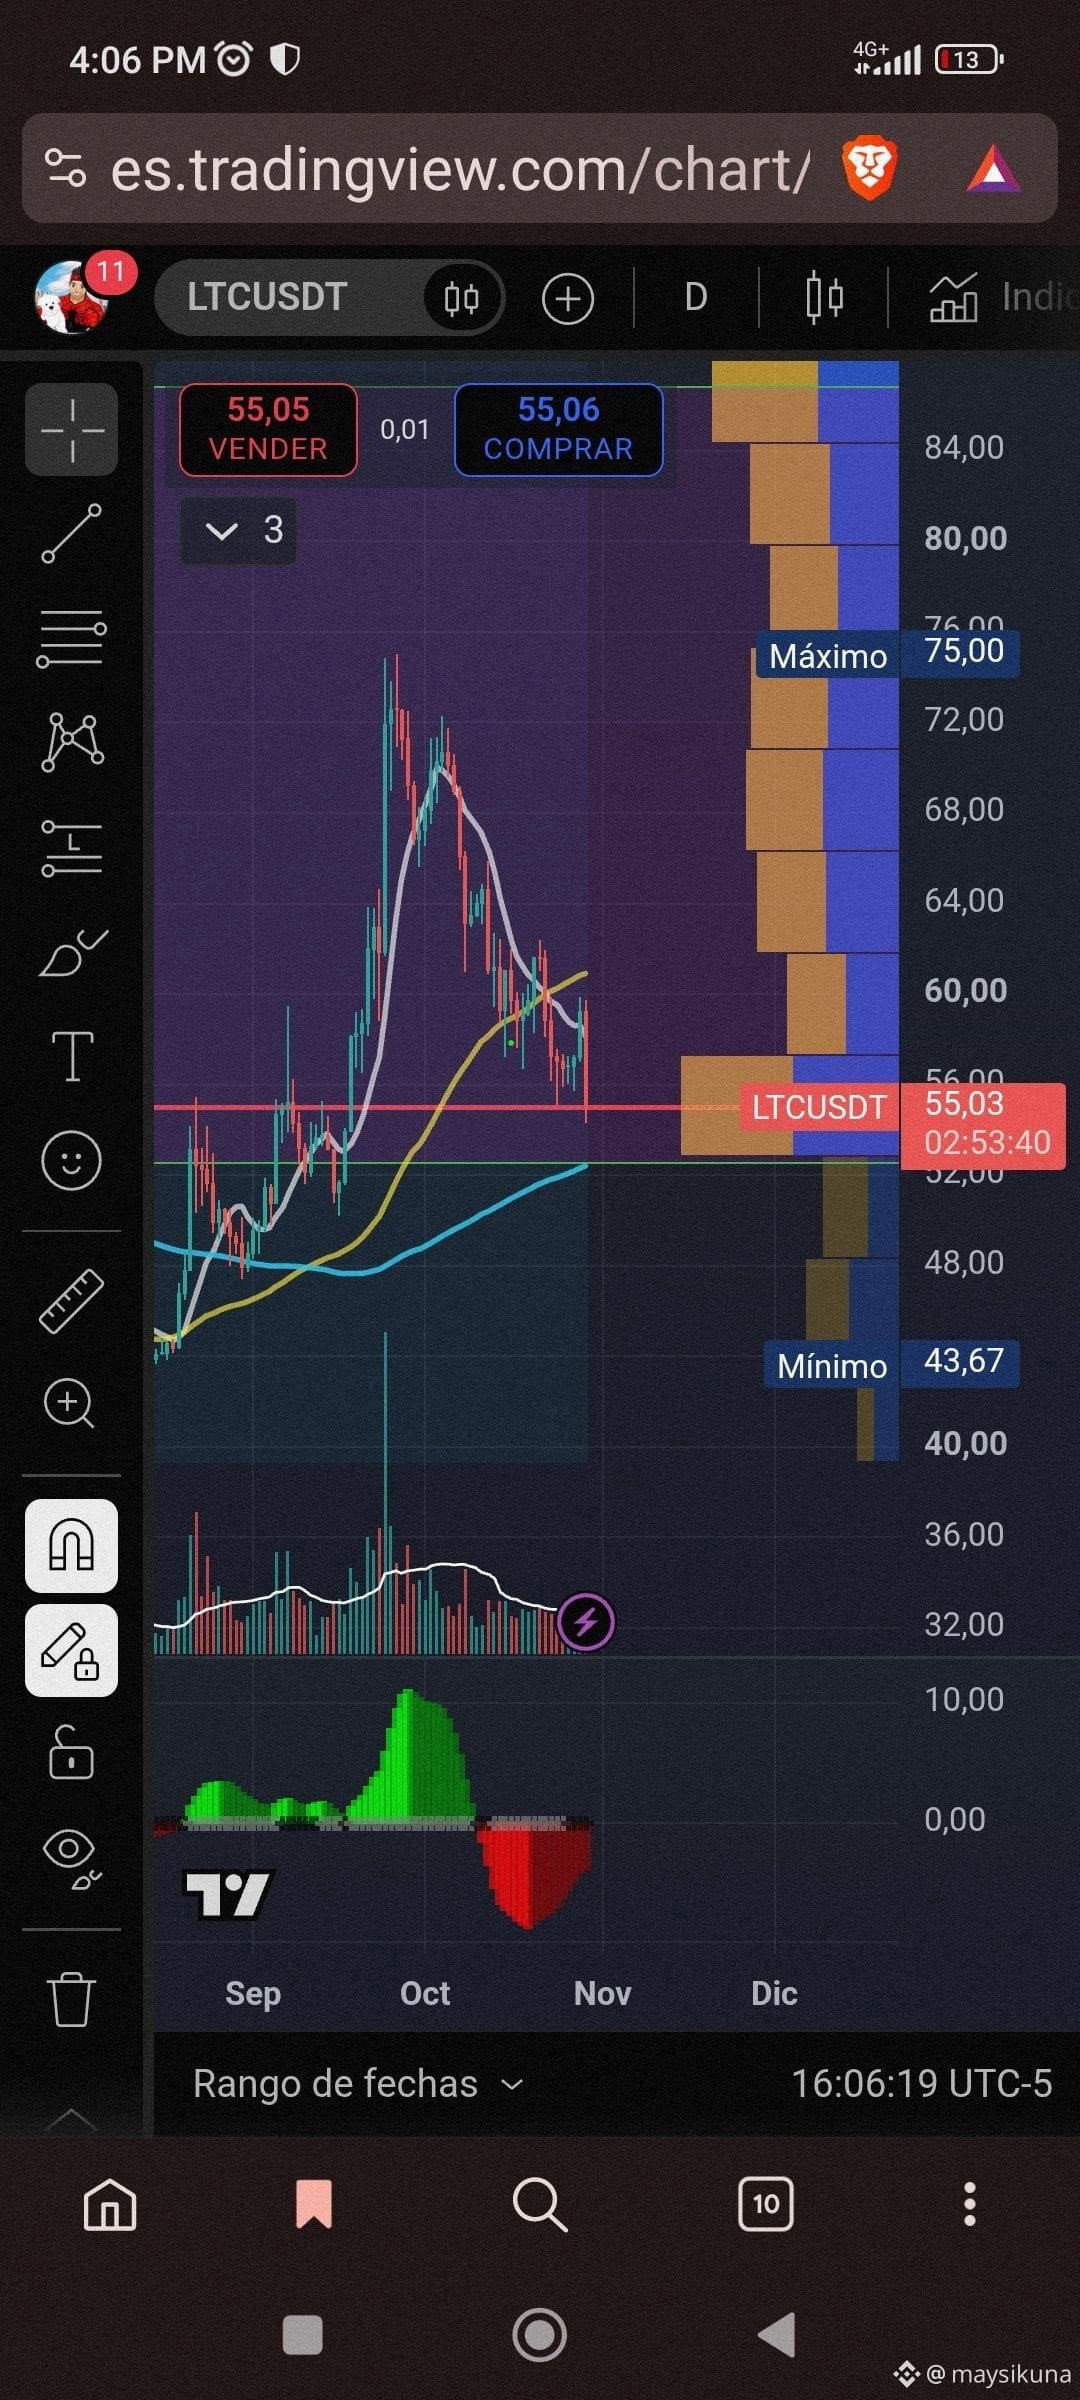
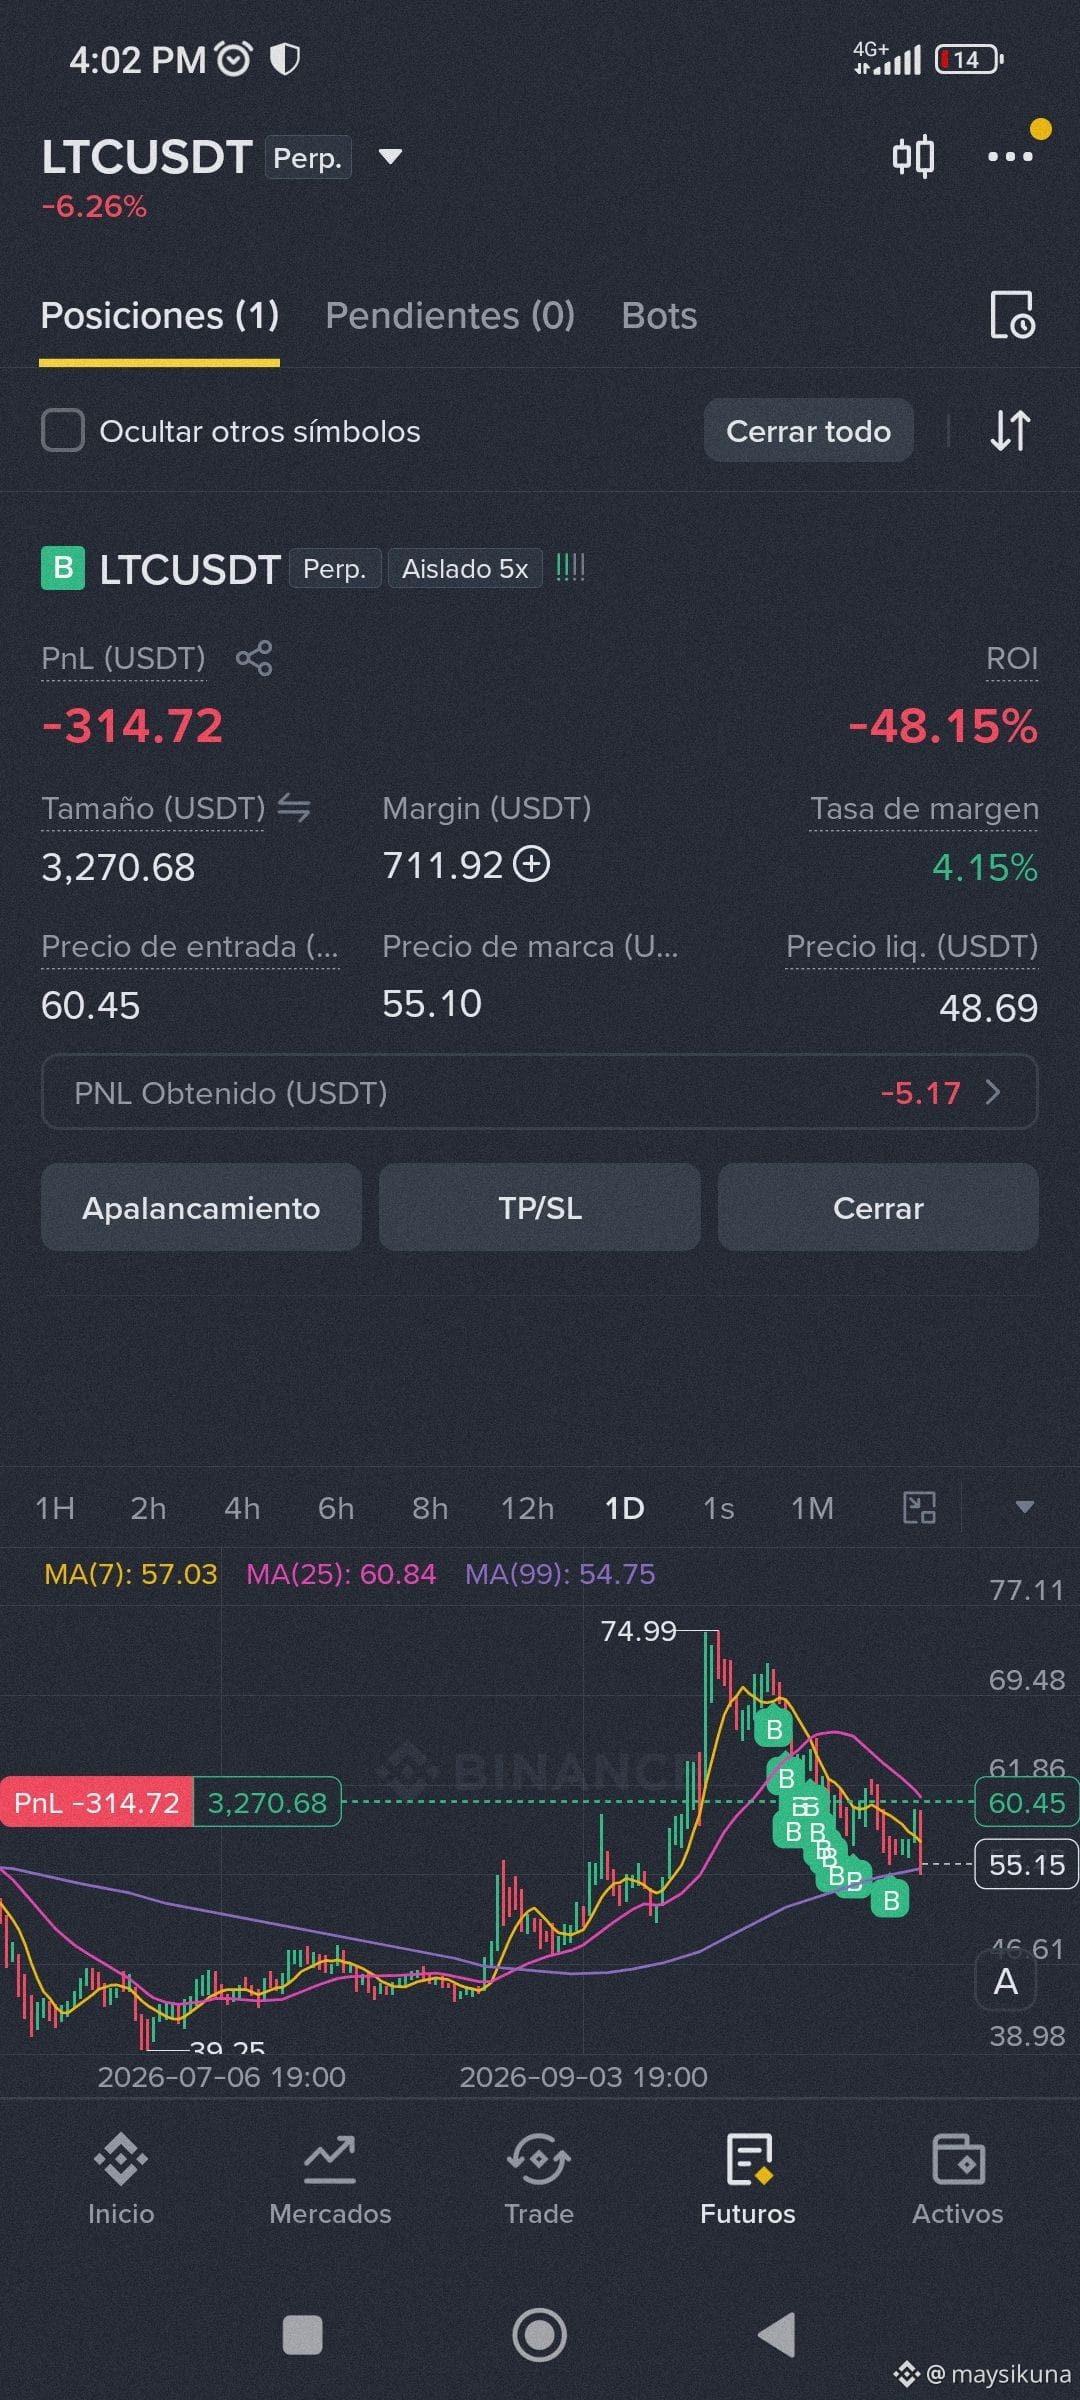
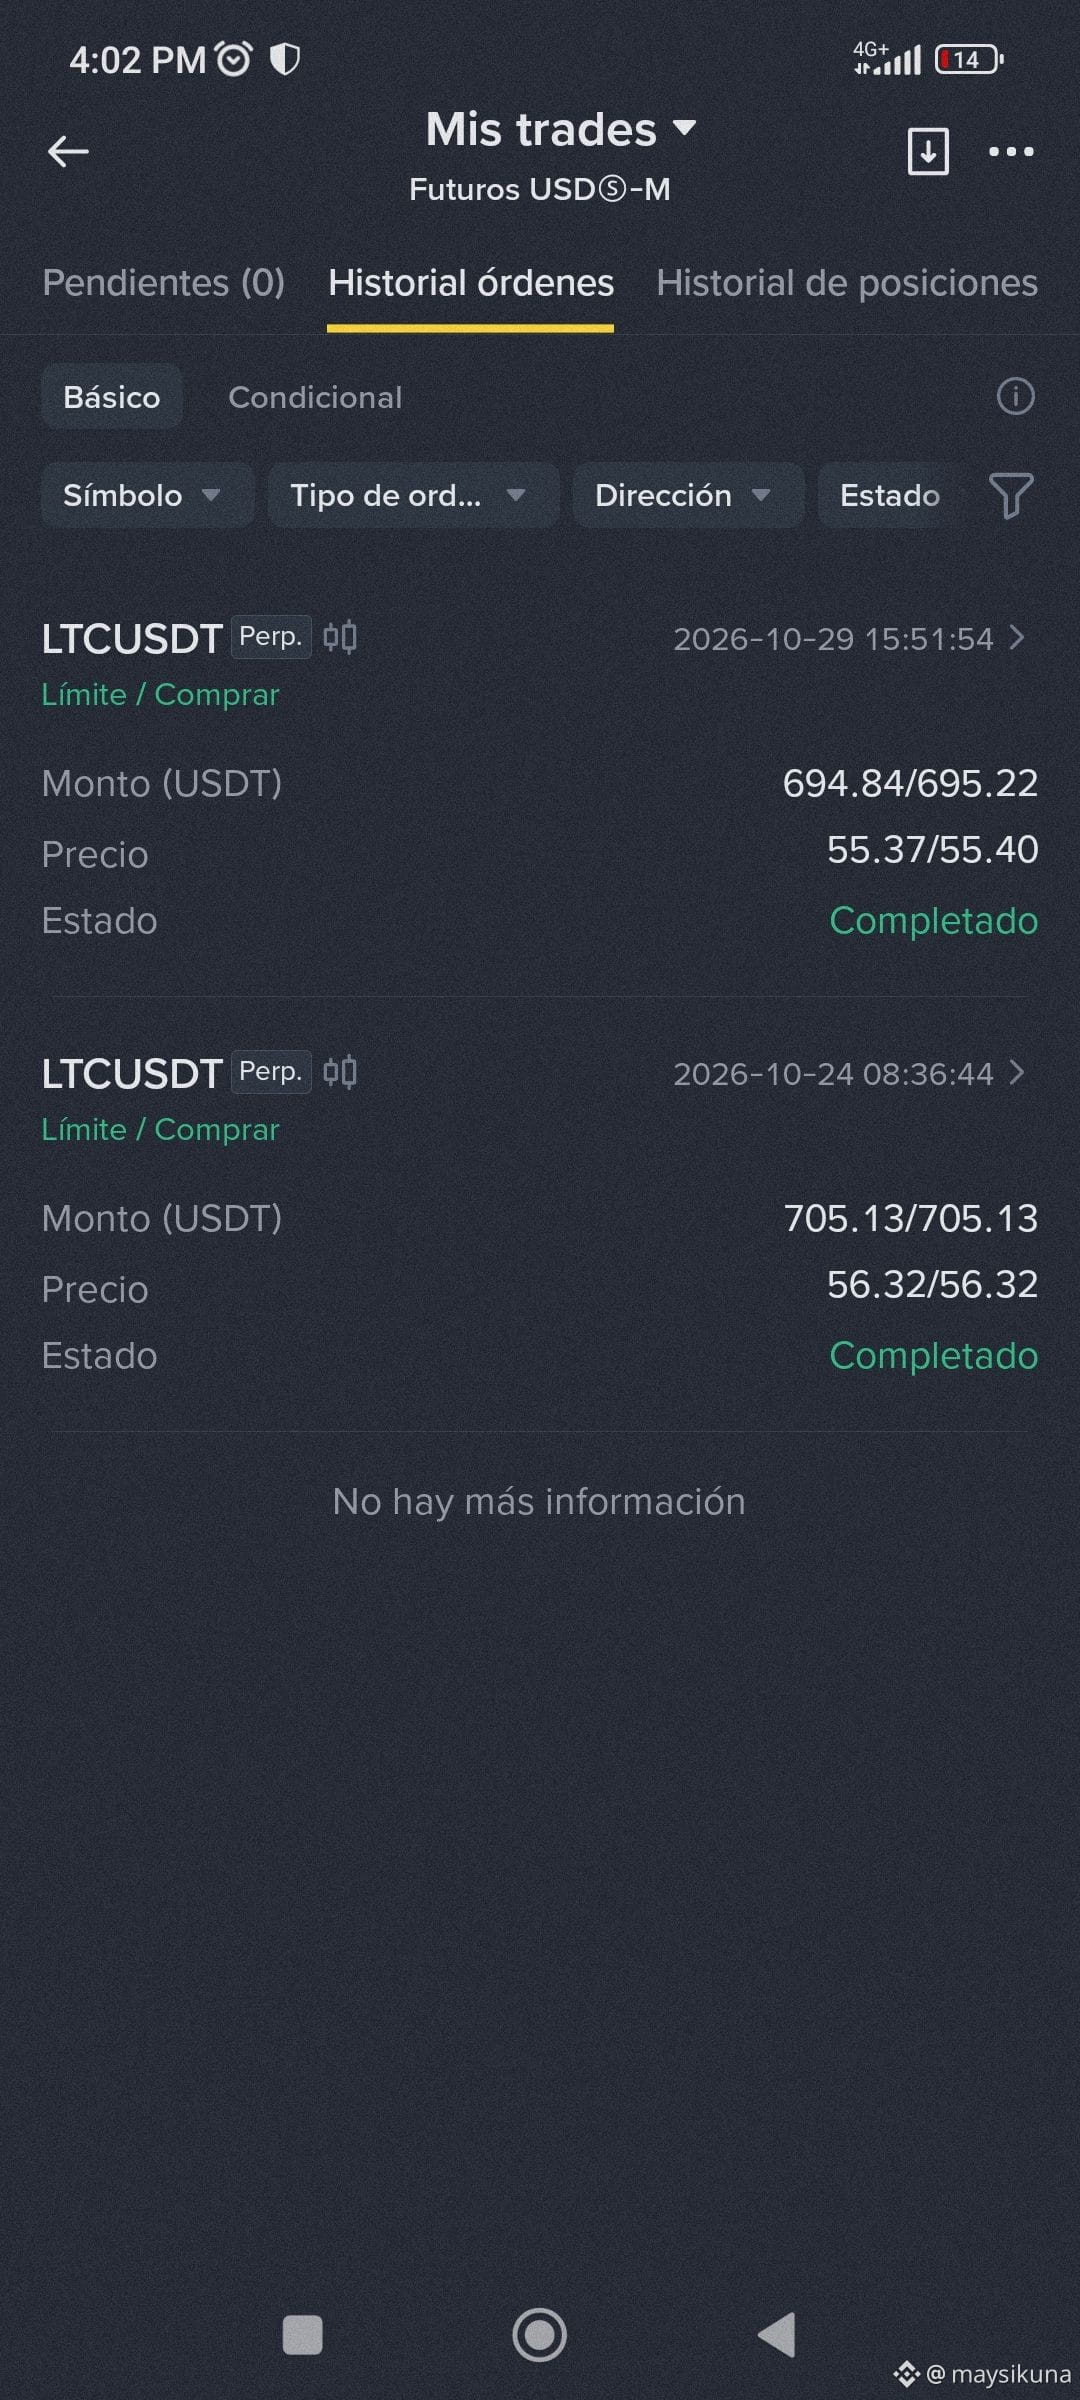
In episode 1, I told you why I opened my LONG on LTCUSDT: I believe Litecoin could be shifting into an uptrend. Today the market pulled back again, and I made a decision: I added to my position to improve my average entry price.
📊 Here’s how the battle is going:
🔹 Trade: $LTC Perpetual LONG
🔹 Leverage: 5x
🔹 Margin: isolated
🔹 Average entry price: 60.45 USDT
🔹 Mark price when the screenshot was taken: 55.10 USDT
🔹 Unrealized loss: -314.72 USDT
🔹 ROI: -48.15%
🔹 Displayed liquidation price: 48.69 USDT
🛡️ My strategy is still DCA: I’ve planned a maximum of 1,200 USDT in margin, split across 30 entries of 40 USDT each. Each entry is equivalent to approximately 200 USDT of exposure with 5x leverage.
But there’s something important: averaging down doesn’t guarantee a win. If the uptrend I’m expecting doesn’t materialize, I’ll have to accept that my analysis may be wrong. I don’t want discipline to turn into stubbornness.
⚔️ Now I want to hear from the community:
🥊 LONG TEAM: Do you think LTC can recover to 60 USDT?
🐻 BEARISH TEAM: Do you think it could still fall to 50 USDT or lower?
🧠 DCA EXPERTS: Would you have added to your position during this pullback, or waited for a rebound confirmation?
👇 Share your scenario in the comments and tell me which level you’d be watching. I’ll be back with episode 3 to show how this battle unfolds, without hiding the results.
I don’t know whether I’ll end up winning or losing, but I’m going to document the whole journey. 📈📉
#Litecoin #LTCUSDT #Trading #DCA #BinanceSquare
maysikuna
·
--
🚨 #LTC📈 : WILL I END UP WINNING OR LOSE EVERYTHING? — EP. 1
Today, an experiment begins that I want to document publicly. 📉📈
I have a LONG position in $LTC Perpetual with 5x leverage, and things are looking complicated:
🔴 Entry: 61.82 USDT
📍 Mark price: 56.42 USDT
💸 Unrealized loss: -252.57 USDT
📉 ROI: -48%
⚠️ Liquidation price: 49.78 USDT
My strategy is to track how this position develops and find out whether DCA can help me improve my average entry price. But I know that averaging down on futures can also increase the risk and bring me closer to liquidation.
I’m not going to hide the numbers or show only the pretty results. I want to document the process, the decisions, and any mistakes I might make.
🔥 I want this to be a real story: Will LTC prove me right, or will the market teach me a lesson?
👇 Now it’s your turn:
1️⃣ Do you think LTC can recover to 61.82 USDT?
2️⃣ Would you hold the LONG or reduce the risk?
3️⃣ What level would you watch before making a decision?
Share your analysis in the comments. I’ll be back with EP. 2 to update you on the position and show what happened.
#LTC #Litecoin #Trading #Crypto #BinanceSquare
130
LTC is testing a tight range near the 75-day EMA and just snapped the last swing low, signaling a potential shift in momentum.
━━━━━━━━━━━━━━━━━━━━━
🟢 $LTC LONG 📈
━━━━━━━━━━━━━━━━━━━━━
📍 Entry Range: $59.2307 – $59.3493
🛑 Stop Loss: $57.5113 (-3.0%)
🎯 TP1: $60.1793 (+1.5%)
🏆 TP2: $62.2545 (+5.0%)
⚡ R/R Ratio: 1:1.7
📊 Confidence: 65%
━━━━━━━━━━━━━━━━━━━━━
A change of character broke the descending swing, confirmed by a surge in CVD that backs the directional bias. The fair value gap aligns with the order block, creating a point of interest where OB and FVG overlap, and the confluence reinforces the long bias. The market structure now points to higher highs as the next swing target forms.
A 3.0% stop is relatively tight on this volatility, so keep leverage around 2-3x.
Consider taking half profit near the first target at the next resistance level.
DYOR — this isn't financial advice, size your risk accordingly 🙏
$LTC #LTCUSDT #earningsseason #TradingSignals #Write2Earn
━━━━━━━━━━━━━━━━━━━━━
🟢 $LTC LONG 📈
━━━━━━━━━━━━━━━━━━━━━
📍 Entry Range: $59.2307 – $59.3493
🛑 Stop Loss: $57.5113 (-3.0%)
🎯 TP1: $60.1793 (+1.5%)
🏆 TP2: $62.2545 (+5.0%)
⚡ R/R Ratio: 1:1.7
📊 Confidence: 65%
━━━━━━━━━━━━━━━━━━━━━
A change of character broke the descending swing, confirmed by a surge in CVD that backs the directional bias. The fair value gap aligns with the order block, creating a point of interest where OB and FVG overlap, and the confluence reinforces the long bias. The market structure now points to higher highs as the next swing target forms.
A 3.0% stop is relatively tight on this volatility, so keep leverage around 2-3x.
Consider taking half profit near the first target at the next resistance level.
DYOR — this isn't financial advice, size your risk accordingly 🙏
$LTC #LTCUSDT #earningsseason #TradingSignals #Write2Earn
6

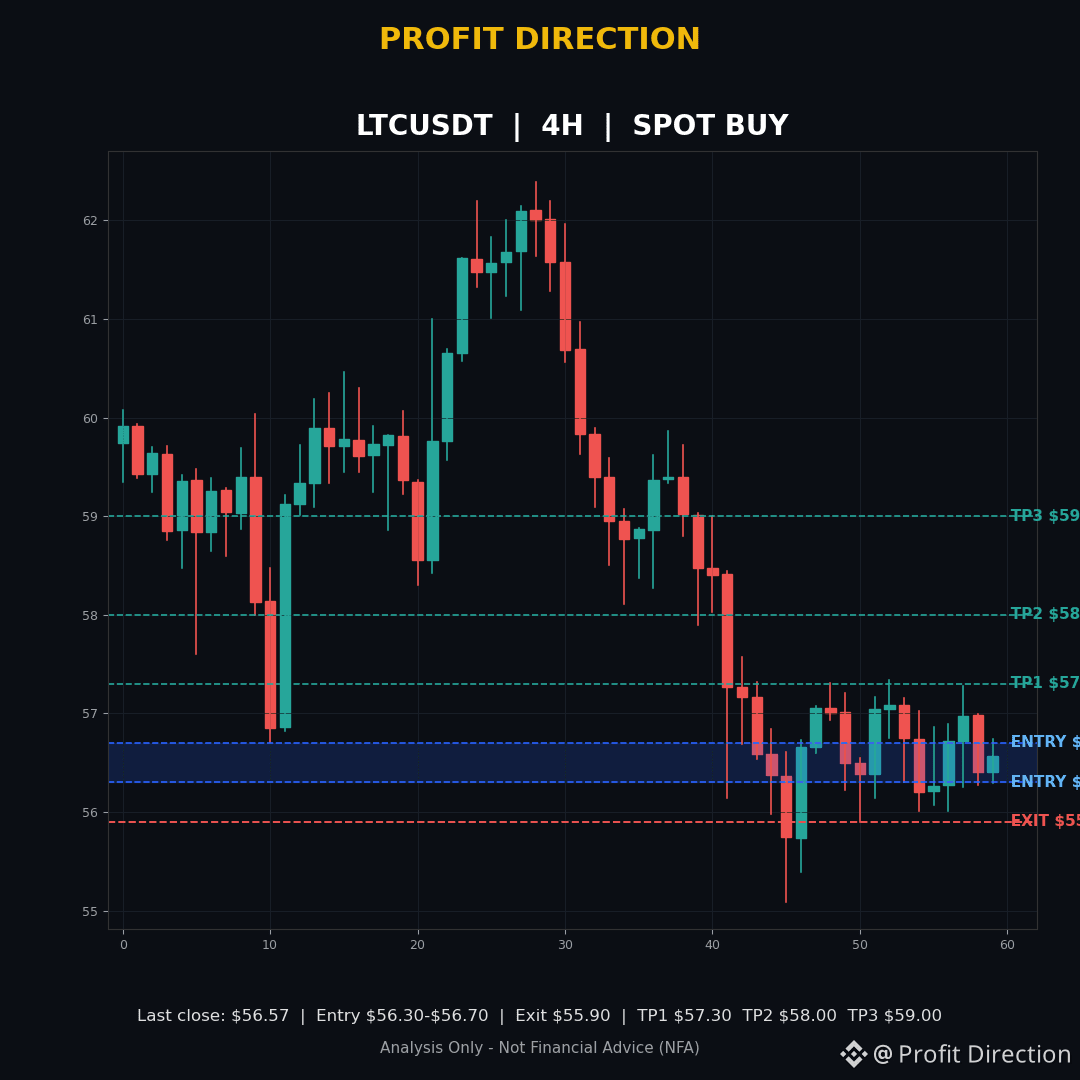
🚀 LTCUSDT | SPOT BUY
📍 Entry Zone: $56.30–$56.70
🚪 Exit (Invalidation): $55.90
🎯 TP1: $57.30
🎯 TP2: $58.00
🎯 TP3: $59.00
⚖️ R:R: 1:1.33 to TP1 | 1:2.50 to TP2 | 1:4.17 to TP3 (midpoint $56.50)
⏱️ TF: 4H
📊 Reason: LTC has held the $56.00–$56.30 support zone repeatedly on 4H, with lows at $56.01, $56.07, $56.01 and $56.25 in recent candles, and bounced toward $57.28–$57.34. Price is now back in the $56.30–$56.70 zone, so this is a support buy, not a chase. Invalidation: a 4H close below $55.90, under the recent support cluster. This is a spot idea, no leverage. Note: BTC is near $80,039 ahead of the Fed decision on Oct 28, so macro volatility can break support quickly — respect the exit level.
⚠️ Analysis Only — Not Financial Advice (NFA). Trading involves risk.
Follow Profit Direction for more signals, best signals and market updates. Share your opinion in the comments.
#LTC #LTCUSDT #Litecoin #CryptoTrading
16


·
--
📉 LTC bearish in the short term, with the 58 level facing a test
Market snapshot for October 23 at 21:04 (Beijing time): LTCUSDT was at 58.78, down 0.56% over 24 hours, with $56.3 million in futures trading volume. The 1-hour RSI was 39.9, while the daily MACD was below both the zero line and the signal line, indicating weak momentum. Market indicators (https://www.kripto724.com/analiz/ltc/)
The latest futures snapshot shows open interest at around $71.77 million, up 2.50% over 24 hours, and a funding rate of +0.0074% per 8 hours. Price is falling while open interest is rising, and longs are paying the funding rate—putting pressure on any rebound. Aggressive buy/sell volume is currently unavailable for verification. Futures data (https://fibonomy.com/en/futures/binance/ltcusdt)
Over the next 4–24 hours, the bias is toward a further decline: support is at 58.24–58.06, with 57.40 in view if it breaks below. Resistance is at 59.82–59.84. A breakout on increased volume and a sustained hold above this level would invalidate the bearish outlook, opening the way to 60.53.
#LTC #LTCUSDT #莱特币 #Futures Analysis
18
LTC is trading just under the 90‑day low, with sellers pushing the price below the 4‑hour swing point. Momentum is fading fast, and the next move looks sharply down.
━━━━━━━━━━━━━━━━━━━━━
🔴 $LTC SHORT 📉
━━━━━━━━━━━━━━━━━━━━━
📍 Entry Range: $58.6513 – $58.7687
🛑 Stop Loss: $60.4713 (-3.0%)
🎯 TP1: $57.8293 (+1.5%)
🏆 TP2: $55.7745 (+5.0%)
⚡ R/R Ratio: 1:1.7
📊 Confidence: 64%
━━━━━━━━━━━━━━━━━━━━━
A clear change of character broke the bullish swing, and the order block from the prior up‑trend lines up with a fair‑value gap on the 1‑hour chart. CVD shows volume flowing to the downside, confirming the break. The overlap of the OB and FVG creates a point of interest that reinforces the short bias.
A 3 % stop is relatively tight on this swing, so a 2‑to‑3× leverage fits the risk profile.
Take a partial profit at the first target around 1.7 R to lock in gains.
As always: manage your risk, this is not financial advice 🙏
$LTC #LTCUSDT #CPIWatch #TradingSignals #Write2Earn
━━━━━━━━━━━━━━━━━━━━━
🔴 $LTC SHORT 📉
━━━━━━━━━━━━━━━━━━━━━
📍 Entry Range: $58.6513 – $58.7687
🛑 Stop Loss: $60.4713 (-3.0%)
🎯 TP1: $57.8293 (+1.5%)
🏆 TP2: $55.7745 (+5.0%)
⚡ R/R Ratio: 1:1.7
📊 Confidence: 64%
━━━━━━━━━━━━━━━━━━━━━
A clear change of character broke the bullish swing, and the order block from the prior up‑trend lines up with a fair‑value gap on the 1‑hour chart. CVD shows volume flowing to the downside, confirming the break. The overlap of the OB and FVG creates a point of interest that reinforces the short bias.
A 3 % stop is relatively tight on this swing, so a 2‑to‑3× leverage fits the risk profile.
Take a partial profit at the first target around 1.7 R to lock in gains.
As always: manage your risk, this is not financial advice 🙏
$LTC #LTCUSDT #CPIWatch #TradingSignals #Write2Earn
5
·
--
📉 LTC is bearish in the short term, with rebounds still facing pressure
The latest readable webpage snapshot shows: LTCUSDT perpetual mark price at 58.44, down 5.36% over 24 hours, with trading volume of 74.53 million USDT; USD-denominated OI at 69.17 million, down 2.78%, while the 8-hour funding rate remains at +0.0076%. Prices are weakening while longs are still paying funding; there is not yet a signal of stabilization. Futures data (https://fibonomy.com/en/futures/binance/ltcusdt)
In the technical snapshot, the 4-hour RSI is 39.2 and the daily MACD is bearish; synchronized data on aggressive buying and selling volume is unavailable, so the direction of aggressive flows cannot yet be determined. Watch support at 58.24, with 57.40 in view if it breaks; resistance is at 59.84, with 60.53 in view if it breaks. Technical data (https://www.kripto724.com/analiz/ltc/)
Over the next 4–24 hours, the outlook favors a rebound followed by another test of support. A bearish view would be invalidated if price holds above 59.84 on increased volume.
#LTC #LTCUSDT #莱特币 #FuturesMarket
15
·
--
📈 LTC is short-term bullish; 62.30 is the breakout level
The latest available public snapshot may be delayed: LTCUSDT was around 62.09, up 1.41% over 24 hours, with a trading volume of 62.48 million USDT; OI was about 73.58 million USD, up 5.63%, and the 8-hour funding rate was +0.0072%. Price and open interest are recovering in tandem, supporting a short-term bullish bias. Data (https://fibonomy.com/en/futures/binance/ltcusdt)
The 4-hour RSI is 63.8, but the daily MACD remains below zero. Aggressive buying and selling are nearly balanced, so buyers have yet to establish a clear advantage in chasing prices higher. Technical indicators (https://www.kripto724.com/analiz/ltc/), buy/sell data (https://bitcoinleverage.com/ltc/price)
Over the next 4–24 hours, the outlook favors a choppy move upward: support at 61.60 and resistance at 62.30. If price breaks above and holds that level on increased volume, 63.40 is the next target. If the 1-hour candle closes below 61.60, the bullish outlook is invalidated; watch for a pullback to 60.80.
#LTC #LTCUSDT #莱特币 #Futures Analysis
238
·
--
📈 LTC short-term outlook is bullish; watch for a breakout above 62.3
Latest available snapshot as of October 21: LTCUSDT perpetual mark price at 61.40, up 2.88% over 24 hours, with $76.6 million in trading volume; OI at approximately $70.89 million, up 3.30%, and funding rate at +0.0034%/8 hours. The rise in both price and OI supports the rebound, but USD-denominated OI is affected by the coin’s price and cannot be equated directly with an increase in long positions. Data (https://fibonomy.com/en/futures/binance/ltcusdt)
Over the 24-hour period through 11:00 Beijing time, aggressive buying accounted for approximately 51.8%. Buyers had a slight edge, but buying pressure was not yet overwhelming. Source (https://bitcoinleverage.com/ltc/funding-rate)
The 4-hour RSI is 58.9; a real-time MACD value with a matching timeframe is unavailable. The outlook for the next 4–24 hours leans toward further gains: support at 60.55, resistance at 62.30, with 63.40 in view if price breaks above and holds that level on increased volume. If the 4-hour candle closes below 60.55, the bullish outlook is invalidated, with 59.26 as the next downside target. Technical reference (https://cn.coinotag.com/cryptocurrencies/spot/LTC/technical-analysis)
#LTC #LTCUSDT #莱特币 #Binance Futures
197
LTC is perched around the 115 mark, fresh buying pressure has halted a recent 2.8% dip, and the 4‑hour chart shows a clear upward thrust. Momentum is building as volume spikes and the next resistance zone looms.
🟢 $LTC LONG 📈
Entry $61.4685-$61.5915 | SL $59.6841 (-3.0%) | TP1 $62.4529 (+1.5%) | TP2 $64.6065 (+5.0%) | R/R 1:1.7 | Conf 65%
The market structure broke to the upside (CHoCH) while cumulative volume turned bullish (CVD), confirming the move. A fair‑value gap lines up with a strong order block, creating a POI where the OB and FVG overlap, giving the trade a solid confluence. The price is now riding that confluence toward the target.
A 3.0% stop is about 3.45 on a 115 entry, which is fairly tight, so keep leverage modest at 2‑3x to protect the margin.
Take half profit once price hits the first target around 125 to lock in gains.
As always: manage your risk, this is not financial advice 🙏
$LTC #LTCUSDT #CPIWatch #TradingSignals #Write2Earn
31
·
--
📉LTC is bearish in the short term, with resistance still overhead on any rebound
Public snapshot for October 20 (https://fibonomy.com/en/futures/binance/ltcusdt): LTCUSDT mark price at 58.90U, down 1.50% in 24 hours, with a trading volume of 52.17 million U; OI at around 67.90 million U, down 2.41%, and funding rate at +0.0100% per 8 hours. Falling price and declining OI suggest deleveraging, while longs are still paying funding; there is not yet enough evidence of a reversal.
As of 17:00 Beijing time (https://bitcoinleverage.com/ltc/taker-volume), taker buy and sell volumes were nearly even, with no clear buying advantage. LTC's hourly indicators (https://www.coinlore.com/coin/litecoin/technical-analysis) showed an RSI of around 43.7, while the MACD was below the zero line, indicating momentum remains weak.
Over the next 4–24 hours, the outlook favors a move lower after a rebound encounters resistance: support at 58.18U, with 57.08U in view if it breaks below; resistance at 59.65U. If price holds above this level on increased volume, the bearish outlook would be invalidated, opening the way toward 60.92U.
#LTC #LTCUSDT #莱特币 #MarketAnalysis
260
LTC is ripping down the 30‑minute swing, hammering past the recent swing high and eyeing the next resistance zone.
━━━━━━━━━━━━━━━━━━━━━
🔴 $LTC SHORT 📉
━━━━━━━━━━━━━━━━━━━━━
📍 Entry Range: $59.7202 – $59.8398
🛑 Stop Loss: $61.5734 (-3.0%)
🎯 TP1: $58.8833 (+1.5%)
🏆 TP2: $56.7910 (+5.0%)
⚡ R/R Ratio: 1:1.7
📊 Confidence: 64%
━━━━━━━━━━━━━━━━━━━━━
A clean CHoCH broke the bullish structure, the CVD turned sharply negative, and a fresh FVG lines up with an OB that just held. The POI confluence of the order block and fair‑value gap locks in a high‑probability short entry.
A 3.0% stop is relatively tight on this volatility, so keep leverage modest—around 3‑5x.
Take half profit as price hits the first target around the 1.7 R level.
As always: manage your risk, this is not financial advice 🙏
$LTC #LTCUSDT #CPIWatch #TradingSignals #Write2Earn
━━━━━━━━━━━━━━━━━━━━━
🔴 $LTC SHORT 📉
━━━━━━━━━━━━━━━━━━━━━
📍 Entry Range: $59.7202 – $59.8398
🛑 Stop Loss: $61.5734 (-3.0%)
🎯 TP1: $58.8833 (+1.5%)
🏆 TP2: $56.7910 (+5.0%)
⚡ R/R Ratio: 1:1.7
📊 Confidence: 64%
━━━━━━━━━━━━━━━━━━━━━
A clean CHoCH broke the bullish structure, the CVD turned sharply negative, and a fresh FVG lines up with an OB that just held. The POI confluence of the order block and fair‑value gap locks in a high‑probability short entry.
A 3.0% stop is relatively tight on this volatility, so keep leverage modest—around 3‑5x.
Take half profit as price hits the first target around the 1.7 R level.
As always: manage your risk, this is not financial advice 🙏
$LTC #LTCUSDT #CPIWatch #TradingSignals #Write2Earn
6
LTC is rallying above the 85‑day moving average, snapping a three‑week low and eyeing the 95 resistance. Volume spikes suggest the bulls are finally taking control.
🟢 $LTC LONG 📈
Entry $60.1997-$60.3203 | SL $58.4522 (-3.0%) | TP1 $61.1639 (+1.5%) | TP2 $63.2730 (+5.0%) | R/R 1:1.7 | Conf 64%
The market structure broke higher on a clean CHoCH as price ripped through the previous swing low, while the CVD turned sharply bullish confirming the move. A fresh fair‑value gap aligns with an order block that held, creating a POI confluence, and a recent liquidity sweep gave the final push.
A 3 % stop is relatively tight for a volatile altcoin, so I’d stay around 2‑3 × leverage.
Take half off the table once price hits the first target near 92.
Not financial advice — trade only what you can afford to lose 🙏
$LTC #LTCUSDT #CPIWatch #TradingSignals #Write2Earn
5
LTC is charging past the recent swing high, eyes locked on the next resistance as buying pressure builds.
🟢 $LTC LONG 📈
Entry → $59.6603-$59.7797
Stop → $57.9284 (-3.0%)
TP1 → $60.6158 (+1.5%)
TP2 → $62.7060 (+5.0%)
R/R 1:1.7 • Confidence 65%
A clear CHoCH shattered the downtrend, CVD spiked confirming bullish flow, and a fresh FVG sits inside a strong OB, giving a tight POI confluence as price hovers on the block edge.
A 3.0% stop is relatively tight; stick to modest leverage, around 2‑3x, to keep risk manageable.
Take partial profit at the first target as soon as price clears the next minor resistance.
Not financial advice — always manage your own risk 🙏
$LTC #LTCUSDT #CPIWatch #TradingSignals #Write2Earn
4

·
--
Bullish
#LTCUSDT
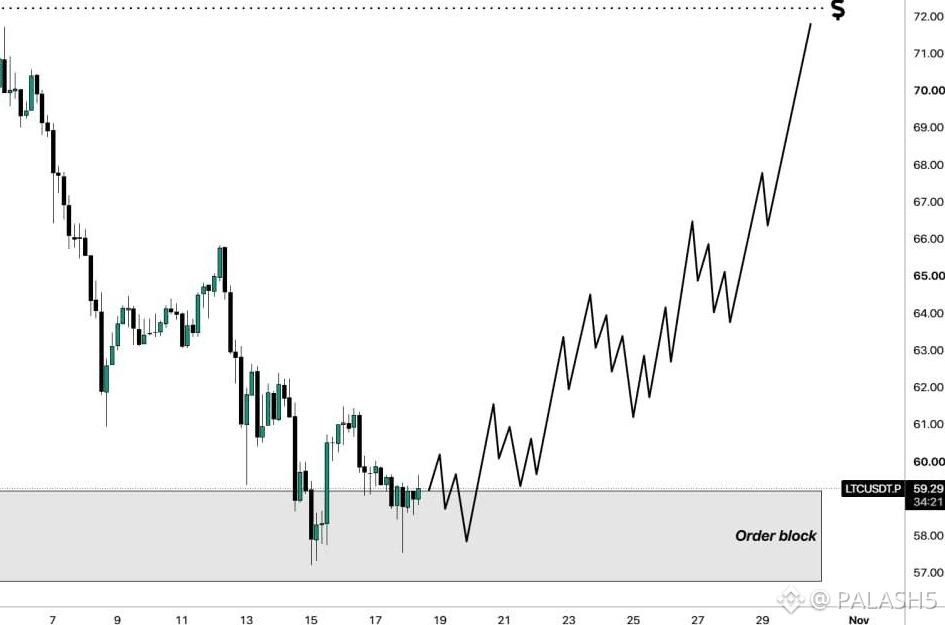
🕯 Chart analysis:
The price of LTC is trading within the order block zone. If it successfully holds above this zone, an uptrend will begin.
📍 Entry:
A long position can be opened within the order block zone between the $56.8 and $59.2 levels.
✔️ Main Target:
Liquidity is at the previous high of $72.2.
$LTC
{future}(LTCUSDT)
#LTCUSDT
🕯 Chart analysis:
The price of LTC is trading within the order block zone. If it successfully holds above this zone, an uptrend will begin.
📍 Entry:
A long position can be opened within the order block zone between the $56.8 and $59.2 levels.
✔️ Main Target:
Liquidity is at the previous high of $72.2.
$LTC
112
LTC is slipping below the 3‑day low, testing the 78.6 % Fibonacci retracement. A break here could hand the bears the momentum they’ve been hunting.
🔴 $LTC SHORT 📉 — Trade Plan
• Entry: $58.9010 – $59.0190
• Stop: $60.7288 (-3.0%)
• Target 1: $58.0756 (+1.5%)
• Target 2: $56.0120 (+5.0%)
• R/R 1:1.7 | Confidence 64%
The market strutted into a classic change of character as price fractured the swing high, and the CVD turned sharply negative, confirming the sell pressure. An order block anchored at the 1.85k level overlaps a fair‑value gap, while a recent liquidity sweep wiped out the last long liquidity pool, giving a strong POI confluence. Structure now sits in a descending channel, so the short bias feels tight.
A 3 % stop is relatively tight on a volatile pair, so keep leverage at or below 5x.
Take partial profit around the first target to lock in risk‑reward before the next swing.
DYOR — this isn't financial advice, size your risk accordingly 🙏
$LTC #LTCUSDT #CPIWatch #TradingSignals #Write2Earn
9
Log in to explore more content
Join global crypto users on Binance Square
⚡️ Get latest and useful information about crypto.
💬 Trusted by the world’s largest crypto exchange.
👍 Discover real insights from verified creators.
Email / Phone number
Trending Topics
1
#WithdrawalsBack: 15 networks live
610 views
29 Discussing
2
#BinanceUpdatesProofofReservesAddresses
39,418 views
809 Discussing
3
#BinanceToResumePhaseOneOfWithdrawals
71,789 views
1,053 Discussing
4
#BinanceHadAlreadyCovered$6BofHackLoss
5,742 views
104 Discussing
5
#FBIConfirmsNorthKoreaIsResponsibleForBinanceCryptoHack
32,159 views
115 Discussing
6
#BinanceSAFUFundTransferCompleted7499BTC
145,191 views
1,878 Discussing
7
#CZDismissesClaimsBinanceHackWasPredicted
31,317 views
447 Discussing
8
#BinanceRecovery90% of stolen assets
271,210 views
259 Discussing
9
#B14gReportsUnauthorizedTransferOfAbout97MCORE
9,452 views
178 Discussing
10
#USSpotETHETFsPost23StraightDaysOfNetOutflows
9,433 views
150 Discussing