
#elliottwave
elliottwave
715,769 views
927 Discussing
Hot
Latest

·
--
Invalidating a bunch of historical fractals on $BTC doesn't actually kill the bigger bullish structure the way most traders assume.
You've been there, dumping at the first sign of breakdown only to watch price recover and leave you sitting in cash. That's how these Wave 2 pullbacks quietly wreck accounts.
We're sitting in Wave 2 with a bearish monthly setup right now. The September close printed a bullish change of character so this drop is simply the expected pullback, not a full reversal. Price is testing the 62.8k region and bouncing for now.
Lose 62.8k and the structure turns a lot more fragile, which would likely drag $ETH lower with $BTC into a deeper correction. The real danger is getting shaken out right here if you treat every dip like the end.
What's your plan if we actually lose that 62.8k level?
#Bitcoin #ElliottWave #CryptoTrading
Invalidating a bunch of historical fractals on $BTC doesn't actually kill the bigger bullish structure the way most traders assume.
You've been there, dumping at the first sign of breakdown only to watch price recover and leave you sitting in cash. That's how these Wave 2 pullbacks quietly wreck accounts.
We're sitting in Wave 2 with a bearish monthly setup right now. The September close printed a bullish change of character so this drop is simply the expected pullback, not a full reversal. Price is testing the 62.8k region and bouncing for now.
Lose 62.8k and the structure turns a lot more fragile, which would likely drag $ETH lower with $BTC into a deeper correction. The real danger is getting shaken out right here if you treat every dip like the end.
What's your plan if we actually lose that 62.8k level?
#Bitcoin #ElliottWave #CryptoTrading
You've been there, dumping at the first sign of breakdown only to watch price recover and leave you sitting in cash. That's how these Wave 2 pullbacks quietly wreck accounts.
We're sitting in Wave 2 with a bearish monthly setup right now. The September close printed a bullish change of character so this drop is simply the expected pullback, not a full reversal. Price is testing the 62.8k region and bouncing for now.
Lose 62.8k and the structure turns a lot more fragile, which would likely drag $ETH lower with $BTC into a deeper correction. The real danger is getting shaken out right here if you treat every dip like the end.
What's your plan if we actually lose that 62.8k level?
#Bitcoin #ElliottWave #CryptoTrading
1
35
·
--
Everyone thinks a breakout means the bull run is just getting started, but actually, late-stage rallies are where most traders lose everything.
Too many people FOMO in with heavy leverage right at the tail end of a move, only to get wiped out on the sudden reversal. It hurts because you bought the right direction, just at the exact moment smart money prepared to exit.
Think of market structure like a runner finishing a marathon. In Elliott Wave theory, this potential Wave 5 on $BTC is essentially that final sprint across the line before collapsing into a long rest. While a confirmed breakout could easily push price straight into the cumulative short liquidation leverage band between $62,220 and $63,000, sprint finishes are notoriously treacherous.
There are two major traps you need to watch out for. First, pushing into the $63,000 zone is primarily driven by forced liquidations rather than organic spot buyers, which means the fuel burns out very fast. Second, mistaking this final push for the start of a broader supercycle often tricks investors into taking oversized risks on $ETH just before momentum stalls.
Liquidation clusters act like giant magnets designed to trigger stops and hand cheap exit liquidity to larger players. Letting a move play out without touching the buy button can feel frustrating, but preserving your capital matters far more than trying to squeeze out the final few percent of an exhausted leg.
Where do you think price goes once those short liquidations get tapped?
#Bitcoin #CryptoTrading #ElliottWave
Everyone thinks a breakout means the bull run is just getting started, but actually, late-stage rallies are where most traders lose everything.
Too many people FOMO in with heavy leverage right at the tail end of a move, only to get wiped out on the sudden reversal. It hurts because you bought the right direction, just at the exact moment smart money prepared to exit.
Think of market structure like a runner finishing a marathon. In Elliott Wave theory, this potential Wave 5 on $BTC is essentially that final sprint across the line before collapsing into a long rest. While a confirmed breakout could easily push price straight into the cumulative short liquidation leverage band between $62,220 and $63,000, sprint finishes are notoriously treacherous.
There are two major traps you need to watch out for. First, pushing into the $63,000 zone is primarily driven by forced liquidations rather than organic spot buyers, which means the fuel burns out very fast. Second, mistaking this final push for the start of a broader supercycle often tricks investors into taking oversized risks on $ETH just before momentum stalls.
Liquidation clusters act like giant magnets designed to trigger stops and hand cheap exit liquidity to larger players. Letting a move play out without touching the buy button can feel frustrating, but preserving your capital matters far more than trying to squeeze out the final few percent of an exhausted leg.
Where do you think price goes once those short liquidations get tapped?
#Bitcoin #CryptoTrading #ElliottWave
Too many people FOMO in with heavy leverage right at the tail end of a move, only to get wiped out on the sudden reversal. It hurts because you bought the right direction, just at the exact moment smart money prepared to exit.
Think of market structure like a runner finishing a marathon. In Elliott Wave theory, this potential Wave 5 on $BTC is essentially that final sprint across the line before collapsing into a long rest. While a confirmed breakout could easily push price straight into the cumulative short liquidation leverage band between $62,220 and $63,000, sprint finishes are notoriously treacherous.
There are two major traps you need to watch out for. First, pushing into the $63,000 zone is primarily driven by forced liquidations rather than organic spot buyers, which means the fuel burns out very fast. Second, mistaking this final push for the start of a broader supercycle often tricks investors into taking oversized risks on $ETH just before momentum stalls.
Liquidation clusters act like giant magnets designed to trigger stops and hand cheap exit liquidity to larger players. Letting a move play out without touching the buy button can feel frustrating, but preserving your capital matters far more than trying to squeeze out the final few percent of an exhausted leg.
Where do you think price goes once those short liquidations get tapped?
#Bitcoin #CryptoTrading #ElliottWave

31

Most traders walk away from Bitcoin right before the wave that typically produces the last 30 percent or more of a bull cycle's gains.
Getting chopped up in the recent pullback has left a lot of us either too cautious to buy $BTC here or already in at prices that now feel uncomfortable. You know that mix of wanting the last pump while dreading another fakeout.
Looking at it through Elliott Wave, a framework that captured the structure of the 2017 and 2021 tops reasonably well, $BTC appears to have one final bullish Wave 5 still in play. The earlier waves built the trend, wave 4 did the damage that flushed out late longs.
A confirmed break above recent resistance could send it toward the $62,220 to $63,000 zone where a large amount of short liquidation leverage sits. $ETH has often mirrored these late-cycle impulses, catching a similar bid once Bitcoin starts the squeeze.
I have been through enough of these to recognize when hope starts overriding caution. Wave 5 is usually the last hurrah before the market reminds everyone that nothing goes up forever.
What's your take on whether this fifth wave still has room?
#Bitcoin #ElliottWave #Trading
Most traders walk away from Bitcoin right before the wave that typically produces the last 30 percent or more of a bull cycle's gains.
Getting chopped up in the recent pullback has left a lot of us either too cautious to buy $BTC here or already in at prices that now feel uncomfortable. You know that mix of wanting the last pump while dreading another fakeout.
Looking at it through Elliott Wave, a framework that captured the structure of the 2017 and 2021 tops reasonably well, $BTC appears to have one final bullish Wave 5 still in play. The earlier waves built the trend, wave 4 did the damage that flushed out late longs.
A confirmed break above recent resistance could send it toward the $62,220 to $63,000 zone where a large amount of short liquidation leverage sits. $ETH has often mirrored these late-cycle impulses, catching a similar bid once Bitcoin starts the squeeze.
I have been through enough of these to recognize when hope starts overriding caution. Wave 5 is usually the last hurrah before the market reminds everyone that nothing goes up forever.
What's your take on whether this fifth wave still has room?
#Bitcoin #ElliottWave #Trading
Getting chopped up in the recent pullback has left a lot of us either too cautious to buy $BTC here or already in at prices that now feel uncomfortable. You know that mix of wanting the last pump while dreading another fakeout.
Looking at it through Elliott Wave, a framework that captured the structure of the 2017 and 2021 tops reasonably well, $BTC appears to have one final bullish Wave 5 still in play. The earlier waves built the trend, wave 4 did the damage that flushed out late longs.
A confirmed break above recent resistance could send it toward the $62,220 to $63,000 zone where a large amount of short liquidation leverage sits. $ETH has often mirrored these late-cycle impulses, catching a similar bid once Bitcoin starts the squeeze.
I have been through enough of these to recognize when hope starts overriding caution. Wave 5 is usually the last hurrah before the market reminds everyone that nothing goes up forever.
What's your take on whether this fifth wave still has room?
#Bitcoin #ElliottWave #Trading
20
·
--
Have you noticed everyone cheering $BTC back above $60K while completely ignoring the fifth wave setup that could actually drive the next move?
Traders keep FOMO buying these reclaims and then getting chopped on the pullback because they never wait for confirmation. Most have no defined exit and end up missing the real entry or giving back gains.
The reclaim itself is not the story. If this is a fifth wave in play, $BTC has room to push above $63K as long as $60K holds with real conviction. Piling in right at the level is how people get trapped when it retests.
Wait for the hold plus a higher low and rising volume before scaling in. Keep invalidation tight below the recent swing so one failed wave does not wreck the position. $ETH and $SOL usually follow these $BTC structures, so the same confirmation often shows up there too. Map partial targets near $63K instead of hoping it just keeps going.
Where do you think this fifth wave actually takes us from here?
#Bitcoin #ElliottWave #CryptoTrading
Have you noticed everyone cheering $BTC back above $60K while completely ignoring the fifth wave setup that could actually drive the next move?
Traders keep FOMO buying these reclaims and then getting chopped on the pullback because they never wait for confirmation. Most have no defined exit and end up missing the real entry or giving back gains.
The reclaim itself is not the story. If this is a fifth wave in play, $BTC has room to push above $63K as long as $60K holds with real conviction. Piling in right at the level is how people get trapped when it retests.
Wait for the hold plus a higher low and rising volume before scaling in. Keep invalidation tight below the recent swing so one failed wave does not wreck the position. $ETH and $SOL usually follow these $BTC structures, so the same confirmation often shows up there too. Map partial targets near $63K instead of hoping it just keeps going.
Where do you think this fifth wave actually takes us from here?
#Bitcoin #ElliottWave #CryptoTrading
Traders keep FOMO buying these reclaims and then getting chopped on the pullback because they never wait for confirmation. Most have no defined exit and end up missing the real entry or giving back gains.
The reclaim itself is not the story. If this is a fifth wave in play, $BTC has room to push above $63K as long as $60K holds with real conviction. Piling in right at the level is how people get trapped when it retests.
Wait for the hold plus a higher low and rising volume before scaling in. Keep invalidation tight below the recent swing so one failed wave does not wreck the position. $ETH and $SOL usually follow these $BTC structures, so the same confirmation often shows up there too. Map partial targets near $63K instead of hoping it just keeps going.
Where do you think this fifth wave actually takes us from here?
#Bitcoin #ElliottWave #CryptoTrading
45

🚨 $GOLD BLEEDING INTO MAJOR SUPPORT AS ELLIOTT WAVE STRUCTURE NEARS ITS FINAL FLUSH 💥
Entry: 3,900 ⚡
Target: 5,100 🚀
The macro landscape is throwing heavy punches with stubborn inflation and a firm dollar keeping momentum pinned inside a descending channel. 📊 Yet price is pressing hard against the lower boundary where institutional bids typically wait to absorb the flush. 🌊
Whether we get one final sweep toward lower supports or a direct reclaim of psychological levels, the multi-year risk-to-reward ratio is quietly tilting back in favor of patient capital. 💡 Are you scaling in here or waiting to see if lower demand zones give way? 👇
⚠️ Not financial advice. Always manage your risk. 🛡️
🏷️ #GOLD #Commodities #ElliottWave #MarketStructure
🔥 💎
🚨 $GOLD BLEEDING INTO MAJOR SUPPORT AS ELLIOTT WAVE STRUCTURE NEARS ITS FINAL FLUSH 💥
Entry: 3,900 ⚡
Target: 5,100 🚀
The macro landscape is throwing heavy punches with stubborn inflation and a firm dollar keeping momentum pinned inside a descending channel. 📊 Yet price is pressing hard against the lower boundary where institutional bids typically wait to absorb the flush. 🌊
Whether we get one final sweep toward lower supports or a direct reclaim of psychological levels, the multi-year risk-to-reward ratio is quietly tilting back in favor of patient capital. 💡 Are you scaling in here or waiting to see if lower demand zones give way? 👇
⚠️ Not financial advice. Always manage your risk. 🛡️
🏷️ #GOLD #Commodities #ElliottWave #MarketStructure
🔥 💎
Entry: 3,900 ⚡
Target: 5,100 🚀
The macro landscape is throwing heavy punches with stubborn inflation and a firm dollar keeping momentum pinned inside a descending channel. 📊 Yet price is pressing hard against the lower boundary where institutional bids typically wait to absorb the flush. 🌊
Whether we get one final sweep toward lower supports or a direct reclaim of psychological levels, the multi-year risk-to-reward ratio is quietly tilting back in favor of patient capital. 💡 Are you scaling in here or waiting to see if lower demand zones give way? 👇
⚠️ Not financial advice. Always manage your risk. 🛡️
🏷️ #GOLD #Commodities #ElliottWave #MarketStructure
🔥 💎
7
·
--
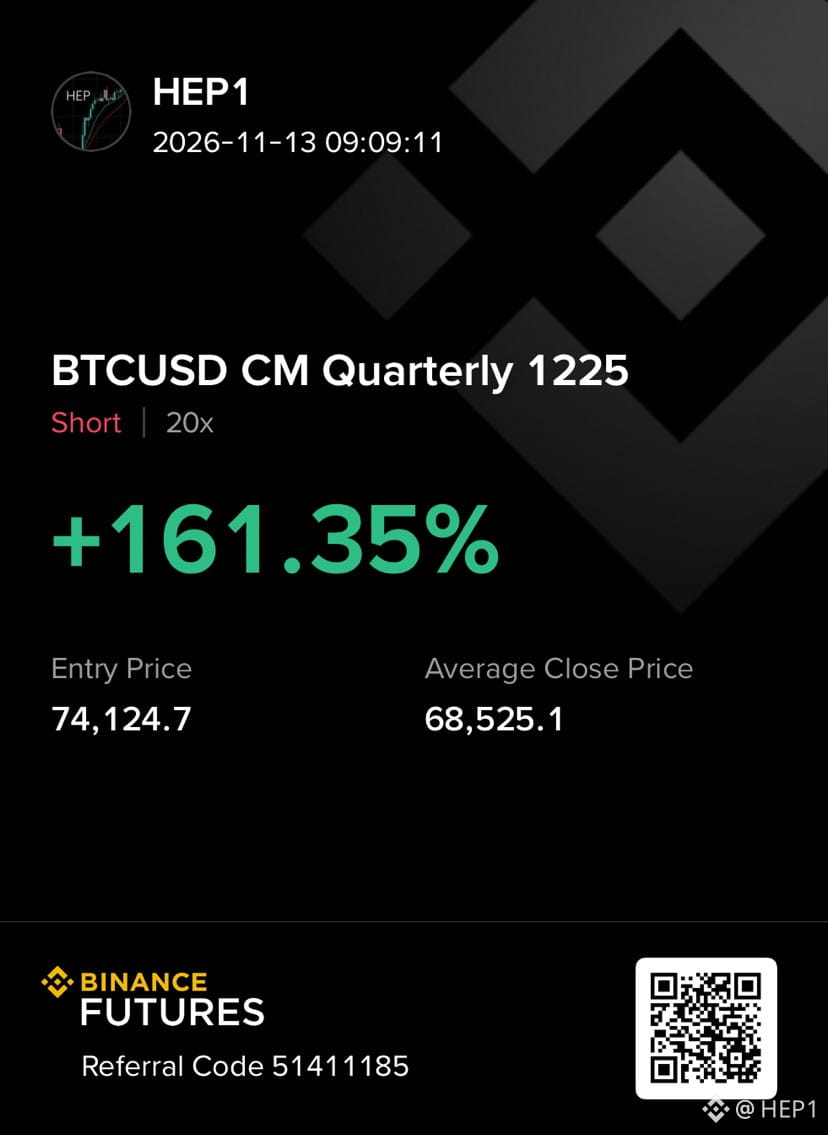
$BTC Clean short setup executed! 📉 Spotted an extended Wave C on the previos Elliott Wave count and capitalized on the downside momentum. I took advantage of it #Elliottwave #cryptotrading #ShortSetupb #ElliottWaveTheory #BinanceSquare
$BTC Clean short setup executed! 📉 Spotted an extended Wave C on the previos Elliott Wave count and capitalized on the downside momentum. I took advantage of it #Elliottwave #cryptotrading #ShortSetupb #ElliottWaveTheory #BinanceSquare
HEP1
·
--
BearishUpdate
Bearish bias remains. The previous bullish count failed below 74,811; the new low is 73,333. The prior short signal occurred, but TP 73,000 remains unreached.
#BTC #ElliottWaveTheory #elliotwave #TechnicalAnalys
Bearish bias remains. The previous bullish count failed below 74,811; the new low is 73,333. The prior short signal occurred, but TP 73,000 remains unreached.
#BTC #ElliottWaveTheory #elliotwave #TechnicalAnalys
1
108
·
--
Article
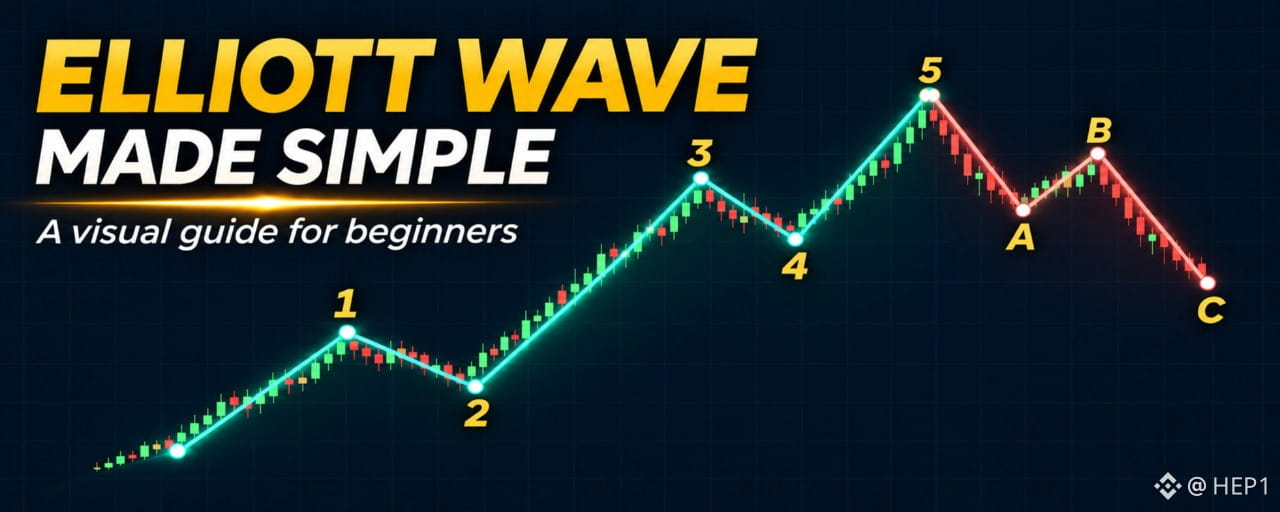
Elliott Wave Analysis: A Beginner’s Guide🌊 Elliott Wave Made Simple: Read the Structure, Understand the Crowd
Why do markets rally, pull back, and rally again? Elliott Wave Analysis interprets these swings through recurring price patterns and crowd psychology.
Ralph Nelson Elliott developed the idea in the 1930s, studying stock markets. Traders now apply it to crypto too. Check The Binance Academy "Introduction to Elliott Wave Theory"
1️⃣ Learn the basic structure
Think of a bullish sequence as five waves advancing, followed by a correction.
🟢 1, 3, 5: move forward.
↩️ 2, 4: pull back.
🔴 A, B, C: illustrate a simple zigzag correction.
Larger waves contain smaller waves. In a standard impulse, the internal structure is 5–3–5–3–5, with “3” representing corrective structure. Corrections can also form flats, triangles, and combinations.
2️⃣ Understand the crowd 🧠
The labels describe price structure; the personalities help explain the story behind it.
These are tendencies, not a fixed script. Excitement alone cannot identify wave 5, and fear alone cannot identify wave C.
3️⃣ Three rules to remember 📋
A convincing story still needs a valid structure. Each red example below shows a broken rule.
Standard impulse ruleIn a bullish exampleWave 2 cannot fully retrace wave 1.It stays above wave 1’s starting low.Wave 3 cannot be shortest among 1, 3, and 5.Compare price distances, not duration.Wave 4 cannot overlap wave 1’s territory.It stays above wave 1’s high.
If a rule breaks, reconsider the count. Diagonals are a separate structure with different overlap rules. Consult StockCharts "Identifying Elliott Wave Patterns".
4️⃣ Where does Fibonacci fit? 📐
Fibonacci helps mark possible reaction zones.
If wave 1 rises from $100 to $120, a 61.8% retracement is:
$120 − ($20 × 0.618) = $107.64
That is a zone to investigate—not an automatic buy.
Retracements measure pullbacks; extensions project possible future distances. Common Fibonacci ratios include 38.2%, 61.8%, and 161.8%. The popular 50% level is not itself a Fibonacci ratio.
5️⃣ Example: a possible wave 2 ending 🔍
Look for several clues to agree.
✅ The count respects the rules.
✅ Price reacts near support and a Fibonacci zone.
✅ RSI or MACD shows improving momentum.
✅ A hammer or bullish engulfing candle is followed by price strength.
In this hypothetical example, a move below $100 invalidates the proposed bullish wave 2 count. Agreement supports a scenario; it cannot guarantee wave 3.
6️⃣ Example: a possible wave 5 warning ⚠️
A new price high can hide weakening momentum.
Higher price high + lower RSI high = bearish divergence.
A shooting star or bearish engulfing pattern near resistance may add evidence. Watch for bearish follow-through and a break of nearby support. Divergence can persist, and wave 5 can extend. Consult the Binance Academy "How to Read the Most Popular Candlestick Patterns"
📝 Your beginner checklist
Structure → Rules → Fibonacci zone → Momentum → Candle confirmation → Risk plan
Start on a higher timeframe, keep an alternative count, and mark what would invalidate your idea.
Use waves to organize scenarios. Let price test them.
Educational only. Wave counts are subjective, and no pattern guarantees the next move.
#ElliottWave #CryptoEducation #TechnicalAnalysis #TradingPsychology #ElliottWaveTheory
Elliott Wave Analysis: A Beginner’s Guide
🌊 Elliott Wave Made Simple: Read the Structure, Understand the Crowd
Why do markets rally, pull back, and rally again? Elliott Wave Analysis interprets these swings through recurring price patterns and crowd psychology.
Ralph Nelson Elliott developed the idea in the 1930s, studying stock markets. Traders now apply it to crypto too. Check The Binance Academy "Introduction to Elliott Wave Theory"
1️⃣ Learn the basic structure
Think of a bullish sequence as five waves advancing, followed by a correction.
🟢 1, 3, 5: move forward.
↩️ 2, 4: pull back.
🔴 A, B, C: illustrate a simple zigzag correction.
Larger waves contain smaller waves. In a standard impulse, the internal structure is 5–3–5–3–5, with “3” representing corrective structure. Corrections can also form flats, triangles, and combinations.
2️⃣ Understand the crowd 🧠
The labels describe price structure; the personalities help explain the story behind it.
These are tendencies, not a fixed script. Excitement alone cannot identify wave 5, and fear alone cannot identify wave C.
3️⃣ Three rules to remember 📋
A convincing story still needs a valid structure. Each red example below shows a broken rule.
Standard impulse ruleIn a bullish exampleWave 2 cannot fully retrace wave 1.It stays above wave 1’s starting low.Wave 3 cannot be shortest among 1, 3, and 5.Compare price distances, not duration.Wave 4 cannot overlap wave 1’s territory.It stays above wave 1’s high.
If a rule breaks, reconsider the count. Diagonals are a separate structure with different overlap rules. Consult StockCharts "Identifying Elliott Wave Patterns".
4️⃣ Where does Fibonacci fit? 📐
Fibonacci helps mark possible reaction zones.
If wave 1 rises from $100 to $120, a 61.8% retracement is:
$120 − ($20 × 0.618) = $107.64
That is a zone to investigate—not an automatic buy.
Retracements measure pullbacks; extensions project possible future distances. Common Fibonacci ratios include 38.2%, 61.8%, and 161.8%. The popular 50% level is not itself a Fibonacci ratio.
5️⃣ Example: a possible wave 2 ending 🔍
Look for several clues to agree.
✅ The count respects the rules.
✅ Price reacts near support and a Fibonacci zone.
✅ RSI or MACD shows improving momentum.
✅ A hammer or bullish engulfing candle is followed by price strength.
In this hypothetical example, a move below $100 invalidates the proposed bullish wave 2 count. Agreement supports a scenario; it cannot guarantee wave 3.
6️⃣ Example: a possible wave 5 warning ⚠️
A new price high can hide weakening momentum.
Higher price high + lower RSI high = bearish divergence.
A shooting star or bearish engulfing pattern near resistance may add evidence. Watch for bearish follow-through and a break of nearby support. Divergence can persist, and wave 5 can extend. Consult the Binance Academy "How to Read the Most Popular Candlestick Patterns"
📝 Your beginner checklist
Structure → Rules → Fibonacci zone → Momentum → Candle confirmation → Risk plan
Start on a higher timeframe, keep an alternative count, and mark what would invalidate your idea.
Use waves to organize scenarios. Let price test them.
Educational only. Wave counts are subjective, and no pattern guarantees the next move.
#ElliottWave #CryptoEducation #TechnicalAnalysis #TradingPsychology #ElliottWaveTheory
Why do markets rally, pull back, and rally again? Elliott Wave Analysis interprets these swings through recurring price patterns and crowd psychology.
Ralph Nelson Elliott developed the idea in the 1930s, studying stock markets. Traders now apply it to crypto too. Check The Binance Academy "Introduction to Elliott Wave Theory"
1️⃣ Learn the basic structure
Think of a bullish sequence as five waves advancing, followed by a correction.
🟢 1, 3, 5: move forward.
↩️ 2, 4: pull back.
🔴 A, B, C: illustrate a simple zigzag correction.
Larger waves contain smaller waves. In a standard impulse, the internal structure is 5–3–5–3–5, with “3” representing corrective structure. Corrections can also form flats, triangles, and combinations.
2️⃣ Understand the crowd 🧠
The labels describe price structure; the personalities help explain the story behind it.
These are tendencies, not a fixed script. Excitement alone cannot identify wave 5, and fear alone cannot identify wave C.
3️⃣ Three rules to remember 📋
A convincing story still needs a valid structure. Each red example below shows a broken rule.
Standard impulse ruleIn a bullish exampleWave 2 cannot fully retrace wave 1.It stays above wave 1’s starting low.Wave 3 cannot be shortest among 1, 3, and 5.Compare price distances, not duration.Wave 4 cannot overlap wave 1’s territory.It stays above wave 1’s high.
If a rule breaks, reconsider the count. Diagonals are a separate structure with different overlap rules. Consult StockCharts "Identifying Elliott Wave Patterns".
4️⃣ Where does Fibonacci fit? 📐
Fibonacci helps mark possible reaction zones.
If wave 1 rises from $100 to $120, a 61.8% retracement is:
$120 − ($20 × 0.618) = $107.64
That is a zone to investigate—not an automatic buy.
Retracements measure pullbacks; extensions project possible future distances. Common Fibonacci ratios include 38.2%, 61.8%, and 161.8%. The popular 50% level is not itself a Fibonacci ratio.
5️⃣ Example: a possible wave 2 ending 🔍
Look for several clues to agree.
✅ The count respects the rules.
✅ Price reacts near support and a Fibonacci zone.
✅ RSI or MACD shows improving momentum.
✅ A hammer or bullish engulfing candle is followed by price strength.
In this hypothetical example, a move below $100 invalidates the proposed bullish wave 2 count. Agreement supports a scenario; it cannot guarantee wave 3.
6️⃣ Example: a possible wave 5 warning ⚠️
A new price high can hide weakening momentum.
Higher price high + lower RSI high = bearish divergence.
A shooting star or bearish engulfing pattern near resistance may add evidence. Watch for bearish follow-through and a break of nearby support. Divergence can persist, and wave 5 can extend. Consult the Binance Academy "How to Read the Most Popular Candlestick Patterns"
📝 Your beginner checklist
Structure → Rules → Fibonacci zone → Momentum → Candle confirmation → Risk plan
Start on a higher timeframe, keep an alternative count, and mark what would invalidate your idea.
Use waves to organize scenarios. Let price test them.
Educational only. Wave counts are subjective, and no pattern guarantees the next move.
#ElliottWave #CryptoEducation #TechnicalAnalysis #TradingPsychology #ElliottWaveTheory
1
76

·
--
🚨 $BTC PREPARES TO LAUNCH WAVE FIVE AFTER FLAWLESS SUPPORT DEFENSE! 💥
Entry: 79,000 – 79,100 ⚡
Target: 80,000 - 82,500 🚀
Stop Loss: 77,500 ⚠️
The hourly structure on $BTC is flashing a textbook Wave 4 completion after buyers cleanly defended the 77.8K liquidity pocket. 📊 Order flow is shifting back to the upside as momentum builds for a push into higher expansion targets.
📌 Reclaiming the 79.5K to 80K region triggers the real wave velocity toward 82.5K. ⚡ As long as 77.5K holds structural integrity, the risk profile heavily favors early momentum buyers. 💬 Are you loading long position entries on this flip or waiting for 80K confirmation? 👇
⚠️ Not financial advice. Always manage your risk. 🛡️
🏷️ #BTC #LongSetup #ElliottWave #CryptoTrading
⚡ 🎯
🚨 $BTC PREPARES TO LAUNCH WAVE FIVE AFTER FLAWLESS SUPPORT DEFENSE! 💥
Entry: 79,000 – 79,100 ⚡
Target: 80,000 - 82,500 🚀
Stop Loss: 77,500 ⚠️
The hourly structure on $BTC is flashing a textbook Wave 4 completion after buyers cleanly defended the 77.8K liquidity pocket. 📊 Order flow is shifting back to the upside as momentum builds for a push into higher expansion targets.
📌 Reclaiming the 79.5K to 80K region triggers the real wave velocity toward 82.5K. ⚡ As long as 77.5K holds structural integrity, the risk profile heavily favors early momentum buyers. 💬 Are you loading long position entries on this flip or waiting for 80K confirmation? 👇
⚠️ Not financial advice. Always manage your risk. 🛡️
🏷️ #BTC #LongSetup #ElliottWave #CryptoTrading
⚡ 🎯
Entry: 79,000 – 79,100 ⚡
Target: 80,000 - 82,500 🚀
Stop Loss: 77,500 ⚠️
The hourly structure on $BTC is flashing a textbook Wave 4 completion after buyers cleanly defended the 77.8K liquidity pocket. 📊 Order flow is shifting back to the upside as momentum builds for a push into higher expansion targets.
📌 Reclaiming the 79.5K to 80K region triggers the real wave velocity toward 82.5K. ⚡ As long as 77.5K holds structural integrity, the risk profile heavily favors early momentum buyers. 💬 Are you loading long position entries on this flip or waiting for 80K confirmation? 👇
⚠️ Not financial advice. Always manage your risk. 🛡️
🏷️ #BTC #LongSetup #ElliottWave #CryptoTrading
⚡ 🎯
14

·
--
🚨 $XRP PREPARED FOR WAVE 3 SURGE TOWARD $2‑$3 💥
Entry: 1.25 ⚡
Target: 1.45 🚀
Stop Loss: 0.99 ⚠️
📊 XForceGlobal spots XRP perched just above the 61.8‑78.6% Fibonacci corridor, a classic Elliott Wave‑2 corrective pocket. The current dip is feeding liquidity, setting the stage for a potent Wave 3 impulse that could vault the token toward the $2‑$3 horizon. 📈 A decisive hold above the $1.10‑$1.22 buy zone would validate the bullish count, while a breach of $0.99 would nullify the setup. 🌊 Institutional order flow often respects these fib zones, making the next leg a high‑conviction play.
💬 Do you see the Wave 3 catalyst materializing before the next liquidity sweep? 👇
⚠️ Not financial advice. Always manage your risk. 🛡️
🏷️ #XRP #ElliottWave #LongSetup #Crypto
🔥 💎
🚨 $XRP PREPARED FOR WAVE 3 SURGE TOWARD $2‑$3 💥
Entry: 1.25 ⚡
Target: 1.45 🚀
Stop Loss: 0.99 ⚠️
📊 XForceGlobal spots XRP perched just above the 61.8‑78.6% Fibonacci corridor, a classic Elliott Wave‑2 corrective pocket. The current dip is feeding liquidity, setting the stage for a potent Wave 3 impulse that could vault the token toward the $2‑$3 horizon. 📈 A decisive hold above the $1.10‑$1.22 buy zone would validate the bullish count, while a breach of $0.99 would nullify the setup. 🌊 Institutional order flow often respects these fib zones, making the next leg a high‑conviction play.
💬 Do you see the Wave 3 catalyst materializing before the next liquidity sweep? 👇
⚠️ Not financial advice. Always manage your risk. 🛡️
🏷️ #XRP #ElliottWave #LongSetup #Crypto
🔥 💎
Entry: 1.25 ⚡
Target: 1.45 🚀
Stop Loss: 0.99 ⚠️
📊 XForceGlobal spots XRP perched just above the 61.8‑78.6% Fibonacci corridor, a classic Elliott Wave‑2 corrective pocket. The current dip is feeding liquidity, setting the stage for a potent Wave 3 impulse that could vault the token toward the $2‑$3 horizon. 📈 A decisive hold above the $1.10‑$1.22 buy zone would validate the bullish count, while a breach of $0.99 would nullify the setup. 🌊 Institutional order flow often respects these fib zones, making the next leg a high‑conviction play.
💬 Do you see the Wave 3 catalyst materializing before the next liquidity sweep? 👇
⚠️ Not financial advice. Always manage your risk. 🛡️
🏷️ #XRP #ElliottWave #LongSetup #Crypto
🔥 💎
22

🚀 $XRP ON THE CUSP OF A $2‑$3 WAVE 3 SURGE? 📈
XForceGlobal spots XRP perched just above a deep Fibonacci zone, the 61.8‑78.6% retracement that cradles $1.10‑$1.22. The analyst reads the recent 4.3% weekly dip as a classic Wave 2 correction, priming the market for a potent Wave 3 impulse. 📊 If buyers hold the buy‑zone, the next leg could sprint toward $1.40‑$1.45 and beyond.
But the chart still leaves room for a deeper slide to $1.15‑$1.20 before the rally ignites, and a break below $0.98‑$1.00 would wipe the bullish case. ⚡ Keep an eye on order flow; a decisive bounce off that support could flip the sentiment overnight. 🔍
💬 Who's positioning for the Wave 3 breakout if XRP clears $1.40? 👇
⚠️ Not financial advice. Always manage your risk. 🛡️
🏷️ #XRP #LongSetup #ElliottWave #Crypto
🚀 ⚡
🚀 $XRP ON THE CUSP OF A $2‑$3 WAVE 3 SURGE? 📈
XForceGlobal spots XRP perched just above a deep Fibonacci zone, the 61.8‑78.6% retracement that cradles $1.10‑$1.22. The analyst reads the recent 4.3% weekly dip as a classic Wave 2 correction, priming the market for a potent Wave 3 impulse. 📊 If buyers hold the buy‑zone, the next leg could sprint toward $1.40‑$1.45 and beyond.
But the chart still leaves room for a deeper slide to $1.15‑$1.20 before the rally ignites, and a break below $0.98‑$1.00 would wipe the bullish case. ⚡ Keep an eye on order flow; a decisive bounce off that support could flip the sentiment overnight. 🔍
💬 Who's positioning for the Wave 3 breakout if XRP clears $1.40? 👇
⚠️ Not financial advice. Always manage your risk. 🛡️
🏷️ #XRP #LongSetup #ElliottWave #Crypto
🚀 ⚡
XForceGlobal spots XRP perched just above a deep Fibonacci zone, the 61.8‑78.6% retracement that cradles $1.10‑$1.22. The analyst reads the recent 4.3% weekly dip as a classic Wave 2 correction, priming the market for a potent Wave 3 impulse. 📊 If buyers hold the buy‑zone, the next leg could sprint toward $1.40‑$1.45 and beyond.
But the chart still leaves room for a deeper slide to $1.15‑$1.20 before the rally ignites, and a break below $0.98‑$1.00 would wipe the bullish case. ⚡ Keep an eye on order flow; a decisive bounce off that support could flip the sentiment overnight. 🔍
💬 Who's positioning for the Wave 3 breakout if XRP clears $1.40? 👇
⚠️ Not financial advice. Always manage your risk. 🛡️
🏷️ #XRP #LongSetup #ElliottWave #Crypto
🚀 ⚡
21
🚨 $ETH AGGRESSIVE THIRD WAVE BREAKDOWN UNLOCKS TARGETS TOWARD 1,832 📉
Entry: 2,240 ⚡
Target: 1,832 🎯
Sellers have seized complete control as $ETH slices through local structure, tracking an aggressive Elliott Wave C extension after dropping 20% from the September peak. 📊 Momentum oscillators are buried deep in bear territory, with Bull/Bear Power collapsing to -187.7 and daily RSI sliding under 30.
The line in the sand sits at 2,292, keeping the intermediate trend firmly suppressed while price tests the critical 2,170 liquidity shelf. 💡 If buyers fail to absorb supply here, the door swings wide open for a sweep down into the 1,832 to 2,069 target pocket.
💬 Are you bidding this relief bounce or waiting for capitulation under 2,000? 👇
⚠️ Not financial advice. Always manage your risk. 🛡️
🏷️ #ETH #Ethereum #CryptoTrading #ElliottWave
🎯 🦈
🚨 $ETH AGGRESSIVE THIRD WAVE BREAKDOWN UNLOCKS TARGETS TOWARD 1,832 📉
Entry: 2,240 ⚡
Target: 1,832 🎯
Sellers have seized complete control as $ETH slices through local structure, tracking an aggressive Elliott Wave C extension after dropping 20% from the September peak. 📊 Momentum oscillators are buried deep in bear territory, with Bull/Bear Power collapsing to -187.7 and daily RSI sliding under 30.
The line in the sand sits at 2,292, keeping the intermediate trend firmly suppressed while price tests the critical 2,170 liquidity shelf. 💡 If buyers fail to absorb supply here, the door swings wide open for a sweep down into the 1,832 to 2,069 target pocket.
💬 Are you bidding this relief bounce or waiting for capitulation under 2,000? 👇
⚠️ Not financial advice. Always manage your risk. 🛡️
🏷️ #ETH #Ethereum #CryptoTrading #ElliottWave
🎯 🦈
Entry: 2,240 ⚡
Target: 1,832 🎯
Sellers have seized complete control as $ETH slices through local structure, tracking an aggressive Elliott Wave C extension after dropping 20% from the September peak. 📊 Momentum oscillators are buried deep in bear territory, with Bull/Bear Power collapsing to -187.7 and daily RSI sliding under 30.
The line in the sand sits at 2,292, keeping the intermediate trend firmly suppressed while price tests the critical 2,170 liquidity shelf. 💡 If buyers fail to absorb supply here, the door swings wide open for a sweep down into the 1,832 to 2,069 target pocket.
💬 Are you bidding this relief bounce or waiting for capitulation under 2,000? 👇
⚠️ Not financial advice. Always manage your risk. 🛡️
🏷️ #ETH #Ethereum #CryptoTrading #ElliottWave
🎯 🦈
10


𝐒𝐓𝐎𝐏..... 𝐒𝐓𝐎𝐏..... 𝐒𝐓𝐎𝐏 🚨
$BTC THE NEXT LEG UP COULD BE CLOSER THAN YOU THINK! 💹
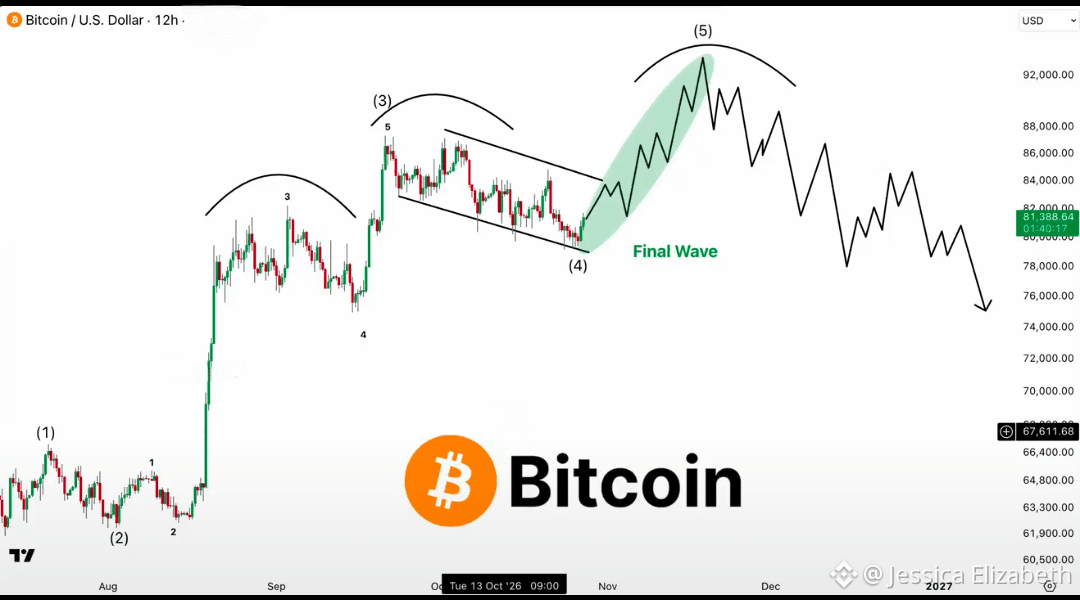
Bitcoin’s current consolidation could be forming Wave 4 before one final impulsive move higher.
If this Elliott Wave structure plays out, Wave 5 could be the next major move to watch. 👀
🔥 My upside roadmap:
🎯 $85K → $90K → $93K
But there’s one important condition: BTC must break out of the descending channel and show clear buying strength.
Until that breakout happens, this remains an alternative bullish scenario — not a confirmed move.
No breakout, no confirmation. Patience over FOMO. 🧠
I’ll keep watching the price action and update you when the structure changes.
FOLLOW + TURN ON NOTIFICATIONS! 🔔
#BTC #Bitcoin #CryptoMarket #CryptoTrading #ElliottWave #FOMCWatch #EarningsSeason
𝐒𝐓𝐎𝐏..... 𝐒𝐓𝐎𝐏..... 𝐒𝐓𝐎𝐏 🚨
$BTC THE NEXT LEG UP COULD BE CLOSER THAN YOU THINK! 💹
Bitcoin’s current consolidation could be forming Wave 4 before one final impulsive move higher.
If this Elliott Wave structure plays out, Wave 5 could be the next major move to watch. 👀
🔥 My upside roadmap:
🎯 $85K → $90K → $93K
But there’s one important condition: BTC must break out of the descending channel and show clear buying strength.
Until that breakout happens, this remains an alternative bullish scenario — not a confirmed move.
No breakout, no confirmation. Patience over FOMO. 🧠
I’ll keep watching the price action and update you when the structure changes.
FOLLOW + TURN ON NOTIFICATIONS! 🔔
#BTC #Bitcoin #CryptoMarket #CryptoTrading #ElliottWave #FOMCWatch #EarningsSeason
$BTC THE NEXT LEG UP COULD BE CLOSER THAN YOU THINK! 💹
Bitcoin’s current consolidation could be forming Wave 4 before one final impulsive move higher.
If this Elliott Wave structure plays out, Wave 5 could be the next major move to watch. 👀
🔥 My upside roadmap:
🎯 $85K → $90K → $93K
But there’s one important condition: BTC must break out of the descending channel and show clear buying strength.
Until that breakout happens, this remains an alternative bullish scenario — not a confirmed move.
No breakout, no confirmation. Patience over FOMO. 🧠
I’ll keep watching the price action and update you when the structure changes.
FOLLOW + TURN ON NOTIFICATIONS! 🔔
#BTC #Bitcoin #CryptoMarket #CryptoTrading #ElliottWave #FOMCWatch #EarningsSeason
3
2
2.3k

·
--
🚀 $XRP ELLIOTT WAVE BULL RUN MAY UNLOCK $3 TARGET! 📈
📊 XRP is perched around $1.33, flirting with the 50‑61.8% Fib zone (≈$1.25‑$1.30). If that band holds, the Wave 2 bottom stays alive and the bullish count stays in play. 🔍 A decisive break above $1.50, then the cluster high at $1.60‑$1.65, would flip the narrative from “correction” to “impulse” in seconds.
⚡ From there the five‑wave script points to a Wave 3 surge toward $2.60‑$2.70, a pullback around $2.15, and a final push to the $3‑plus horizon. The structure is disciplined, not hype‑driven. 💬 Will you stack bids as XRP eyes the $1.65 breakout? 👇
⚠️ Not financial advice. Always manage your risk. 🛡️
🏷️ #XRP #ElliottWave #BullishSetup #Crypto
🔥 💎
🚀 $XRP ELLIOTT WAVE BULL RUN MAY UNLOCK $3 TARGET! 📈
📊 XRP is perched around $1.33, flirting with the 50‑61.8% Fib zone (≈$1.25‑$1.30). If that band holds, the Wave 2 bottom stays alive and the bullish count stays in play. 🔍 A decisive break above $1.50, then the cluster high at $1.60‑$1.65, would flip the narrative from “correction” to “impulse” in seconds.
⚡ From there the five‑wave script points to a Wave 3 surge toward $2.60‑$2.70, a pullback around $2.15, and a final push to the $3‑plus horizon. The structure is disciplined, not hype‑driven. 💬 Will you stack bids as XRP eyes the $1.65 breakout? 👇
⚠️ Not financial advice. Always manage your risk. 🛡️
🏷️ #XRP #ElliottWave #BullishSetup #Crypto
🔥 💎
📊 XRP is perched around $1.33, flirting with the 50‑61.8% Fib zone (≈$1.25‑$1.30). If that band holds, the Wave 2 bottom stays alive and the bullish count stays in play. 🔍 A decisive break above $1.50, then the cluster high at $1.60‑$1.65, would flip the narrative from “correction” to “impulse” in seconds.
⚡ From there the five‑wave script points to a Wave 3 surge toward $2.60‑$2.70, a pullback around $2.15, and a final push to the $3‑plus horizon. The structure is disciplined, not hype‑driven. 💬 Will you stack bids as XRP eyes the $1.65 breakout? 👇
⚠️ Not financial advice. Always manage your risk. 🛡️
🏷️ #XRP #ElliottWave #BullishSetup #Crypto
🔥 💎
26

·
--
🚨 $XRP ELLIOTT WAVE BOTTOM TEST MAY UNLOCK $3 PLAY 🦈
Entry: 1.33 ⚡
Target: 1.60 🚀
Stop Loss: 1.25 ⚠️
XForceGlobal’s Elliott Wave count spots a potential Wave 2 bottom in the 1.25‑1.30 Fibonacci zone, keeping the bullish narrative alive. 📊 The price hovering near $1.33 respects that retracement, hinting that the corrective leg may be ending.
A clean break above the 1.60‑1.65 cluster would ignite Wave 3, targeting the 2.60‑2.70 corridor and eventually the $3 horizon. ⚡ Institutional liquidity pools often defend these pivot zones, so a decisive push could trigger a smart‑money surge. 🌊
💬 Do you see the next impulse forming now or waiting for a stronger breakout? 👇
⚠️ Not financial advice. Always manage your risk. 🛡️
🏷️ #XRP #LongSetup #ElliottWave #Crypto
🔥 💎
🚨 $XRP ELLIOTT WAVE BOTTOM TEST MAY UNLOCK $3 PLAY 🦈
Entry: 1.33 ⚡
Target: 1.60 🚀
Stop Loss: 1.25 ⚠️
XForceGlobal’s Elliott Wave count spots a potential Wave 2 bottom in the 1.25‑1.30 Fibonacci zone, keeping the bullish narrative alive. 📊 The price hovering near $1.33 respects that retracement, hinting that the corrective leg may be ending.
A clean break above the 1.60‑1.65 cluster would ignite Wave 3, targeting the 2.60‑2.70 corridor and eventually the $3 horizon. ⚡ Institutional liquidity pools often defend these pivot zones, so a decisive push could trigger a smart‑money surge. 🌊
💬 Do you see the next impulse forming now or waiting for a stronger breakout? 👇
⚠️ Not financial advice. Always manage your risk. 🛡️
🏷️ #XRP #LongSetup #ElliottWave #Crypto
🔥 💎
Entry: 1.33 ⚡
Target: 1.60 🚀
Stop Loss: 1.25 ⚠️
XForceGlobal’s Elliott Wave count spots a potential Wave 2 bottom in the 1.25‑1.30 Fibonacci zone, keeping the bullish narrative alive. 📊 The price hovering near $1.33 respects that retracement, hinting that the corrective leg may be ending.
A clean break above the 1.60‑1.65 cluster would ignite Wave 3, targeting the 2.60‑2.70 corridor and eventually the $3 horizon. ⚡ Institutional liquidity pools often defend these pivot zones, so a decisive push could trigger a smart‑money surge. 🌊
💬 Do you see the next impulse forming now or waiting for a stronger breakout? 👇
⚠️ Not financial advice. Always manage your risk. 🛡️
🏷️ #XRP #LongSetup #ElliottWave #Crypto
🔥 💎
14

·
--
🚨 $BTC UPDATE 🚨
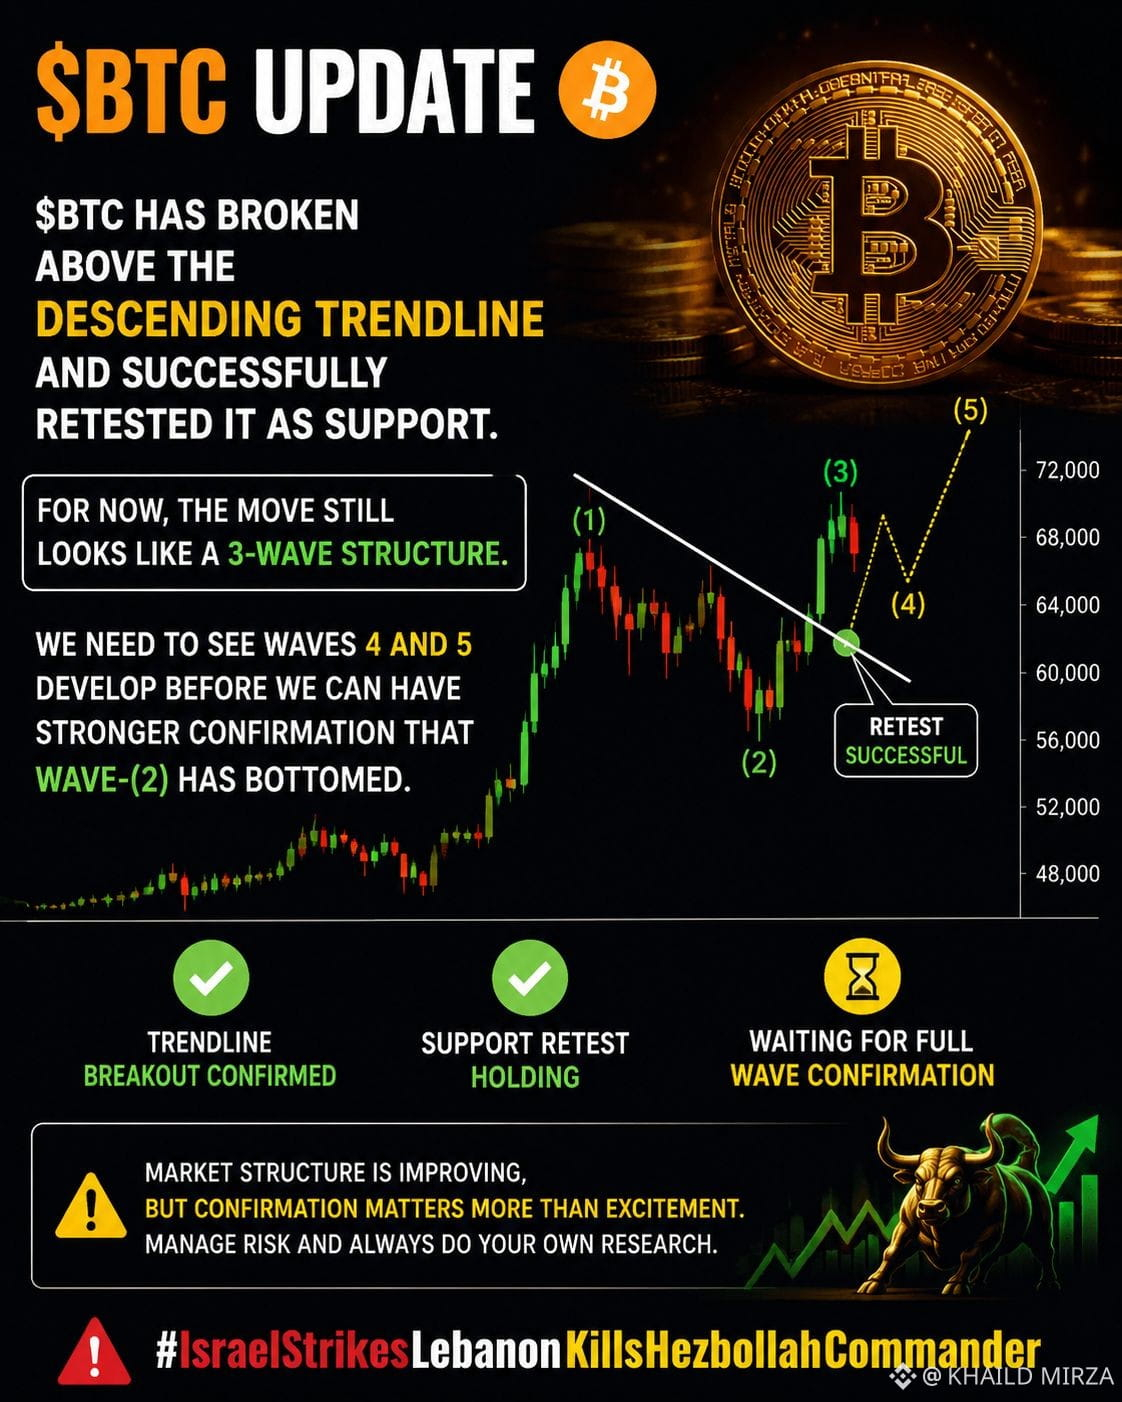
Bitcoin has successfully broken above the descending t and, more importantly, the retest has held as support. This is a positive sign for short-term momentum. 📈
However, the current move still appears to be developing as a 3-wave structure. We need to see Wave 4 and Wave 5 complete before getting stronger confirmation that Wave (2) has officially bottomed.
The key now is patience: ✅ breakout confirmed
✅ Support retest holding
⏳ Waiting for full wave confirmation
Market structure is improving, but confirmation matters more than excitement. Manage risk and always do your own research.
#BTC #Bitcoin #Crypto #Trading #ElliottWave
{spot}(BTCUSDT)
🚨 $BTC UPDATE 🚨
Bitcoin has successfully broken above the descending t and, more importantly, the retest has held as support. This is a positive sign for short-term momentum. 📈
However, the current move still appears to be developing as a 3-wave structure. We need to see Wave 4 and Wave 5 complete before getting stronger confirmation that Wave (2) has officially bottomed.
The key now is patience: ✅ breakout confirmed
✅ Support retest holding
⏳ Waiting for full wave confirmation
Market structure is improving, but confirmation matters more than excitement. Manage risk and always do your own research.
#BTC #Bitcoin #Crypto #Trading #ElliottWave
Bitcoin has successfully broken above the descending t and, more importantly, the retest has held as support. This is a positive sign for short-term momentum. 📈
However, the current move still appears to be developing as a 3-wave structure. We need to see Wave 4 and Wave 5 complete before getting stronger confirmation that Wave (2) has officially bottomed.
The key now is patience: ✅ breakout confirmed
✅ Support retest holding
⏳ Waiting for full wave confirmation
Market structure is improving, but confirmation matters more than excitement. Manage risk and always do your own research.
#BTC #Bitcoin #Crypto #Trading #ElliottWave
86
·
--
everyone thinks wave 4 pullback levels are set in stone from the start, but actually when wave 3 overextends, your entire invalidation zone shifts higher.
most traders keep their limit bids sitting at the old fib levels and end up completely front-run, or worse, they panic short thinking the trend broke. ngl getting chopped up because of stale pivot levels is the easiest way to bleed your stack.
we saw this exact setup play out on $BTC during the recent impulse. wave 3 pushed way past the standard 1.618 extension target, which automatically dragged the valid wave 4 support band several hundred dollars above where most people were waiting.
if you are still expecting a deep discount down to previous structural support on $ETH and the majors, you are likely trading yesterday's chart. extended third waves typically resolve into shallow, frustrating wave 4 consolidations that trap impatient capital on the sidelines.
where do you think this wave 4 bottom actually lands?
#CryptoTrading #ElliottWave #Bitcoin
everyone thinks wave 4 pullback levels are set in stone from the start, but actually when wave 3 overextends, your entire invalidation zone shifts higher.
most traders keep their limit bids sitting at the old fib levels and end up completely front-run, or worse, they panic short thinking the trend broke. ngl getting chopped up because of stale pivot levels is the easiest way to bleed your stack.
we saw this exact setup play out on $BTC during the recent impulse. wave 3 pushed way past the standard 1.618 extension target, which automatically dragged the valid wave 4 support band several hundred dollars above where most people were waiting.
if you are still expecting a deep discount down to previous structural support on $ETH and the majors, you are likely trading yesterday's chart. extended third waves typically resolve into shallow, frustrating wave 4 consolidations that trap impatient capital on the sidelines.
where do you think this wave 4 bottom actually lands?
#CryptoTrading #ElliottWave #Bitcoin
most traders keep their limit bids sitting at the old fib levels and end up completely front-run, or worse, they panic short thinking the trend broke. ngl getting chopped up because of stale pivot levels is the easiest way to bleed your stack.
we saw this exact setup play out on $BTC during the recent impulse. wave 3 pushed way past the standard 1.618 extension target, which automatically dragged the valid wave 4 support band several hundred dollars above where most people were waiting.
if you are still expecting a deep discount down to previous structural support on $ETH and the majors, you are likely trading yesterday's chart. extended third waves typically resolve into shallow, frustrating wave 4 consolidations that trap impatient capital on the sidelines.
where do you think this wave 4 bottom actually lands?
#CryptoTrading #ElliottWave #Bitcoin
36
A longer Wave 3 doesn't give you a safer Wave 4. It actually drops the danger zone lower and leaves more people holding bags they never planned for.
You've been staring at the same Fibonacci levels for days waiting to buy the dip. Then Wave 3 keeps running, the correction hits harder than your chart showed, and you're either stopped out early or sitting underwater while the real support is still lower.
When Wave 3 stretches past the typical 1.618 extension of Wave 1, the Wave 4 retracement almost never respects the original 38.2% level. Price usually hunts the 50% or 61.8% of the entire third wave, or it tags the previous fourth wave of lesser degree. I watched $BTC do this when the extra push in Wave 3 moved expected Wave 4 support from the 92k area down toward 84-86k. The same shift showed up on $ETH, where the deeper run forced a bigger pullback than most traders had marked. $SOL followed the identical pattern and flushed anyone still using the old zones.
If you don't redraw those levels after the extension, you're buying into a liquidity grab instead of a genuine Wave 4 bottom. That's how accounts get chopped during these corrections.
Where do you think the new Wave 4 support sits after this latest extension?
#ElliottWave #CryptoTrading #TechnicalAnalysis
A longer Wave 3 doesn't give you a safer Wave 4. It actually drops the danger zone lower and leaves more people holding bags they never planned for.
You've been staring at the same Fibonacci levels for days waiting to buy the dip. Then Wave 3 keeps running, the correction hits harder than your chart showed, and you're either stopped out early or sitting underwater while the real support is still lower.
When Wave 3 stretches past the typical 1.618 extension of Wave 1, the Wave 4 retracement almost never respects the original 38.2% level. Price usually hunts the 50% or 61.8% of the entire third wave, or it tags the previous fourth wave of lesser degree. I watched $BTC do this when the extra push in Wave 3 moved expected Wave 4 support from the 92k area down toward 84-86k. The same shift showed up on $ETH , where the deeper run forced a bigger pullback than most traders had marked. $SOL followed the identical pattern and flushed anyone still using the old zones.
If you don't redraw those levels after the extension, you're buying into a liquidity grab instead of a genuine Wave 4 bottom. That's how accounts get chopped during these corrections.
Where do you think the new Wave 4 support sits after this latest extension?
#ElliottWave #CryptoTrading #TechnicalAnalysis
You've been staring at the same Fibonacci levels for days waiting to buy the dip. Then Wave 3 keeps running, the correction hits harder than your chart showed, and you're either stopped out early or sitting underwater while the real support is still lower.
When Wave 3 stretches past the typical 1.618 extension of Wave 1, the Wave 4 retracement almost never respects the original 38.2% level. Price usually hunts the 50% or 61.8% of the entire third wave, or it tags the previous fourth wave of lesser degree. I watched $BTC do this when the extra push in Wave 3 moved expected Wave 4 support from the 92k area down toward 84-86k. The same shift showed up on $ETH , where the deeper run forced a bigger pullback than most traders had marked. $SOL followed the identical pattern and flushed anyone still using the old zones.
If you don't redraw those levels after the extension, you're buying into a liquidity grab instead of a genuine Wave 4 bottom. That's how accounts get chopped during these corrections.
Where do you think the new Wave 4 support sits after this latest extension?
#ElliottWave #CryptoTrading #TechnicalAnalysis
43
·
--
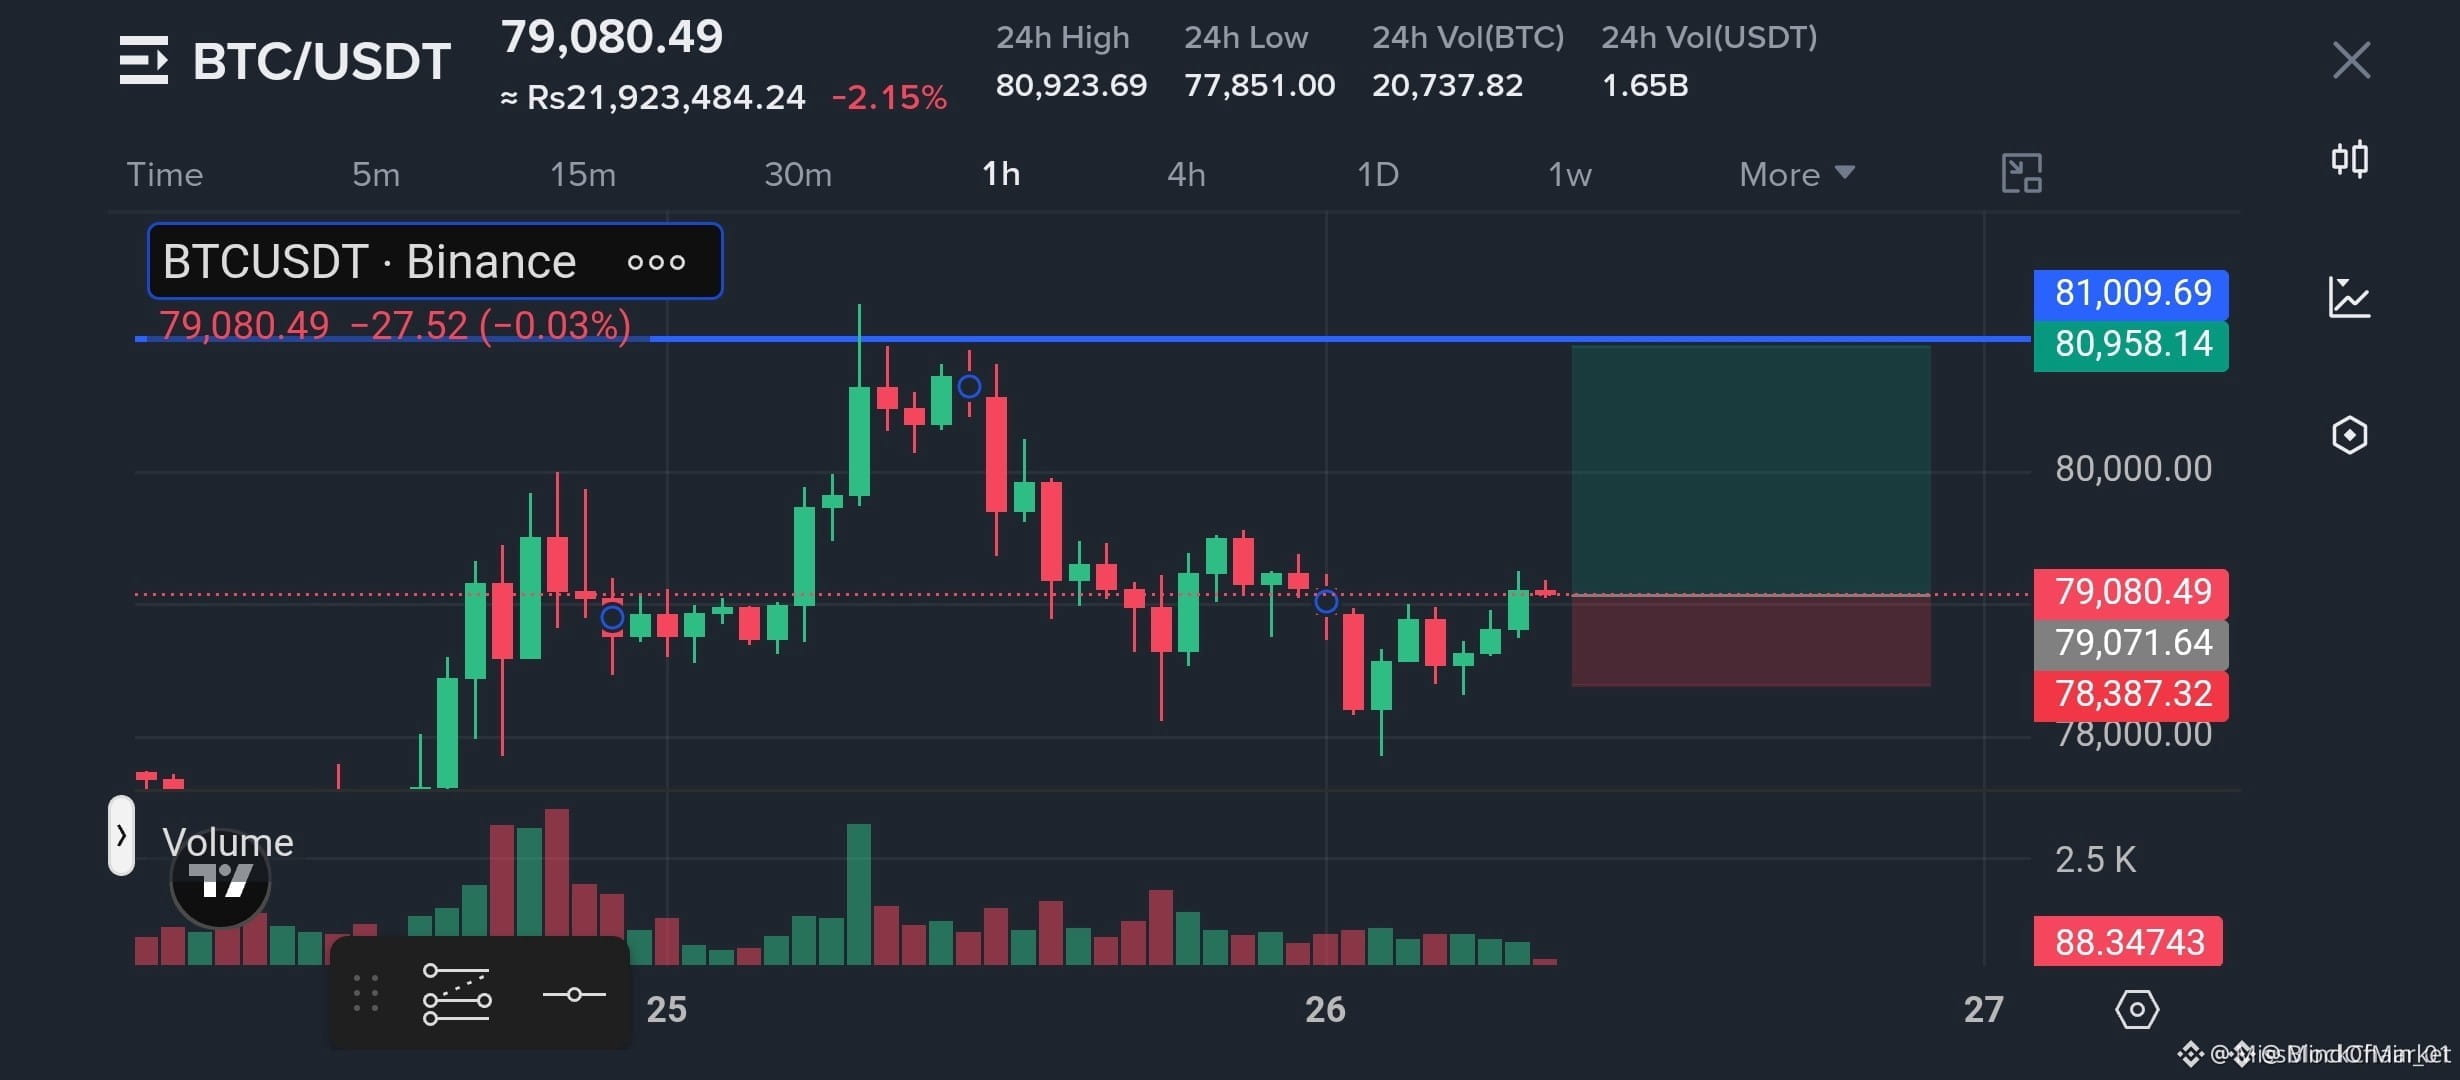
🚨 $BTC COMPLETES WAVE FOUR RE-ACCUMULATION BEFORE POTENTIAL WAVE FIVE EXPANSION ⚡
Entry: 79,000 - 79,100 ⚡
Target: 80,000 - 82,500 🚀
Stop Loss: 77,500 ⚠️
Price action on the 1H timeframe reveals smart money successfully defended the structural floor at 77.8K. 📌 Order flow is shifting back into buyer control as market structure aligns for a potential Wave (5) impulse run. 📊
Displacement above the 79.5K to 80K zone confirms structural momentum, clearing path toward liquidity up to 82.5K. 💡 A clean break below 77.5K invalidates this count, providing a defined risk boundary. 💬 Are you building positions on this retest or waiting for 80K confirmation? 👇
⚠️ Not financial advice. Always manage your risk. 🛡️
🏷️ #BTC #LongSetup #Crypto #ElliottWave
🎯 🦈
🚨 $BTC COMPLETES WAVE FOUR RE-ACCUMULATION BEFORE POTENTIAL WAVE FIVE EXPANSION ⚡
Entry: 79,000 - 79,100 ⚡
Target: 80,000 - 82,500 🚀
Stop Loss: 77,500 ⚠️
Price action on the 1H timeframe reveals smart money successfully defended the structural floor at 77.8K. 📌 Order flow is shifting back into buyer control as market structure aligns for a potential Wave (5) impulse run. 📊
Displacement above the 79.5K to 80K zone confirms structural momentum, clearing path toward liquidity up to 82.5K. 💡 A clean break below 77.5K invalidates this count, providing a defined risk boundary. 💬 Are you building positions on this retest or waiting for 80K confirmation? 👇
⚠️ Not financial advice. Always manage your risk. 🛡️
🏷️ #BTC #LongSetup #Crypto #ElliottWave
🎯 🦈
Entry: 79,000 - 79,100 ⚡
Target: 80,000 - 82,500 🚀
Stop Loss: 77,500 ⚠️
Price action on the 1H timeframe reveals smart money successfully defended the structural floor at 77.8K. 📌 Order flow is shifting back into buyer control as market structure aligns for a potential Wave (5) impulse run. 📊
Displacement above the 79.5K to 80K zone confirms structural momentum, clearing path toward liquidity up to 82.5K. 💡 A clean break below 77.5K invalidates this count, providing a defined risk boundary. 💬 Are you building positions on this retest or waiting for 80K confirmation? 👇
⚠️ Not financial advice. Always manage your risk. 🛡️
🏷️ #BTC #LongSetup #Crypto #ElliottWave
🎯 🦈
36

The bulls fight with the bears every day…
But who’s pulling the strings?
When price breaks a high, everyone says "up".
When it breaks a low, everyone says "down".
And in both cases, a lot of people jump in and out at the worst moment.
About 90 years ago, Elliott said the market moves with the psychology of the crowd.
Waves don’t just speak about price… they speak about how we feel.
In your opinion, who’s pulling the strings?
1 The whales
2 The Fed and the news
3 The crowd’s psychology
Write the number only in the comments 👇
#ElliottWave #Bitcoin
⚠️ Educational opinion, not financial advice.
The bulls fight with the bears every day…
But who’s pulling the strings?
When price breaks a high, everyone says "up".
When it breaks a low, everyone says "down".
And in both cases, a lot of people jump in and out at the worst moment.
About 90 years ago, Elliott said the market moves with the psychology of the crowd.
Waves don’t just speak about price… they speak about how we feel.
In your opinion, who’s pulling the strings?
1 The whales
2 The Fed and the news
3 The crowd’s psychology
Write the number only in the comments 👇
#ElliottWave #Bitcoin
⚠️ Educational opinion, not financial advice.
But who’s pulling the strings?
When price breaks a high, everyone says "up".
When it breaks a low, everyone says "down".
And in both cases, a lot of people jump in and out at the worst moment.
About 90 years ago, Elliott said the market moves with the psychology of the crowd.
Waves don’t just speak about price… they speak about how we feel.
In your opinion, who’s pulling the strings?
1 The whales
2 The Fed and the news
3 The crowd’s psychology
Write the number only in the comments 👇
#ElliottWave #Bitcoin
⚠️ Educational opinion, not financial advice.

90

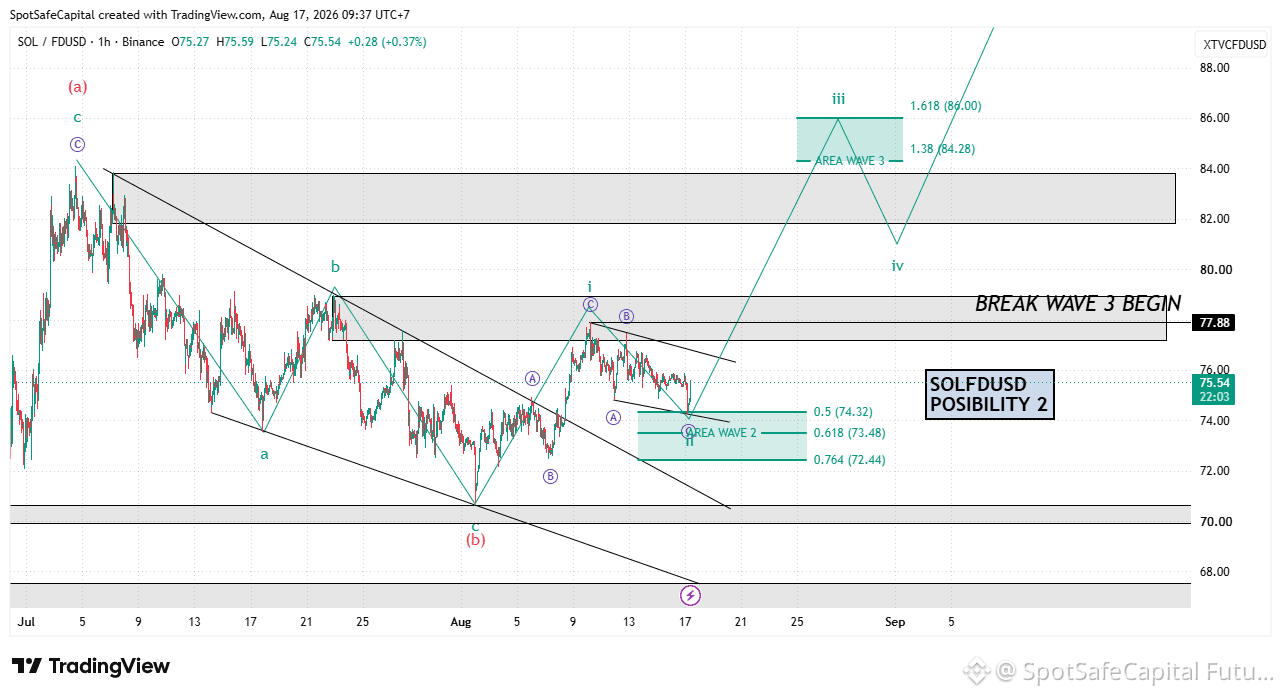
$SOL Elliott Wave Update — Possibility 2
{spot}(SOLUSDT)
I’m currently maintaining Possibility 2 for SOL.
The current structure suggests that Green Wave 2 is still developing after Green Wave 1 completed around the $78.5 area.
📌 Wave 2 Area
• 0.5 → $74.32
• 0.618 → $73.48
• 0.764 → $72.44
I’m watching this zone for a potential Wave 2 bottom.
If Wave 2 completes here, the next move I’m looking for is Green Wave 3, with an initial target area around $84.28–$86.00.
The key confirmation level is the $77.88–$79.00 resistance zone.
A clean break above this area would increase the probability that Wave 3 has begun.
⚠️ If SOL breaks below the major support around $70.7, this bullish count would need to be reconsidered.
For now, I’m staying with Possibility 2 and waiting for confirmation.
#sol #solana #Elliottwave #cryptotrading
$SOL Elliott Wave Update — Possibility 2
I’m currently maintaining Possibility 2 for SOL.
The current structure suggests that Green Wave 2 is still developing after Green Wave 1 completed around the $78.5 area.
📌 Wave 2 Area
• 0.5 → $74.32
• 0.618 → $73.48
• 0.764 → $72.44
I’m watching this zone for a potential Wave 2 bottom.
If Wave 2 completes here, the next move I’m looking for is Green Wave 3, with an initial target area around $84.28–$86.00.
The key confirmation level is the $77.88–$79.00 resistance zone.
A clean break above this area would increase the probability that Wave 3 has begun.
⚠️ If SOL breaks below the major support around $70.7, this bullish count would need to be reconsidered.
For now, I’m staying with Possibility 2 and waiting for confirmation.
#sol #solana #Elliottwave #cryptotrading
I’m currently maintaining Possibility 2 for SOL.
The current structure suggests that Green Wave 2 is still developing after Green Wave 1 completed around the $78.5 area.
📌 Wave 2 Area
• 0.5 → $74.32
• 0.618 → $73.48
• 0.764 → $72.44
I’m watching this zone for a potential Wave 2 bottom.
If Wave 2 completes here, the next move I’m looking for is Green Wave 3, with an initial target area around $84.28–$86.00.
The key confirmation level is the $77.88–$79.00 resistance zone.
A clean break above this area would increase the probability that Wave 3 has begun.
⚠️ If SOL breaks below the major support around $70.7, this bullish count would need to be reconsidered.
For now, I’m staying with Possibility 2 and waiting for confirmation.
#sol #solana #Elliottwave #cryptotrading
1
312
Log in to explore more content
Join global crypto users on Binance Square
⚡️ Get latest and useful information about crypto.
💬 Trusted by the world’s largest crypto exchange.
👍 Discover real insights from verified creators.
Email / Phone number
Trending Topics
1
#BTCReboundsAbove$60KAmidWhaleDipBuying
34,591 views
203 Discussing
2
#SolanaSets2027RoadmapToDoubleComputeCapacity
18,264 views
501 Discussing
3
#CaliforniaNvidiaProbeExaminesPotentialCriminalViolations
5,521 views
69 Discussing
4
#BlackRockLaunchesHKDollarDigitalLiquidityFund
16,680 views
422 Discussing
5
#NvidiaLoses$2.7TrillionInMonthAndAHalf
60,515 views
268 Discussing
6
#GlobalStocksFaceLongestLosingStreakSince2023
491,274 views
3,154 Discussing
7
#BlackRockIBITPostsRecord$541MSingleDayOutflow
78,647 views
160 Discussing
8
#AnthropicPlungesTowardIPOPriceonDay2
266,272 views
2,092 Discussing
9
#TwentyOneCapitalAdds172.25BTC
136,700 views
1,430 Discussing
10
#HKBillWouldExcludeTokenizedDepositsFromVirtualAssets
16,455 views
95 Discussing