

#cryptoanalysis"
cryptoanalysis"
1.5M views
4,569 Discussing
Hot
Latest

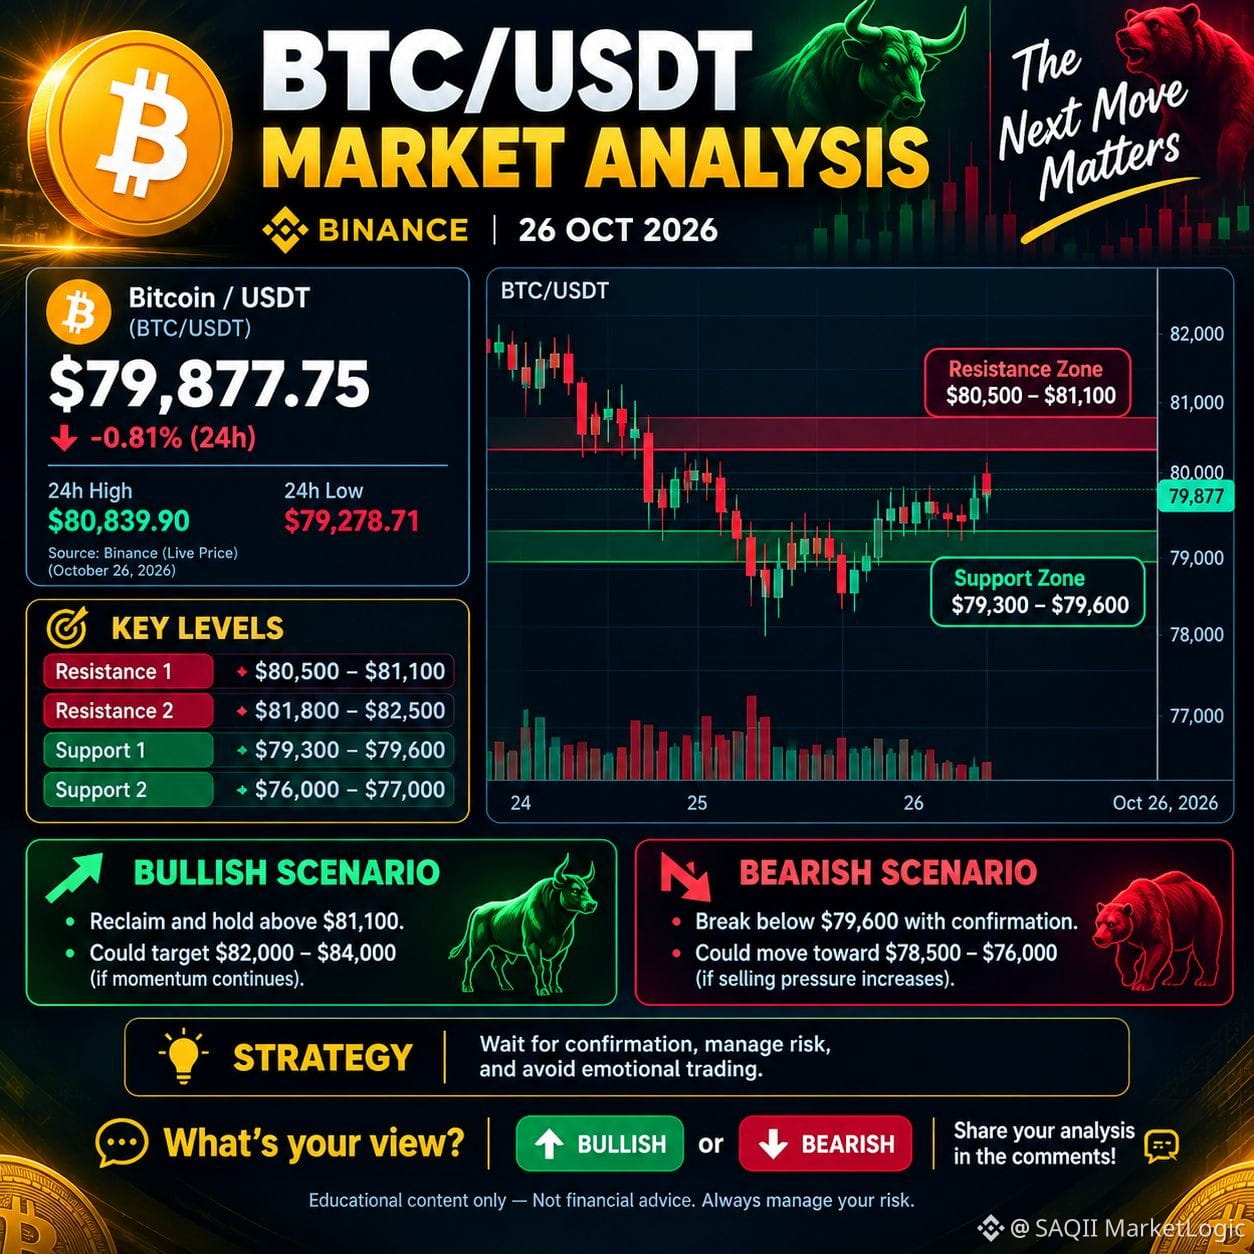
🚨 BTC/USDT: The Next Move Matters!
Bitcoin is trading near the $80K zone. Can bulls break above $81,100, or will sellers push BTC lower? 👀📉
{spot}(BTCUSDT)
🟢 Bullish or 🔴 Bearish? Share your prediction in the comments!
📊 Check the key levels in the chart and always manage your risk.
Educational content only. Not financial advice.
#bitcoin #BTCUSDT. #BinanceSquareTalks #CryptoAnalysis" #DYOR
🚨 BTC/USDT: The Next Move Matters!
Bitcoin is trading near the $80K zone. Can bulls break above $81,100, or will sellers push BTC lower? 👀📉
🟢 Bullish or 🔴 Bearish? Share your prediction in the comments!
📊 Check the key levels in the chart and always manage your risk.
Educational content only. Not financial advice.
#bitcoin #BTCUSDT. #BinanceSquareTalks #CryptoAnalysis" #DYOR
1
115

·
--
$BTC — THE $80K BATTLE ⚔️
Bitcoin is trading near $80,314, with a reported 24-hour decline of 0.27%. The market is approaching a psychologically important level: $80,000.
📊 MARKET VIEW
• Reference price: $80,314
• 24-hour change: -0.27%
• Market sentiment: Cautious
• Key level to watch: $80,000
🎯 MY SINGLE DIRECTION: SHORT
Entry: Below $79,900 after a confirmed 15-minute candle close
Stop Loss: $80,500
Take Profit 1: $79,300
Take Profit 2: $78,800
🐋 WHALE WATCH: No independently confirmed whale-selling signal available. Watch whether selling volume increases during a breakdown.
⚠️ If BTC reclaims the breakdown level, avoid forcing the trade.
#bitcoin #BTC #CryptoAnalysis" #BİNANCESQUARE
3
26

·
--
hey guys !!! 😭💵 trade on this coin
📊 ENA/USDT Trading Analysis | 26 October 2026
Coin: $ENA
Current Price: Approximately $0.2098
24H Change: Around +9%
Market Trend: Bullish momentum, but volatility remains high.
{spot}(ENAUSDT)
Technical Overview:
$ENA has shown a strong upward move, with increased trading activity. Buyers currently have momentum, but after a sharp rally, profit-taking and short-term corrections are possible.
Key Support Levels:
- $0.2000
- $0.1890
Key Resistance Levels:
- $0.2120
- $0.2200
- $0.2250
Potential Trading Plan (Illustrative):
- Entry zone: $0.2000–$0.2050, after a confirmed bounce
- Target 1: $0.2120
- Target 2: $0.2200
- Target 3: $0.2250
- Stop-loss: $0.1960
Bullish Scenario: A confirmed breakout above $0.2120 with strong volume could open the way toward $0.2200–$0.2250.
Bearish Scenario: If ENA loses the $0.2000 support area, the price could retest lower levels around $0.1890.
Risk Management: Wait for candle confirmation, check trading volume, and avoid chasing a sudden pump. These levels are an illustrative setup, not guaranteed signals.
#ENA #ENAUSDT #CryptoAnalysis" #BinanceSquareFamily #cryptotrading
hey guys !!! 😭💵 trade on this coin
📊 ENA/USDT Trading Analysis | 26 October 2026
Coin: $ENA
Current Price: Approximately $0.2098
24H Change: Around +9%
Market Trend: Bullish momentum, but volatility remains high.
Technical Overview:
$ENA has shown a strong upward move, with increased trading activity. Buyers currently have momentum, but after a sharp rally, profit-taking and short-term corrections are possible.
Key Support Levels:
- $0.2000
- $0.1890
Key Resistance Levels:
- $0.2120
- $0.2200
- $0.2250
Potential Trading Plan (Illustrative):
- Entry zone: $0.2000–$0.2050, after a confirmed bounce
- Target 1: $0.2120
- Target 2: $0.2200
- Target 3: $0.2250
- Stop-loss: $0.1960
Bullish Scenario: A confirmed breakout above $0.2120 with strong volume could open the way toward $0.2200–$0.2250.
Bearish Scenario: If ENA loses the $0.2000 support area, the price could retest lower levels around $0.1890.
Risk Management: Wait for candle confirmation, check trading volume, and avoid chasing a sudden pump. These levels are an illustrative setup, not guaranteed signals.
#ENA #ENAUSDT #CryptoAnalysis" #BinanceSquareFamily #cryptotrading
119

·
--
QUICK Coin Analysis: Can QuickSwap Regain Market Momentum?QUICK is associated with QuickSwap, a decentralized exchange (DEX) ecosystem built around decentralized trading and liquidity.
What Makes QUICK Interesting?
QuickSwap's ecosystem focuses on decentralized swaps and liquidity provision. Its long-term potential depends on real platform usage, ecosystem growth, token utility, and sustained market demand.
Market Outlook
From a trading perspective, QUICK deserves attention, but a bullish move should not be assumed without confirmation.
🔹 Bullish Scenario: Strong buying volume, a confirmed breakout above resistance, and successful retests could support further upside.
🔹 Bearish Scenario: Weak volume, rejection at resistance, or a breakdown below support could increase selling pressure.
🔹 Key Strategy: Watch price structure, trading volume, Bitcoin's trend, and liquidity before considering an entry.
Final Thoughts
QUICK may offer opportunities for traders who understand volatility and manage risk carefully. However, a good project does not automatically mean a profitable token.
Trade smart, protect your capital, and never chase a pump.
#QUICK #QuickSwap #CryptoAnalysis" #BİNANCESQUARE #altcoins
QUICK Coin Analysis: Can QuickSwap Regain Market Momentum?
QUICK is associated with QuickSwap, a decentralized exchange (DEX) ecosystem built around decentralized trading and liquidity.
What Makes QUICK Interesting?
QuickSwap's ecosystem focuses on decentralized swaps and liquidity provision. Its long-term potential depends on real platform usage, ecosystem growth, token utility, and sustained market demand.
Market Outlook
From a trading perspective, QUICK deserves attention, but a bullish move should not be assumed without confirmation.
🔹 Bullish Scenario: Strong buying volume, a confirmed breakout above resistance, and successful retests could support further upside.
🔹 Bearish Scenario: Weak volume, rejection at resistance, or a breakdown below support could increase selling pressure.
🔹 Key Strategy: Watch price structure, trading volume, Bitcoin's trend, and liquidity before considering an entry.
Final Thoughts
QUICK may offer opportunities for traders who understand volatility and manage risk carefully. However, a good project does not automatically mean a profitable token.
Trade smart, protect your capital, and never chase a pump.
#QUICK #QuickSwap #CryptoAnalysis" #BİNANCESQUARE #altcoins
45

·
--
Bullish
$BTC
{future}(BTCUSDT)
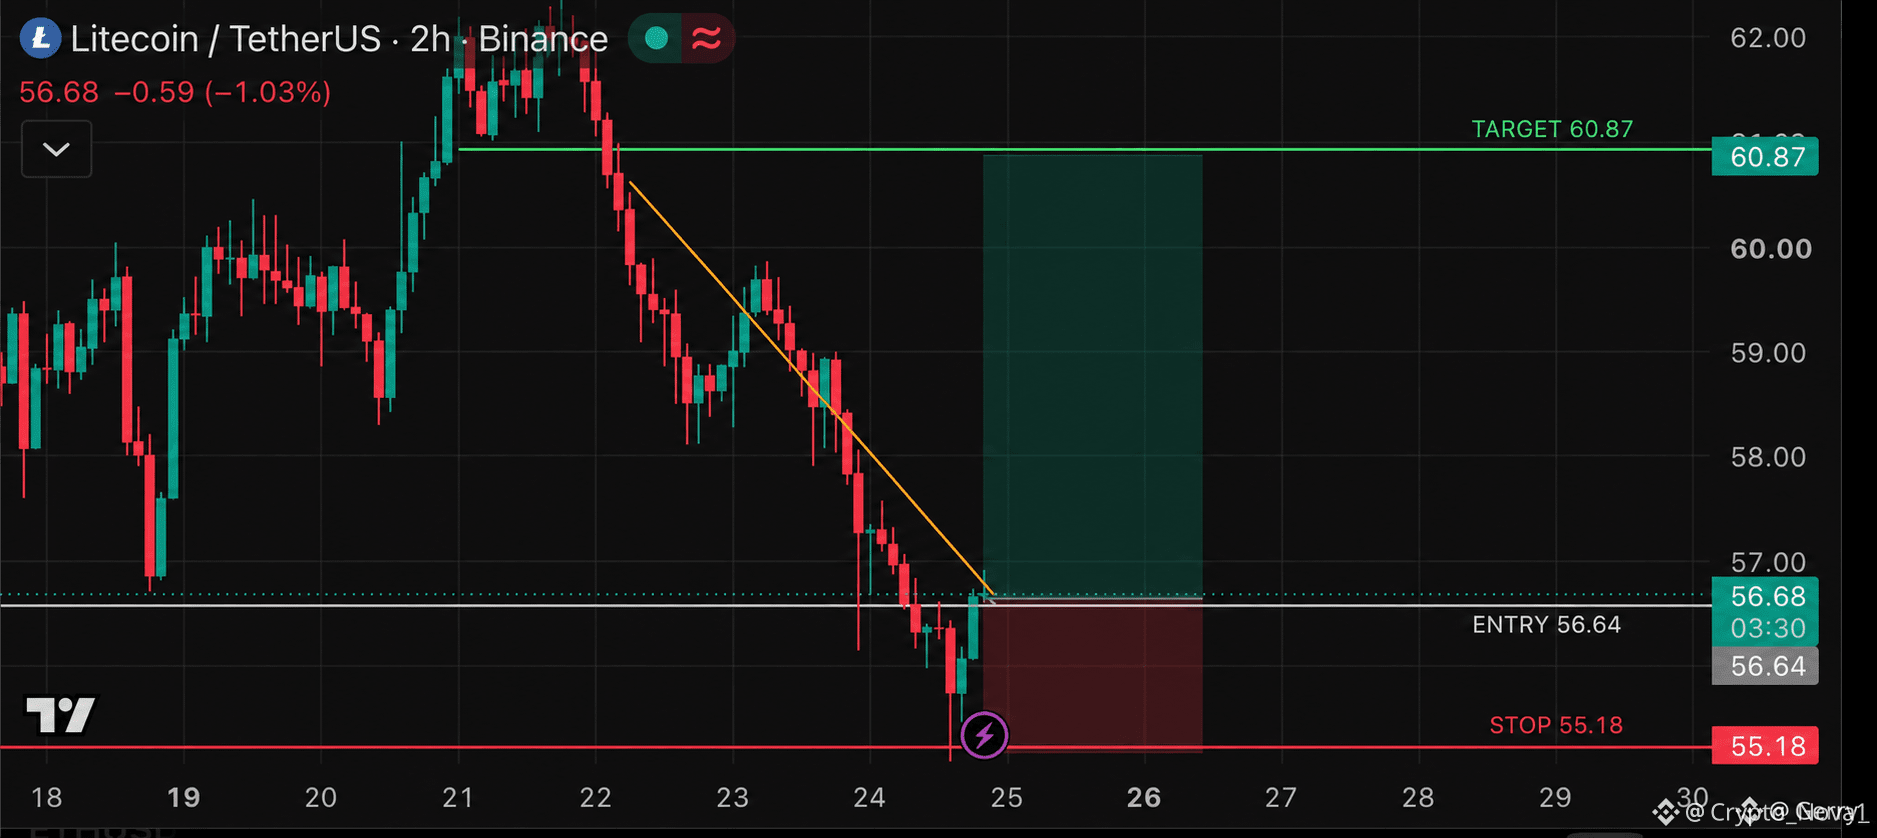
needs to reclaim strength and $81.8K is my first checkpoint.
Below that level, I’m cautious about calling any bounce a recovery.
$79K is the support I’m watching. A decisive daily close below it could put $76.6K in focus, followed by the wider weekly support band extending toward $72.4K.
For buyers, reclaiming $81.8K and holding it as support would strengthen the recovery case.
Let the daily close confirm the move. Patience over predictions.
#BTC #bitcoin #CryptoAnalysis"
$BTC
needs to reclaim strength and $81.8K is my first checkpoint.
Below that level, I’m cautious about calling any bounce a recovery.
$79K is the support I’m watching. A decisive daily close below it could put $76.6K in focus, followed by the wider weekly support band extending toward $72.4K.
For buyers, reclaiming $81.8K and holding it as support would strengthen the recovery case.
Let the daily close confirm the move. Patience over predictions.
#BTC #bitcoin #CryptoAnalysis"
55

·
--
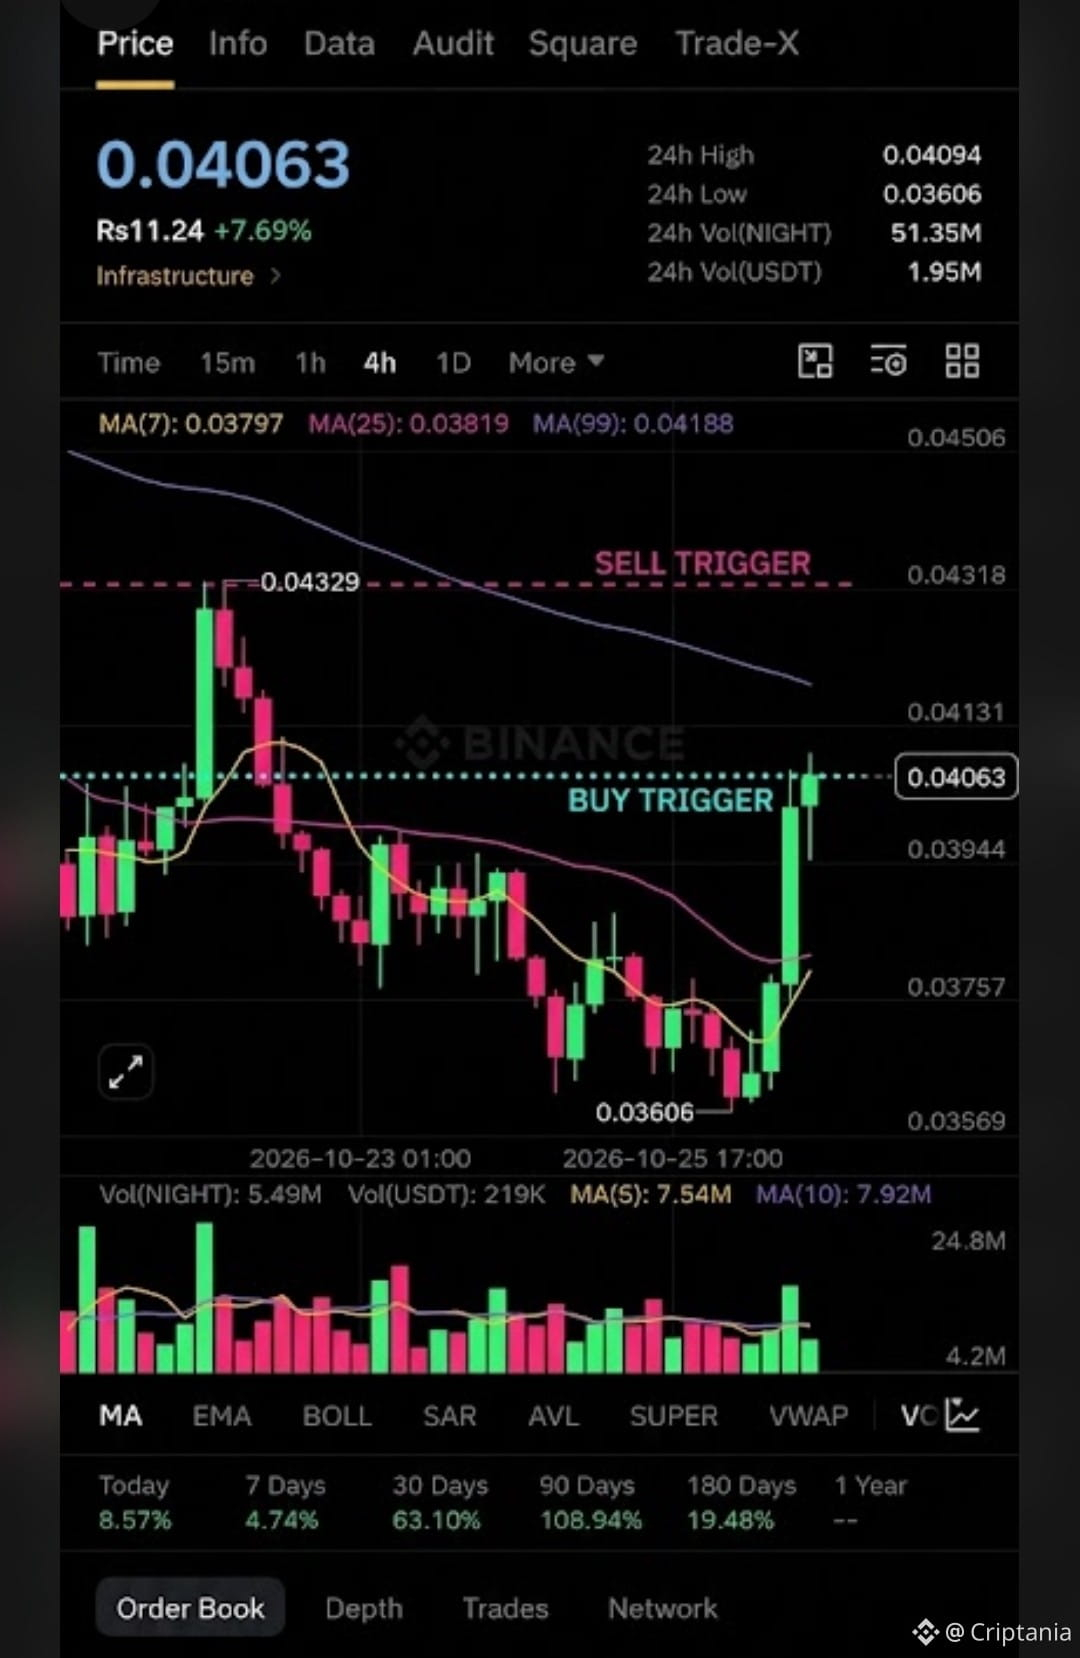
$NIGHT is currently in a confirmed uptrend with the aim of testing the previous high. The path to the 'Sell Trigger' is now the primary objective, but traders should watch for dynamic support to hold if any price pullbacks occur.
The market has recently shifted into a strong bullish recovery phase. Key observations include:
V-Shape Recovery: The price aggressively rebounded from the 0.03606 low.
Bullish Crossover: The 7-period Moving Average (yellow) has crossed back above the 25-period Moving Average (pink), which is a classic short-term buy signal.
Support Holding: The price is currently trading above both shorter-term MAs, indicating strong buyer support at the moment.
❤️ If you find this analysis helpful,
please Like 👍 and Follow 🔔 for more crypto updates and support
#night #Altcoin #CryptoAnalysis"
{spot}(NIGHTUSDT)
$NIGHT is currently in a confirmed uptrend with the aim of testing the previous high. The path to the 'Sell Trigger' is now the primary objective, but traders should watch for dynamic support to hold if any price pullbacks occur.
The market has recently shifted into a strong bullish recovery phase. Key observations include:
V-Shape Recovery: The price aggressively rebounded from the 0.03606 low.
Bullish Crossover: The 7-period Moving Average (yellow) has crossed back above the 25-period Moving Average (pink), which is a classic short-term buy signal.
Support Holding: The price is currently trading above both shorter-term MAs, indicating strong buyer support at the moment.
❤️ If you find this analysis helpful,
please Like 👍 and Follow 🔔 for more crypto updates and support
#night #Altcoin #CryptoAnalysis"
25

📊 $BEAMX — Bullish Momentum
🟢 $BEAMX — +16.71% | Bullish
💰 Total net inflow: +48.37M BEAMX, showing positive buying pressure.
🐋 Large orders: +42.94M inflow, while small orders show net selling.
⚠️ 5-day large inflow remains negative at -75.25M; volatility and pullback risk remain.
#BEAMX #CryptoAnalysis" #BullishMomentum #Moneyflow #BinanceSquare
78
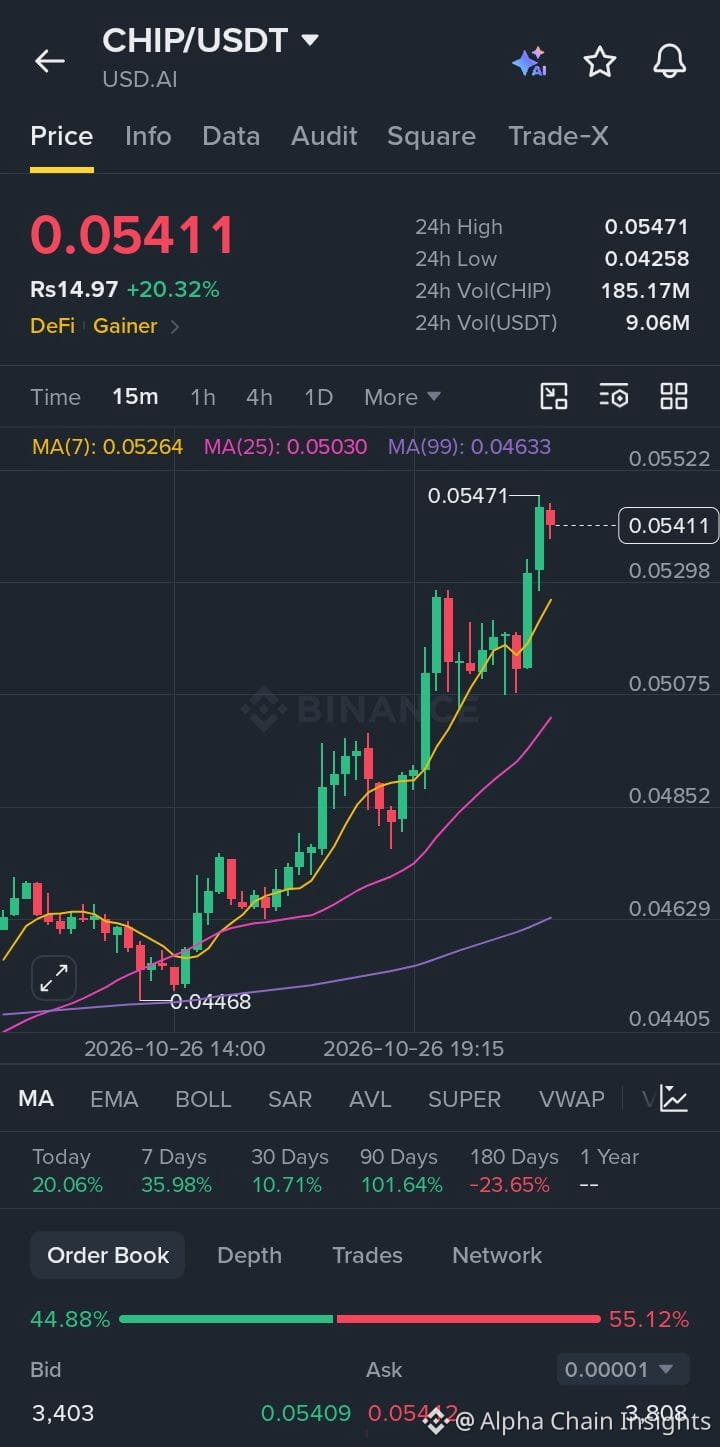
📊 $CHIP — Strong Bullish Momentum
🟢 $CHIP — +20.32% | Bullish
📈 Price is above MA(7), MA(25), and MA(99), confirming a strong short-term uptrend.
🎯 Resistance: 0.05471 | Support: 0.05264
⚠️ Ask pressure is higher at 55.12%; a pullback may occur near resistance.
#chip #USDAI #CryptoAnalysis" #BullishMomentum #BinanceSquare
🟢 $CHIP — +20.32% | Bullish
📈 Price is above MA(7), MA(25), and MA(99), confirming a strong short-term uptrend.
🎯 Resistance: 0.05471 | Support: 0.05264
⚠️ Ask pressure is higher at 55.12%; a pullback may occur near resistance.
#chip #USDAI #CryptoAnalysis" #BullishMomentum #BinanceSquare
143

·
--
🚀 $SOL — IS SOL READY FOR ITS NEXT BIG MOVE? 👀🔥
The crypto market never stops creating opportunities, and Solana ($SOL) is one project I'm keeping on my watchlist! 💎
⚡ Why is $SOL worth watching?
✅ Fast blockchain transactions
✅ Low transaction fees
✅ Growing DeFi and Web3 ecosystem
✅ An active community of builders and users
📊 The big question is: Can Solana attract even more users in the next market cycle?
I'm watching market trends, trading volume, and key support levels before making any decisions. Remember, no coin goes up forever — risk management matters! 🧠
🔥 YOUR TURN!
Where do you see $SOL going next?
🟢 BULLISH 🚀
🔴 BEARISH 📉
Comment your opinion below! 👇
Let's discuss — no hype, just crypto research. 💯
#Solana #sol #BinanceSquare #CryptoCommunity" #CryptoAnalysis"
🚀 $SOL — IS SOL READY FOR ITS NEXT BIG MOVE? 👀🔥
The crypto market never stops creating opportunities, and Solana ($SOL ) is one project I'm keeping on my watchlist! 💎
⚡ Why is $SOL worth watching?
✅ Fast blockchain transactions
✅ Low transaction fees
✅ Growing DeFi and Web3 ecosystem
✅ An active community of builders and users
📊 The big question is: Can Solana attract even more users in the next market cycle?
I'm watching market trends, trading volume, and key support levels before making any decisions. Remember, no coin goes up forever — risk management matters! 🧠
🔥 YOUR TURN!
Where do you see $SOL going next?
🟢 BULLISH 🚀
🔴 BEARISH 📉
Comment your opinion below! 👇
Let's discuss — no hype, just crypto research. 💯
#Solana #sol #BinanceSquare #CryptoCommunity" #CryptoAnalysis"
62
·
--
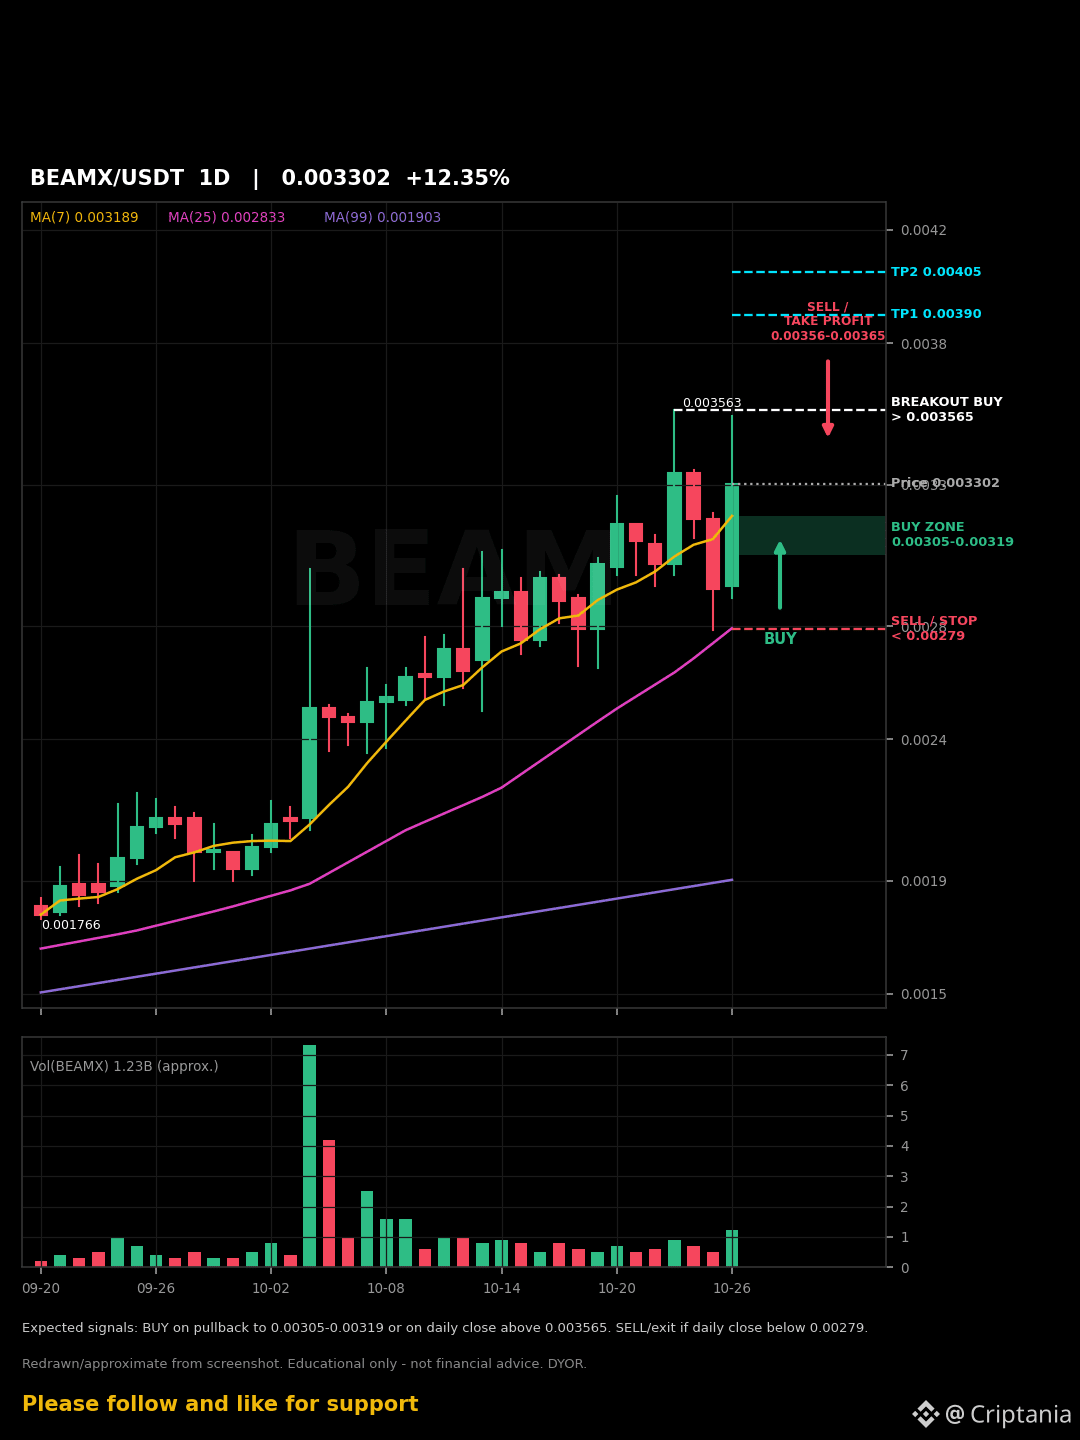
$BEAMX 🚀 BEAMX/USDT – 1D Chart Analysis 📊
🟢 Current Price: 0.003302 (+12.35%)
BEAMX is showing strong bullish momentum, trading above MA(7), MA(25), and MA(99). Buyers are active, but some pullback or profit-taking may occur after this sharp rise.
🎯 Buy Zone: 0.00305–0.00319 🚀 Breakout Level: 0.003565 🎯 TP1: 0.00390 🎯 TP2: 0.00405 🛑 Stop-Loss: Below 0.00279
Outlook: Bullish while price holds support. A daily close above 0.003565 could support further upside. Watch volume and manage risk carefully.
❤️ If you find this analysis helpful,
please Like 👍 and Follow 🔔 for more crypto updates and support!
#BEAMX #USDT #CryptoAnalysis" #Altcoin #Binance
{spot}(BEAMXUSDT)
$BEAMX 🚀 BEAMX/USDT – 1D Chart Analysis 📊
🟢 Current Price: 0.003302 (+12.35%)
BEAMX is showing strong bullish momentum, trading above MA(7), MA(25), and MA(99). Buyers are active, but some pullback or profit-taking may occur after this sharp rise.
🎯 Buy Zone: 0.00305–0.00319 🚀 Breakout Level: 0.003565 🎯 TP1: 0.00390 🎯 TP2: 0.00405 🛑 Stop-Loss: Below 0.00279
Outlook: Bullish while price holds support. A daily close above 0.003565 could support further upside. Watch volume and manage risk carefully.
❤️ If you find this analysis helpful,
please Like 👍 and Follow 🔔 for more crypto updates and support!
#BEAMX #USDT #CryptoAnalysis" #Altcoin #Binance
AngelOfCrypto_-:
great
3
56

·
--
$MAGMA Coin
🚨 $MAGMA — BEARS STILL IN CONTROL? 🔴
📉 MAGMAUSDT | 1H Technical Analysis
💰 Current Price: 0.31922 USDT
🔻 24H Change: -6.46%
📊 24H High: 0.36646
📊 24H Low: 0.31535
🔍 MARKET STRUCTURE
MAGMA remains under bearish pressure after a sharp decline from the 0.53 region. The recovery toward 0.36 failed, and price has since formed lower highs before consolidating near the 24H low.
📉 MACD CONFIRMS WEAK MOMENTUM
DIF: -0.00684
DEA: -0.00516
MACD Histogram: -0.00168
DIF remains below DEA, with both momentum readings in negative territory. This favours caution until a bullish crossover or stronger price recovery appears.
🎯 KEY SUPPORT & RESISTANCE
🟢 Support:
0.3150–0.3160: Immediate support zone
A confirmed breakdown below 0.3150 could expose MAGMA to further downside.
🔴 Resistance:
0.3250–0.3300: First recovery zone
0.3400–0.3410: Key near-term resistance
0.3650–0.3665: Major local resistance
📈 BULLISH SCENARIO If buyers defend 0.3150–0.3160 and reclaim 0.3300, a recovery toward 0.3400 becomes possible. A sustained break above 0.3400 would strengthen the recovery setup.
📉 BEARISH SCENARIO If support at 0.3150 fails on a confirmed 1H candle close, selling pressure could continue. Until price reclaims nearby resistance, rallies may remain corrective rather than signal a full trend reversal.
⚠️ MY VERDICT
The 1H structure remains bearish, and MACD supports the downside bias. However, price is approaching support, so a relief bounce or short squeeze remains possible. Watch the reaction around 0.3150 carefully rather than assuming an immediate breakdown.
Patience and confirmation are more important than chasing the next candle.
#MAGMA #MAGMAUSDT #BinanceFuturesTrading #CryptoAnalysis"
#METUSDT
#LINKUSDT
#HYPEUSDT
DYOR — Do Your Own Research.
192

·
--
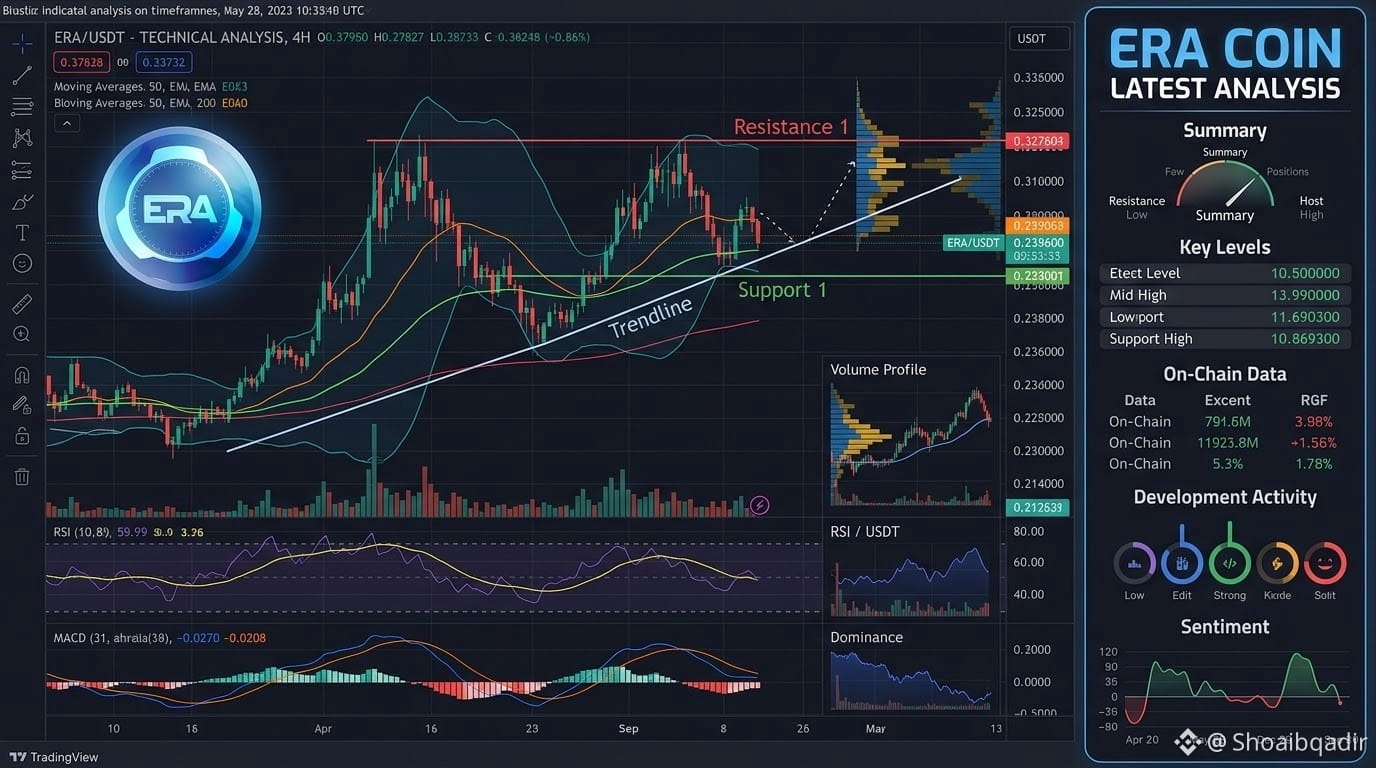
📊 $ERA
{spot}(ERAUSDT)
(Caldera) — Latest Market Analysis
💰 Current Price: $0.08683
📈 24H Change: +20.31%
📊 Market Trend: Strong bullish momentum with high volatility.
🎯 24H Resistance: $0.0947
🛡️ 24H Support: $0.0721
Analysis: ERA is experiencing strong buying momentum, with its price up over 20% in the last 24 hours. A breakout above resistance could support further gains, while a decline toward support may signal a pullback. Monitor trading volume and price action carefully.
⚠️ Disclaimer: This analysis is for informational purposes only and is not financial advice. Cryptocurrency markets are highly volatile. Always do your own research (DYOR).
#ERA #CalderaToken #CryptoAnalysis" #BİNANCE #CryptoMarketAlert
📊 $ERA
(Caldera) — Latest Market Analysis
💰 Current Price: $0.08683
📈 24H Change: +20.31%
📊 Market Trend: Strong bullish momentum with high volatility.
🎯 24H Resistance: $0.0947
🛡️ 24H Support: $0.0721
Analysis: ERA is experiencing strong buying momentum, with its price up over 20% in the last 24 hours. A breakout above resistance could support further gains, while a decline toward support may signal a pullback. Monitor trading volume and price action carefully.
⚠️ Disclaimer: This analysis is for informational purposes only and is not financial advice. Cryptocurrency markets are highly volatile. Always do your own research (DYOR).
#ERA #CalderaToken #CryptoAnalysis" #BİNANCE #CryptoMarketAlert
120

·
--
Bullish
🚨 BITCOIN AT $80K — BREAKOUT OR ANOTHER DROP? 👀
Bitcoin is showing weakness after several consecutive daily declines. On October 26, reported market data placed $BTC near $80,172, with its 24-hour range around $79,369–$80,952. 📉
🔍 3 levels I’m watching:
🟢 $81,700: Reclaiming this area could signal improving momentum.
🔴 $79,000: A break below nearby support could increase selling pressure.
⚡ $84,850: A move back toward this recent weekly high would show stronger recovery momentum.
My view: I’m watching for confirmation instead of blindly buying a dip. These are observation levels, not guaranteed price targets.
💬 Your turn: What do you think comes next for $BTC?
1️⃣ Bullish reversal 🚀
2️⃣ More downside 📉
3️⃣ Sideways consolidation 🦀
Share your reasoning below. Let’s discuss the market with facts, not hype!
#BitcoinETFs oin #BTC☀️ C #CryptoNewss toMarket #BinanceSquare are #CryptoAnalysis"
69

·
--
Bearish
$BTC coin has recently fallen below the $80,000 level amid market uncertainty and geopolitical tensions. Buyers are trying to stabilize the price, but selling pressure remains a concern. Traders are watching whether BTC can reclaim key resistance levels or experience another decline.
Bitcoin is at a critical point. Short-term momentum is weak, so traders should watch support levels closely before considering a trade. A recovery above resistance would strengthen the bullish case.
My suggestion: Avoid rushing into a trade; wait for confirmation of a breakout or breakdown. Cryptocurrency prices are highly volatile, and this analysis is educational, not financial advice.
{spot}(BTCUSDT)
#BTC #bitcoin #CryptoMarket #CryptoAnalysis" #EarningsSeason
$BTC coin has recently fallen below the $80,000 level amid market uncertainty and geopolitical tensions. Buyers are trying to stabilize the price, but selling pressure remains a concern. Traders are watching whether BTC can reclaim key resistance levels or experience another decline.
Bitcoin is at a critical point. Short-term momentum is weak, so traders should watch support levels closely before considering a trade. A recovery above resistance would strengthen the bullish case.
My suggestion: Avoid rushing into a trade; wait for confirmation of a breakout or breakdown. Cryptocurrency prices are highly volatile, and this analysis is educational, not financial advice.
#BTC #bitcoin #CryptoMarket #CryptoAnalysis" #EarningsSeason

54

·
--
Bullish
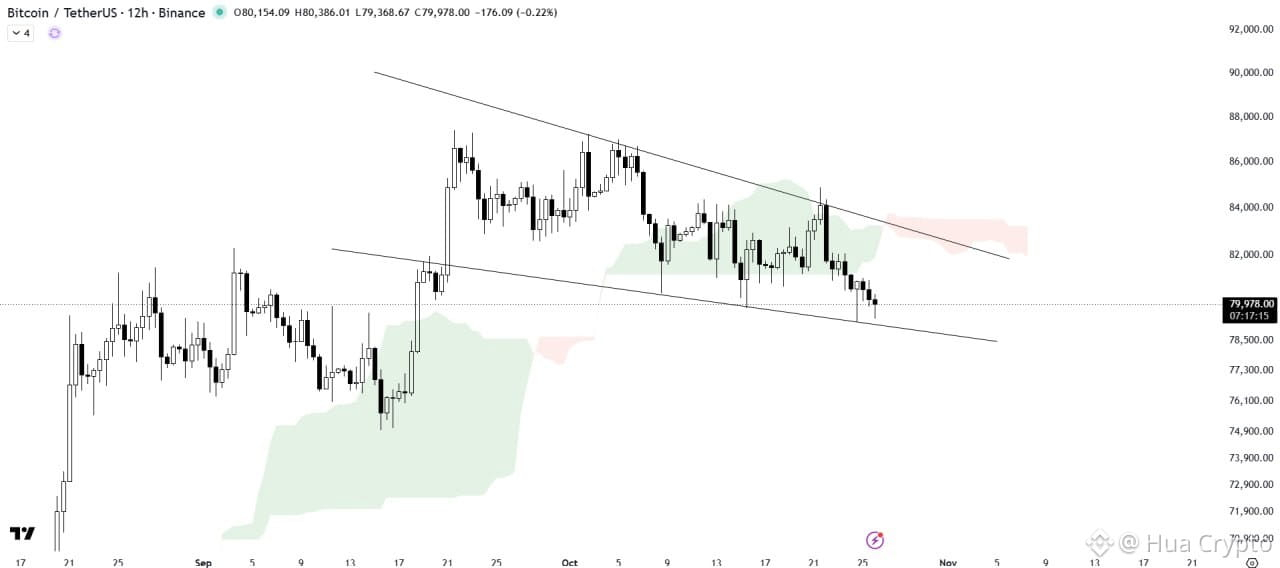
🚨 $BTC /USDT — A BIG MOVE COULD BE LOADING!
Bitcoin is compressing inside a Falling Wedge Pattern, and the battle between bulls and bears is heating up. BTC is still holding above the wedge’s support trendline, keeping a potential bullish breakout scenario alive.
📈 BULLISH SCENARIO: If BTC breaks above the wedge resistance and clears the Ichimoku Cloud, it could signal a bullish trend shift and open the door for further upside momentum.
📉 BEARISH SCENARIO: A decisive breakdown below wedge support could invalidate the pattern and expose Bitcoin to another leg down.
🎯 KEY LEVELS TO WATCH: • Ichimoku Cloud — Major resistance • Wedge Resistance — Breakout trigger • Wedge Support — Critical downside level
👀 THE NEXT MOVE MATTERS. Will Bitcoin break out to the upside or lose support?
Stay patient, watch the confirmation, and manage your risk wisely.
#BTC #Bitcoin #BTCUSDT #CryptoAnalysis" s #TechnicalAnalysis_Tickeron #CryptoMarketAlert
71

·
--
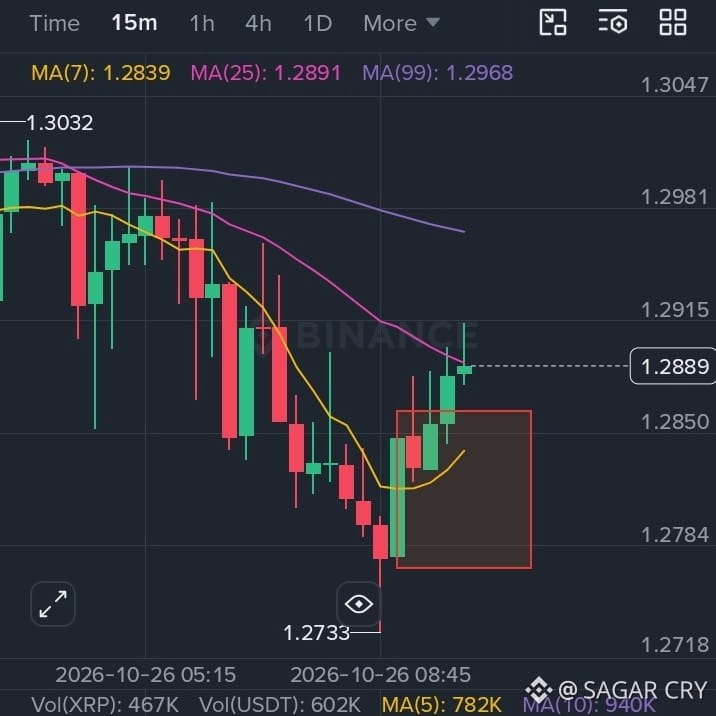
🚀 XRP/USDT Bullish Order Block Setup! 📈🔥
"Mastering Price Action on Binance Mobile! 🎯
Check out this clean live setup right from the Binance app. The market dropped, tested our marked Order Block zone precisely, and reacted with powerful bullish momentum! 📉➡️📈
Asset & Timeframe: XRP/USDT (15m Chart Setup)
Strategy: Spotting Smart Money liquidity zones directly on mobile.
Patience and precise zone-marking are the real keys to trading success. Are you guys trading this move too? Let me know in the comments! 👇
#XRP #BinanceSquare #CryptoTrading #OrderBlock #PriceAction #CryptoAnalysis" $XRP
{spot}(XRPUSDT)
🚀 XRP/USDT Bullish Order Block Setup! 📈🔥
"Mastering Price Action on Binance Mobile! 🎯
Check out this clean live setup right from the Binance app. The market dropped, tested our marked Order Block zone precisely, and reacted with powerful bullish momentum! 📉➡️📈
Asset & Timeframe: XRP/USDT (15m Chart Setup)
Strategy: Spotting Smart Money liquidity zones directly on mobile.
Patience and precise zone-marking are the real keys to trading success. Are you guys trading this move too? Let me know in the comments! 👇
#XRP #BinanceSquare #CryptoTrading #OrderBlock #PriceAction #CryptoAnalysis" $XRP
84

Article
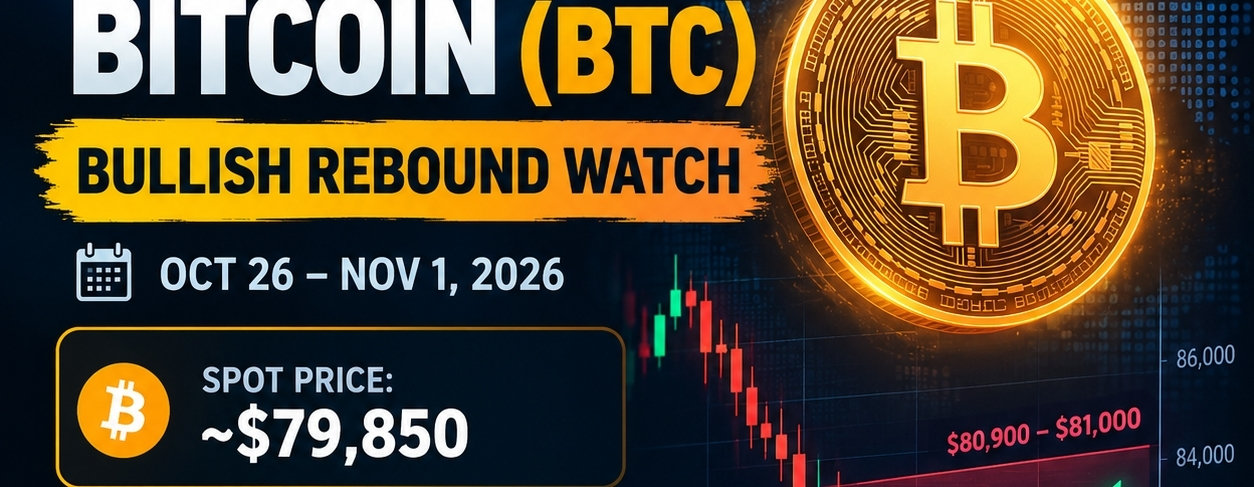
BITCOIN (BTC): WILL BTC REBOUND THIS WEEK?🚀 ₿ BITCOIN (BTC): WILL BTC REBOUND THIS WEEK? 🔥
📊 BTC Market Outlook | October 26 – November 1, 2026
Bitcoin is hovering around the $80K zone, and the next move could be crucial for the market!
💰 Current Price: Approximately $79,850
🟢 Key Support: $79,200–$80,000
🔴 Key Resistance: $80,900–$81,000
📈 MY BULLISH SCENARIO:
If BTC holds its support zone and buyers push the price above $81,000, we could see a potential recovery this week.
🔥 What I'm watching:
✅ Buyers defending the $79,200–$80,000 zone
✅ A breakout above $81,000
✅ Increasing buying volume
✅ Strong follow-through after the breakout
⚠️ BE CAREFUL: If BTC loses its support zone, the price could fall further. The bullish scenario is not confirmed yet.
🎯 My question to the BTC community:
What do you think?
🚀 BTC to $83K–$85K this week?
🐻 Or another correction below $79K?
Drop your prediction in the comments! 👇
Not financial advice. This is a market scenario, not a guaranteed predicti$XRP on. Always do your own research (DYOR).
$BTC
#Bitcoin #BTC #CryptoAnalysis" #BinanceSquareTalks #CryptoMarket $NVDAB
{spot}(BTCUSDT)
BITCOIN (BTC): WILL BTC REBOUND THIS WEEK?
🚀 ₿ BITCOIN (BTC): WILL BTC REBOUND THIS WEEK? 🔥
📊 BTC Market Outlook | October 26 – November 1, 2026
Bitcoin is hovering around the $80K zone, and the next move could be crucial for the market!
💰 Current Price: Approximately $79,850
🟢 Key Support: $79,200–$80,000
🔴 Key Resistance: $80,900–$81,000
📈 MY BULLISH SCENARIO:
If BTC holds its support zone and buyers push the price above $81,000, we could see a potential recovery this week.
🔥 What I'm watching:
✅ Buyers defending the $79,200–$80,000 zone
✅ A breakout above $81,000
✅ Increasing buying volume
✅ Strong follow-through after the breakout
⚠️ BE CAREFUL: If BTC loses its support zone, the price could fall further. The bullish scenario is not confirmed yet.
🎯 My question to the BTC community:
What do you think?
🚀 BTC to $83K–$85K this week?
🐻 Or another correction below $79K?
Drop your prediction in the comments! 👇
Not financial advice. This is a market scenario, not a guaranteed predicti$XRP on. Always do your own research (DYOR).
$BTC
#Bitcoin #BTC #CryptoAnalysis" #BinanceSquareTalks #CryptoMarket $NVDAB
81

·
--
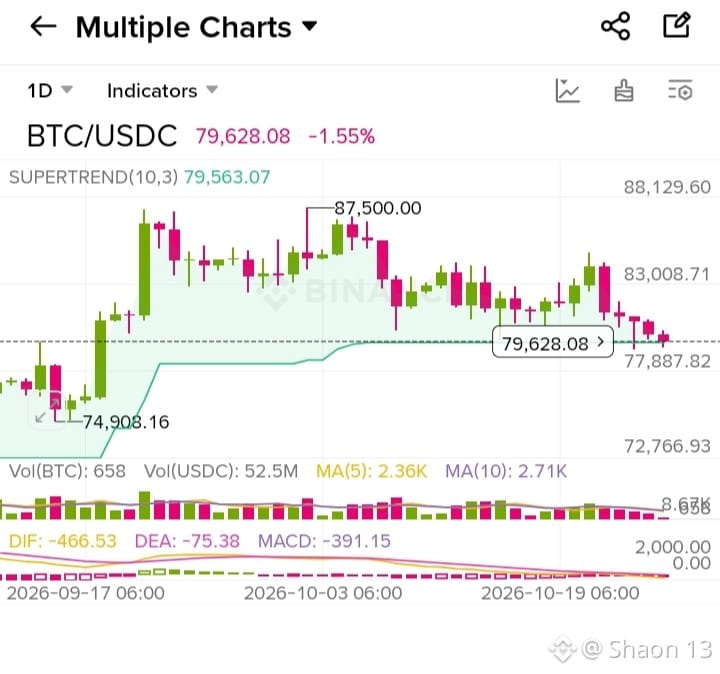
BTC/USDC Technical Analysis (1D Chart)
🔹 Current Price: $79,628.08 (-1.55%)
🔹 Trend Overview: The market is currently showing consolidation with a slight downward correction, hovering near a crucial support zone.
📊 Key Technical Indicators Breakdown:
Supertrend (10,3):
Level: $79,563.07
Analysis: Price is currently trading right around the Supertrend line, acting as an immediate psychological and technical pivot point. Holding above this level is vital for a bullish continuation.
MACD Indicator:
DIF: -466.53 | DEA: -75.38 | MACD Histogram: -391.15
Analysis: The MACD lines remain in negative territory with weak momentum, indicating that sellers are currently putting short-term pressure on the market, requiring patience before a strong reversal.
Moving Averages (MA):
MA(5): 2.36K | MA(10): 2.71K
Analysis: Volume moving averages reflect a cooling-off period following previous volatility near the local highs.
🎯 Key Levels to Watch:
Resistance: $83,008 – $87,500 (Breakout above this range could trigger a strong rally towards higher targets)
Support: $77,887 – $74,908 (Crucial demand zones to watch for potential bounce-backs)
💡 Market Sentiment: Neutral to Cautious. Keep an eye on volume changes and how the price reacts around the Supertrend support!
Disclaimer: This analysis is for educational purposes only and does not constitute financial advice. Always do your own research (DYOR) before trading.
Tags: #bitcoin #BTC #CryptoAnalysis" #BinanceSquareFamily #TechnicalAnalysise
{spot}(BTCUSDT)
$BTC $BTC
BTC/USDC Technical Analysis (1D Chart)
🔹 Current Price: $79,628.08 (-1.55%)
🔹 Trend Overview: The market is currently showing consolidation with a slight downward correction, hovering near a crucial support zone.
📊 Key Technical Indicators Breakdown:
Supertrend (10,3):
Level: $79,563.07
Analysis: Price is currently trading right around the Supertrend line, acting as an immediate psychological and technical pivot point. Holding above this level is vital for a bullish continuation.
MACD Indicator:
DIF: -466.53 | DEA: -75.38 | MACD Histogram: -391.15
Analysis: The MACD lines remain in negative territory with weak momentum, indicating that sellers are currently putting short-term pressure on the market, requiring patience before a strong reversal.
Moving Averages (MA):
MA(5): 2.36K | MA(10): 2.71K
Analysis: Volume moving averages reflect a cooling-off period following previous volatility near the local highs.
🎯 Key Levels to Watch:
Resistance: $83,008 – $87,500 (Breakout above this range could trigger a strong rally towards higher targets)
Support: $77,887 – $74,908 (Crucial demand zones to watch for potential bounce-backs)
💡 Market Sentiment: Neutral to Cautious. Keep an eye on volume changes and how the price reacts around the Supertrend support!
Disclaimer: This analysis is for educational purposes only and does not constitute financial advice. Always do your own research (DYOR) before trading.
Tags: #bitcoin #BTC #CryptoAnalysis" #BinanceSquareFamily #TechnicalAnalysise
$BTC $BTC
2
50

·
--
📊 $DODO : Is the Momentum Building Up?
$DODO is showing signs of a recovery, but can buyers keep it going? 👀
💰 Price: ~$0.02348 (≈ ₹2.05)
🟢 24h Change: +6.6%
📈 24h Volume: ~$12.45 million
🏦 Market Cap: ~$23.48 million
📊 24h High / Low: $0.02400 / $0.02196
Market data: CoinMarketCap snapshot, October 26, 2026. Prices can change rapidly.
🔍 What I'm Watching
DODO is moving upward, but the next move matters more than today's green candle.
🐂 Bullish: A sustained move above $0.0240 with strong buying volume could support further upside.
🐻 Bearish: A drop below $0.0220 could signal weakening momentum.
💭 My Take: I'm interested, but I'm not calling it a confirmed reversal yet. Let's see whether buyers can hold their ground.
What do you think—is $DODO ready for another move, or will sellers take control? 👇
📈 Live chart: [DODO on CoinMarketCap](https://coinmarketcap.com/currencies/dodo/?utm_source=chatgpt.com)
{spot}(DODOUSDT)
#DODO #cryptouniverseofficial #altcoins #DeFi #CryptoAnalysis" #BinanceSquareFamily #priceaction
📊 $DODO : Is the Momentum Building Up?
$DODO is showing signs of a recovery, but can buyers keep it going? 👀
💰 Price: ~$0.02348 (≈ ₹2.05)
🟢 24h Change: +6.6%
📈 24h Volume: ~$12.45 million
🏦 Market Cap: ~$23.48 million
📊 24h High / Low: $0.02400 / $0.02196
Market data: CoinMarketCap snapshot, October 26, 2026. Prices can change rapidly.
🔍 What I'm Watching
DODO is moving upward, but the next move matters more than today's green candle.
🐂 Bullish: A sustained move above $0.0240 with strong buying volume could support further upside.
🐻 Bearish: A drop below $0.0220 could signal weakening momentum.
💭 My Take: I'm interested, but I'm not calling it a confirmed reversal yet. Let's see whether buyers can hold their ground.
What do you think—is $DODO ready for another move, or will sellers take control? 👇
📈 Live chart: [DODO on CoinMarketCap](https://coinmarketcap.com/currencies/dodo/?utm_source=chatgpt.com)
#DODO #cryptouniverseofficial #altcoins #DeFi #CryptoAnalysis" #BinanceSquareFamily #priceaction

178

·
--
₿ BITCOIN 4H ANALYSIS | BTC/USDT 📊
Bitcoin is showing short-term selling pressure, and traders should watch the support zone closely.
📉 If support breaks, further downside is possible.
📈 If support holds, a bullish bounce could happen.
🎯 Wait for confirmation before entering a trade.
🔥 WHAT'S NEXT FOR BITCOIN?
🚀 BULLISH or 🔻 BEARISH?
{future}(BTCUSDT)
Comment your prediction below! 👇
#bitcoin #BinanceSquareFamily #CryptoAnalysis" #BitcoinTrading #CryptoCommunity
₿ BITCOIN 4H ANALYSIS | BTC/USDT 📊
Bitcoin is showing short-term selling pressure, and traders should watch the support zone closely.
📉 If support breaks, further downside is possible.
📈 If support holds, a bullish bounce could happen.
🎯 Wait for confirmation before entering a trade.
🔥 WHAT'S NEXT FOR BITCOIN?
🚀 BULLISH or 🔻 BEARISH?
Comment your prediction below! 👇
#bitcoin #BinanceSquareFamily #CryptoAnalysis" #BitcoinTrading #CryptoCommunity

1
178
Log in to explore more content
Join global crypto users on Binance Square
⚡️ Get latest and useful information about crypto.
💬 Trusted by the world’s largest crypto exchange.
👍 Discover real insights from verified creators.
Email / Phone number
Trending Topics
1
#BinancePick
3M views
151,907 Discussing
2
#EarningsSeason
5.2M views
25,808 Discussing
3
#AnthropicTTMRevenueGrewAbout1200%
20,994 views
341 Discussing
4
#AnthropicS1ExpectedToday
21,779 views
299 Discussing
5
#SouthKoreaReportedlyWeighsFourthCryptoTaxDelay
26,637 views
420 Discussing
6
#FranklinTempletonFilesForTwoDividendToBitcoinETFs
34,504 views
515 Discussing
7
#StrategyMSTRSurpassesNasdaqInMarketCap
26,460 views
373 Discussing
8
#CanadaProposesStablecoinRedemptionWithin3BusinessDays
1,201 views
34 Discussing
9
#ElectrumWalletBugLetRogueServersStealFunds
28,078 views
449 Discussing
10
#ArgentineCourtDismissesLIBRACaseAgainstMilei
42,596 views
556 Discussing