

#cohr
cohr
45,458 views
617 Discussing
Hot
Latest

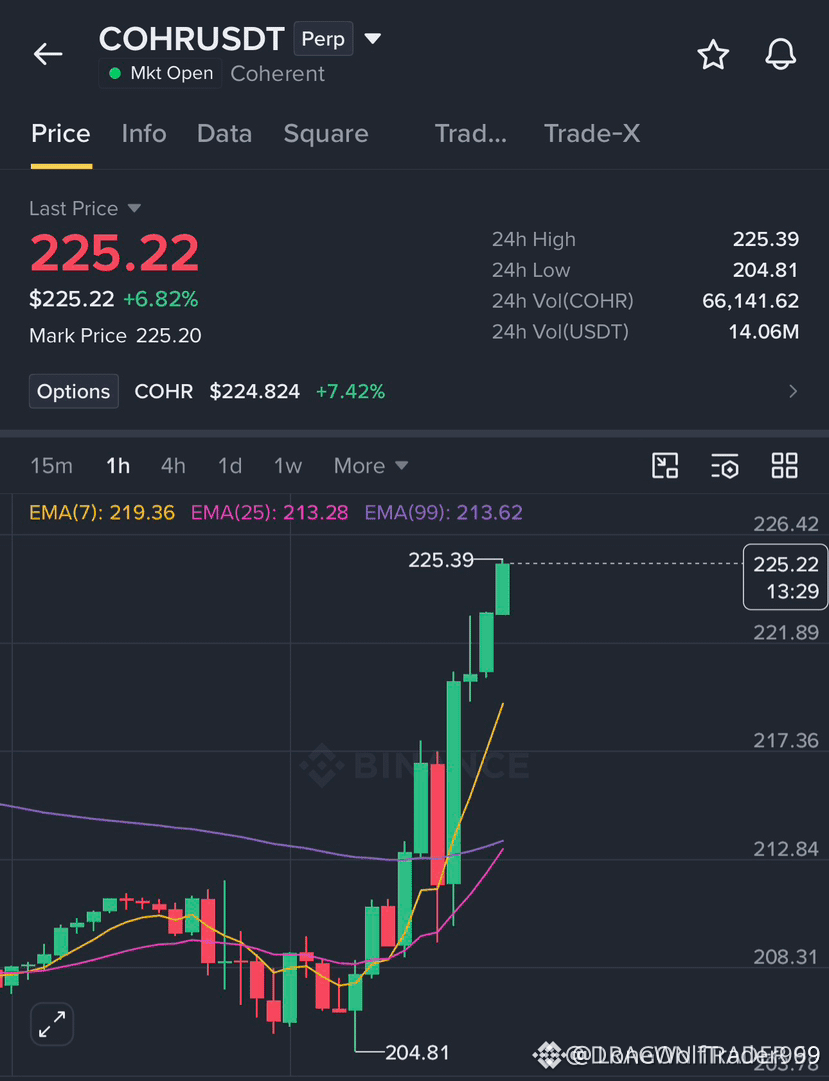
🚀 $COHR SURFING A BULLISH BREAKOUT—RISE TO $235? 🟢
Entry: 219.50-225.25 ⚡
Target: 228-235 🚀
Stop Loss: 216.50 ⚠️
📊 The price is carving a clean retest corridor, and every time buyers lock the zone, liquidity floods in like a tide. ⚡ Momentum is stacking on the 4H, with volume spiking as smart money defends the $219‑$225 band. 📌 Hold for the bounce—don’t chase the tail, let the order flow dictate the entry. 🦈
💬 Are you ready to ride this upward thrust or waiting for the next liquidity sweep? 👇
⚠️ Not financial advice. Always manage your risk. 🛡️
🏷️ #COHR #LongSetup #Breakout #Crypto
🔥 💎
4

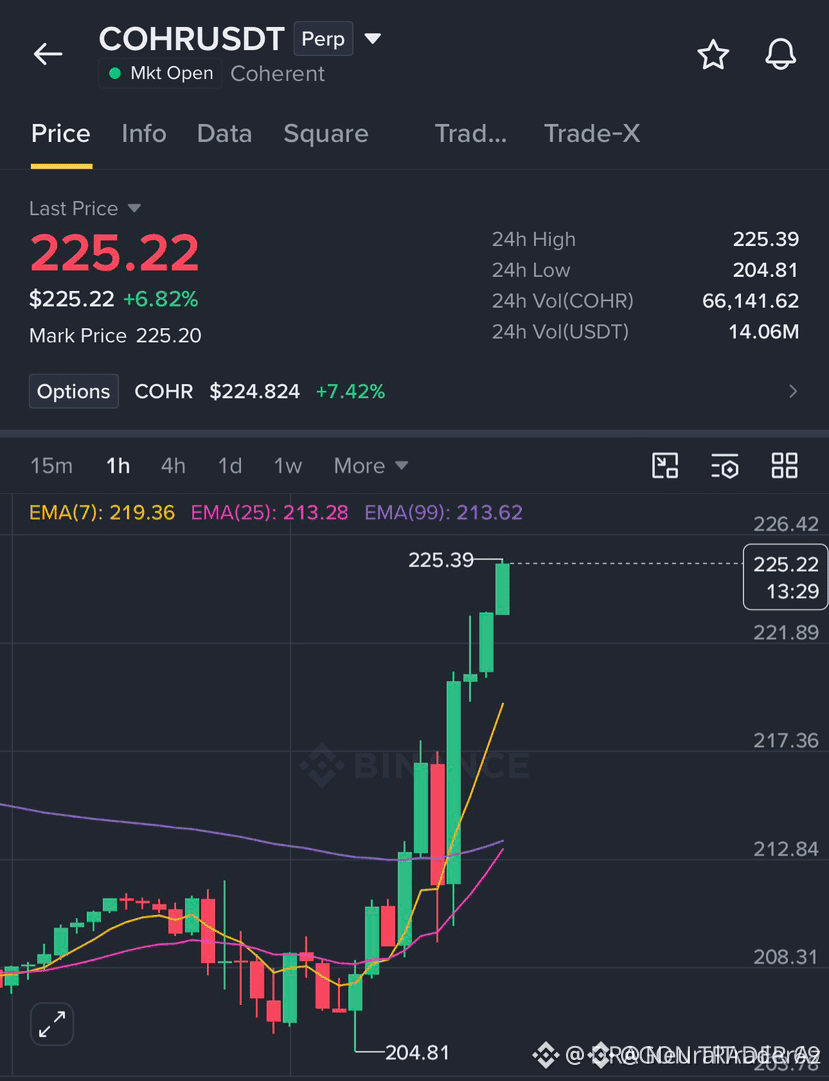
🚀 📈 $COHR BREAKING BULLISH RESISTANCE – READY FOR A $228 SURGE!
Stop Loss: $216.50 ⚠️
The market has carved a clean demand zone between $219.50‑$225.25, and each retest has seen buying absorb the lingering sell pressure like a smart‑money sweep. 📊 Volume spikes on the 4‑hour chart confirm the bullish tilt.
If the price holds above the zone, the next structural ceiling lies near $228, with upside potential to $235 as the order block fuels a fresh rally. ⚡ Watch for a decisive close to validate the breakout. 💬 Which price level will you defend first? 👇
⚠️ Not financial advice. Always manage your risk. 🛡️
🏷️ #COHR #LongSetup #Breakout #Bullish #Crypto
🚀 🦈
1

·
--
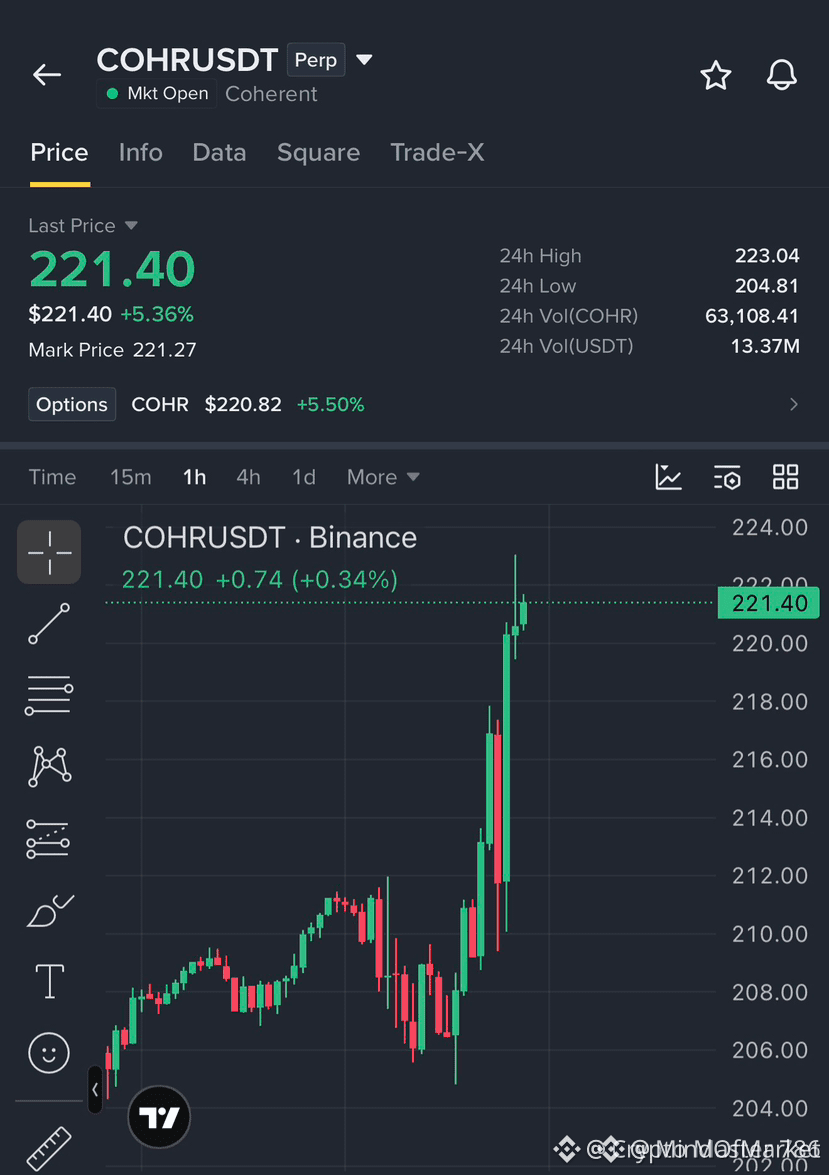
🚀🦈 $COHR SURGES ON LIQUIDITY RETEST – $225 ON THE HORIZON!
Entry: 219.50-221.00 ⚡
Target: 223.00 🚀
Target: 225.00 🚀
Target: 228.00 🚀
Stop Loss: 216.50 ⚠️
📊 The demand block around 219.50‑221.00 has absorbed aggressive selling three times this week, signaling smart‑money accumulation. 🦈 Volume spikes on the 1‑hour chart confirm the breakout is gaining traction, while the price respects the underlying order block. ⚡ A clear upward bias emerges as the next liquidity pool at $225 looms, offering a clean risk‑reward profile. 📌 Are you ready to ride this retest or waiting for the next sweep? 💬
⚠️ Not financial advice. Always manage your risk. 🛡️
🏷️ #COHR #LongSetup #Breakout #Liquidity #Crypto
🚀 🦈
9
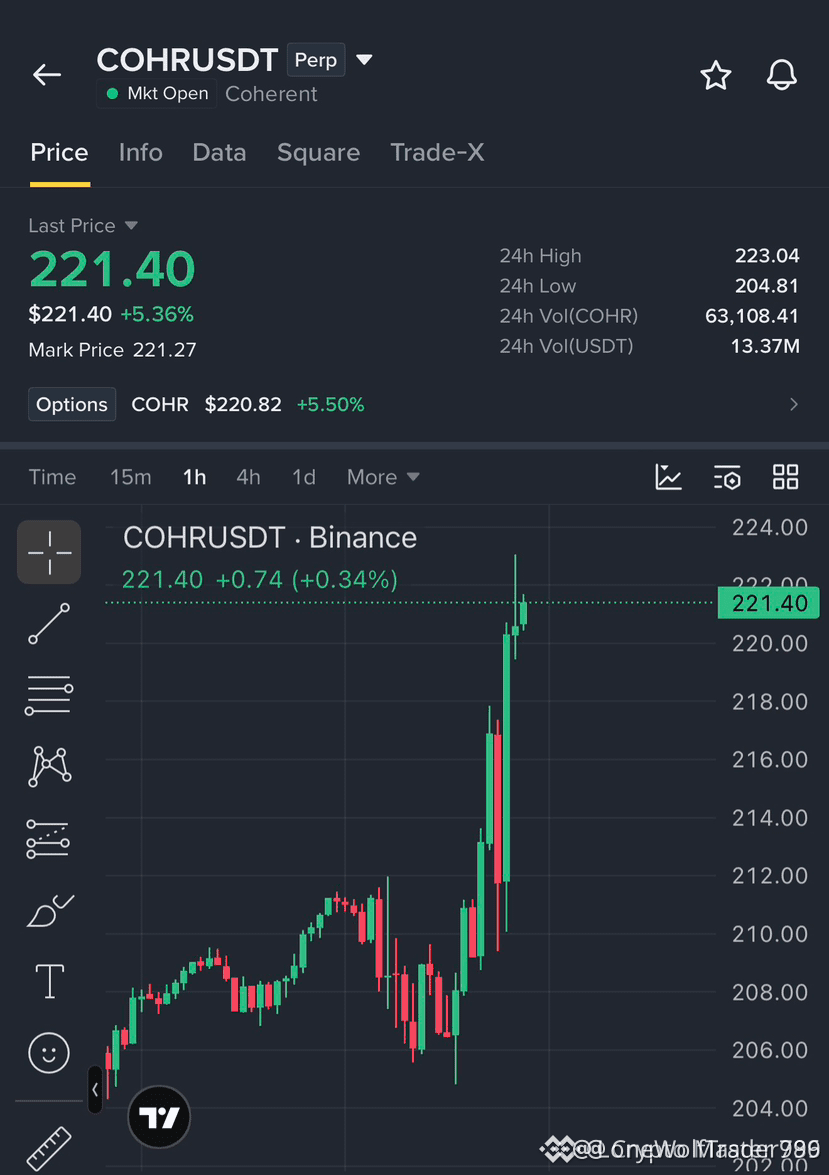
🚀 $COHR SURGES ON BREAKOUT RETEST, EYES ON $225 💥
Entry: 219.50-221.00 ⚡
Target: 223.00 / 225.00 / 228.00 🚀
Stop Loss: 216.50 ⚠️
🦈 Smart money is anchoring the demand zone around 219‑221, snapping up every dip as sellers scramble for liquidity. 📊 Volume on the 4H spikes, confirming the breakout’s thrust, while the RSI claws back above 50, hinting at sustained bullish pressure. ⚡ With each retest the order block tightens, setting the stage for a clean run toward $225 and beyond. 📈 Are you riding this wave or waiting for the next liquidity sweep? 💬
⚠️ Not financial advice. Always manage your risk. 🛡️
🏷️ #COHR #LongSetup #Breakout #Crypto
🚀 🔥
1


·
--
Bullish
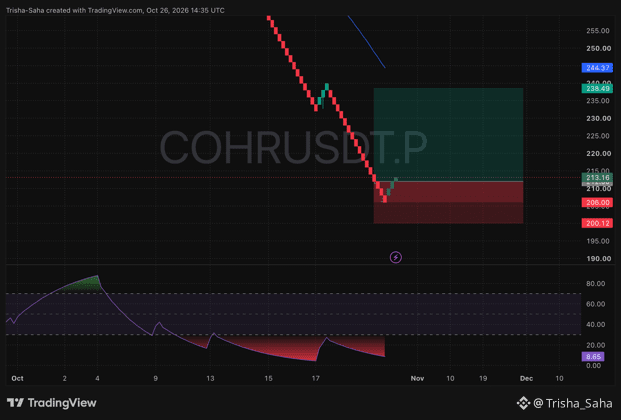
🧲 $COHR just hit a rock-solid floor and buyers are snapping it up fast! 🌋
📍 Trade Setup:
• Entry Zone: $210.00 – $213.16
• Stop Loss: $200.12
• Target: $238.49
🔬 Chart Analysis:
• The heavy drop slammed on the brakes at $206.00 with three strong green candles stepping right in.
• The bottom indicator is crushed down to an ultra-rare 8.65 level, showing sellers have zero energy left.
• Huge empty pocket overhead to rally straight toward the $238.49 target before hitting the blue line at $244.37.
🛟 Lock in zero risk early: move your Stop Loss to Break-Even the very second this trade hits +3% to +4% profit.
I've already entered from this bottom bounce. Are you riding this recovery wave with me? Drop a comment below! 👇
#COHR #COHRUSDT #CryptoTrading #BinanceSquare
{future}(COHRUSDT)
🧲 $COHR just hit a rock-solid floor and buyers are snapping it up fast! 🌋
📍 Trade Setup:
• Entry Zone: $210.00 – $213.16
• Stop Loss: $200.12
• Target: $238.49
🔬 Chart Analysis:
• The heavy drop slammed on the brakes at $206.00 with three strong green candles stepping right in.
• The bottom indicator is crushed down to an ultra-rare 8.65 level, showing sellers have zero energy left.
• Huge empty pocket overhead to rally straight toward the $238.49 target before hitting the blue line at $244.37.
🛟 Lock in zero risk early: move your Stop Loss to Break-Even the very second this trade hits +3% to +4% profit.
I've already entered from this bottom bounce. Are you riding this recovery wave with me? Drop a comment below! 👇
#COHR #COHRUSDT #CryptoTrading #BinanceSquare
1
109

·
--
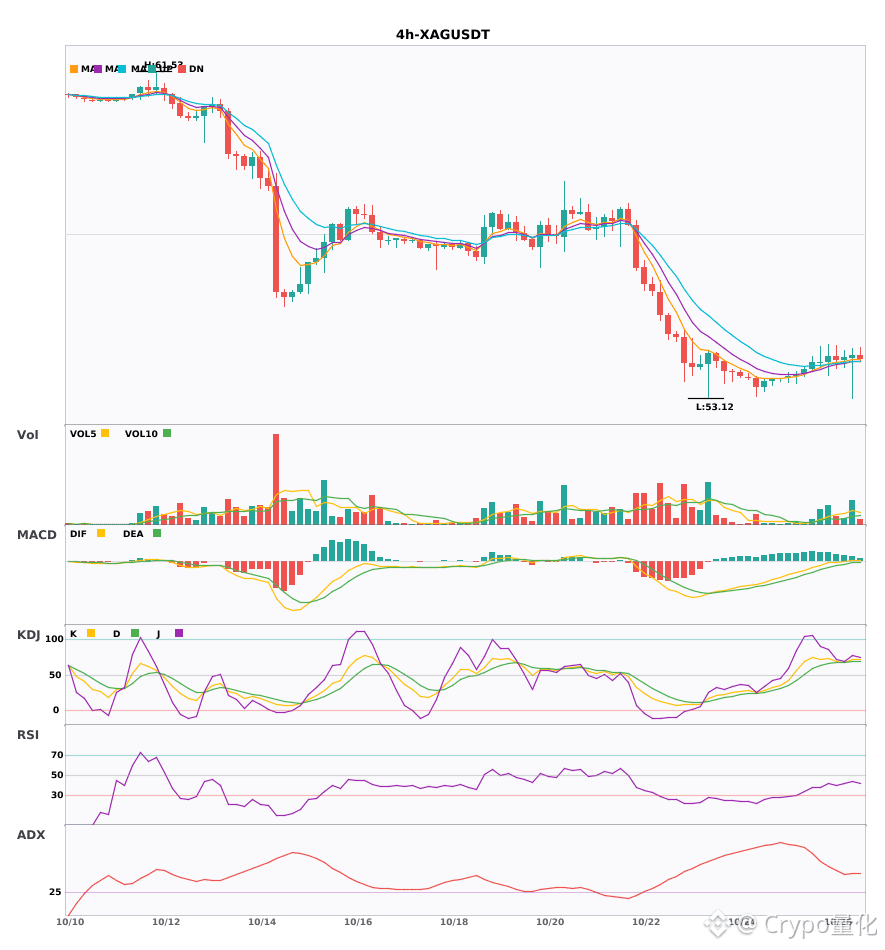
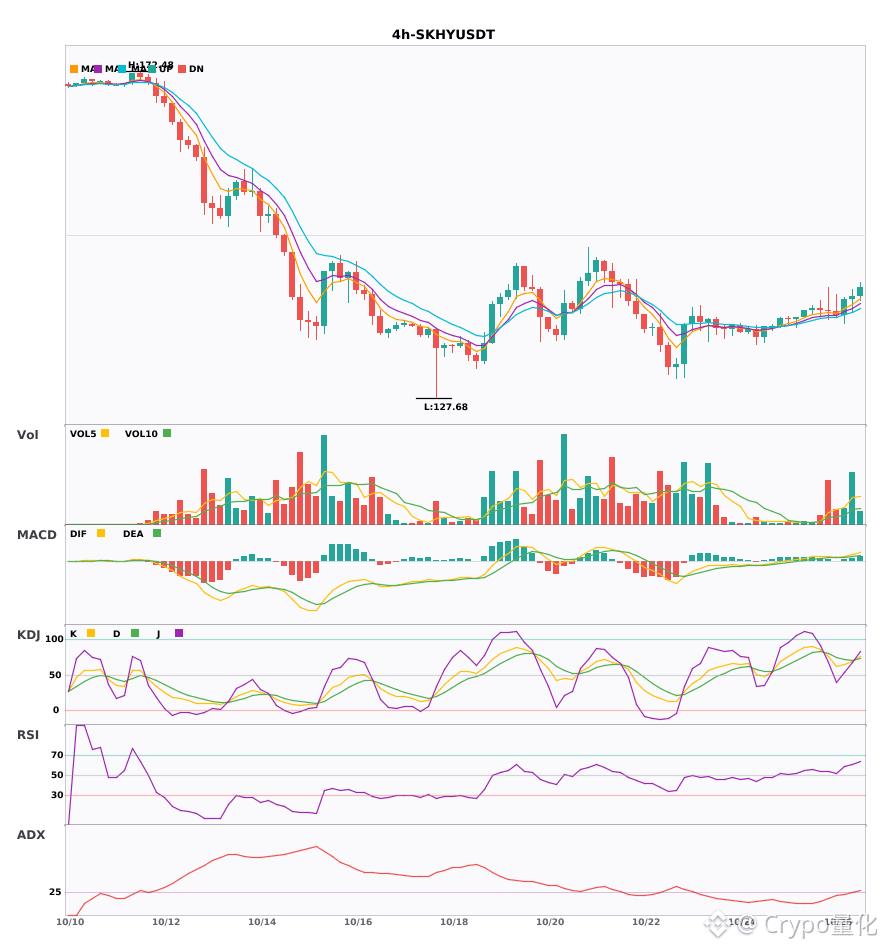
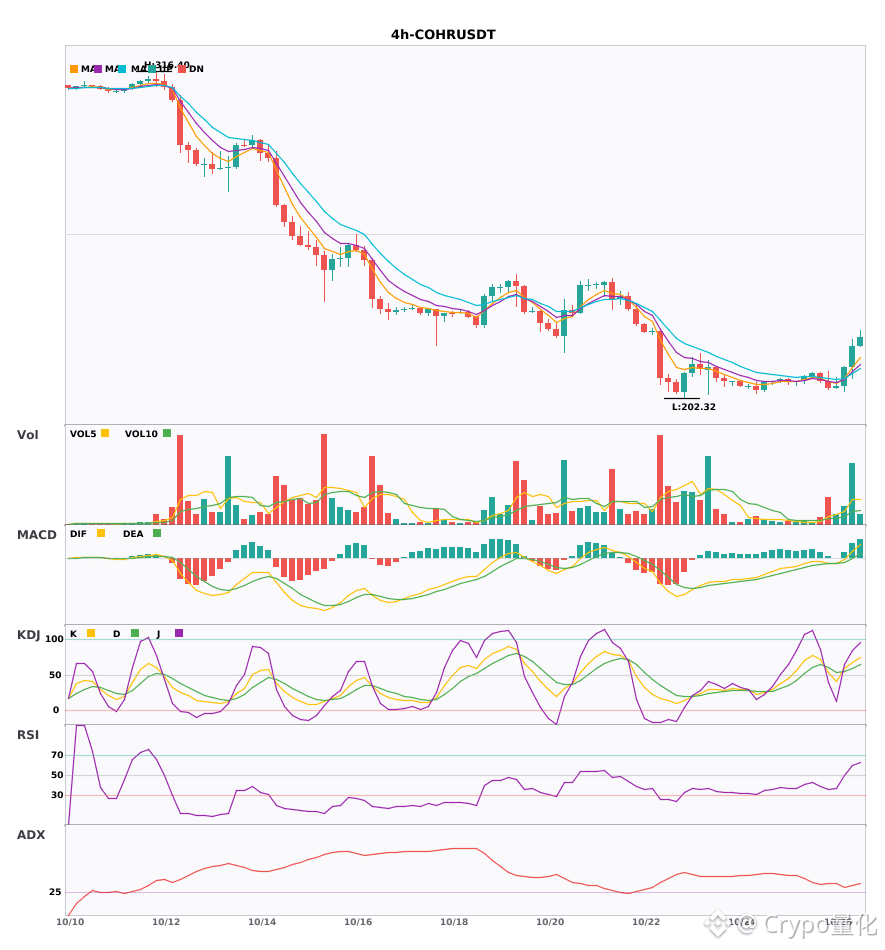
$XAG / $SKHY / $COHR : 4-hour technical indicators are strengthening simultaneously—which has the greatest breakout potential? 🔥
════════════════════
🔴 $XAG 4-hour bullish signal
⚠️Technical analysis: ADX(41), a clear trending market | MACD bullish, trend relatively strong, momentum weakening | EMA5 > EMA8 > EMA13, bullish alignment | KDJ strong, bulls in control (K: 71.5, D: 68.7) | Volume surge (2.8x)
════════════════════
🔴 $SKHY 4-hour bullish signal
⚠️Technical analysis: ADX(27), trend taking shape—an opportunity to participate | MACD golden cross above zero, bullish momentum building | EMA5 > EMA8 > EMA13, bullish alignment | KDJ strong, bulls in control (K: 65.2, D: 71.3) | Volume expansion (1.8x)
════════════════════
🔴 $COHR 4-hour bullish signal
⚠️Technical analysis: ADX(32), a clear trending market | MACD DIF breaks above zero, trend turns bullish | EMA5 > EMA8 > EMA13, bullish alignment | KDJ strong, bulls in control (K: 67.8, D: 59.5) | Volume surge (4.4x)
════════════════════
🔔 Follow for first-hand market updates 🔔
#技术分析 #XAG #SKHY #COHR
📌 When trading, pay attention to whether the candlestick pattern confirms the setup
════════════════════
🔴 $XAG 4-hour bullish signal
⚠️Technical analysis: ADX(41), a clear trending market | MACD bullish, trend relatively strong, momentum weakening | EMA5 > EMA8 > EMA13, bullish alignment | KDJ strong, bulls in control (K: 71.5, D: 68.7) | Volume surge (2.8x)
════════════════════
🔴 $SKHY 4-hour bullish signal
⚠️Technical analysis: ADX(27), trend taking shape—an opportunity to participate | MACD golden cross above zero, bullish momentum building | EMA5 > EMA8 > EMA13, bullish alignment | KDJ strong, bulls in control (K: 65.2, D: 71.3) | Volume expansion (1.8x)
════════════════════
🔴 $COHR 4-hour bullish signal
⚠️Technical analysis: ADX(32), a clear trending market | MACD DIF breaks above zero, trend turns bullish | EMA5 > EMA8 > EMA13, bullish alignment | KDJ strong, bulls in control (K: 67.8, D: 59.5) | Volume surge (4.4x)
════════════════════
🔔 Follow for first-hand market updates 🔔
#技术分析 #XAG #SKHY #COHR
📌 When trading, pay attention to whether the candlestick pattern confirms the setup
7
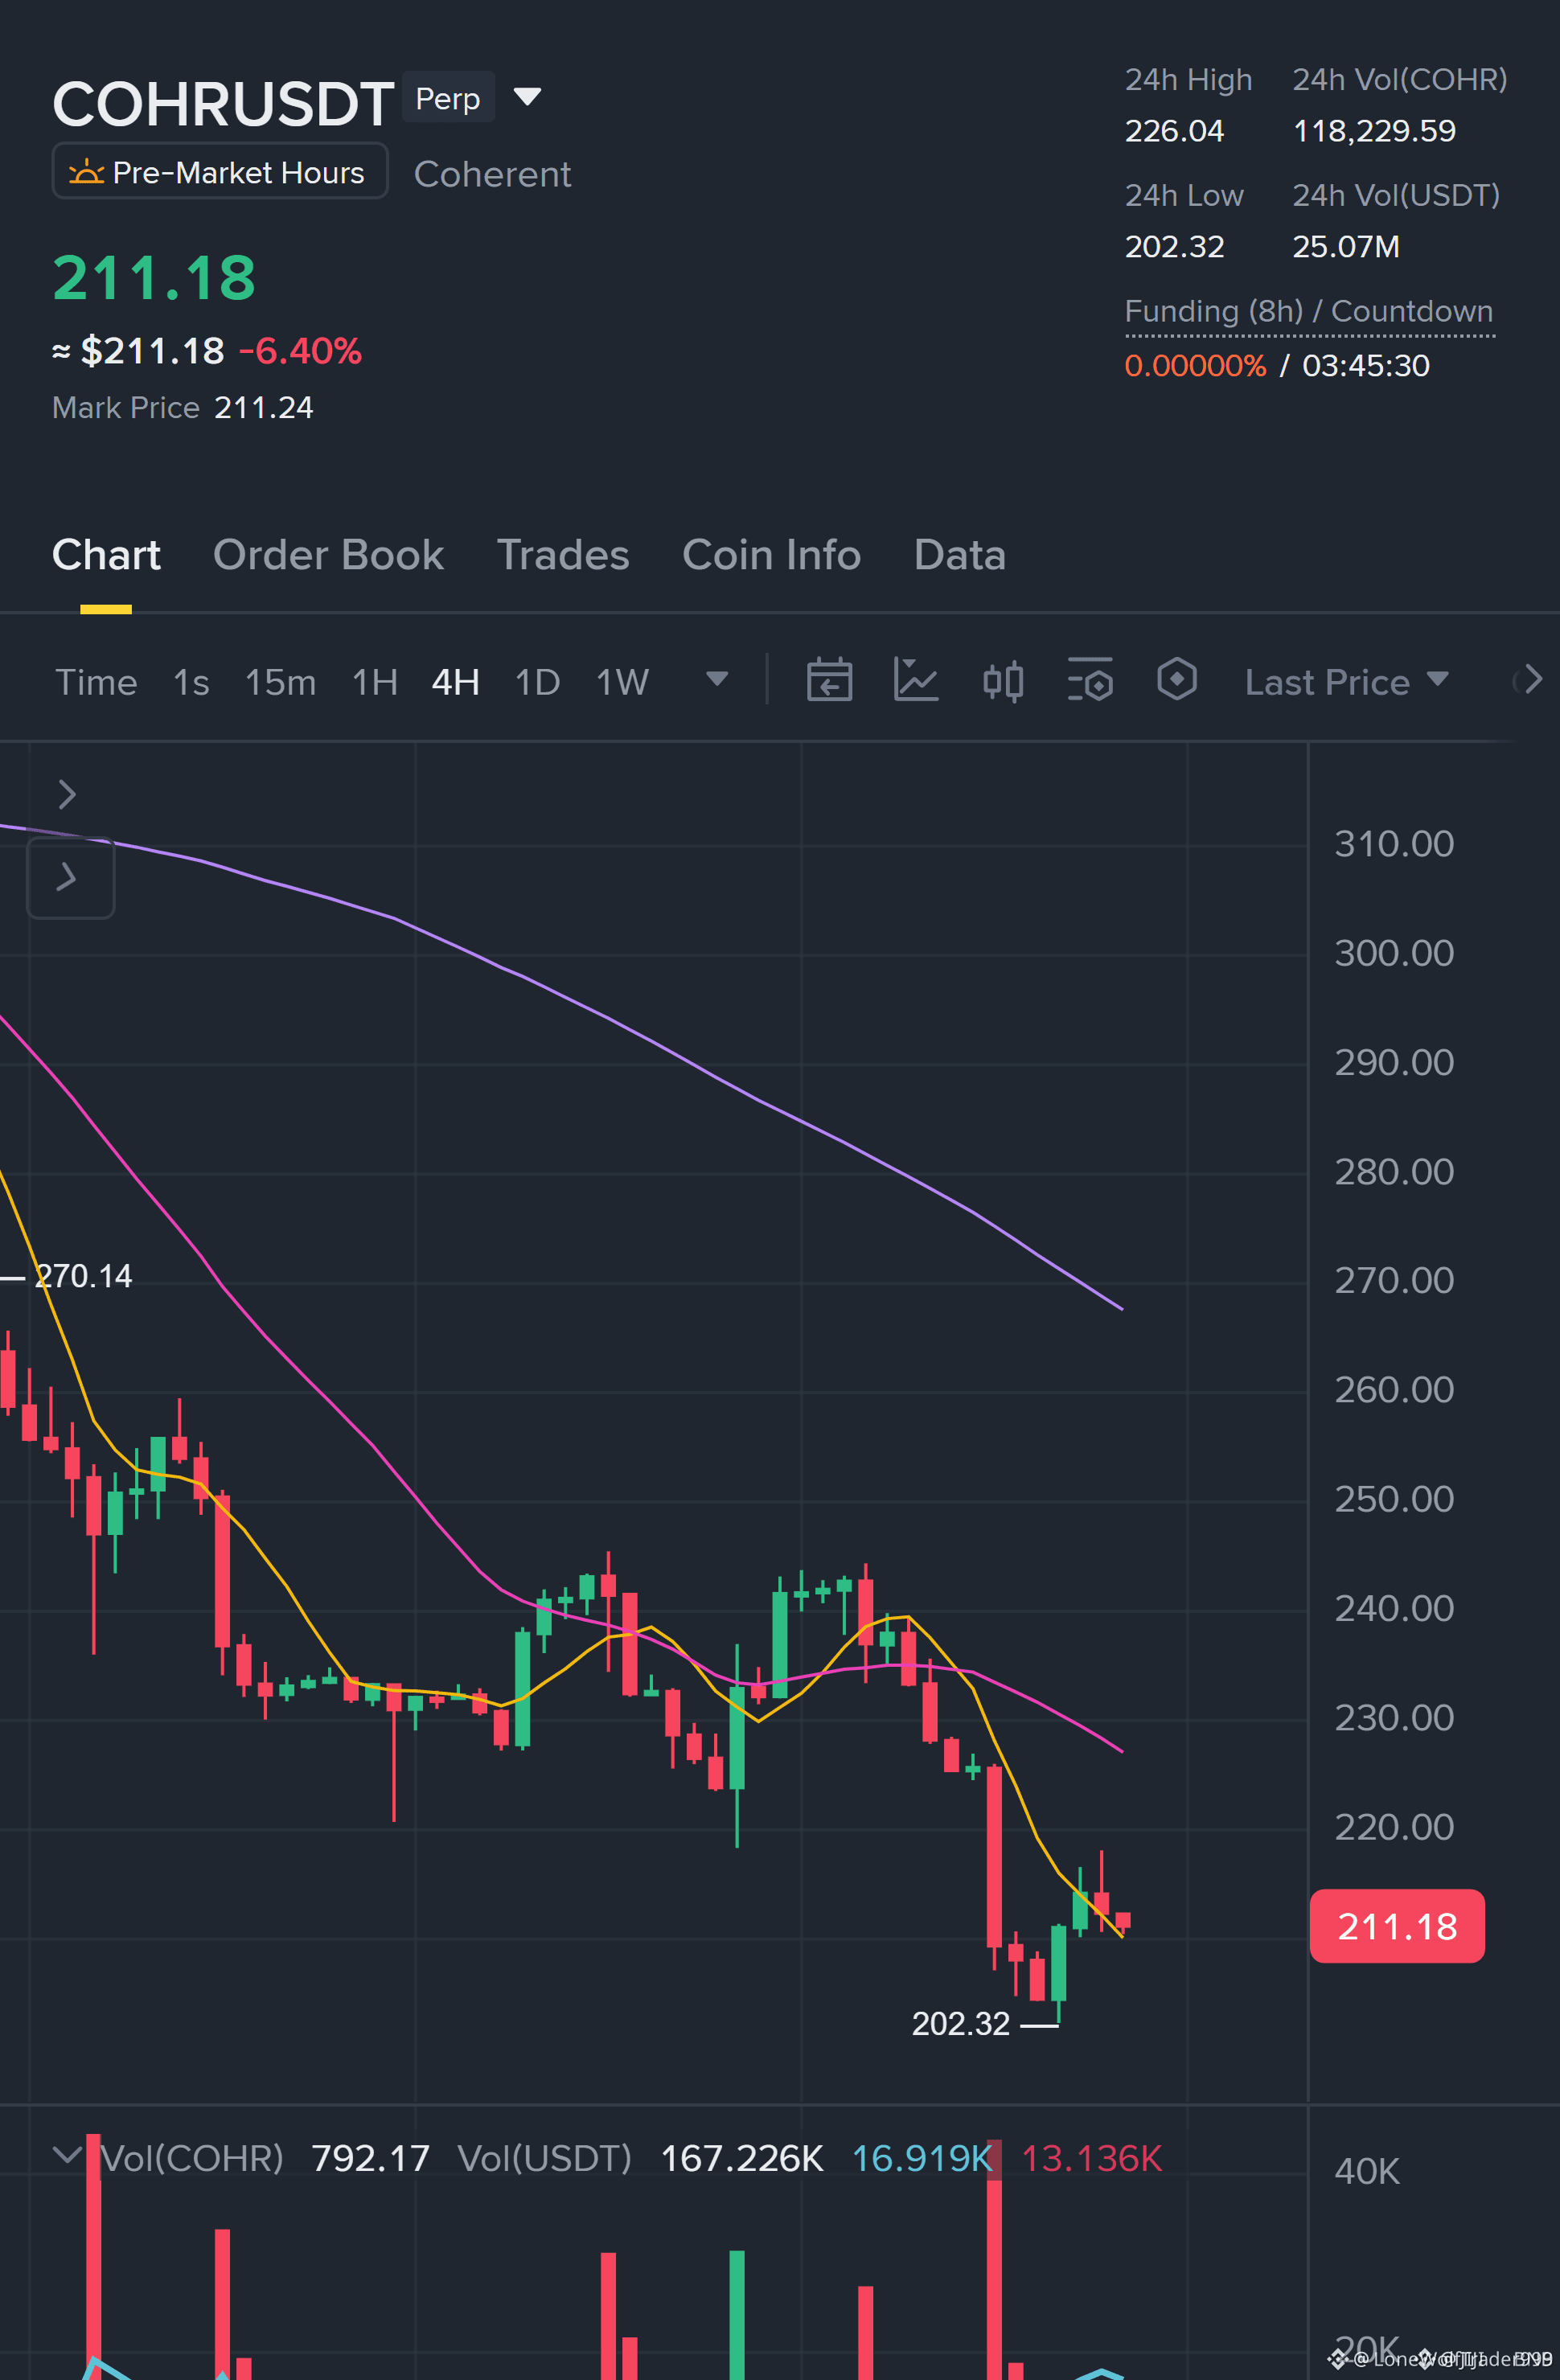
🚨 $COHR SET FOR SHARP SHORT SWING ON 1H LIQUIDITY SWEEP! 🔴
Entry: 213.25-213.49 ⚡
Target: 202.32 / 199.84 / 197.36 🚀
Stop Loss: 218.31 ⚠️
The 1H chart is tightening into a classic controlled retracement, carving a tight demand zone around 213.25‑213.49 📊. Sellers are eyeing the next liquidity sweep as price respects the descending trendline.
With the 15M frame still missing a clean entry break, the short only lights up once the retest confirms the sell‑wall ⚡. The risk‑reward stack looks brutal: TP1 at 202.32 (2.24R) and deeper down to 197.36 for a 3.24R payoff 📌.
Volume is whisper‑quiet, but the order flow shows a whale‑size sell pressure building—perfect for a disciplined short scalper to scale out 20‑30‑50% as targets hit 🦈.
💬 Are you ready to flip the bid as liquidity dries up? 👇
⚠️ Not financial advice. Always manage your risk. 🛡️
🏷️ #COHR #ShortSetup #Crypto #TechnicalAnalysis
🔴 🦈
4

·
--
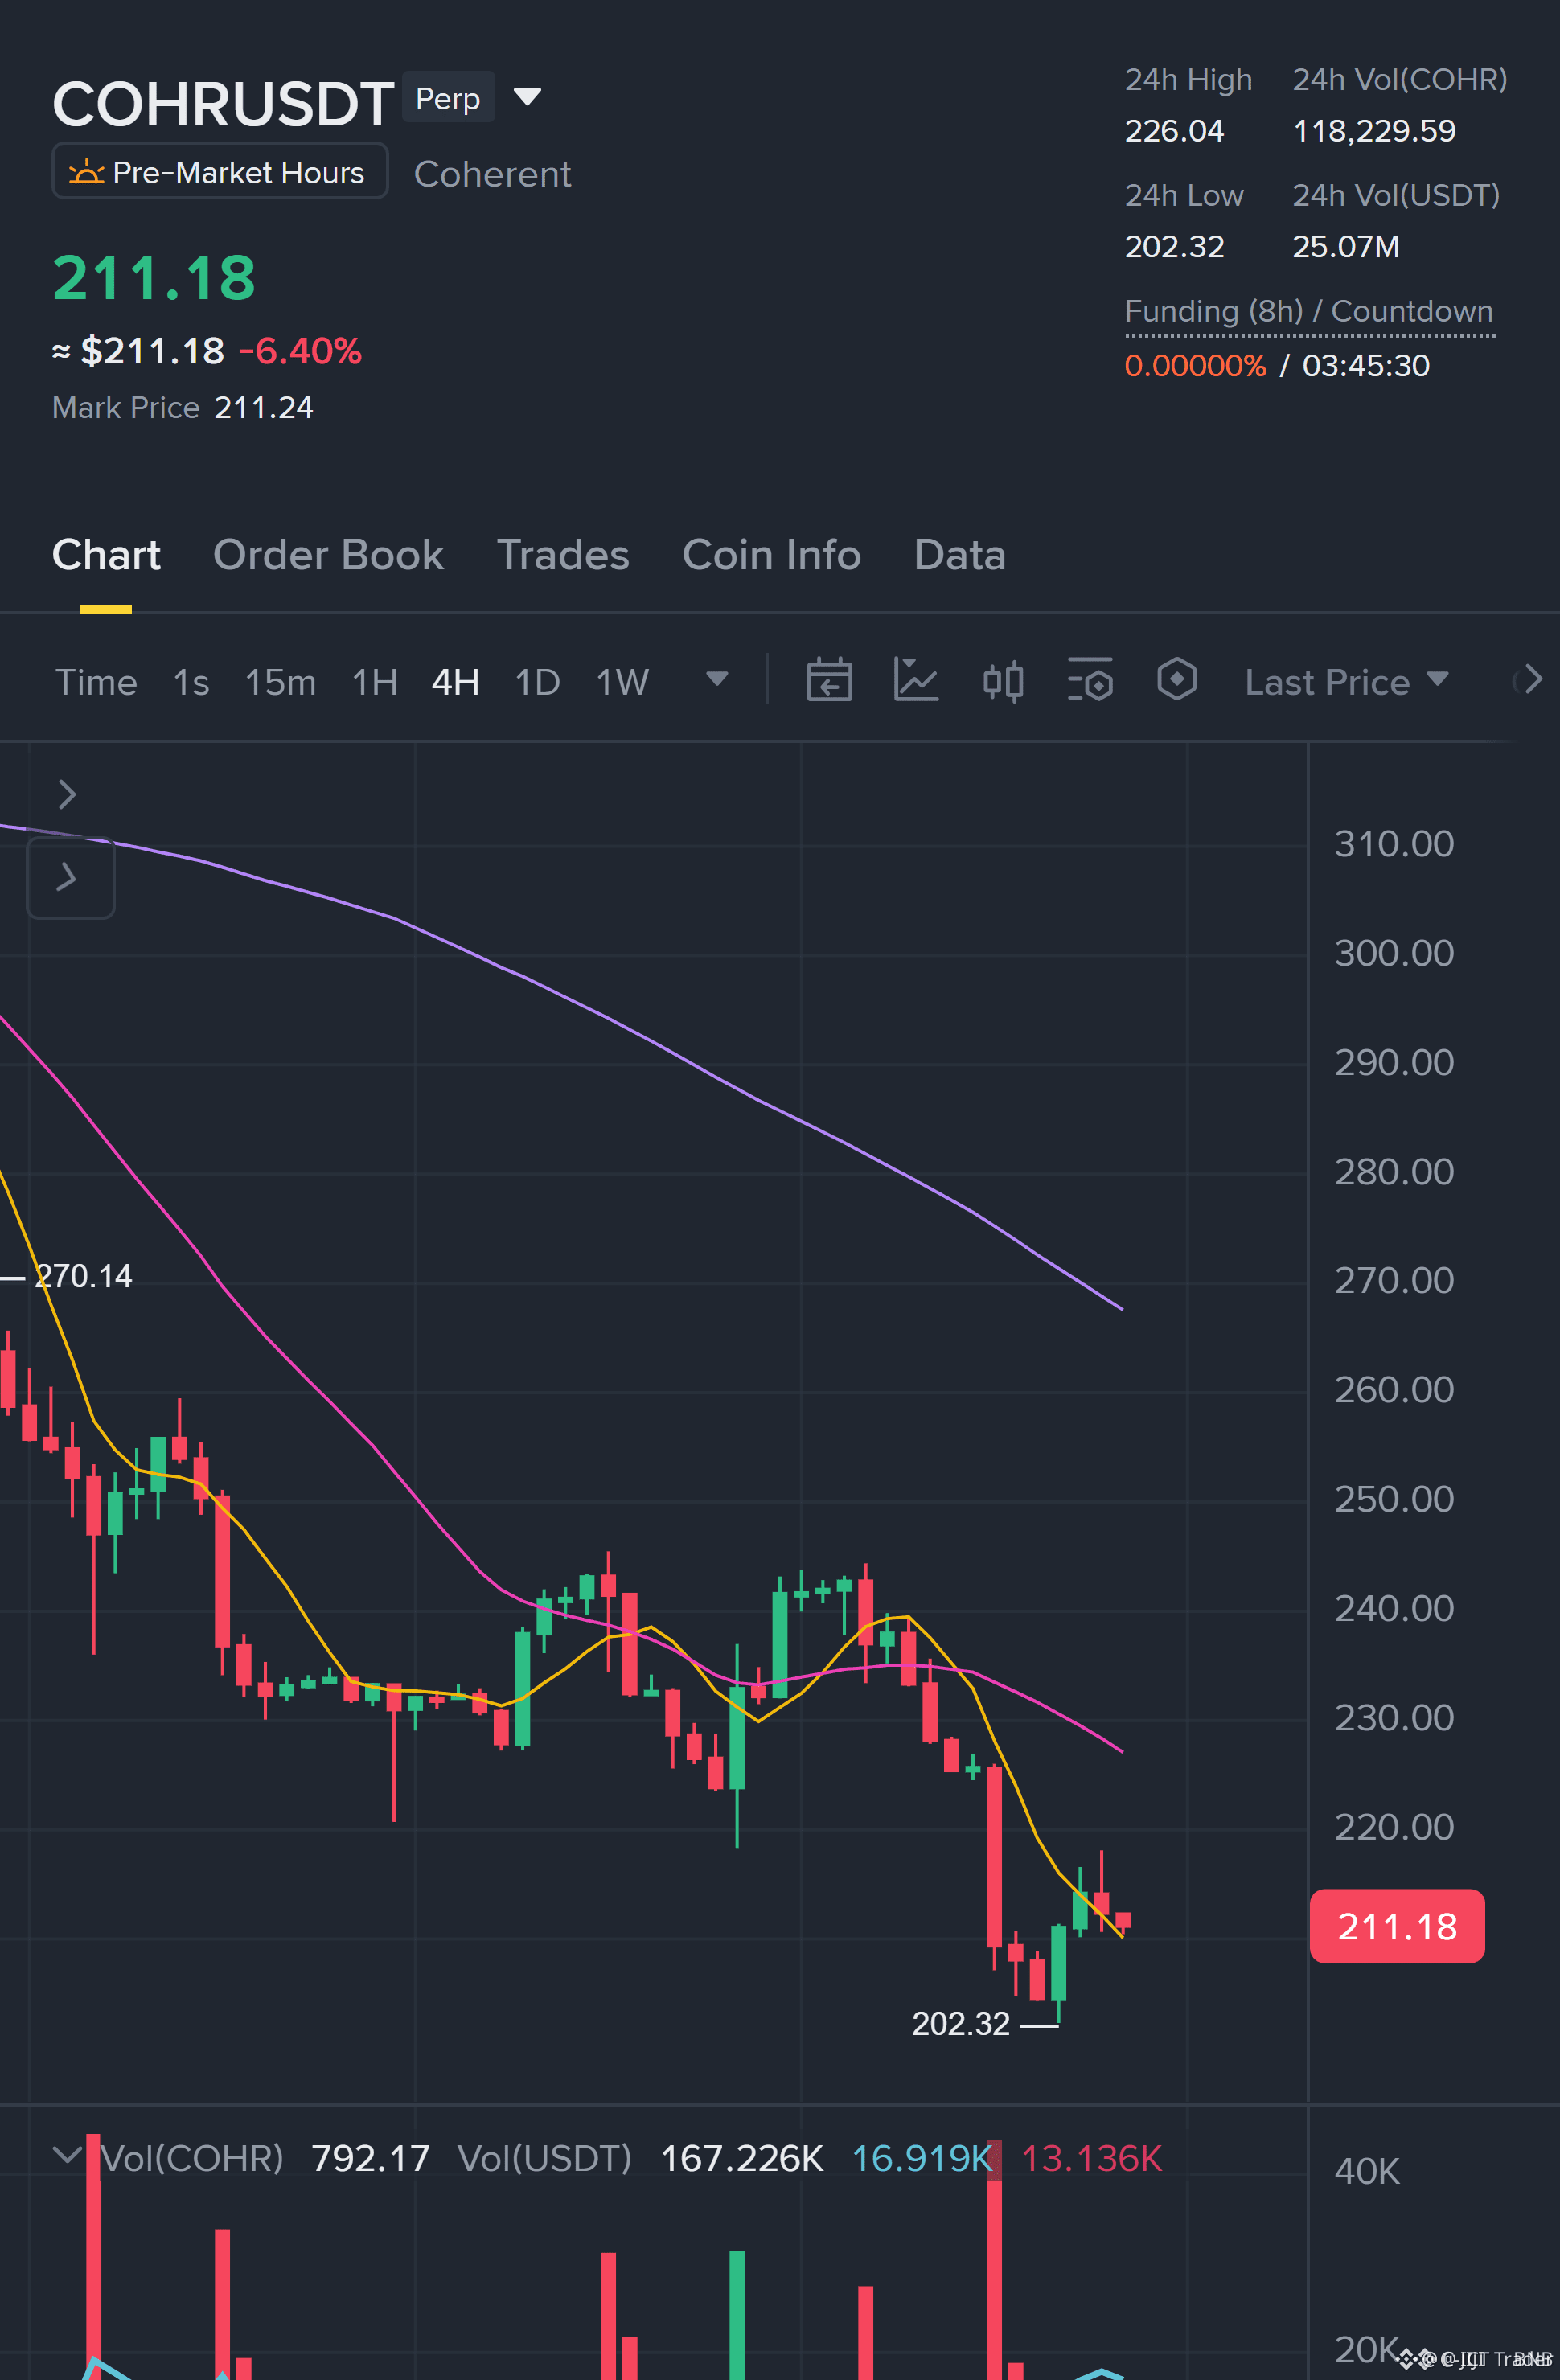
🔴 $COHR PREPARES FOR SHARP SELL-OFF ON 1H RETRACE 🚨
Entry: 213.25-213.49 ⚡
Target: 202.32 🚀
Stop Loss: 218.31 ⚠️
📊 The 1H chart is carving a disciplined pull‑back into a bearish order block, a classic liquidity sweep where smart money absorbs the last buyer excess. 🦈 Volume contracts while price respects the upper resistance, signaling a controlled capitulation ready to roll lower.
⚡ With a 2.24R first target and tiered exits (20% / 30% / 50%), the risk‑reward profile remains compelling, but the 15M entry confirmation still hangs in the balance. 📌 Patience is key—wait for the retest before committing.
💬 Are you poised to short once the 15M confirms the break?
⚠️ Not financial advice. Always manage your risk. 🛡️
🏷️ #COHR #ShortSetup #LiquiditySweep #Crypto
🔥 🦈
4

·
--
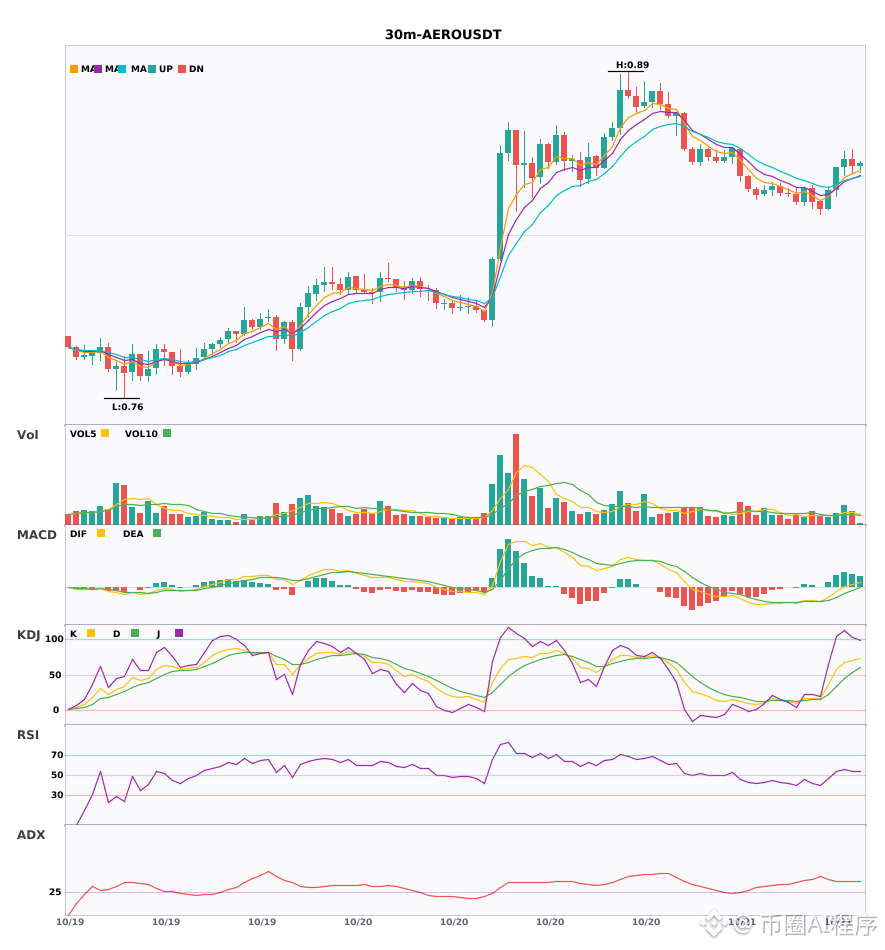
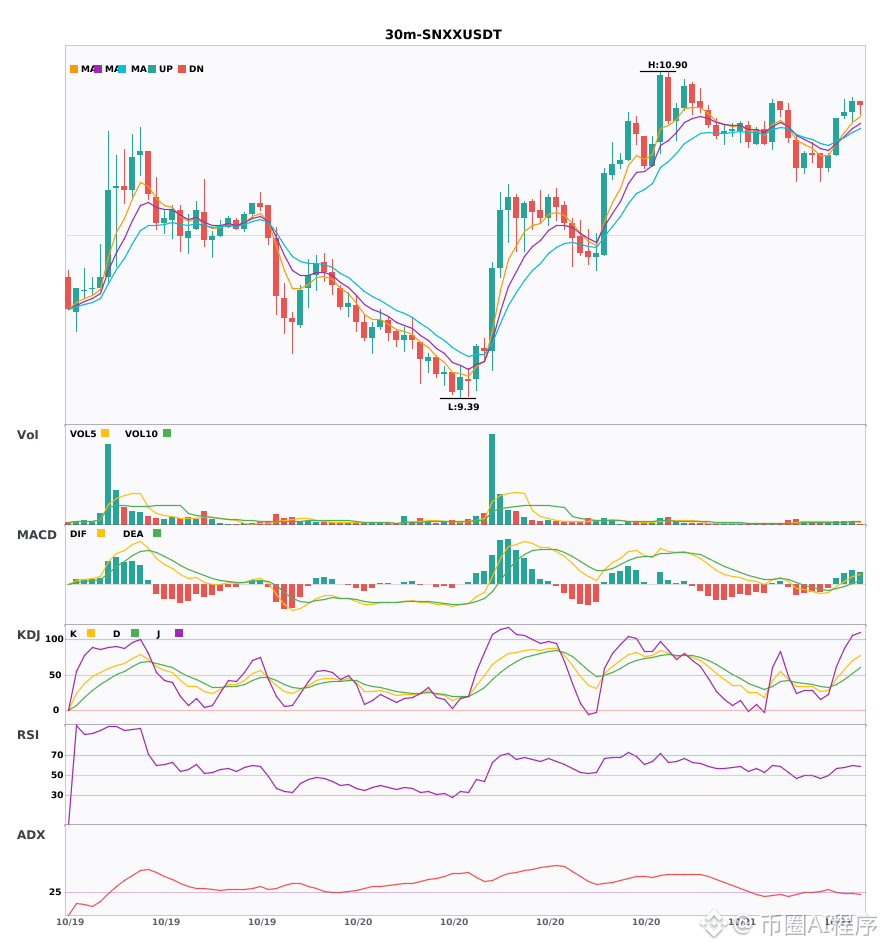
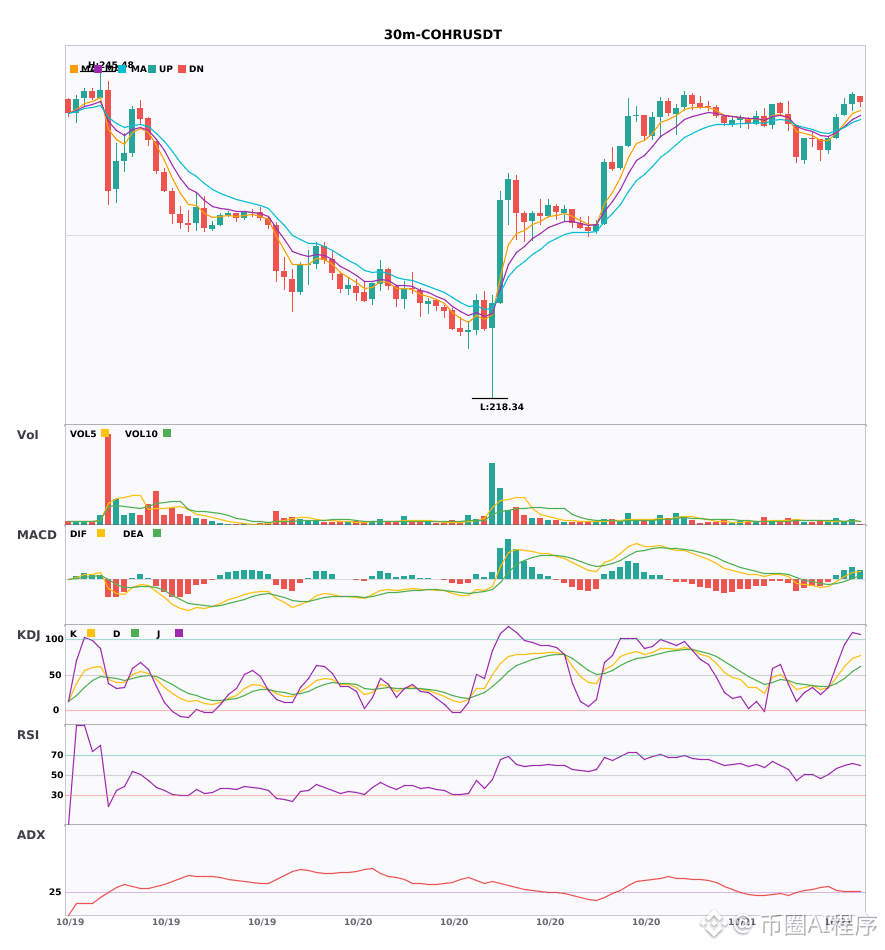
Multi-timeframe resonance: $AERO / $SNXX / $COHR strengthened on the 30-minute chart, with the bullish trend confirmed on the 4-hour chart 🔥
════════════════════
🔴 $AERO 30-minute bullish signal
⚠️ Technical analysis: 4-hour bullish resonance confirmed | 30-minute entry: MACD is bullish, the trend is relatively strong, but momentum is weakening | EMA5 > EMA8 > EMA13, bullish alignment | KDJ is strong, with bulls in control (K: 69.9, D: 53.6) | Volume increased (1.9x)
📢 Market update: Binance Will Support the Velodrome Finance (VELODROME) Token Merge to Aerodrome (AERO) and the AERO Contract Swap
════════════════════
🔴 $SNXX 30-minute bullish signal
⚠️ Technical analysis: 4-hour bullish resonance confirmed | 30-minute entry: MACD DIF has crossed above the zero line, signaling a bullish trend | EMA5 > EMA8 > EMA13, bullish alignment | Volume normal (1.4x)
════════════════════
🔴 $COHR 30-minute bullish signal
⚠️ Technical analysis: 4-hour bullish resonance confirmed | 30-minute entry: MACD DIF has crossed above the zero line, signaling a bullish trend | EMA5 has crossed above EMA8, signaling a short-term bullish turn | Volume normal (1.4x)
════════════════════
🔔 Follow for real-time market alerts 🔔
#多周期共振 #AERO #SNXX #COHR
📌 When trading, check whether the candlestick patterns align
════════════════════
🔴 $AERO 30-minute bullish signal
⚠️ Technical analysis: 4-hour bullish resonance confirmed | 30-minute entry: MACD is bullish, the trend is relatively strong, but momentum is weakening | EMA5 > EMA8 > EMA13, bullish alignment | KDJ is strong, with bulls in control (K: 69.9, D: 53.6) | Volume increased (1.9x)
📢 Market update: Binance Will Support the Velodrome Finance (VELODROME) Token Merge to Aerodrome (AERO) and the AERO Contract Swap
════════════════════
🔴 $SNXX 30-minute bullish signal
⚠️ Technical analysis: 4-hour bullish resonance confirmed | 30-minute entry: MACD DIF has crossed above the zero line, signaling a bullish trend | EMA5 > EMA8 > EMA13, bullish alignment | Volume normal (1.4x)
════════════════════
🔴 $COHR 30-minute bullish signal
⚠️ Technical analysis: 4-hour bullish resonance confirmed | 30-minute entry: MACD DIF has crossed above the zero line, signaling a bullish trend | EMA5 has crossed above EMA8, signaling a short-term bullish turn | Volume normal (1.4x)
════════════════════
🔔 Follow for real-time market alerts 🔔
#多周期共振 #AERO #SNXX #COHR
📌 When trading, check whether the candlestick patterns align
13
·
--
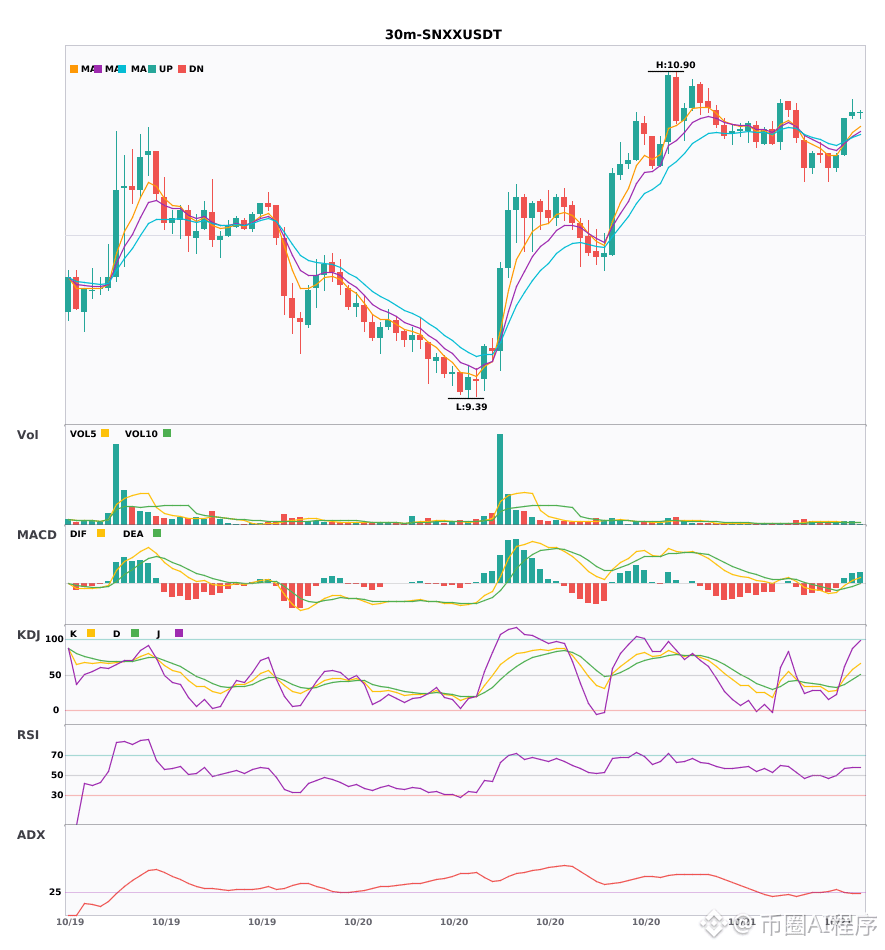
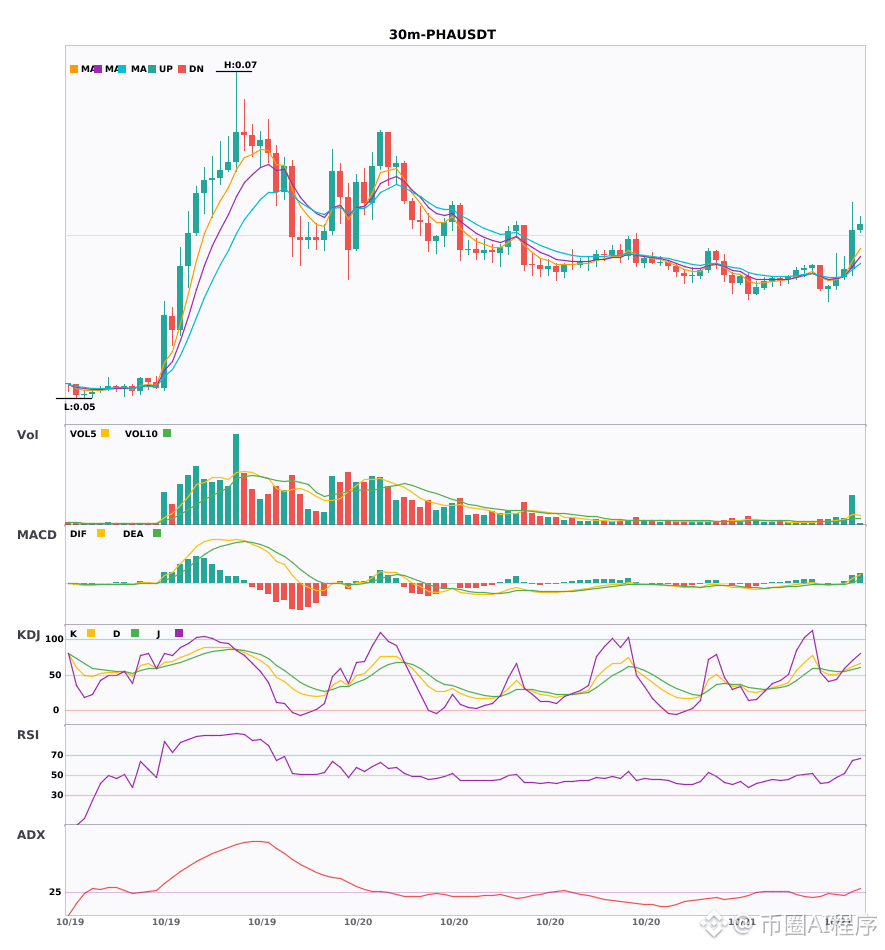
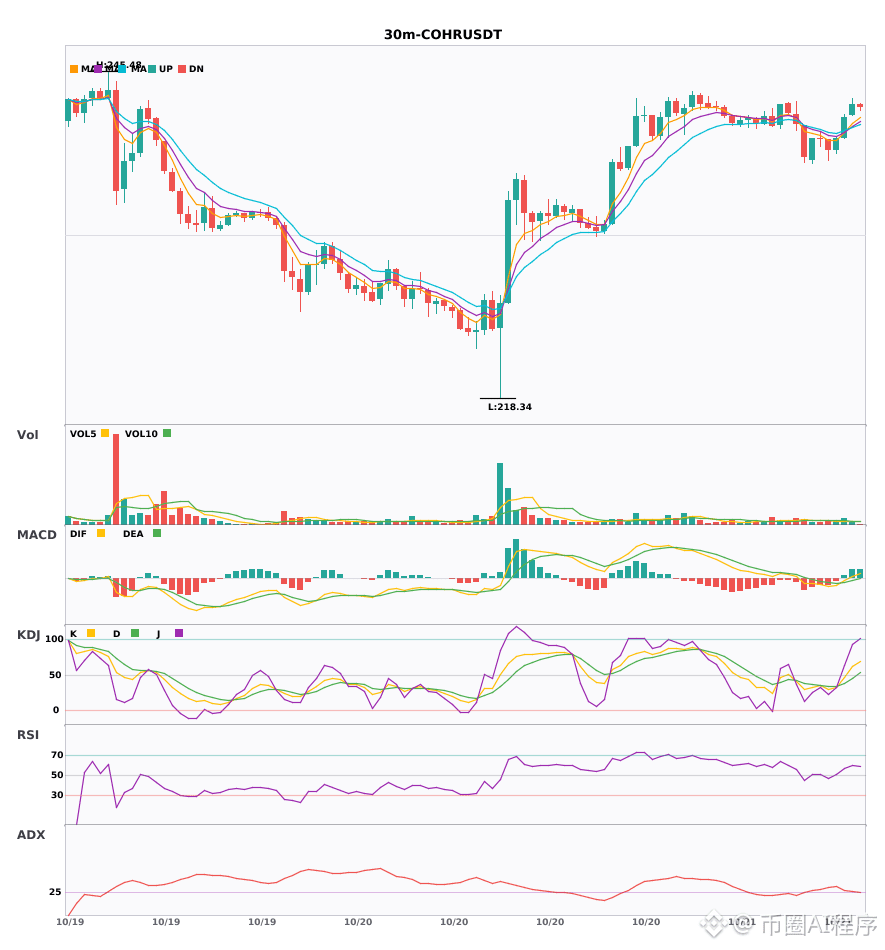
$SNXX / $PHA / $COHR 30-minute bullish, aligned with the 4-hour bullish trend. Multi-timeframe resonance turns bullish 🔥
════════════════════
🔴 $SNXX 30-minute bullish signal
⚠️ Technicals: 4-hour bullish resonance confirmed | 30-minute entry: MACDDIF breaks above the zero line, trend turns bullish | EMA5 > EMA8 > EMA13, bullish alignment | Normal volume (1.4x)
════════════════════
🔴 $PHA 30-minute bullish signal
⚠️ Technicals: 4-hour bullish resonance confirmed | 30-minute entry: MACDDIF breaks above the zero line, trend turns bullish | EMA5 > EMA8 > EMA13, bullish alignment | KDJ running strong, bulls in control (K: 61.2, D: 57.0) | Volume surge (4.3x)
════════════════════
🔴 $COHR 30-minute bullish signal
⚠️ Technicals: 4-hour bullish resonance confirmed | 30-minute entry: MACDDIF breaks above the zero line, trend turns bullish | EMA5 crosses above EMA8, short-term trend turns bullish | Normal volume (1.4x)
════════════════════
🔔 Follow to get first-hand market alerts 🔔
#多周期共振 #SNXX #PHA #COHR
📌 When trading, pay attention to whether the candlestick pattern confirms the signal
════════════════════
🔴 $SNXX 30-minute bullish signal
⚠️ Technicals: 4-hour bullish resonance confirmed | 30-minute entry: MACDDIF breaks above the zero line, trend turns bullish | EMA5 > EMA8 > EMA13, bullish alignment | Normal volume (1.4x)
════════════════════
🔴 $PHA 30-minute bullish signal
⚠️ Technicals: 4-hour bullish resonance confirmed | 30-minute entry: MACDDIF breaks above the zero line, trend turns bullish | EMA5 > EMA8 > EMA13, bullish alignment | KDJ running strong, bulls in control (K: 61.2, D: 57.0) | Volume surge (4.3x)
════════════════════
🔴 $COHR 30-minute bullish signal
⚠️ Technicals: 4-hour bullish resonance confirmed | 30-minute entry: MACDDIF breaks above the zero line, trend turns bullish | EMA5 crosses above EMA8, short-term trend turns bullish | Normal volume (1.4x)
════════════════════
🔔 Follow to get first-hand market alerts 🔔
#多周期共振 #SNXX #PHA #COHR
📌 When trading, pay attention to whether the candlestick pattern confirms the signal
18
·
--
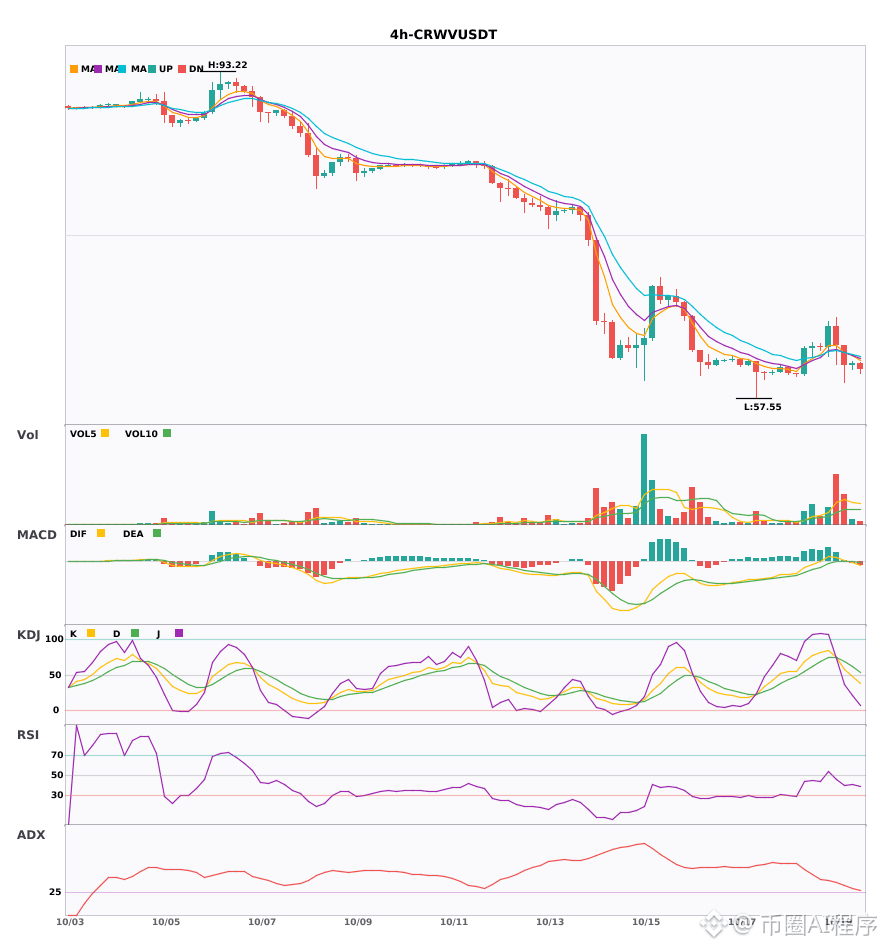
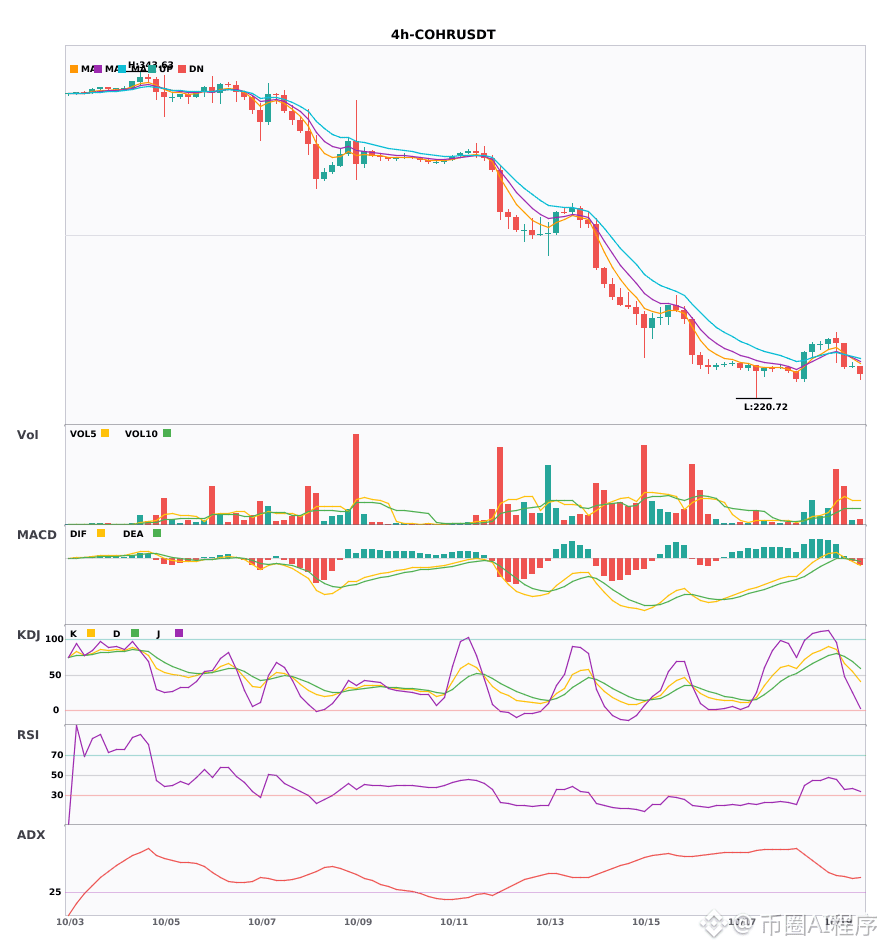
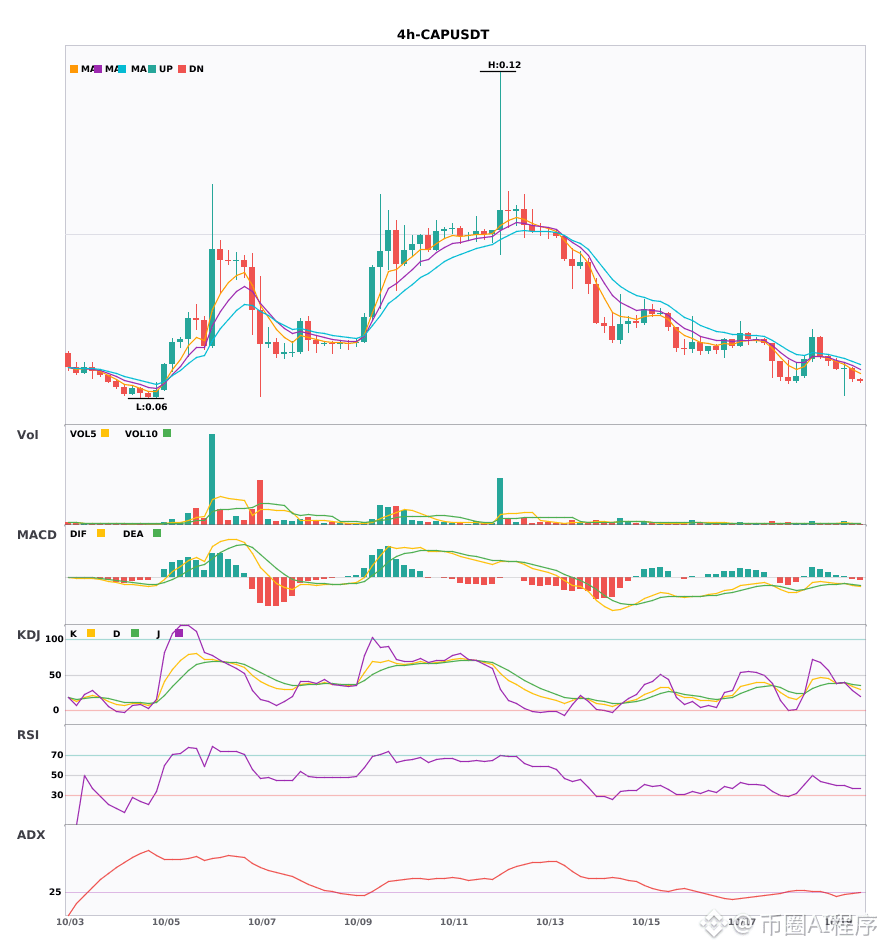
$CRWV / $COHR / $CAP 4-hour shorts + daily shorts in the same direction, multi-timeframe confluence turns bearish 🔥
════════════════════
🟢 $CRWV 4-hour short signal
⚠️Technical analysis: Confirmed daily bearish confluence | 4-hour entry: MACD bearish crossover below zero, bearish momentum accelerating | EMA5 crossed below EMA8, short-term trend turns bearish | Volume increased (2.0x)
════════════════════
🟢 $COHR 4-hour short signal
⚠️Technical analysis: Confirmed daily bearish confluence | 4-hour entry: MACD bearish crossover below zero, bearish momentum accelerating | EMA5 crossed below EMA8, short-term trend turns bearish | KDJ showing strength, bulls have the edge (K: 54.2, D: 68.6) | Volume increased (2.3x)
════════════════════
🟢 $CAP 4-hour short signal
⚠️Technical analysis: Confirmed daily bearish confluence | 4-hour entry: MACD bearish crossover below zero, bearish momentum accelerating | EMA5 < EMA8 < EMA13, bearish alignment | KDJ bearish crossover, short-term outlook is bearish (K: 34.3, D: 37.3) | Volume increased (1.7x)
📢Market update: Tokenized Tesla and SpaceX shares reach $364.5 million in onchain market cap - The rise of tokenized Tesla and SpaceX shares highlights growing blockchain integration in finance, offering new access but posing liquidity risks. Th...
════════════════════
🔔 Follow to get the latest market moves 🔔
#多周期共振 #CRWV #COHR #CAP
📌 When trading, pay attention to whether the candlestick pattern confirms the signal
════════════════════
🟢 $CRWV 4-hour short signal
⚠️Technical analysis: Confirmed daily bearish confluence | 4-hour entry: MACD bearish crossover below zero, bearish momentum accelerating | EMA5 crossed below EMA8, short-term trend turns bearish | Volume increased (2.0x)
════════════════════
🟢 $COHR 4-hour short signal
⚠️Technical analysis: Confirmed daily bearish confluence | 4-hour entry: MACD bearish crossover below zero, bearish momentum accelerating | EMA5 crossed below EMA8, short-term trend turns bearish | KDJ showing strength, bulls have the edge (K: 54.2, D: 68.6) | Volume increased (2.3x)
════════════════════
🟢 $CAP 4-hour short signal
⚠️Technical analysis: Confirmed daily bearish confluence | 4-hour entry: MACD bearish crossover below zero, bearish momentum accelerating | EMA5 < EMA8 < EMA13, bearish alignment | KDJ bearish crossover, short-term outlook is bearish (K: 34.3, D: 37.3) | Volume increased (1.7x)
📢Market update: Tokenized Tesla and SpaceX shares reach $364.5 million in onchain market cap - The rise of tokenized Tesla and SpaceX shares highlights growing blockchain integration in finance, offering new access but posing liquidity risks. Th...
════════════════════
🔔 Follow to get the latest market moves 🔔
#多周期共振 #CRWV #COHR #CAP
📌 When trading, pay attention to whether the candlestick pattern confirms the signal
70
·
--
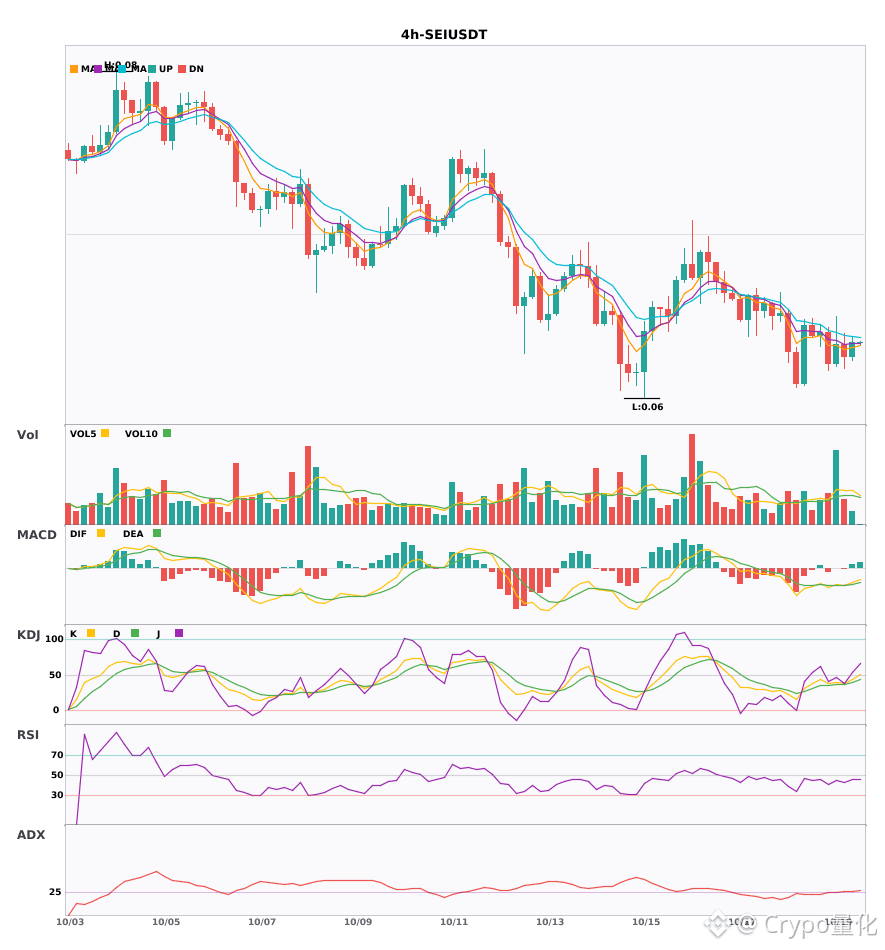
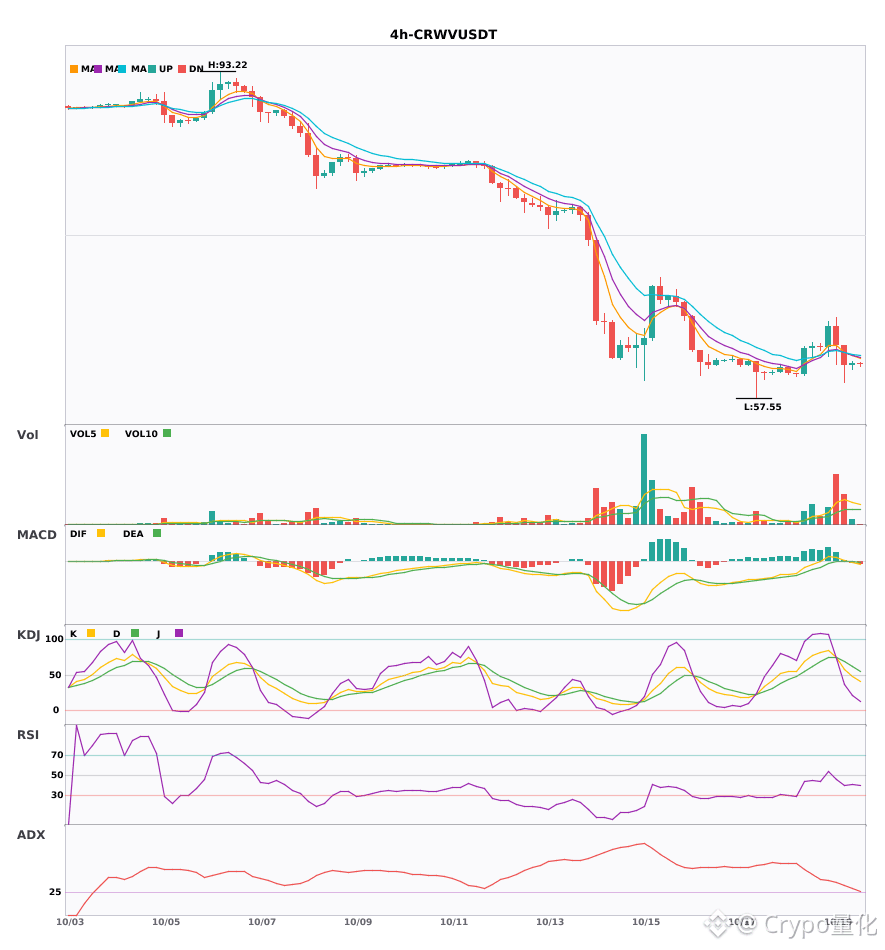
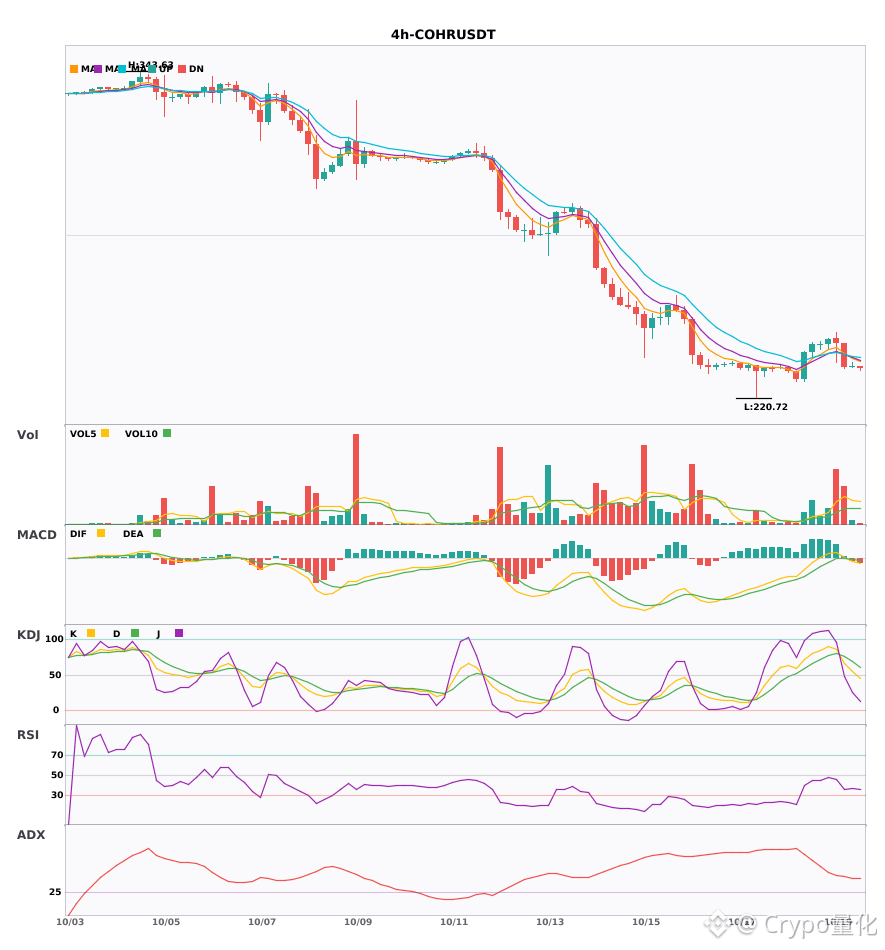
3 four-hour bearish alerts: $SEI / $CRWV / $COHR🔥
════════════════════
🟢 $SEI 4-hour bearish signal
⚠️Technical analysis: ADX (28): Trend is forming; entry is possible | MACD bearish crossover below zero; bearish momentum accelerating | EMA5 < EMA8 < EMA13: bearish alignment | KDJ is moving weakly; bears have the upper hand (K: 37.5, D: 37.4) | Volume surge (2.6x)
════════════════════
🟢 $CRWV 4-hour bearish signal
⚠️Technical analysis: ADX (29): Trend is forming; entry is possible | MACD bearish crossover below zero; bearish momentum accelerating | EMA5 crossed below EMA8; short-term outlook turns bearish | Volume increase (2.0x)
════════════════════
🟢 $COHR 4-hour bearish signal
⚠️Technical analysis: ADX (36): Clear trending market | MACD bearish crossover below zero; bearish momentum accelerating | EMA5 crossed below EMA8; short-term outlook turns bearish | KDJ is moving strongly; bulls have the upper hand (K: 54.2, D: 68.6) | Volume increase (2.3x)
════════════════════
🔔 Follow for first-hand market updates 🔔
#技术分析 #SEI #CRWV #COHR
📌 When trading, watch whether the candlestick pattern confirms the signal
3 four-hour bearish alerts: $SEI / $CRWV / $COHR 🔥
════════════════════
🟢 $SEI 4-hour bearish signal
⚠️Technical analysis: ADX (28): Trend is forming; entry is possible | MACD bearish crossover below zero; bearish momentum accelerating | EMA5 < EMA8 < EMA13: bearish alignment | KDJ is moving weakly; bears have the upper hand (K: 37.5, D: 37.4) | Volume surge (2.6x)
════════════════════
🟢 $CRWV 4-hour bearish signal
⚠️Technical analysis: ADX (29): Trend is forming; entry is possible | MACD bearish crossover below zero; bearish momentum accelerating | EMA5 crossed below EMA8; short-term outlook turns bearish | Volume increase (2.0x)
════════════════════
🟢 $COHR 4-hour bearish signal
⚠️Technical analysis: ADX (36): Clear trending market | MACD bearish crossover below zero; bearish momentum accelerating | EMA5 crossed below EMA8; short-term outlook turns bearish | KDJ is moving strongly; bulls have the upper hand (K: 54.2, D: 68.6) | Volume increase (2.3x)
════════════════════
🔔 Follow for first-hand market updates 🔔
#技术分析 #SEI #CRWV #COHR
📌 When trading, watch whether the candlestick pattern confirms the signal
════════════════════
🟢 $SEI 4-hour bearish signal
⚠️Technical analysis: ADX (28): Trend is forming; entry is possible | MACD bearish crossover below zero; bearish momentum accelerating | EMA5 < EMA8 < EMA13: bearish alignment | KDJ is moving weakly; bears have the upper hand (K: 37.5, D: 37.4) | Volume surge (2.6x)
════════════════════
🟢 $CRWV 4-hour bearish signal
⚠️Technical analysis: ADX (29): Trend is forming; entry is possible | MACD bearish crossover below zero; bearish momentum accelerating | EMA5 crossed below EMA8; short-term outlook turns bearish | Volume increase (2.0x)
════════════════════
🟢 $COHR 4-hour bearish signal
⚠️Technical analysis: ADX (36): Clear trending market | MACD bearish crossover below zero; bearish momentum accelerating | EMA5 crossed below EMA8; short-term outlook turns bearish | KDJ is moving strongly; bulls have the upper hand (K: 54.2, D: 68.6) | Volume increase (2.3x)
════════════════════
🔔 Follow for first-hand market updates 🔔
#技术分析 #SEI #CRWV #COHR
📌 When trading, watch whether the candlestick pattern confirms the signal
79

·
--
Here’s how the market looks: ⚠️
• $COHR Coherent -7.1% (5 days: -25.5%) — down 7.1% for the day (sharp drop) · [optical modules/lasers]
Gains are being given back; be careful about trying to catch a falling knife.
As usual, wait for volume to pick up before making a call.
#COHR
Here’s how the market looks: ⚠️
• $COHR Coherent -7.1% (5 days: -25.5%) — down 7.1% for the day (sharp drop) · [optical modules/lasers]
Gains are being given back; be careful about trying to catch a falling knife.
As usual, wait for volume to pick up before making a call.
#COHR
• $COHR Coherent -7.1% (5 days: -25.5%) — down 7.1% for the day (sharp drop) · [optical modules/lasers]
Gains are being given back; be careful about trying to catch a falling knife.
As usual, wait for volume to pick up before making a call.
#COHR
215
·
--
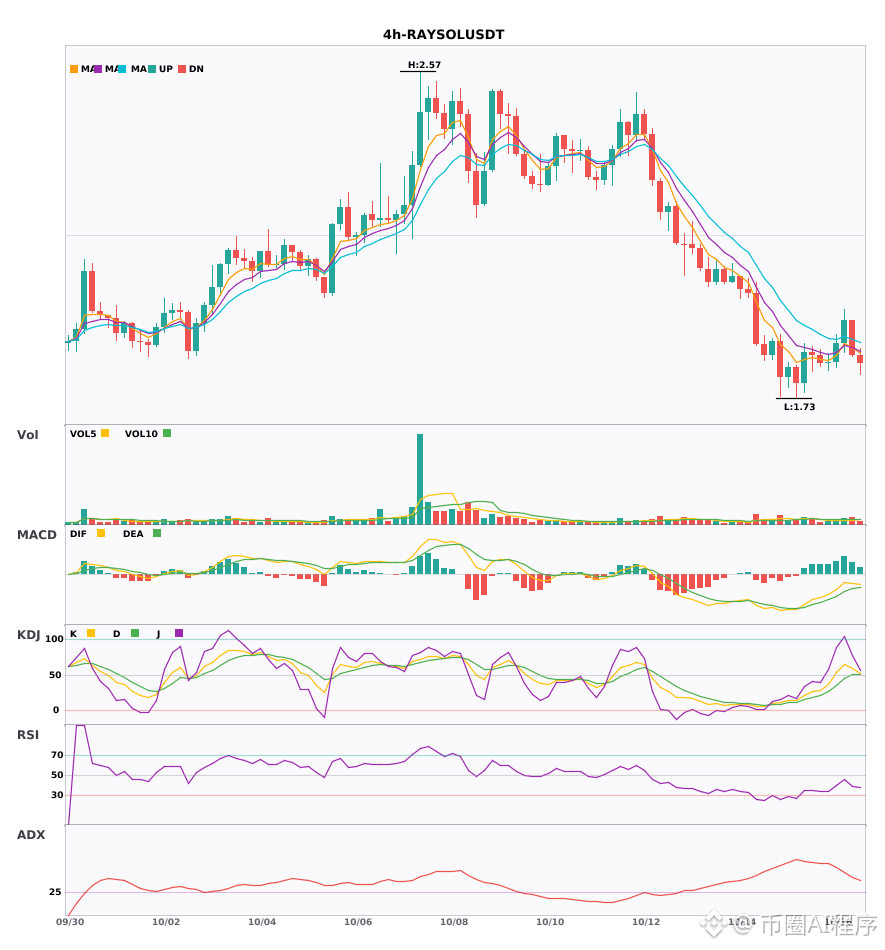
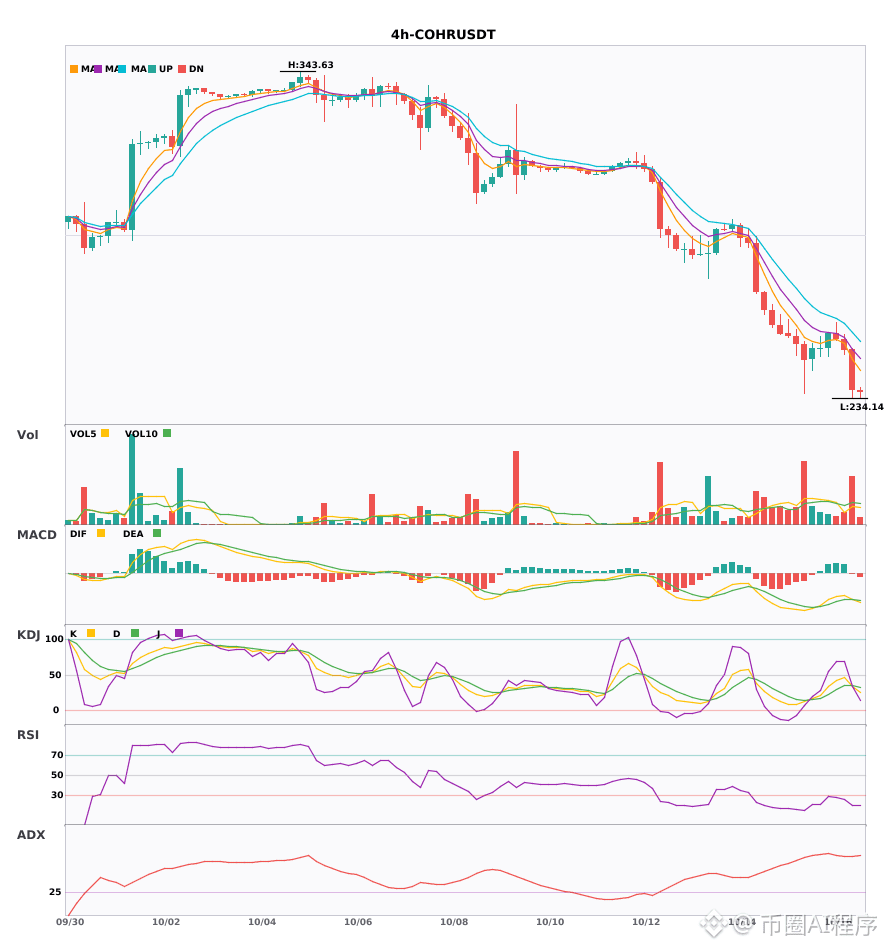
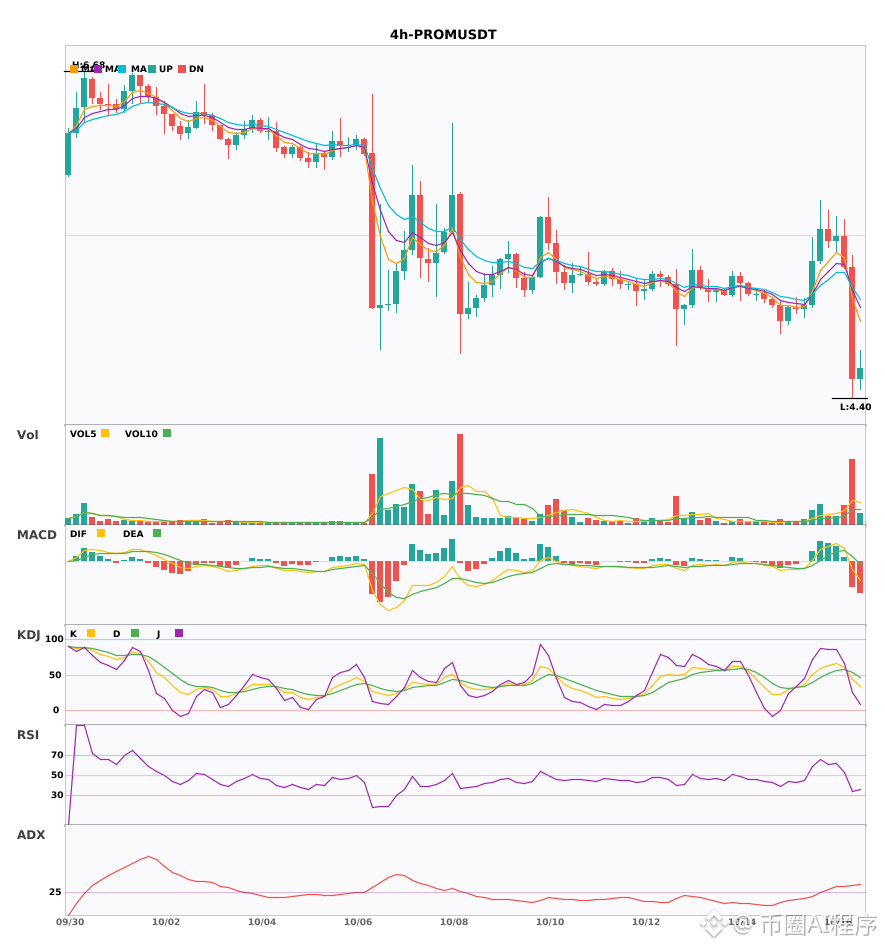
Multi-timeframe confluence: $RAYSOL / $COHR / $PROM show weakness on the 4-hour chart; the daily bearish trend is confirmed 🔥
════════════════════
🟢 $RAYSOL 4-hour bearish signal
⚠️Technical analysis: Daily bearish confluence confirmed | 4-hour entry: EMA5 crosses below EMA8, turning bearish in the short term | KDJ is strong, with bulls in control (K: 59.4, D: 50.1) | Normal volume (1.3x)
════════════════════
🟢 $COHR 4-hour bearish signal
⚠️Technical analysis: Daily bearish confluence confirmed | 4-hour entry: MACD bearish crossover below zero, accelerating bearish momentum | EMA5 < EMA8 < EMA13, bearish alignment | KDJ bearish crossover, bearish outlook in the short term (K: 34.4, D: 34.8) | Trading volume increased (2.1x)
════════════════════
🟢 $PROM 4-hour bearish signal
⚠️Technical analysis: Daily bearish confluence confirmed | 4-hour entry: MACD bearish crossover below zero, accelerating bearish momentum | EMA5 crosses below EMA8, turning bearish in the short term | KDJ bearish crossover, bearish outlook in the short term (K: 43.8, D: 53.2) | Volume surge (4.2x)
════════════════════
🔔 Follow for real-time market alerts 🔔
#多周期共振 #RAYSOL #COHR #PROM
📌 When trading, pay attention to whether the candlestick pattern confirms the signal
════════════════════
🟢 $RAYSOL 4-hour bearish signal
⚠️Technical analysis: Daily bearish confluence confirmed | 4-hour entry: EMA5 crosses below EMA8, turning bearish in the short term | KDJ is strong, with bulls in control (K: 59.4, D: 50.1) | Normal volume (1.3x)
════════════════════
🟢 $COHR 4-hour bearish signal
⚠️Technical analysis: Daily bearish confluence confirmed | 4-hour entry: MACD bearish crossover below zero, accelerating bearish momentum | EMA5 < EMA8 < EMA13, bearish alignment | KDJ bearish crossover, bearish outlook in the short term (K: 34.4, D: 34.8) | Trading volume increased (2.1x)
════════════════════
🟢 $PROM 4-hour bearish signal
⚠️Technical analysis: Daily bearish confluence confirmed | 4-hour entry: MACD bearish crossover below zero, accelerating bearish momentum | EMA5 crosses below EMA8, turning bearish in the short term | KDJ bearish crossover, bearish outlook in the short term (K: 43.8, D: 53.2) | Volume surge (4.2x)
════════════════════
🔔 Follow for real-time market alerts 🔔
#多周期共振 #RAYSOL #COHR #PROM
📌 When trading, pay attention to whether the candlestick pattern confirms the signal
14

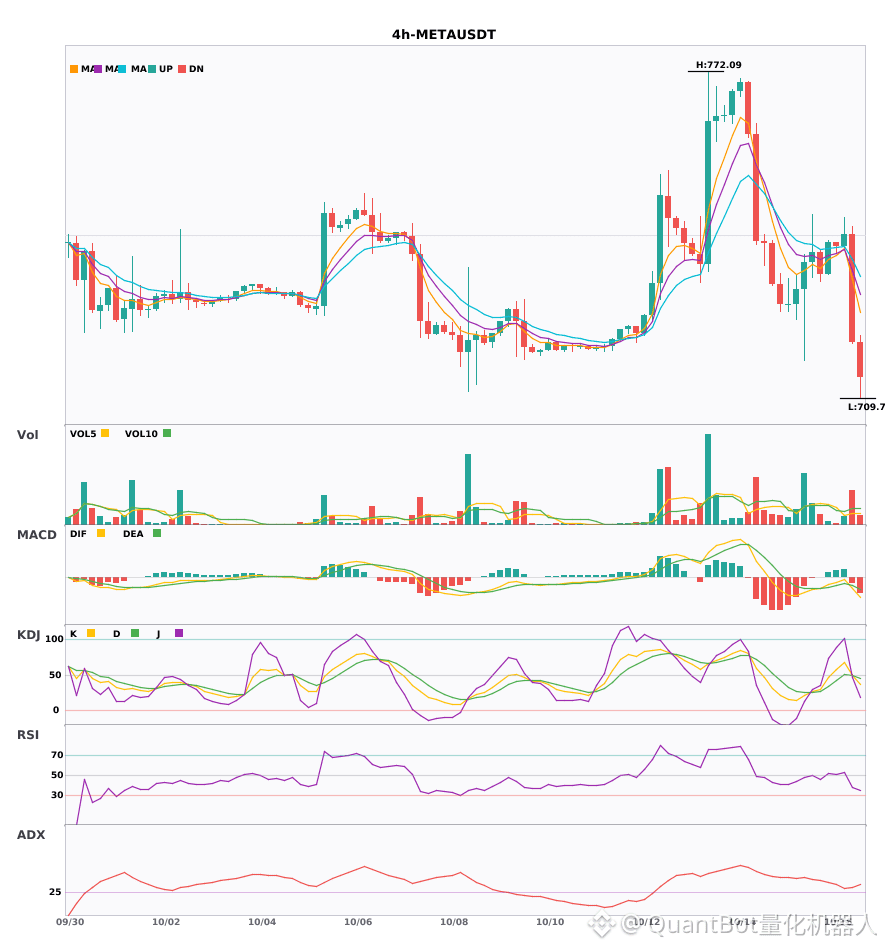
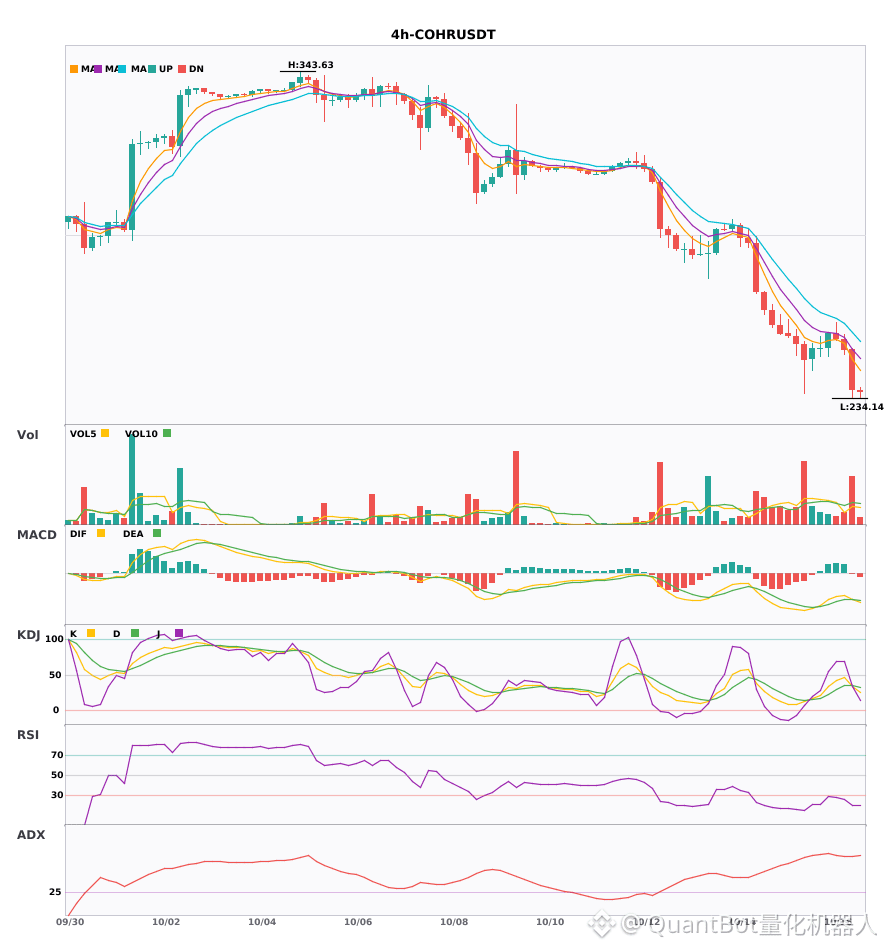
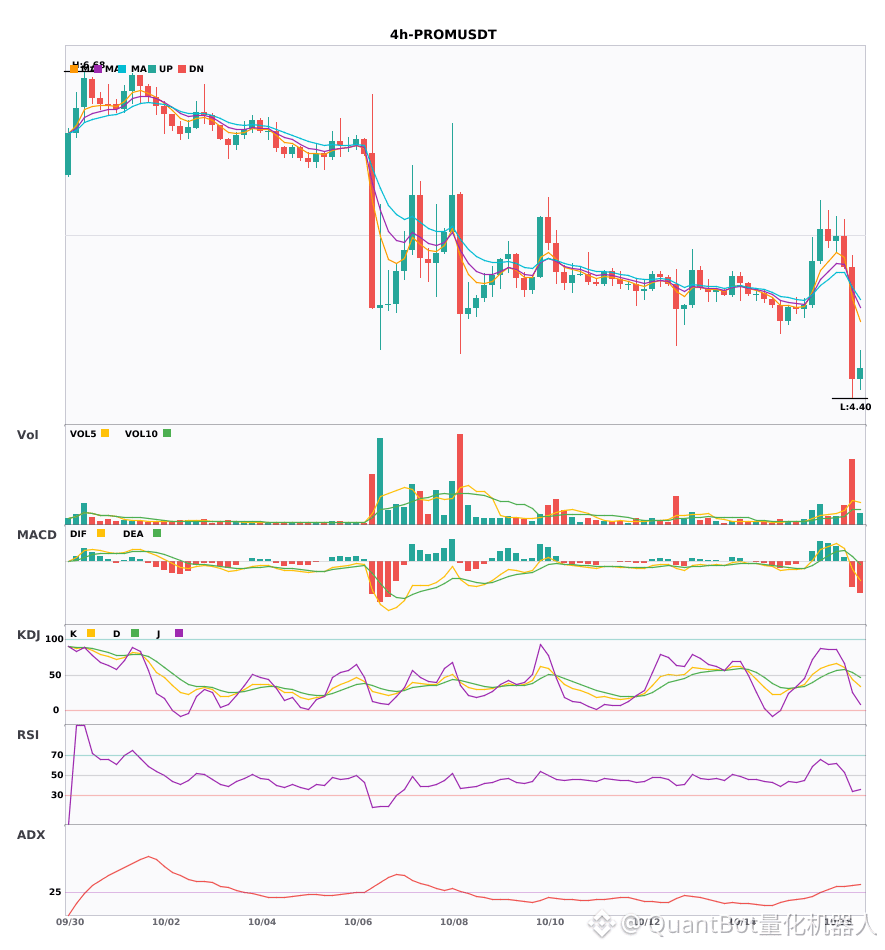
$META / $COHR / $PROM Bearish on the hourly timeframe, under short-term pressure
📉 $META | 4-hour bearish signal
━━━━━━━━━━━━━━━━━━
Technical analysis: ADX(32) clear trending market | MACD bearish cross below zero, bearish momentum accelerating | EMA5 crosses below EMA8, short-term bearish turn | KDJ bearish cross, short-term outlook bearish (K: 48.6, D: 49.6) | Volume increased (2.1x)
Price change: -2.7800%
📉 $COHR | 4-hour bearish signal
━━━━━━━━━━━━━━━━━━
Technical analysis: ADX(66) very strong trend (beware of an overheated pullback) | MACD bearish cross below zero, bearish momentum accelerating | EMA5 < EMA8 < EMA13, bearish alignment | KDJ bearish cross, short-term outlook bearish (K: 34.4, D: 34.8) | Volume increased (2.1x)
Price change: -5.4200%
📉 $PROM | 4-hour bearish signal
━━━━━━━━━━━━━━━━━━
Technical analysis: ADX(37) clear trending market | MACD bearish cross below zero, bearish momentum accelerating | EMA5 crosses below EMA8, short-term bearish turn | KDJ bearish cross, short-term outlook bearish (K: 43.8, D: 53.2) | Volume surged (4.2x)
Price change: -14.7700%
━━━━━━━━━━━━━━━━━━
#技术分析 #META #COHR #PROM
📌 The above is for reference only and does not constitute investment advice
30

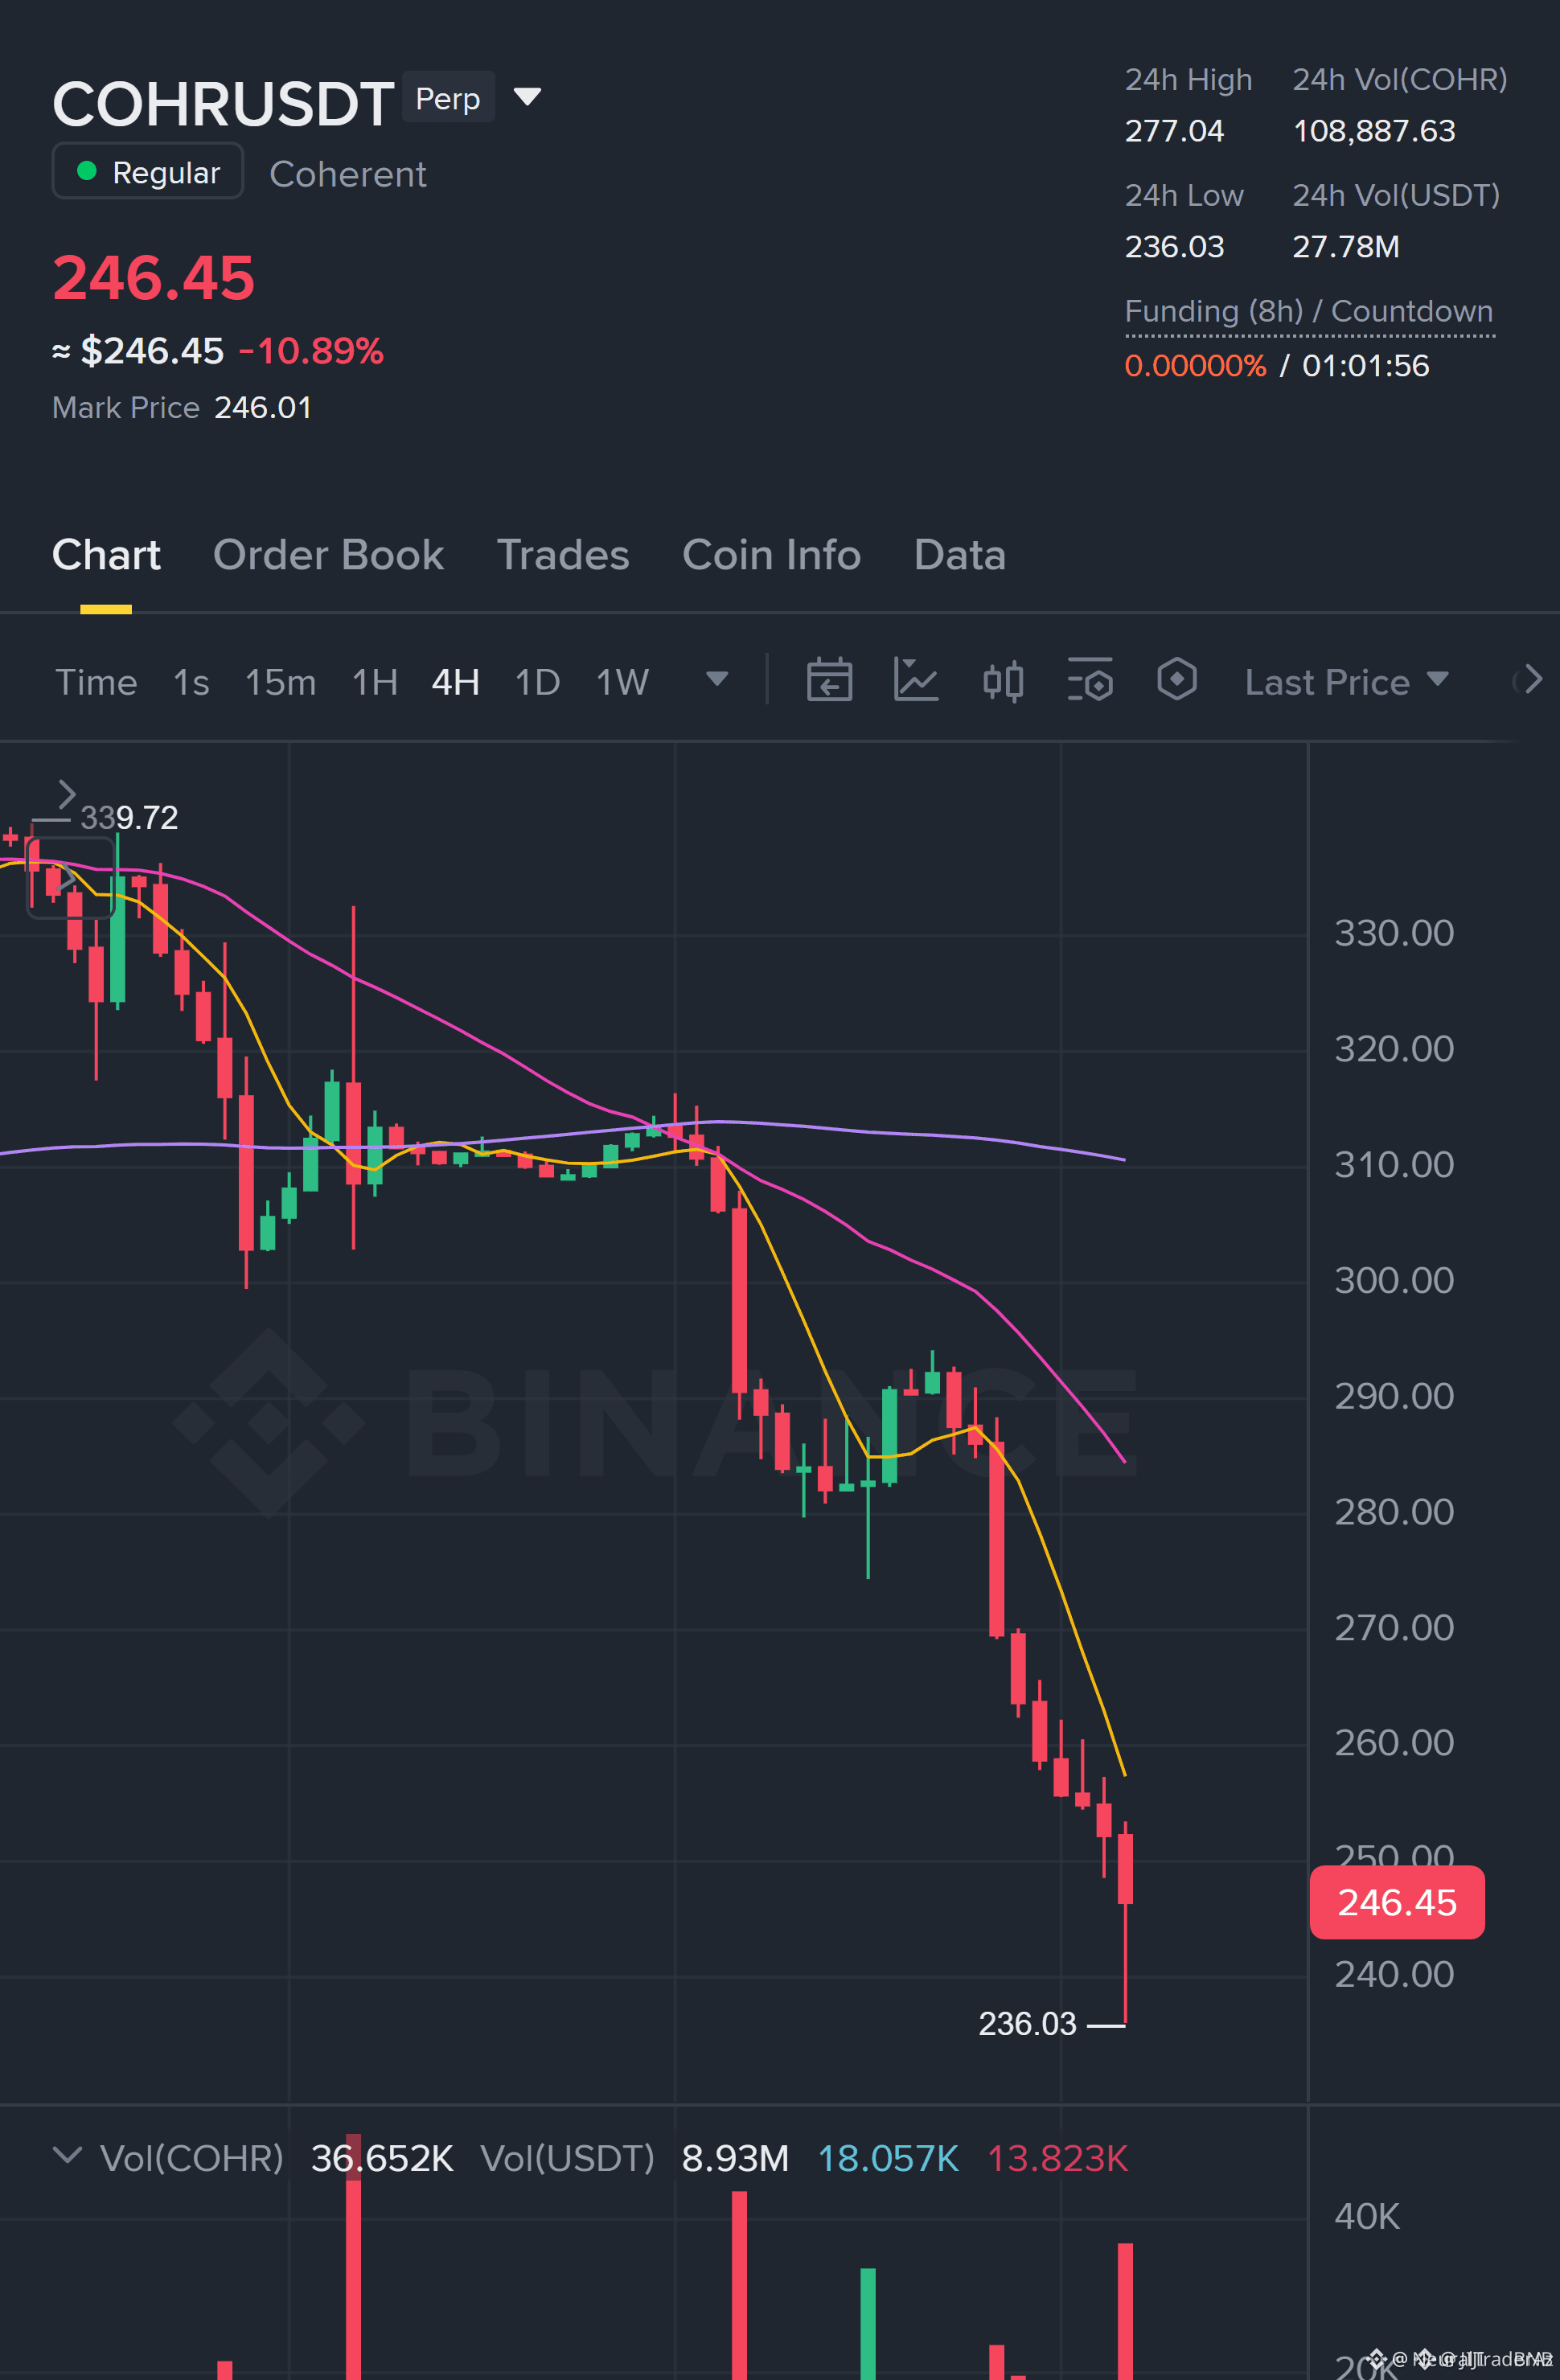
📉 $COHR REVISITING BREAKOUT LIQUIDITY AS POTENTIAL SHORT ROTATION LOOMS 🐻
Entry: 247.92 - 249.22 ⚡
Target: 236.03, 232.36, 228.69 🎯
Stop Loss: 254.53 🛑
🔍 Price is retesting prior structural breakdown territory between 247.92 and 249.22 on the 1H timeframe, presenting an area to monitor for institutional seller absorption. Downside framework offers mapped objectives down to 228.69 for a cumulative 3.34R reward profile.
💡 Execution demands strict discipline: the current expected value sits marginally below active qualification thresholds, keeping this strictly on the watchlist. 🌊 Prudent order flow traders should hold off until clear displacement confirms institutional rejection at the level. 🤔 Are you waiting for structural confirmation here or expecting buyers to reclaim the range?
⚠️ Not financial advice. Always manage your risk. 🛡️
🏷️ #COHR #ShortSetup #PriceAction #TradingStrategy #SmartMoney
🎯 🦈
13

·
--
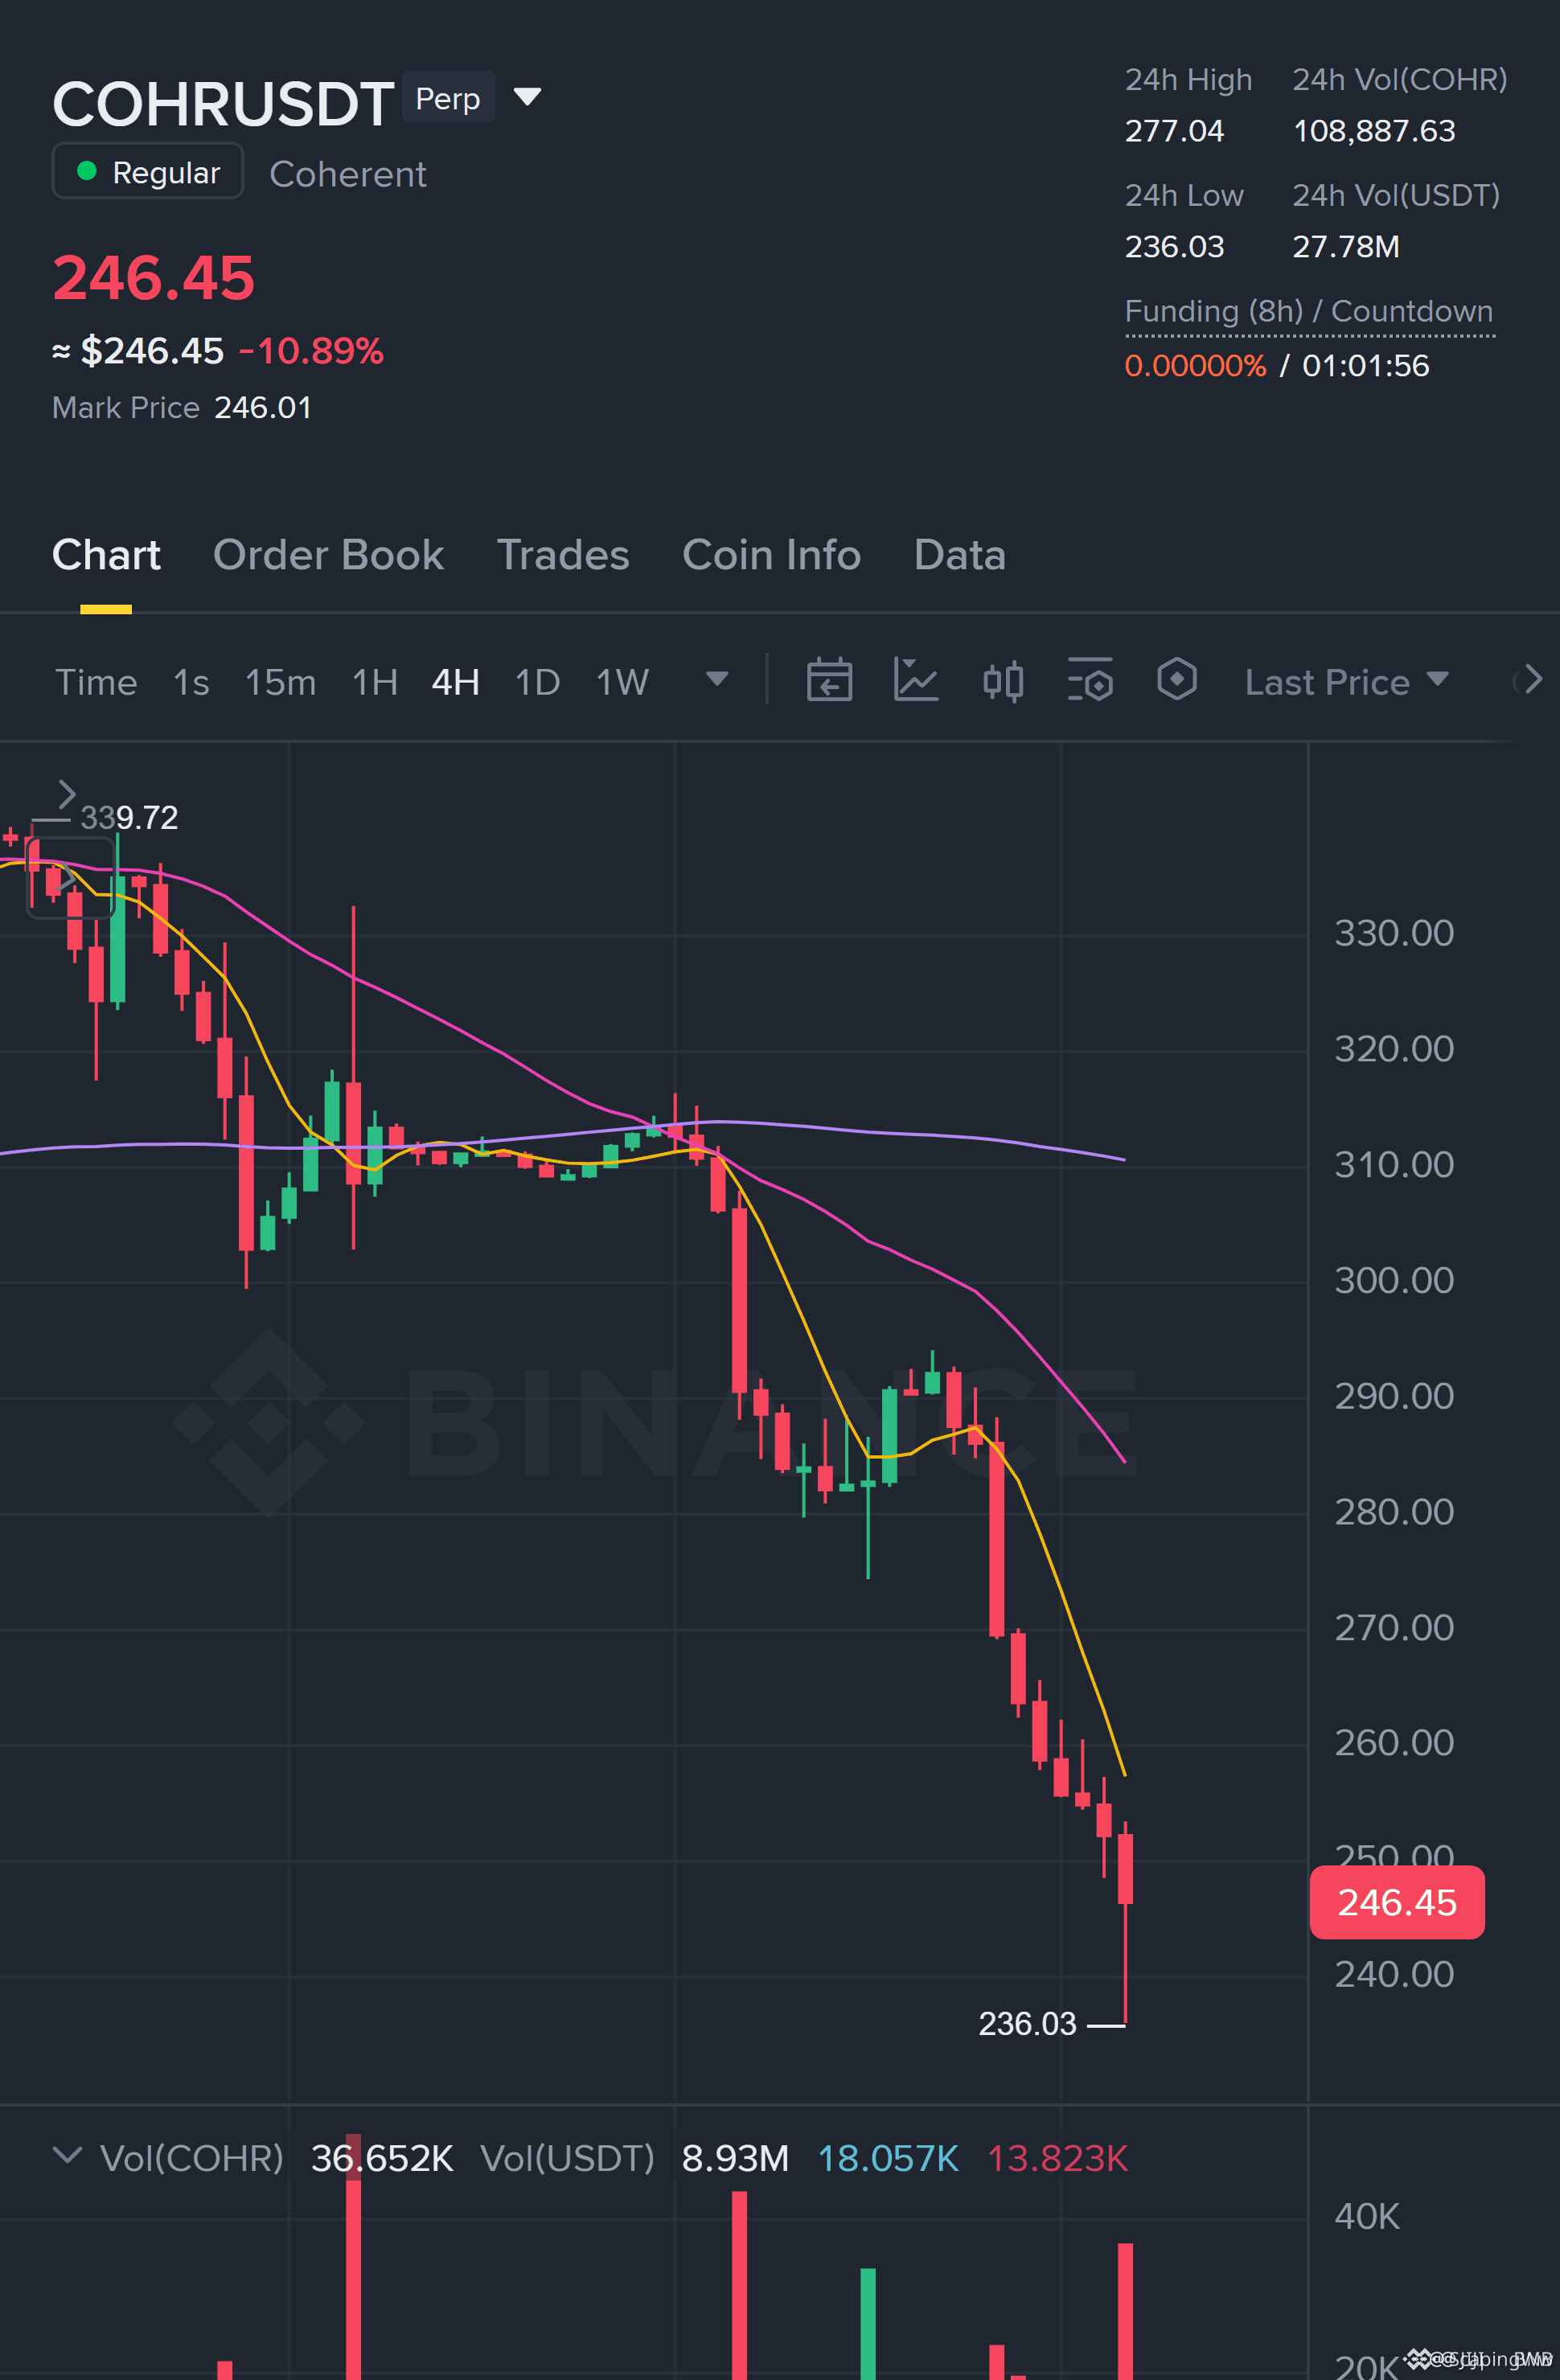
🚨 $COHR RETESTING THE BREAKOUT ZONE WITH HEAVY OVERHEAD SUPPLY LOOMING! 📉
Entry: 247.92–249.22 ⚡
Target: 236.03–228.69 🎯
Stop Loss: 254.53 🛑
📌 Price is creeping back into the 247.92–249.22 breakdown pocket on the 1H chart, testing whether previous support flips into stiff structural resistance. 🔍 Smart money is waiting to see if sellers aggressively defend this shelf or if trapped buyers spark a brief squeeze.
💡 Keep this strictly on your radar until fresh rejection volume confirms sellers have locked down the auction. 💬 Are you front-running this retest or waiting for confirmed rejection candles on $COHR ? 👇
⚠️ Not financial advice. Always manage your risk. 🛡️
🏷️ #COHR #ShortSetup #PriceAction #Trading #Crypto
🎯 🦈
7

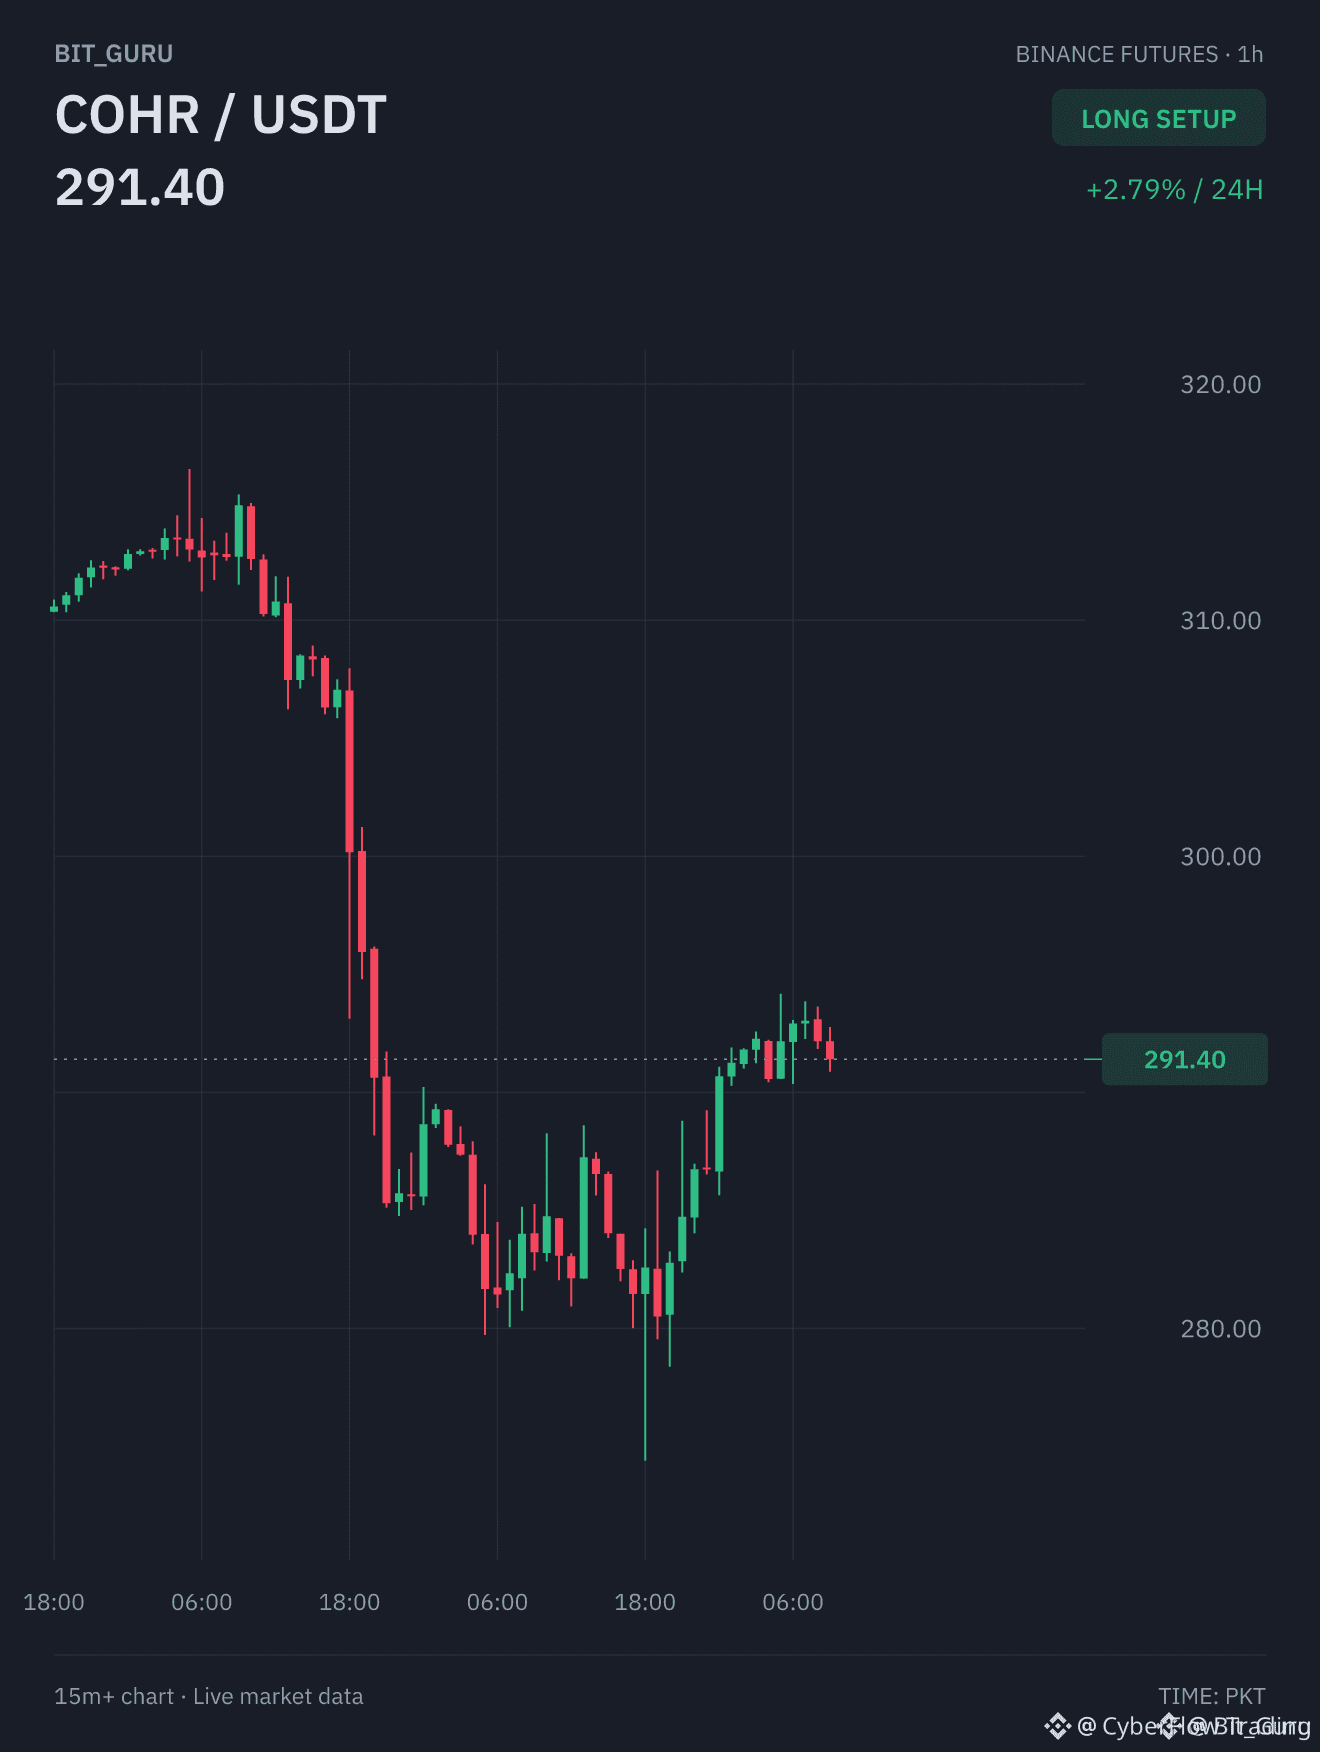
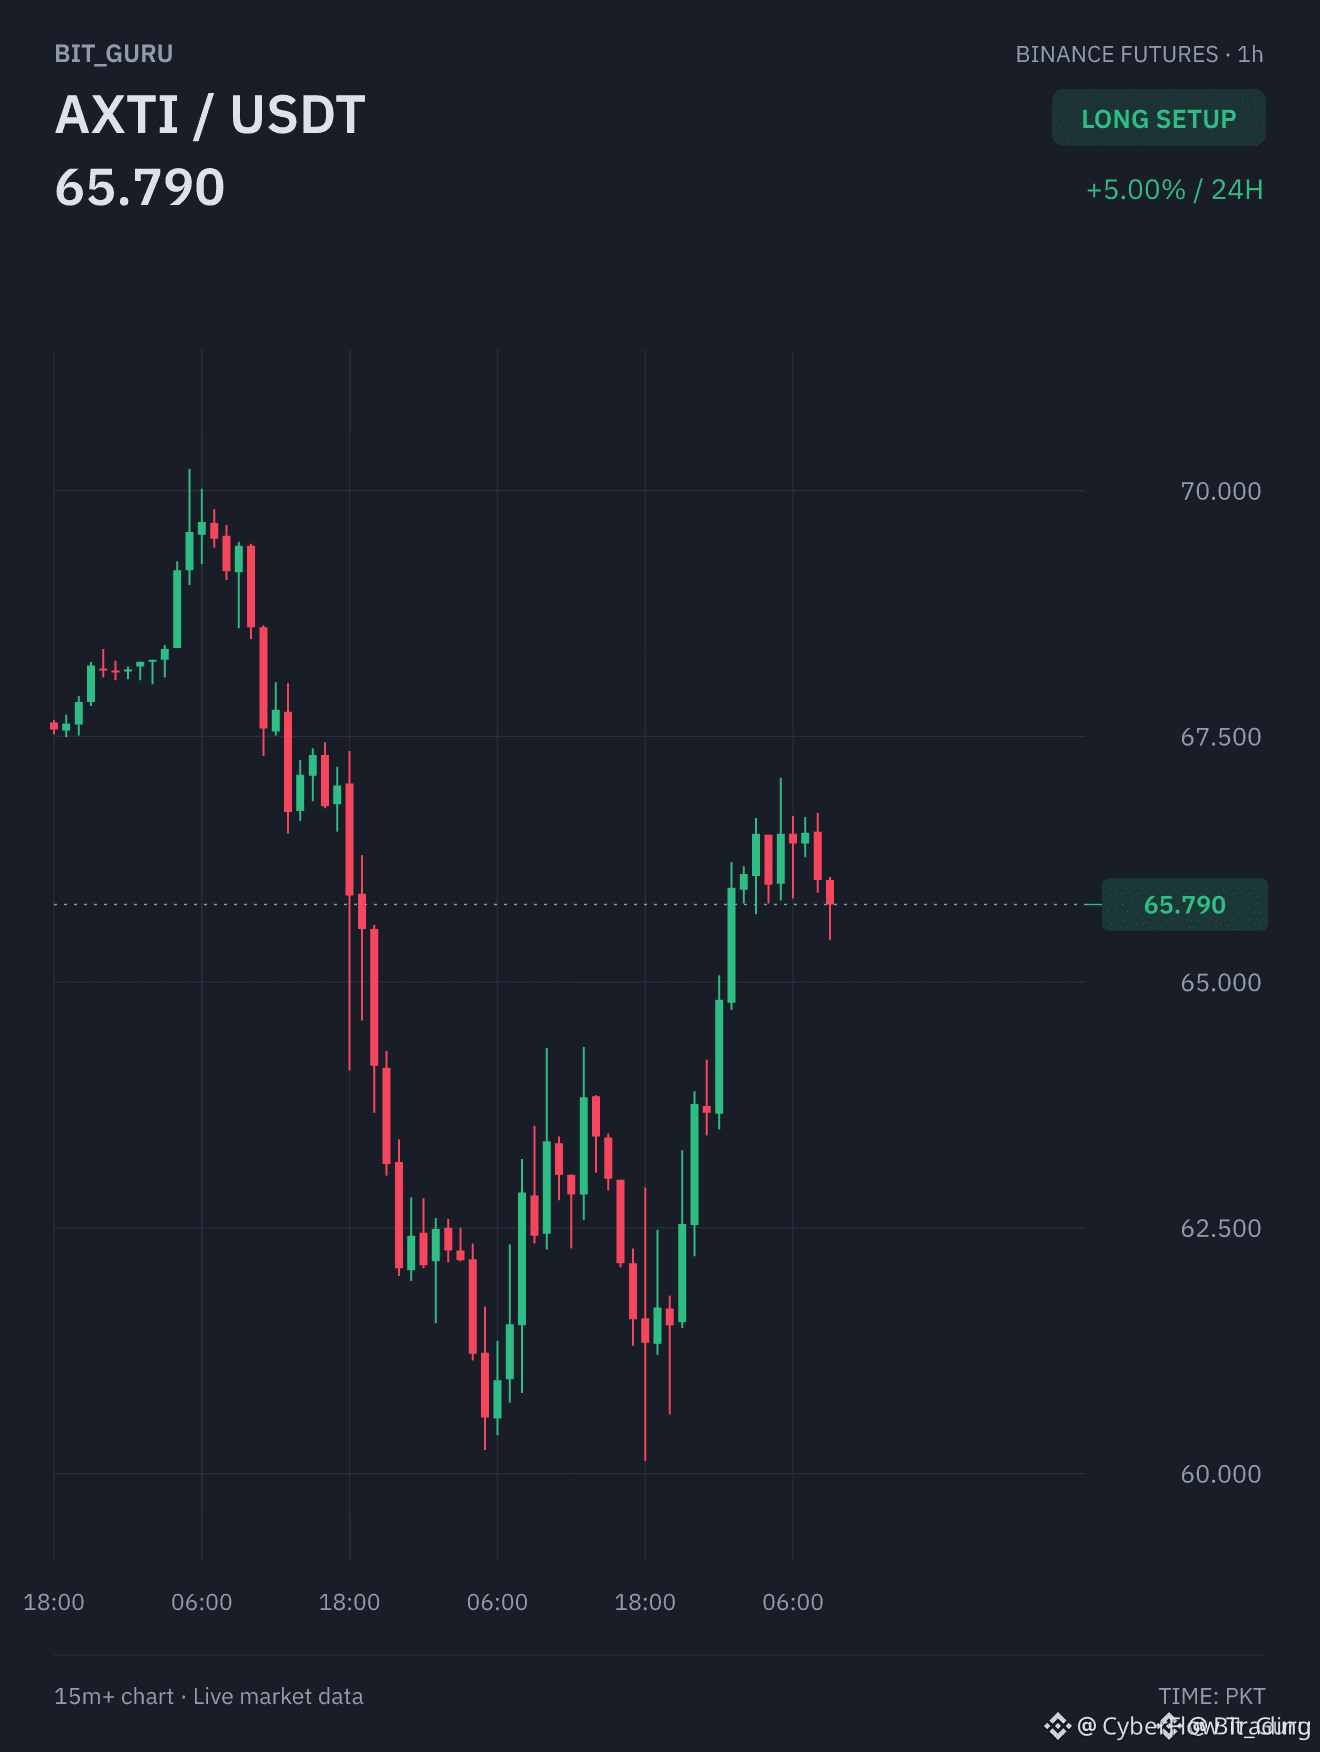
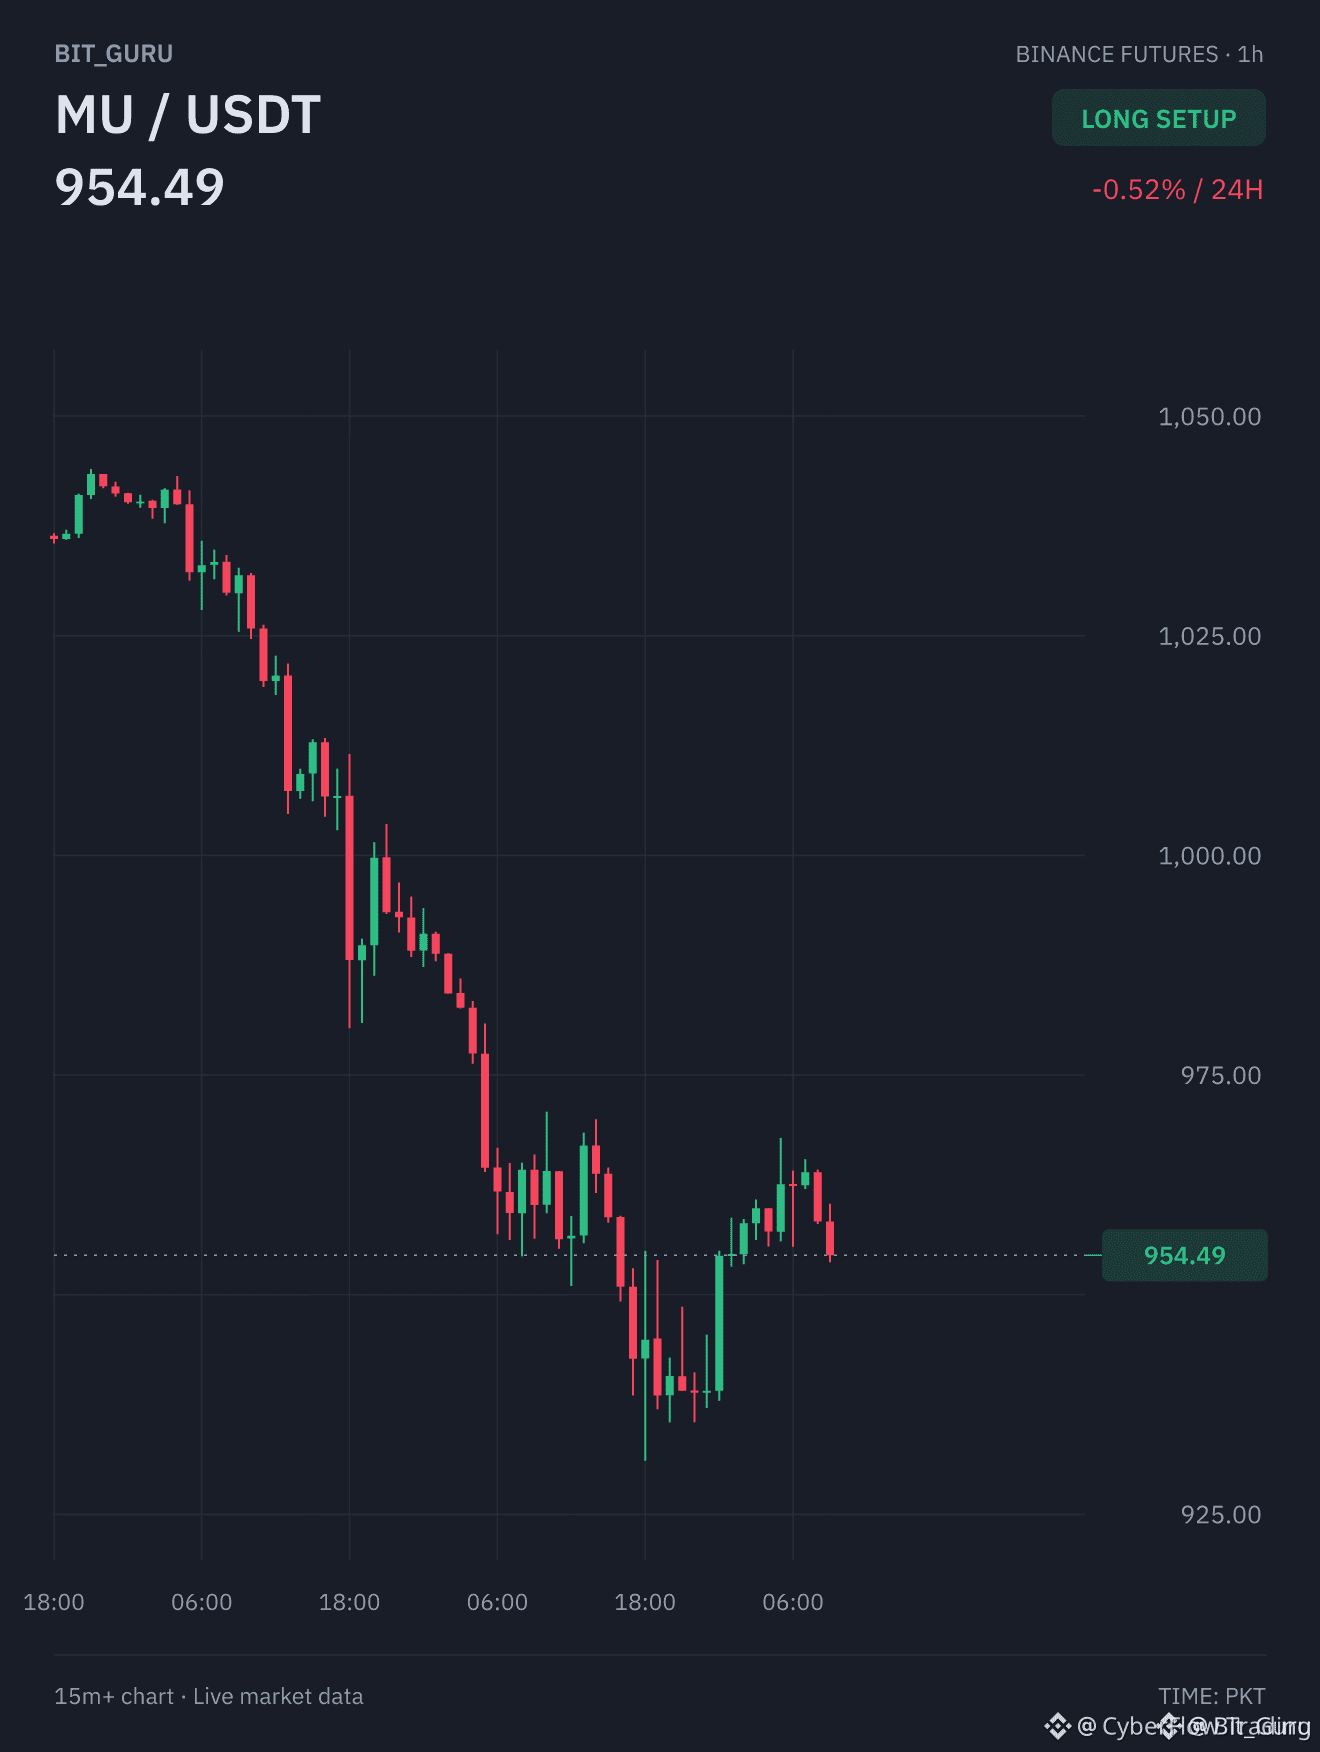
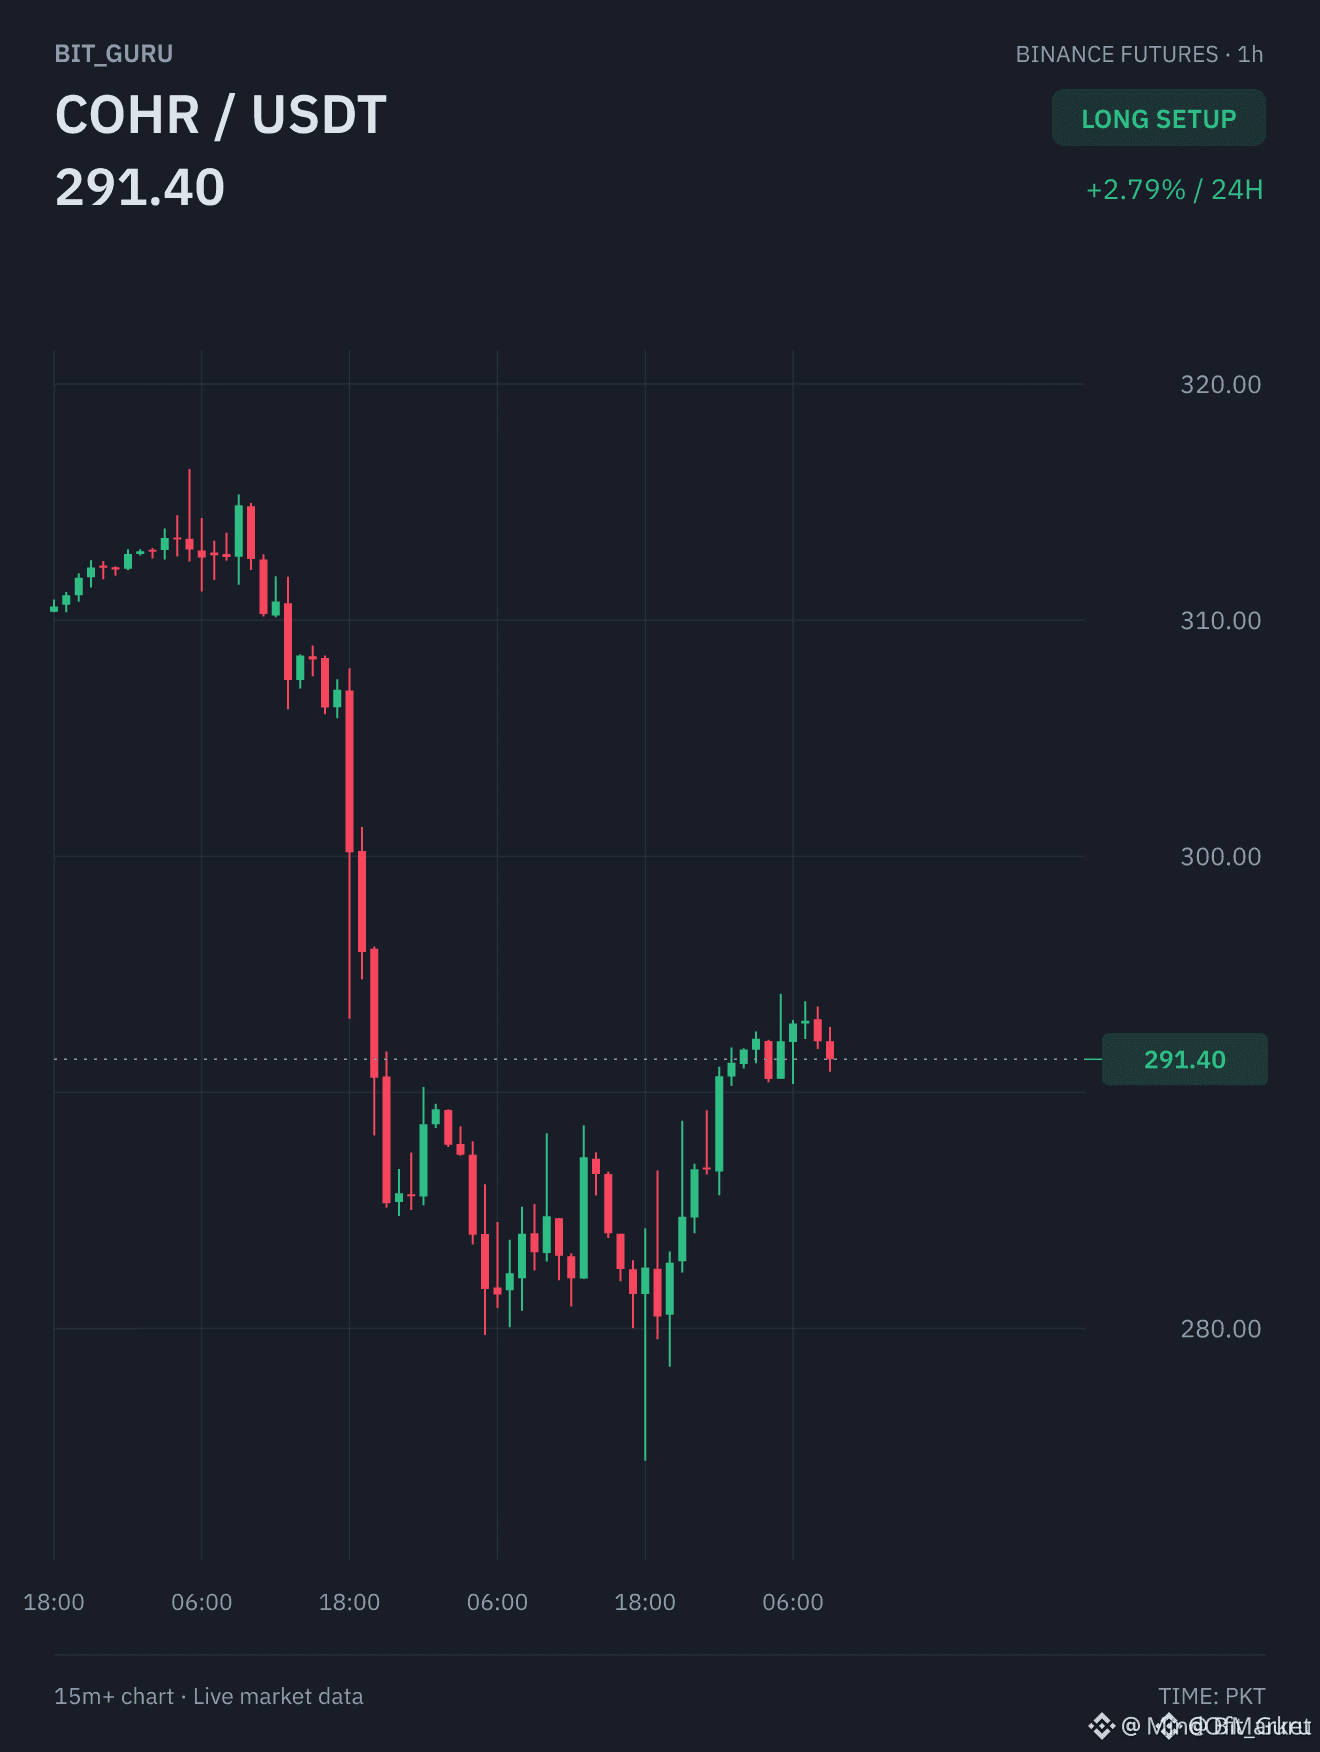
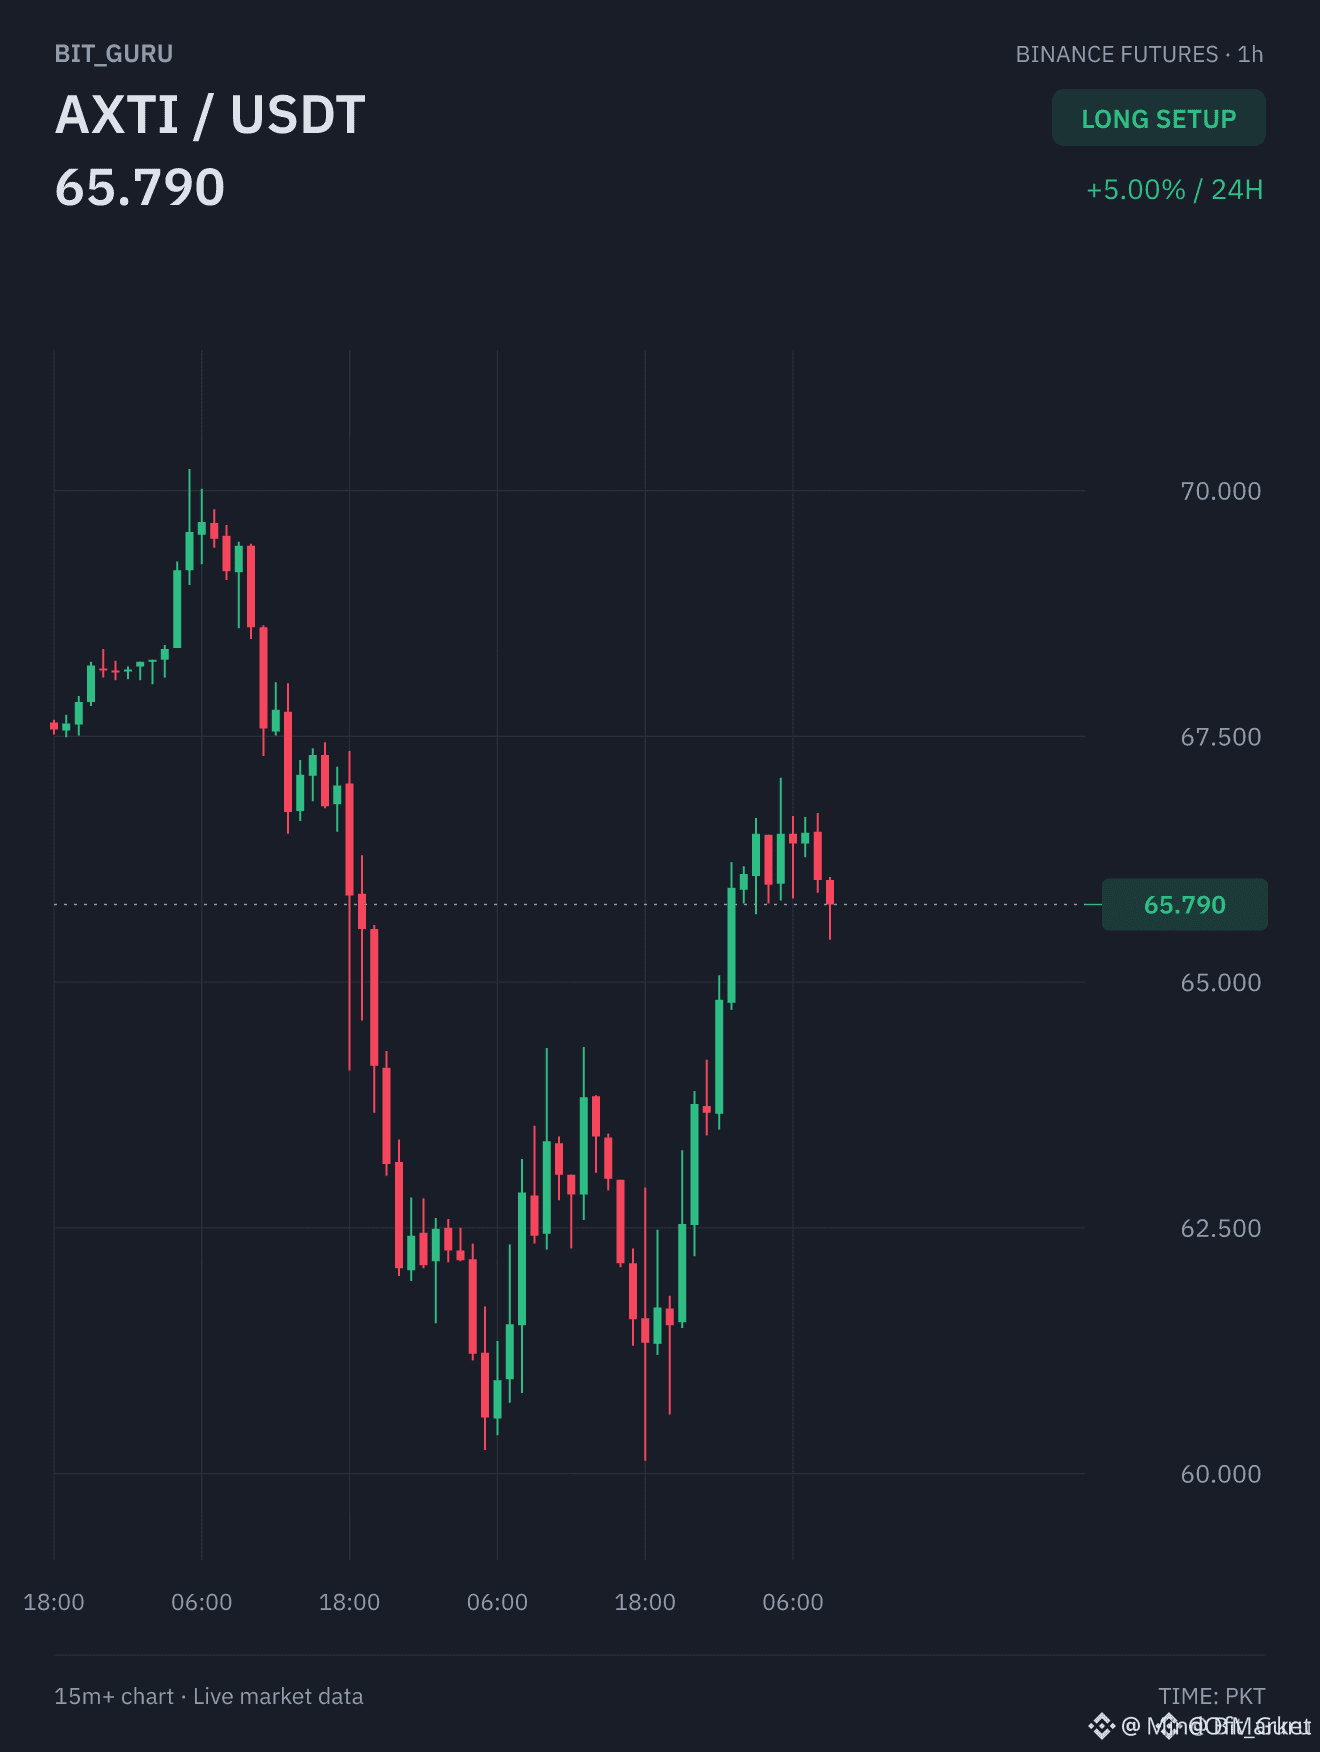
VOLUME ANOMALIES DETECTED ACROSS $COHR $AXTI AND $MU AS ACCUMULATION ACCELERATES ⚡ 📊
Smart money is stepping on the gas with $COHR printing a massive 5.64x volume surge on the 15m chart between 274.39 support and 294.17 resistance. 🌊 We are seeing intense tape acceleration while aggressive bids step in to absorb overhead supply.
Simultaneously, $AXTI is coiling inside its 60.130 to 67.080 range at 65.810 on 2.43x volume, while $MU presses into 970.84 resistance with 2.31x average flow at 954.55. 💡 Sudden volume expansion across these charts signals imminent expansion, but wait for price confirmation to clear key zones before executing.
🤔 Which of these three setups is showing the cleanest order flow for a breakout?
⚠️ Not financial advice. Always manage your risk. 🛡️
🏷️ #COHR #AXTI #MU #Breakout #OrderFlow
🎯 🦈
23
·
--
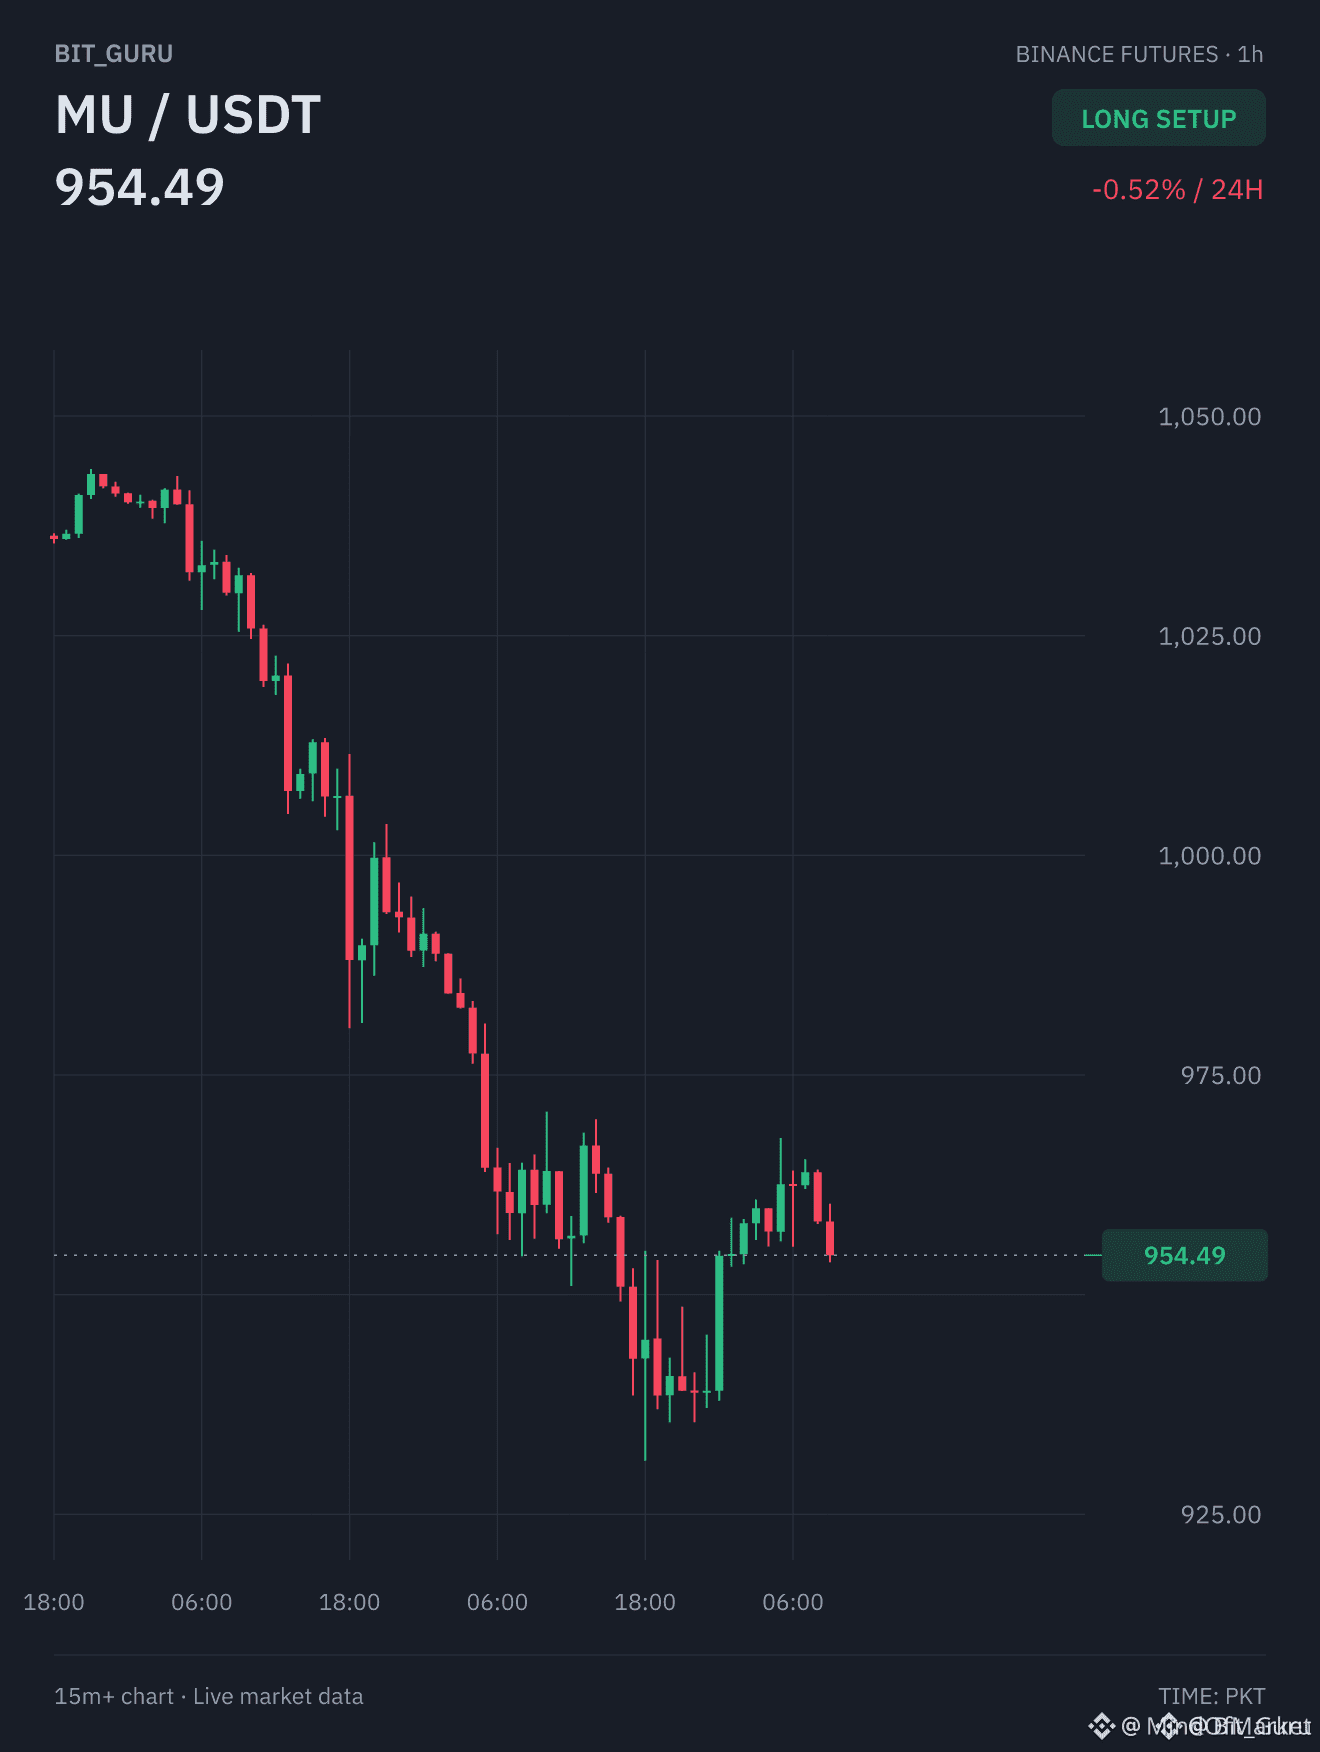
🦈 INSTITUTIONAL VOLUME ANOMALIES DETECTED ACROSS $COHR , $AXTI , AND $MU FUTURES! ⚡
Significant institutional activity is registering across lower-timeframe order flow, headlined by $COHR printing a sharp 5.64x volume expansion between 274.39 support and 294.17 resistance. 📊
Concurrently, $AXTI is absorbing liquidity at 65.810 inside its 60.130 to 67.080 structural range, while $MU trades at 954.55 on 2.31x average volume toward 970.84 resistance. 🔍 Smart money footprint precedes trend expansion, making patience for confirmation critical before positioning. 💡
💬 Which of these three structural pivots are you tracking for confirmed execution? 👇
⚠️ Not financial advice. Always manage your risk. 🛡️
🏷️ #COHR #AXTI #MU #SmartMoney #PriceAction
🎯 🦈
1
Log in to explore more content
Join global crypto users on Binance Square
⚡️ Get latest and useful information about crypto.
💬 Trusted by the world’s largest crypto exchange.
👍 Discover real insights from verified creators.
Email / Phone number
Trending Topics
1
#CanMicrosoftDeliverOnAI
189,296 views
1,522 Discussing
2
#CanGoogleDefindItsCore
96,038 views
1,101 Discussing
3
#FOMCWatch
9.2M views
28,784 Discussing
4
#HKPlacesTokenizedFundSecondaryTradingUnderETFLikeFramework
74 views
7 Discussing
5
#USGovSellsFTXLinkedAnthropicSharesFor$627M
331 views
19 Discussing
6
#MoodysAssignsRLUSDA2LongTermDepositRating
418 views
61 Discussing
7
#SKHynixUnveils$45BShareholderReturns
772 views
22 Discussing
8
#OSMOPlansToBurn100MTokensFromCommunityPool
9,120 views
278 Discussing
9
#EthereumDropsBelow$2300
13,063 views
175 Discussing
10
#BitcoinSlipsBelow$80KAgain
37,509 views
141 Discussing