
#binancehot
binancehot
36,143 views
132 Discussing
Hot
Latest

·
--
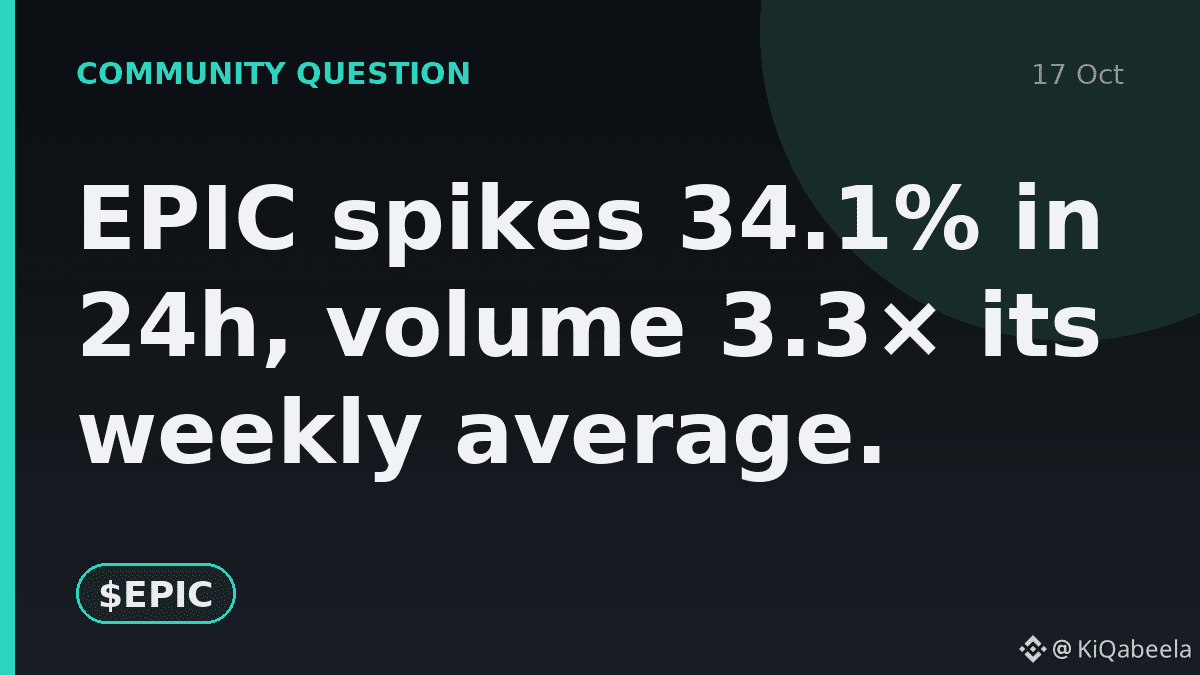
EPIC spikes 34.1% in 24h, volume 3.3× its weekly average.
What do you think is driving this sudden rally?
A) Short squeeze boosting longs
B) Fresh buying from retail investors
C) Market sentiment shifting toward greed
💬 Drop your pick below.
$EPIC
#EPIC #BinanceHot
EPIC spikes 34.1% in 24h, volume 3.3× its weekly average.
What do you think is driving this sudden rally?
A) Short squeeze boosting longs
B) Fresh buying from retail investors
C) Market sentiment shifting toward greed
💬 Drop your pick below.
$EPIC
#EPIC #BinanceHot
What do you think is driving this sudden rally?
A) Short squeeze boosting longs
B) Fresh buying from retail investors
C) Market sentiment shifting toward greed
💬 Drop your pick below.
$EPIC
#EPIC #BinanceHot
3
·
--
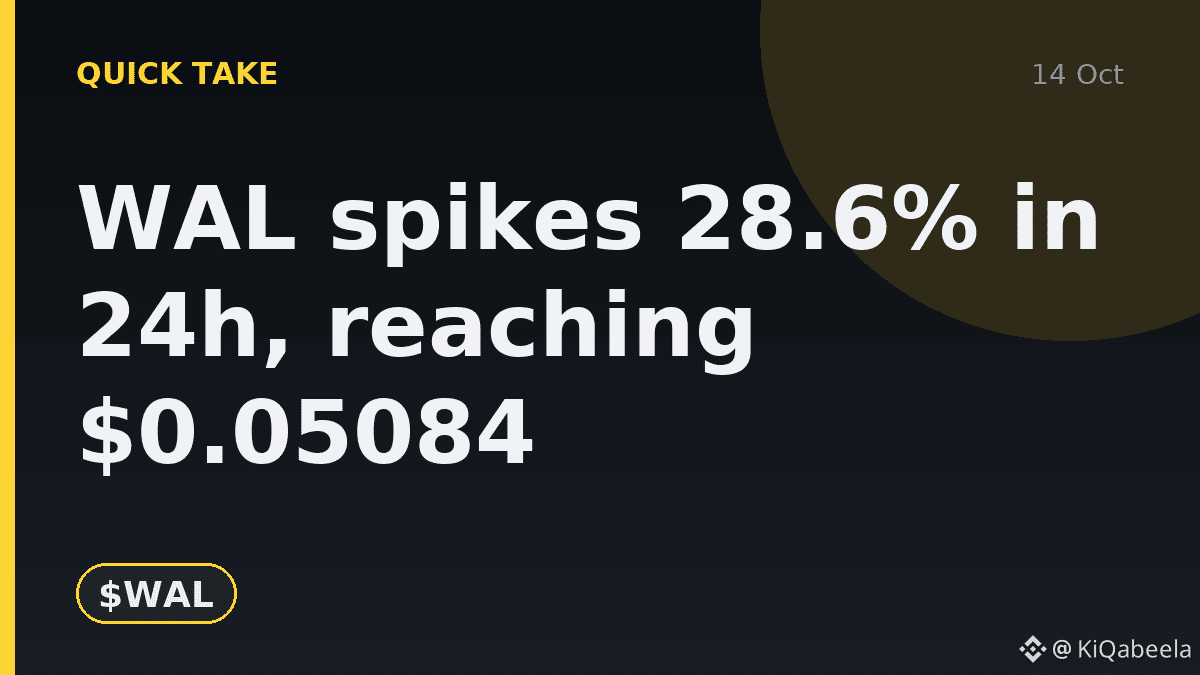
WAL spikes 28.6% in 24h, reaching $0.05084
The surge pushes WAL near its daily high, driven by a Greed sentiment reading of 62. Traders see momentum as a short‑term opportunity.
With $10M volume on Binance, the token shows solid liquidity, but the price swing from $0.037 to $0.051 highlights volatility that could attract speculators.
💬 Bullish or cautious? One word.
$WAL
#WAL #BinanceHot
WAL spikes 28.6% in 24h, reaching $0.05084
The surge pushes WAL near its daily high, driven by a Greed sentiment reading of 62. Traders see momentum as a short‑term opportunity.
With $10M volume on Binance, the token shows solid liquidity, but the price swing from $0.037 to $0.051 highlights volatility that could attract speculators.
💬 Bullish or cautious? One word.
$WAL
#WAL #BinanceHot
The surge pushes WAL near its daily high, driven by a Greed sentiment reading of 62. Traders see momentum as a short‑term opportunity.
With $10M volume on Binance, the token shows solid liquidity, but the price swing from $0.037 to $0.051 highlights volatility that could attract speculators.
💬 Bullish or cautious? One word.
$WAL
#WAL #BinanceHot
2

·
--
$BTW 5 days: From 1.245 to 1.95, a 55% gain. Negative funding rates alongside five consecutive bullish candles—the bears are getting hammered.
Market signals: 1.95 was the highest point of the last 30 four-hour candles, and it has just been broken through. From 1.245, the price has gained 55% in five trading days, nearly doubling from the bottom. 1.95 was previously resistance; after the breakout, it has become support. There is no historical overhead supply above, so this is a price vacuum. Use the low of the last 10 four-hour candles, 1.6133, as a support reference; resistance at 1.9497 is this rally’s high. The overall range of the last 30 four-hour candles is 1.245 to 1.9497, and the price is currently running near the upper boundary. If it retests 1.95 and holds, that would confirm a strong breakout and open up room to move higher.
Market sentiment: The funding rate is -0.0225%, settled every eight hours, meaning shorts are paying. The price is up 55%, yet shorts are still adding to their positions and willing to pay to hold them. Longs are not crowded, and leverage is not maxed out. A negative funding rate alongside an uptrend suggests sentiment has not yet become overheated. The mark price of 1.9282 and the current price of 1.9278 are nearly identical, with a very small premium, so longs are not excessively exuberant. Twenty-four-hour trading volume is $197 million, ample liquidity for a coin of Meme-coin size. The 24-hour high is 1.9497 and the low is 1.6424, giving an intraday range of 18.7%; volatility remains at a moderately high level. The daily gain is 8.87%—a strong rise, but not a parabolic bull run.
Whale activity: The four-hour candle in the early hours of October 11 was key. Price plunged from 1.61 to 1.245, then closed at 1.50. Its volume was $67.1 million, five to six times normal. This is a typical large-player shakeout: first pushing the price down to trigger panic selling, then buying back at lower levels. Afterward, the price climbed from 1.50 back to 1.95, while volume gradually shrank to around $24 million. A rally on declining volume suggests concentrated holdings and that most weak hands have been shaken out; large players have likely completed their accumulation and shakeout. In the early hours of October 10, there was also a move from 1.58 to 1.66 on $16.3 million in volume, likely a test by the market makers.
Volume and price structure: The volume ratio is 1.10, slightly above the average of the previous 20 candles, so this does not count as a volume surge. Volume in the last few four-hour candles has fallen from $67.1 million to $24 million, while the price continues to rise. In the short term, a rally on declining volume is a healthy sign: bulls do not need much capital to push the price higher, suggesting selling pressure is limited. However, if volume keeps falling, watch for signs of momentum exhaustion. The October 12 afternoon candle saw $58.8 million in volume, with the price rising from 1.75 to 1.91—the latest volume-backed surge. Volume then eased. A breakout on rising volume followed by consolidation on declining volume is a bullish price-volume pattern. Overall, there is no significant price-volume divergence, and the rise is supported by volume.
Candlestick details: Five consecutive bullish four-hour candles, with each candle making a higher low. The price has advanced step by step from 1.76 to 1.88 to 1.95, with no gaps. The candle at noon on the 13th reached 1.9497 and closed at 1.9273, with a very short upper wick—the bulls held their ground at the highs. The bearish candle at 8 a.m. on October 10 is worth noting: price fell from 1.62 to 1.56 on $22.2 million in volume, a normal pullback after the shakeout. The long lower-wick bullish candle on October 11 closed at 1.50 after falling to 1.245, confirming bottom support. The candlestick pattern shows steadily rising lows and continually renewed highs—a textbook uptrend structure. There are no long upper wicks or doji candles, indicating strong bullish control.
Nini’s plan: Current price is 1.9278. The key point to watch is whether price retests 1.95 and holds after the breakout. The bullish setup remains intact as long as 1.85 holds. The 1.76–1.73 area is a previous high-volume trading zone and a reference support area in a pullback. With gains already exceeding 50%, be cautious about chasing longs. If participating, keep position size under control and place a stop-loss below 1.85. If price retests 1.85 and holds, consider a small long position. If it breaks below 1.85 on high volume, stay on the sidelines in the short term. Overall, the outlook is bullish, but don’t chase at these elevated levels—wait for a pullback to create an opportunity.
For a customized strategy, contact Nini.
#$BTW #Meme #BinanceHot
$BTW 5 days: From 1.245 to 1.95, a 55% gain. Negative funding rates alongside five consecutive bullish candles—the bears are getting hammered.
Market signals: 1.95 was the highest point of the last 30 four-hour candles, and it has just been broken through. From 1.245, the price has gained 55% in five trading days, nearly doubling from the bottom. 1.95 was previously resistance; after the breakout, it has become support. There is no historical overhead supply above, so this is a price vacuum. Use the low of the last 10 four-hour candles, 1.6133, as a support reference; resistance at 1.9497 is this rally’s high. The overall range of the last 30 four-hour candles is 1.245 to 1.9497, and the price is currently running near the upper boundary. If it retests 1.95 and holds, that would confirm a strong breakout and open up room to move higher.
Market sentiment: The funding rate is -0.0225%, settled every eight hours, meaning shorts are paying. The price is up 55%, yet shorts are still adding to their positions and willing to pay to hold them. Longs are not crowded, and leverage is not maxed out. A negative funding rate alongside an uptrend suggests sentiment has not yet become overheated. The mark price of 1.9282 and the current price of 1.9278 are nearly identical, with a very small premium, so longs are not excessively exuberant. Twenty-four-hour trading volume is $197 million, ample liquidity for a coin of Meme-coin size. The 24-hour high is 1.9497 and the low is 1.6424, giving an intraday range of 18.7%; volatility remains at a moderately high level. The daily gain is 8.87%—a strong rise, but not a parabolic bull run.
Whale activity: The four-hour candle in the early hours of October 11 was key. Price plunged from 1.61 to 1.245, then closed at 1.50. Its volume was $67.1 million, five to six times normal. This is a typical large-player shakeout: first pushing the price down to trigger panic selling, then buying back at lower levels. Afterward, the price climbed from 1.50 back to 1.95, while volume gradually shrank to around $24 million. A rally on declining volume suggests concentrated holdings and that most weak hands have been shaken out; large players have likely completed their accumulation and shakeout. In the early hours of October 10, there was also a move from 1.58 to 1.66 on $16.3 million in volume, likely a test by the market makers.
Volume and price structure: The volume ratio is 1.10, slightly above the average of the previous 20 candles, so this does not count as a volume surge. Volume in the last few four-hour candles has fallen from $67.1 million to $24 million, while the price continues to rise. In the short term, a rally on declining volume is a healthy sign: bulls do not need much capital to push the price higher, suggesting selling pressure is limited. However, if volume keeps falling, watch for signs of momentum exhaustion. The October 12 afternoon candle saw $58.8 million in volume, with the price rising from 1.75 to 1.91—the latest volume-backed surge. Volume then eased. A breakout on rising volume followed by consolidation on declining volume is a bullish price-volume pattern. Overall, there is no significant price-volume divergence, and the rise is supported by volume.
Candlestick details: Five consecutive bullish four-hour candles, with each candle making a higher low. The price has advanced step by step from 1.76 to 1.88 to 1.95, with no gaps. The candle at noon on the 13th reached 1.9497 and closed at 1.9273, with a very short upper wick—the bulls held their ground at the highs. The bearish candle at 8 a.m. on October 10 is worth noting: price fell from 1.62 to 1.56 on $22.2 million in volume, a normal pullback after the shakeout. The long lower-wick bullish candle on October 11 closed at 1.50 after falling to 1.245, confirming bottom support. The candlestick pattern shows steadily rising lows and continually renewed highs—a textbook uptrend structure. There are no long upper wicks or doji candles, indicating strong bullish control.
Nini’s plan: Current price is 1.9278. The key point to watch is whether price retests 1.95 and holds after the breakout. The bullish setup remains intact as long as 1.85 holds. The 1.76–1.73 area is a previous high-volume trading zone and a reference support area in a pullback. With gains already exceeding 50%, be cautious about chasing longs. If participating, keep position size under control and place a stop-loss below 1.85. If price retests 1.85 and holds, consider a small long position. If it breaks below 1.85 on high volume, stay on the sidelines in the short term. Overall, the outlook is bullish, but don’t chase at these elevated levels—wait for a pullback to create an opportunity.
For a customized strategy, contact Nini.
#$BTW #Meme #BinanceHot
Market signals: 1.95 was the highest point of the last 30 four-hour candles, and it has just been broken through. From 1.245, the price has gained 55% in five trading days, nearly doubling from the bottom. 1.95 was previously resistance; after the breakout, it has become support. There is no historical overhead supply above, so this is a price vacuum. Use the low of the last 10 four-hour candles, 1.6133, as a support reference; resistance at 1.9497 is this rally’s high. The overall range of the last 30 four-hour candles is 1.245 to 1.9497, and the price is currently running near the upper boundary. If it retests 1.95 and holds, that would confirm a strong breakout and open up room to move higher.
Market sentiment: The funding rate is -0.0225%, settled every eight hours, meaning shorts are paying. The price is up 55%, yet shorts are still adding to their positions and willing to pay to hold them. Longs are not crowded, and leverage is not maxed out. A negative funding rate alongside an uptrend suggests sentiment has not yet become overheated. The mark price of 1.9282 and the current price of 1.9278 are nearly identical, with a very small premium, so longs are not excessively exuberant. Twenty-four-hour trading volume is $197 million, ample liquidity for a coin of Meme-coin size. The 24-hour high is 1.9497 and the low is 1.6424, giving an intraday range of 18.7%; volatility remains at a moderately high level. The daily gain is 8.87%—a strong rise, but not a parabolic bull run.
Whale activity: The four-hour candle in the early hours of October 11 was key. Price plunged from 1.61 to 1.245, then closed at 1.50. Its volume was $67.1 million, five to six times normal. This is a typical large-player shakeout: first pushing the price down to trigger panic selling, then buying back at lower levels. Afterward, the price climbed from 1.50 back to 1.95, while volume gradually shrank to around $24 million. A rally on declining volume suggests concentrated holdings and that most weak hands have been shaken out; large players have likely completed their accumulation and shakeout. In the early hours of October 10, there was also a move from 1.58 to 1.66 on $16.3 million in volume, likely a test by the market makers.
Volume and price structure: The volume ratio is 1.10, slightly above the average of the previous 20 candles, so this does not count as a volume surge. Volume in the last few four-hour candles has fallen from $67.1 million to $24 million, while the price continues to rise. In the short term, a rally on declining volume is a healthy sign: bulls do not need much capital to push the price higher, suggesting selling pressure is limited. However, if volume keeps falling, watch for signs of momentum exhaustion. The October 12 afternoon candle saw $58.8 million in volume, with the price rising from 1.75 to 1.91—the latest volume-backed surge. Volume then eased. A breakout on rising volume followed by consolidation on declining volume is a bullish price-volume pattern. Overall, there is no significant price-volume divergence, and the rise is supported by volume.
Candlestick details: Five consecutive bullish four-hour candles, with each candle making a higher low. The price has advanced step by step from 1.76 to 1.88 to 1.95, with no gaps. The candle at noon on the 13th reached 1.9497 and closed at 1.9273, with a very short upper wick—the bulls held their ground at the highs. The bearish candle at 8 a.m. on October 10 is worth noting: price fell from 1.62 to 1.56 on $22.2 million in volume, a normal pullback after the shakeout. The long lower-wick bullish candle on October 11 closed at 1.50 after falling to 1.245, confirming bottom support. The candlestick pattern shows steadily rising lows and continually renewed highs—a textbook uptrend structure. There are no long upper wicks or doji candles, indicating strong bullish control.
Nini’s plan: Current price is 1.9278. The key point to watch is whether price retests 1.95 and holds after the breakout. The bullish setup remains intact as long as 1.85 holds. The 1.76–1.73 area is a previous high-volume trading zone and a reference support area in a pullback. With gains already exceeding 50%, be cautious about chasing longs. If participating, keep position size under control and place a stop-loss below 1.85. If price retests 1.85 and holds, consider a small long position. If it breaks below 1.85 on high volume, stay on the sidelines in the short term. Overall, the outlook is bullish, but don’t chase at these elevated levels—wait for a pullback to create an opportunity.
For a customized strategy, contact Nini.
#$BTW #Meme #BinanceHot
20
·
--
$Lobster 4-hour level: it has crashed from 0.0823 to 0.0361, with an amplitude of 56%.
This kind of volatility by itself is abnormal. A Meme coin surges and crashes through a full cycle within two days, only to return to the starting point. That means this rally is not a trend—it’s a liquidity harvest.
Market signals
Current price: 0.04075. Over the past 30 four-hour K-lines, the high is 0.0823 and the low is 0.0361. Support at 0.0361 has been tested once already—on Oct 8 at 8:00 AM, that K-line’s wick pierced down to 0.0361 and then quickly recovered, with bids absorbing below. Resistance at 0.07759 is close to double the current price, so there’s no need to think about it in the short term.
From the K-line走势, it has already dropped 13 K-lines from the top to now. Three consecutive bearish candles from the evening of Oct 7 to the morning of Oct 8 crushed all room for a rebound. Only now has 1 bullish candle just appeared, and the volume ratio is only 0.36—there’s no volume behind the rebound, so it’s just a fake bounce.
Market sentiment
Funding rate: -0.0217%/8h. A negative funding rate means shorts are paying while longs are receiving. There are more people shorting than longing.
Even after falling this much, shorts are still so aggressive—this suggests the market is extremely bearish. But from another angle: when shorts are excessively crowded, it’s actually easier to squeeze them. It’s just that we haven’t seen squeeze signals yet, because the volume/energy can’t keep up.
Whale movements
The K-line at 8:00 PM on Oct 6 is the key. Trading value was $133.2 million, and it jumped directly from 0.05979 to 0.0823. This “sky-high volume” K-line is the hallmark of the main force distributing—pump up the price to attract the follow-on crowd, then dump and leave.
After that, the price kept sliding downward, with not a single respectable rebound K-line. The main force has already finished the harvest; the rest is retail bickering. Once price returns to around 0.04, the main force has long exited. Without fresh capital coming in, any rebound is just retail self-rescue, and its sustainability is questionable.
Volume-price structure
That top 4-hour K-line with $133.2 million trading value is a “peak volume” candle. After that, the trading volume shrank step by step; by the K-line around noon on Oct 8, it was only $12.8 million. From peak volume to near-trough volume, the volume shrank by more than 90%.
A rebound without supporting volume is just “short covering up” without real buyers. During the decline, volume also shrank—but it shrank more slowly than during the rebound—meaning sell orders haven’t been exhausted, while buy-side momentum is already gone. “Peak volume meets peak price” fits here better than anywhere.
K-line details
After the surge wave on Oct 6, long upper wicks began appearing starting in the early hours of Oct 7. First it spiked to 0.07431 and closed at 0.07249. Immediately after, another spike reached 0.06245 and closed at 0.0469.
The rally and then the pullback—bull trap. The main force lifted the price to distribute, and the follow-on crowd bought at the top. Then came 7 consecutive four-hour bearish candles, dropping directly from 0.07 back to 0.04. A sharp rise and sharp fall, with no meaningful sideways consolidation in between—classic “operator-controlled” price action.
Nini’s plan
Current price: 0.04075. Short-term bias is bearish. This Meme coin has already completed a cycle; the shrinking-volume bearish drift indicates there are no buyers. 0.0361 is the final line of defense—once it breaks, it’s back to where it came from. A rebound needs volume support, and a volume ratio of 0.36 can’t hold it up.
If you want to go long, you need one of two conditions: either a volume-shrinking sideways base for at least 3 days, or a high-volume bullish breakout above the 0.045 resistance level. Without these two signals, don’t touch it. For shorting, if the rebound runs up to around 0.045 and the volume can’t keep up, that’s when you can consider it; stop loss is above 0.05.
If you need a strategy tailored to you, you can find Nini.
#龙虾 #Meme #BinanceHot
$Lobster 4-hour level: it has crashed from 0.0823 to 0.0361, with an amplitude of 56%.
This kind of volatility by itself is abnormal. A Meme coin surges and crashes through a full cycle within two days, only to return to the starting point. That means this rally is not a trend—it’s a liquidity harvest.
Market signals
Current price: 0.04075. Over the past 30 four-hour K-lines, the high is 0.0823 and the low is 0.0361. Support at 0.0361 has been tested once already—on Oct 8 at 8:00 AM, that K-line’s wick pierced down to 0.0361 and then quickly recovered, with bids absorbing below. Resistance at 0.07759 is close to double the current price, so there’s no need to think about it in the short term.
From the K-line走势, it has already dropped 13 K-lines from the top to now. Three consecutive bearish candles from the evening of Oct 7 to the morning of Oct 8 crushed all room for a rebound. Only now has 1 bullish candle just appeared, and the volume ratio is only 0.36—there’s no volume behind the rebound, so it’s just a fake bounce.
Market sentiment
Funding rate: -0.0217%/8h. A negative funding rate means shorts are paying while longs are receiving. There are more people shorting than longing.
Even after falling this much, shorts are still so aggressive—this suggests the market is extremely bearish. But from another angle: when shorts are excessively crowded, it’s actually easier to squeeze them. It’s just that we haven’t seen squeeze signals yet, because the volume/energy can’t keep up.
Whale movements
The K-line at 8:00 PM on Oct 6 is the key. Trading value was $133.2 million, and it jumped directly from 0.05979 to 0.0823. This “sky-high volume” K-line is the hallmark of the main force distributing—pump up the price to attract the follow-on crowd, then dump and leave.
After that, the price kept sliding downward, with not a single respectable rebound K-line. The main force has already finished the harvest; the rest is retail bickering. Once price returns to around 0.04, the main force has long exited. Without fresh capital coming in, any rebound is just retail self-rescue, and its sustainability is questionable.
Volume-price structure
That top 4-hour K-line with $133.2 million trading value is a “peak volume” candle. After that, the trading volume shrank step by step; by the K-line around noon on Oct 8, it was only $12.8 million. From peak volume to near-trough volume, the volume shrank by more than 90%.
A rebound without supporting volume is just “short covering up” without real buyers. During the decline, volume also shrank—but it shrank more slowly than during the rebound—meaning sell orders haven’t been exhausted, while buy-side momentum is already gone. “Peak volume meets peak price” fits here better than anywhere.
K-line details
After the surge wave on Oct 6, long upper wicks began appearing starting in the early hours of Oct 7. First it spiked to 0.07431 and closed at 0.07249. Immediately after, another spike reached 0.06245 and closed at 0.0469.
The rally and then the pullback—bull trap. The main force lifted the price to distribute, and the follow-on crowd bought at the top. Then came 7 consecutive four-hour bearish candles, dropping directly from 0.07 back to 0.04. A sharp rise and sharp fall, with no meaningful sideways consolidation in between—classic “operator-controlled” price action.
Nini’s plan
Current price: 0.04075. Short-term bias is bearish. This Meme coin has already completed a cycle; the shrinking-volume bearish drift indicates there are no buyers. 0.0361 is the final line of defense—once it breaks, it’s back to where it came from. A rebound needs volume support, and a volume ratio of 0.36 can’t hold it up.
If you want to go long, you need one of two conditions: either a volume-shrinking sideways base for at least 3 days, or a high-volume bullish breakout above the 0.045 resistance level. Without these two signals, don’t touch it. For shorting, if the rebound runs up to around 0.045 and the volume can’t keep up, that’s when you can consider it; stop loss is above 0.05.
If you need a strategy tailored to you, you can find Nini.
#龙虾 #Meme #BinanceHot
This kind of volatility by itself is abnormal. A Meme coin surges and crashes through a full cycle within two days, only to return to the starting point. That means this rally is not a trend—it’s a liquidity harvest.
Market signals
Current price: 0.04075. Over the past 30 four-hour K-lines, the high is 0.0823 and the low is 0.0361. Support at 0.0361 has been tested once already—on Oct 8 at 8:00 AM, that K-line’s wick pierced down to 0.0361 and then quickly recovered, with bids absorbing below. Resistance at 0.07759 is close to double the current price, so there’s no need to think about it in the short term.
From the K-line走势, it has already dropped 13 K-lines from the top to now. Three consecutive bearish candles from the evening of Oct 7 to the morning of Oct 8 crushed all room for a rebound. Only now has 1 bullish candle just appeared, and the volume ratio is only 0.36—there’s no volume behind the rebound, so it’s just a fake bounce.
Market sentiment
Funding rate: -0.0217%/8h. A negative funding rate means shorts are paying while longs are receiving. There are more people shorting than longing.
Even after falling this much, shorts are still so aggressive—this suggests the market is extremely bearish. But from another angle: when shorts are excessively crowded, it’s actually easier to squeeze them. It’s just that we haven’t seen squeeze signals yet, because the volume/energy can’t keep up.
Whale movements
The K-line at 8:00 PM on Oct 6 is the key. Trading value was $133.2 million, and it jumped directly from 0.05979 to 0.0823. This “sky-high volume” K-line is the hallmark of the main force distributing—pump up the price to attract the follow-on crowd, then dump and leave.
After that, the price kept sliding downward, with not a single respectable rebound K-line. The main force has already finished the harvest; the rest is retail bickering. Once price returns to around 0.04, the main force has long exited. Without fresh capital coming in, any rebound is just retail self-rescue, and its sustainability is questionable.
Volume-price structure
That top 4-hour K-line with $133.2 million trading value is a “peak volume” candle. After that, the trading volume shrank step by step; by the K-line around noon on Oct 8, it was only $12.8 million. From peak volume to near-trough volume, the volume shrank by more than 90%.
A rebound without supporting volume is just “short covering up” without real buyers. During the decline, volume also shrank—but it shrank more slowly than during the rebound—meaning sell orders haven’t been exhausted, while buy-side momentum is already gone. “Peak volume meets peak price” fits here better than anywhere.
K-line details
After the surge wave on Oct 6, long upper wicks began appearing starting in the early hours of Oct 7. First it spiked to 0.07431 and closed at 0.07249. Immediately after, another spike reached 0.06245 and closed at 0.0469.
The rally and then the pullback—bull trap. The main force lifted the price to distribute, and the follow-on crowd bought at the top. Then came 7 consecutive four-hour bearish candles, dropping directly from 0.07 back to 0.04. A sharp rise and sharp fall, with no meaningful sideways consolidation in between—classic “operator-controlled” price action.
Nini’s plan
Current price: 0.04075. Short-term bias is bearish. This Meme coin has already completed a cycle; the shrinking-volume bearish drift indicates there are no buyers. 0.0361 is the final line of defense—once it breaks, it’s back to where it came from. A rebound needs volume support, and a volume ratio of 0.36 can’t hold it up.
If you want to go long, you need one of two conditions: either a volume-shrinking sideways base for at least 3 days, or a high-volume bullish breakout above the 0.045 resistance level. Without these two signals, don’t touch it. For shorting, if the rebound runs up to around 0.045 and the volume can’t keep up, that’s when you can consider it; stop loss is above 0.05.
If you need a strategy tailored to you, you can find Nini.
#龙虾 #Meme #BinanceHot
102
·
--
$The LOBSTER fell 60.50% in five days, dropping from 0.10 to 0.036.
This isn’t a normal pullback—this is a crash.
Market signals: The price has been smashed all the way from 0.11396 down to 0.02515, with nearly an 80% drop in four days. This is a classic pump-and-dump distribution pattern. The main players completed the doubling pump on October 1st, and the next day they distributed directly. The two green candles are just technical rebounds after oversold conditions—not reversal signals. The rebound magnitude is almost negligible compared to the drop.
Market sentiment: Panic has spread. Every time the price bounces, it gets hit down again by trapped-position sell pressure. Above, the 0.05 to 0.11 range is stacked layer upon layer with trapped coins. Long sentiment is extremely low; bears are in absolute control. Funding rate is +0.0987% per 8 hours. Longs are still paying, which suggests they haven’t fully surrendered yet, but this kind of continuous paying will gradually drain long-side capital while shorts enjoy risk-free gains.
Big player activity: At 00:00 on October 2nd, the 4H candle’s traded volume was 227.1M, the highest volume of the entire period (a true “tian-volume”). The main players are distributing at high levels, with retail picking up the bag. After that, the volume has declined somewhat, but it still stays high at 77M to 164M, indicating the market is still digesting this wave of dumping. Rebound volume can’t keep up—the main players have already withdrawn. What’s happening now is retail self-rescue.
Volume-price structure: The latest volume ratio is 1.93—nearly double compared to the average of the previous 20 candles. Increased volume near the bottom shows some funds are trying to buy the dip, but rebound volume is decreasing. The candle at 08:00 on October 1st pulled from 0.043 straight to 0.0827 with 127.7M traded volume—clearly a bull trap. After the main players finished distributing at high levels, any rebound above 0.04 is an opportunity to escape—not an entry signal. Over the range of the last 30 candles, the high is 0.11396 and the low is 0.02515—volatility is off the charts.
Candlestick details: The big red candle at 00:00 on October 2nd opened at 0.11024 and closed at 0.05238. The single-candle drop exceeded 50%. Trading volume was 227.1M, setting a cycle peak—panic sellers were exiting in a concentrated rush. Then, the two green candles at 04:00 and 08:00 gradually climbed higher. The 08:00 candle’s highest wick touched 0.04172, but it closed at only 0.03627. The upper wicks indicate dense selling pressure in the 0.04 to 0.05 range. Immediately after the two green candles, the third candle dropped back down—the dip-buying capital is already exhausted.
Nini’s plan: Current price is 0.03651. My view is bearish. The two green candles are oversold rebounds, not a reversal. The shadow of the 60.50% drop is still hanging over it. The trapped supply above keeps pressing down—this coin isn’t worth buying the dip. For the short term, watch 0.02515—if it breaks, get out. If the price rebounds into 0.04 to 0.05, you can try shorting, with a stop-loss set above 0.055. If it can’t rebound past 0.06, keep the short position. For a coin with a daily amplitude of 60%, don’t go too heavy with your position size.
A strategy needs to be tailored—go ask Nini.
#龙虾 #Meme #BinanceHot
$The LOBSTER fell 60.50% in five days, dropping from 0.10 to 0.036.
This isn’t a normal pullback—this is a crash.
Market signals: The price has been smashed all the way from 0.11396 down to 0.02515, with nearly an 80% drop in four days. This is a classic pump-and-dump distribution pattern. The main players completed the doubling pump on October 1st, and the next day they distributed directly. The two green candles are just technical rebounds after oversold conditions—not reversal signals. The rebound magnitude is almost negligible compared to the drop.
Market sentiment: Panic has spread. Every time the price bounces, it gets hit down again by trapped-position sell pressure. Above, the 0.05 to 0.11 range is stacked layer upon layer with trapped coins. Long sentiment is extremely low; bears are in absolute control. Funding rate is +0.0987% per 8 hours. Longs are still paying, which suggests they haven’t fully surrendered yet, but this kind of continuous paying will gradually drain long-side capital while shorts enjoy risk-free gains.
Big player activity: At 00:00 on October 2nd, the 4H candle’s traded volume was 227.1M, the highest volume of the entire period (a true “tian-volume”). The main players are distributing at high levels, with retail picking up the bag. After that, the volume has declined somewhat, but it still stays high at 77M to 164M, indicating the market is still digesting this wave of dumping. Rebound volume can’t keep up—the main players have already withdrawn. What’s happening now is retail self-rescue.
Volume-price structure: The latest volume ratio is 1.93—nearly double compared to the average of the previous 20 candles. Increased volume near the bottom shows some funds are trying to buy the dip, but rebound volume is decreasing. The candle at 08:00 on October 1st pulled from 0.043 straight to 0.0827 with 127.7M traded volume—clearly a bull trap. After the main players finished distributing at high levels, any rebound above 0.04 is an opportunity to escape—not an entry signal. Over the range of the last 30 candles, the high is 0.11396 and the low is 0.02515—volatility is off the charts.
Candlestick details: The big red candle at 00:00 on October 2nd opened at 0.11024 and closed at 0.05238. The single-candle drop exceeded 50%. Trading volume was 227.1M, setting a cycle peak—panic sellers were exiting in a concentrated rush. Then, the two green candles at 04:00 and 08:00 gradually climbed higher. The 08:00 candle’s highest wick touched 0.04172, but it closed at only 0.03627. The upper wicks indicate dense selling pressure in the 0.04 to 0.05 range. Immediately after the two green candles, the third candle dropped back down—the dip-buying capital is already exhausted.
Nini’s plan: Current price is 0.03651. My view is bearish. The two green candles are oversold rebounds, not a reversal. The shadow of the 60.50% drop is still hanging over it. The trapped supply above keeps pressing down—this coin isn’t worth buying the dip. For the short term, watch 0.02515—if it breaks, get out. If the price rebounds into 0.04 to 0.05, you can try shorting, with a stop-loss set above 0.055. If it can’t rebound past 0.06, keep the short position. For a coin with a daily amplitude of 60%, don’t go too heavy with your position size.
A strategy needs to be tailored—go ask Nini.
#龙虾 #Meme #BinanceHot
This isn’t a normal pullback—this is a crash.
Market signals: The price has been smashed all the way from 0.11396 down to 0.02515, with nearly an 80% drop in four days. This is a classic pump-and-dump distribution pattern. The main players completed the doubling pump on October 1st, and the next day they distributed directly. The two green candles are just technical rebounds after oversold conditions—not reversal signals. The rebound magnitude is almost negligible compared to the drop.
Market sentiment: Panic has spread. Every time the price bounces, it gets hit down again by trapped-position sell pressure. Above, the 0.05 to 0.11 range is stacked layer upon layer with trapped coins. Long sentiment is extremely low; bears are in absolute control. Funding rate is +0.0987% per 8 hours. Longs are still paying, which suggests they haven’t fully surrendered yet, but this kind of continuous paying will gradually drain long-side capital while shorts enjoy risk-free gains.
Big player activity: At 00:00 on October 2nd, the 4H candle’s traded volume was 227.1M, the highest volume of the entire period (a true “tian-volume”). The main players are distributing at high levels, with retail picking up the bag. After that, the volume has declined somewhat, but it still stays high at 77M to 164M, indicating the market is still digesting this wave of dumping. Rebound volume can’t keep up—the main players have already withdrawn. What’s happening now is retail self-rescue.
Volume-price structure: The latest volume ratio is 1.93—nearly double compared to the average of the previous 20 candles. Increased volume near the bottom shows some funds are trying to buy the dip, but rebound volume is decreasing. The candle at 08:00 on October 1st pulled from 0.043 straight to 0.0827 with 127.7M traded volume—clearly a bull trap. After the main players finished distributing at high levels, any rebound above 0.04 is an opportunity to escape—not an entry signal. Over the range of the last 30 candles, the high is 0.11396 and the low is 0.02515—volatility is off the charts.
Candlestick details: The big red candle at 00:00 on October 2nd opened at 0.11024 and closed at 0.05238. The single-candle drop exceeded 50%. Trading volume was 227.1M, setting a cycle peak—panic sellers were exiting in a concentrated rush. Then, the two green candles at 04:00 and 08:00 gradually climbed higher. The 08:00 candle’s highest wick touched 0.04172, but it closed at only 0.03627. The upper wicks indicate dense selling pressure in the 0.04 to 0.05 range. Immediately after the two green candles, the third candle dropped back down—the dip-buying capital is already exhausted.
Nini’s plan: Current price is 0.03651. My view is bearish. The two green candles are oversold rebounds, not a reversal. The shadow of the 60.50% drop is still hanging over it. The trapped supply above keeps pressing down—this coin isn’t worth buying the dip. For the short term, watch 0.02515—if it breaks, get out. If the price rebounds into 0.04 to 0.05, you can try shorting, with a stop-loss set above 0.055. If it can’t rebound past 0.06, keep the short position. For a coin with a daily amplitude of 60%, don’t go too heavy with your position size.
A strategy needs to be tailored—go ask Nini.
#龙虾 #Meme #BinanceHot
504

·
--
Bullish
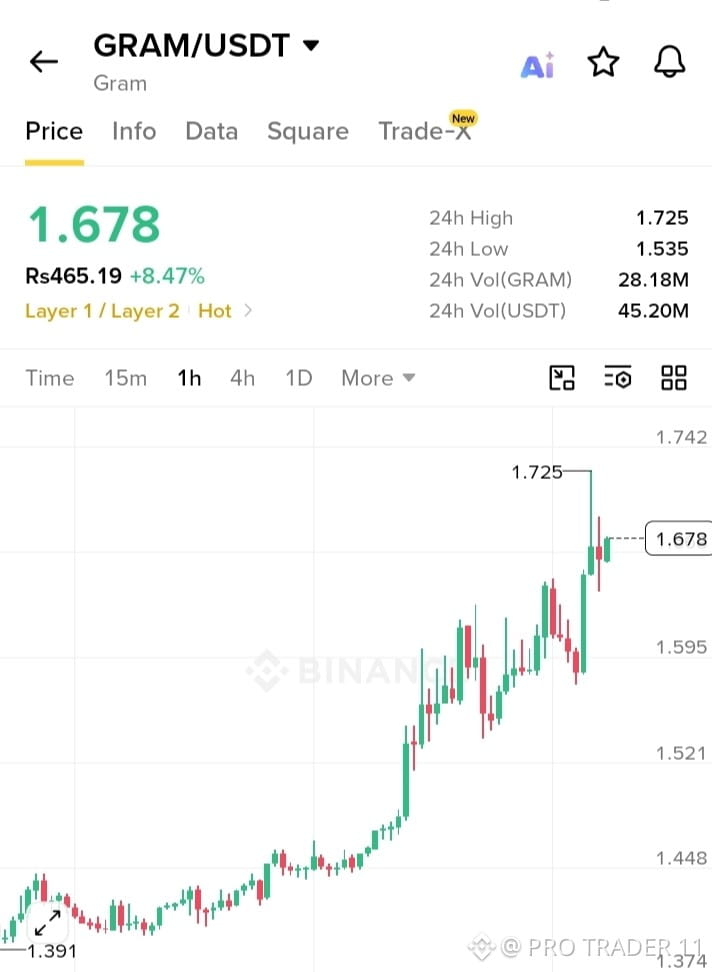
🚀 *$GRAM /USDT +8.47% PUMP!*
*Gram (GRAM) - Layer 1 / Layer 2 | Hot*
💰 $1.678 | Rs465.19
📊 24H High: $1.725 | Low: $1.535
Vol: 28.18M GRAM / $45.20M
📈 From $1.391 to $1.725 - Strong Uptrend!
🟢 Entry: $1.640 - $1.678
🎯 TP1: $1.725
🎯 TP2: $1.742
🎯 TP3: $1.800
🛑 SL: $1.595
#GRAM #GramToken #Layer1 #BinanceHot #CryptoPump
{future}(GRAMUSDT)
🚀 *$GRAM /USDT +8.47% PUMP!*
*Gram (GRAM) - Layer 1 / Layer 2 | Hot*
💰 $1.678 | Rs465.19
📊 24H High: $1.725 | Low: $1.535
Vol: 28.18M GRAM / $45.20M
📈 From $1.391 to $1.725 - Strong Uptrend!
🟢 Entry: $1.640 - $1.678
🎯 TP1: $1.725
🎯 TP2: $1.742
🎯 TP3: $1.800
🛑 SL: $1.595
#GRAM #GramToken #Layer1 #BinanceHot #CryptoPump
*Gram (GRAM) - Layer 1 / Layer 2 | Hot*
💰 $1.678 | Rs465.19
📊 24H High: $1.725 | Low: $1.535
Vol: 28.18M GRAM / $45.20M
📈 From $1.391 to $1.725 - Strong Uptrend!
🟢 Entry: $1.640 - $1.678
🎯 TP1: $1.725
🎯 TP2: $1.742
🎯 TP3: $1.800
🛑 SL: $1.595
#GRAM #GramToken #Layer1 #BinanceHot #CryptoPump
1
42
·
--
Bullish
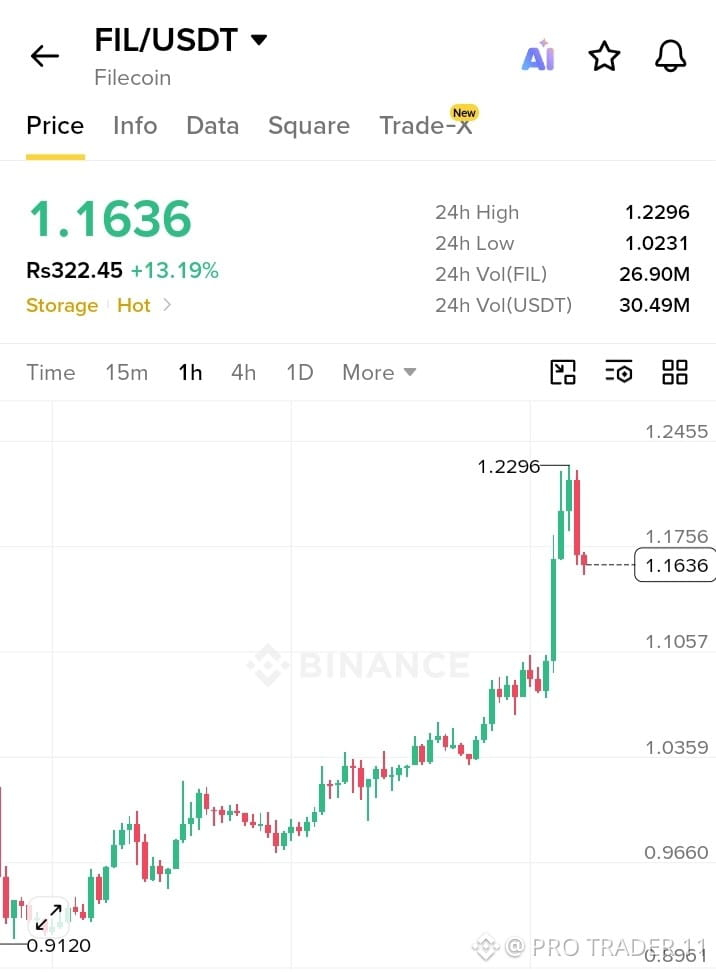
🚀 $FIL /USDT +13.19% PUMP!*
*Filecoin (FIL) - Storage Hot*
💰 $1.1636 | Rs322.45
📊 24H High: $1.2296 | Low: $1.0231
Vol: 26.90M FIL / $30.49M
📈 From $0.9120 to $1.2296 - Explosive Rally!
🟢 Entry: $1.1057 - $1.1636
🎯 TP1: $1.1756
🎯 TP2: $1.2296
🎯 TP3: $1.2455
🛑 SL: $1.0359
#FIL #Filecoin #Storage #BinanceHot #CryptoPump
{future}(FILUSDT)
🚀 $FIL /USDT +13.19% PUMP!*
*Filecoin (FIL) - Storage Hot*
💰 $1.1636 | Rs322.45
📊 24H High: $1.2296 | Low: $1.0231
Vol: 26.90M FIL / $30.49M
📈 From $0.9120 to $1.2296 - Explosive Rally!
🟢 Entry: $1.1057 - $1.1636
🎯 TP1: $1.1756
🎯 TP2: $1.2296
🎯 TP3: $1.2455
🛑 SL: $1.0359
#FIL #Filecoin #Storage #BinanceHot #CryptoPump
*Filecoin (FIL) - Storage Hot*
💰 $1.1636 | Rs322.45
📊 24H High: $1.2296 | Low: $1.0231
Vol: 26.90M FIL / $30.49M
📈 From $0.9120 to $1.2296 - Explosive Rally!
🟢 Entry: $1.1057 - $1.1636
🎯 TP1: $1.1756
🎯 TP2: $1.2296
🎯 TP3: $1.2455
🛑 SL: $1.0359
#FIL #Filecoin #Storage #BinanceHot #CryptoPump
1
65

·
--
Bullish
Here are the coins that are topping the search engines on the platform.
1️⃣ Bitcoin ($BTC ): Still the king, holding steady above $77,500.
2️⃣ Solana ($SOL ): Huge activity on the Solana network is reflecting in the trading volume on Binance.
3️⃣ Pepe ($PEPE ): Meme coins are back in the spotlight with high liquidity.
You can keep an eye on this list in real-time via the "Markets" section and then choose "Hot." 📱
NFA
#TrendingCrypto #BinanceHot #MEMECOİNS #MarketAnalysis #CryptoCommunity
Here are the coins that are topping the search engines on the platform.
1️⃣ Bitcoin ($BTC ): Still the king, holding steady above $77,500.
2️⃣ Solana ($SOL ): Huge activity on the Solana network is reflecting in the trading volume on Binance.
3️⃣ Pepe ($PEPE ): Meme coins are back in the spotlight with high liquidity.
You can keep an eye on this list in real-time via the "Markets" section and then choose "Hot." 📱
NFA
#TrendingCrypto #BinanceHot #MEMECOİNS #MarketAnalysis #CryptoCommunity
1️⃣ Bitcoin ($BTC ): Still the king, holding steady above $77,500.
2️⃣ Solana ($SOL ): Huge activity on the Solana network is reflecting in the trading volume on Binance.
3️⃣ Pepe ($PEPE ): Meme coins are back in the spotlight with high liquidity.
You can keep an eye on this list in real-time via the "Markets" section and then choose "Hot." 📱
NFA
#TrendingCrypto #BinanceHot #MEMECOİNS #MarketAnalysis #CryptoCommunity
79
Log in to explore more content
Join global crypto users on Binance Square
⚡️ Get latest and useful information about crypto.
💬 Trusted by the world’s largest crypto exchange.
👍 Discover real insights from verified creators.
Email / Phone number
Trending Topics
1
#BinanceIncidentReport
31,049 views
536 Discussing
2
#BinanceReopensWithdrawalsForMoreAssets
141,619 views
1,743 Discussing
3
#BinanceHourlyDepositsExceedWithdrawals
68,094 views
802 Discussing
4
#USMidtermElections
882,033 views
4,633 Discussing
5
#AnthropicIPOPricedDownasInvestorsEye$1.5T
3,960 views
49 Discussing
6
#USOctoberNFP-AreRateCutsStillPossible
164,777 views
1,281 Discussing
7
#AppleReportsMixedResults
64,640 views
976 Discussing
8
#PalantirSlides3PercentOn$2BRevenue
5,687 views
47 Discussing
9
#FrenchAssemblyRejectsTwoCryptoExitTaxProposals
12,018 views
178 Discussing
10
#Nasdaq100EntersCorrection
15,320 views
194 Discussing