
#zen
zen
6.5M views
14,521 Discussing
Hot
Latest

·
--

Article
🚨 $ZEN: The Market Sees a Forgotten Coin. We See a Strategic Turning Point.$ZEN 🚨 $ZEN: A Forgotten Crypto Asset — Or a Project Facing Its Biggest Test?
The market is focused on price. Long-term investors should be looking at something much deeper.
Horizen ($ZEN) is trading near $4.12, with its market capitalization hovering around $76 million.
At first glance, the chart looks discouraging. ZEN remains more than 97% below its previous all-time high, and recent selling pressure has pushed the token back toward its lower trading range.
But a depressed price alone does not make an asset undervalued.
There is a bigger story developing beneath the surface.
1. The Technology Behind the Token
Horizen has been repositioning itself around privacy-focused blockchain infrastructure.
Its Vela initiative aims to enable confidential computation, allowing applications to process sensitive information without exposing everything publicly.
This could become increasingly relevant as decentralized finance, institutional applications, and on-chain business operations evolve.
The opportunity is real.
But the critical question is whether developers and businesses will actually use the technology — and whether that usage will create sustainable demand for $ZEN.
2. The Supply Equation
ZEN has a maximum supply of 21 million tokens.
Approximately 18.48 million are currently circulating, meaning around 88% of the maximum supply is already in circulation.
This limits the remaining supply expansion compared with projects that have large amounts of tokens waiting to enter the market.
However, limited supply does not automatically create buying pressure.
Demand must grow faster than available selling pressure.
3. What Could the Market Be Missing?
One important development deserves attention.
Horizen has recently announced a strategic shift involving the wind-down of its L3 chain and a stronger focus on Base.
This could simplify its architecture and reduce unnecessary complexity.
However, strategic transitions also create uncertainty.
Investors should watch how staking arrangements evolve, whether existing applications continue developing, and whether the ecosystem attracts meaningful users.
A roadmap is not the same as adoption.
4. Reading the Market Without Chasing the Crowd
Recent trading data shows that ZEN has experienced significant weakness over the past week and month.
The $3.80–$3.90 region is an important near-term area to monitor.
If buyers defend this zone and trading volume improves, a recovery attempt could develop.
The first meaningful challenge would be reclaiming the recent $5.10 area.
A sustained move above that region would improve the short-term structure.
On the other hand, a decisive breakdown below recent lows could expose the token to further downside.
There is currently no reliable evidence that guarantees a major accumulation phase by large investors.
We need confirmation, not assumptions.
5. The Long-Term Investment Question
Could ZEN become more valuable over the next 1–3 years?
Potentially — but only if several conditions come together:
* Vela delivers usable privacy infrastructure.
* Developers launch applications that attract real users.
* The Base ecosystem becomes a meaningful source of liquidity and adoption.
* ZEN develops stronger economic utility within its ecosystem.
* The strategic transition is completed without damaging confidence.
If these developments fail to materialize, ZEN could remain a speculative, underperforming asset regardless of how attractive its current price appears.
Our Position at NEXUS ATLAS
We are not interested in buying a token simply because it has fallen 90% or 97%.
We are interested in identifying whether the underlying business, technology, and market demand are improving before the broader market recognizes that change.
For investors considering a long-term position, patience and capital preservation matter more than catching the exact bottom.
Never commit your entire investment capital to a single cryptocurrency. Diversify across different assets, build positions gradually, and keep capital available for unexpected market conditions.
The biggest opportunity is not always the coin that has fallen the most.
Sometimes, it is the project that proves its value while everyone else is distracted by the chart.
NEXUS ATLAS | Follow the Evidence. Not the Hype.
Disclaimer: This publication is for informational and educational purposes only. It is not financial advice or a recommendation to buy or sell ZEN. Cryptocurrency investments carry substantial risk, including the possibility of losing your entire investment.#bnb #zen #TrendingTopic $ZEN
{spot}(ZENUSDT)
🚨 $ZEN: The Market Sees a Forgotten Coin. We See a Strategic Turning Point.
$ZEN 🚨 $ZEN : A Forgotten Crypto Asset — Or a Project Facing Its Biggest Test?
The market is focused on price. Long-term investors should be looking at something much deeper.
Horizen ($ZEN ) is trading near $4.12, with its market capitalization hovering around $76 million.
At first glance, the chart looks discouraging. ZEN remains more than 97% below its previous all-time high, and recent selling pressure has pushed the token back toward its lower trading range.
But a depressed price alone does not make an asset undervalued.
There is a bigger story developing beneath the surface.
1. The Technology Behind the Token
Horizen has been repositioning itself around privacy-focused blockchain infrastructure.
Its Vela initiative aims to enable confidential computation, allowing applications to process sensitive information without exposing everything publicly.
This could become increasingly relevant as decentralized finance, institutional applications, and on-chain business operations evolve.
The opportunity is real.
But the critical question is whether developers and businesses will actually use the technology — and whether that usage will create sustainable demand for $ZEN .
2. The Supply Equation
ZEN has a maximum supply of 21 million tokens.
Approximately 18.48 million are currently circulating, meaning around 88% of the maximum supply is already in circulation.
This limits the remaining supply expansion compared with projects that have large amounts of tokens waiting to enter the market.
However, limited supply does not automatically create buying pressure.
Demand must grow faster than available selling pressure.
3. What Could the Market Be Missing?
One important development deserves attention.
Horizen has recently announced a strategic shift involving the wind-down of its L3 chain and a stronger focus on Base.
This could simplify its architecture and reduce unnecessary complexity.
However, strategic transitions also create uncertainty.
Investors should watch how staking arrangements evolve, whether existing applications continue developing, and whether the ecosystem attracts meaningful users.
A roadmap is not the same as adoption.
4. Reading the Market Without Chasing the Crowd
Recent trading data shows that ZEN has experienced significant weakness over the past week and month.
The $3.80–$3.90 region is an important near-term area to monitor.
If buyers defend this zone and trading volume improves, a recovery attempt could develop.
The first meaningful challenge would be reclaiming the recent $5.10 area.
A sustained move above that region would improve the short-term structure.
On the other hand, a decisive breakdown below recent lows could expose the token to further downside.
There is currently no reliable evidence that guarantees a major accumulation phase by large investors.
We need confirmation, not assumptions.
5. The Long-Term Investment Question
Could ZEN become more valuable over the next 1–3 years?
Potentially — but only if several conditions come together:
* Vela delivers usable privacy infrastructure.
* Developers launch applications that attract real users.
* The Base ecosystem becomes a meaningful source of liquidity and adoption.
* ZEN develops stronger economic utility within its ecosystem.
* The strategic transition is completed without damaging confidence.
If these developments fail to materialize, ZEN could remain a speculative, underperforming asset regardless of how attractive its current price appears.
Our Position at NEXUS ATLAS
We are not interested in buying a token simply because it has fallen 90% or 97%.
We are interested in identifying whether the underlying business, technology, and market demand are improving before the broader market recognizes that change.
For investors considering a long-term position, patience and capital preservation matter more than catching the exact bottom.
Never commit your entire investment capital to a single cryptocurrency. Diversify across different assets, build positions gradually, and keep capital available for unexpected market conditions.
The biggest opportunity is not always the coin that has fallen the most.
Sometimes, it is the project that proves its value while everyone else is distracted by the chart.
NEXUS ATLAS | Follow the Evidence. Not the Hype.
Disclaimer: This publication is for informational and educational purposes only. It is not financial advice or a recommendation to buy or sell ZEN. Cryptocurrency investments carry substantial risk, including the possibility of losing your entire investment.#bnb #zen #TrendingTopic $ZEN
The market is focused on price. Long-term investors should be looking at something much deeper.
Horizen ($ZEN ) is trading near $4.12, with its market capitalization hovering around $76 million.
At first glance, the chart looks discouraging. ZEN remains more than 97% below its previous all-time high, and recent selling pressure has pushed the token back toward its lower trading range.
But a depressed price alone does not make an asset undervalued.
There is a bigger story developing beneath the surface.
1. The Technology Behind the Token
Horizen has been repositioning itself around privacy-focused blockchain infrastructure.
Its Vela initiative aims to enable confidential computation, allowing applications to process sensitive information without exposing everything publicly.
This could become increasingly relevant as decentralized finance, institutional applications, and on-chain business operations evolve.
The opportunity is real.
But the critical question is whether developers and businesses will actually use the technology — and whether that usage will create sustainable demand for $ZEN .
2. The Supply Equation
ZEN has a maximum supply of 21 million tokens.
Approximately 18.48 million are currently circulating, meaning around 88% of the maximum supply is already in circulation.
This limits the remaining supply expansion compared with projects that have large amounts of tokens waiting to enter the market.
However, limited supply does not automatically create buying pressure.
Demand must grow faster than available selling pressure.
3. What Could the Market Be Missing?
One important development deserves attention.
Horizen has recently announced a strategic shift involving the wind-down of its L3 chain and a stronger focus on Base.
This could simplify its architecture and reduce unnecessary complexity.
However, strategic transitions also create uncertainty.
Investors should watch how staking arrangements evolve, whether existing applications continue developing, and whether the ecosystem attracts meaningful users.
A roadmap is not the same as adoption.
4. Reading the Market Without Chasing the Crowd
Recent trading data shows that ZEN has experienced significant weakness over the past week and month.
The $3.80–$3.90 region is an important near-term area to monitor.
If buyers defend this zone and trading volume improves, a recovery attempt could develop.
The first meaningful challenge would be reclaiming the recent $5.10 area.
A sustained move above that region would improve the short-term structure.
On the other hand, a decisive breakdown below recent lows could expose the token to further downside.
There is currently no reliable evidence that guarantees a major accumulation phase by large investors.
We need confirmation, not assumptions.
5. The Long-Term Investment Question
Could ZEN become more valuable over the next 1–3 years?
Potentially — but only if several conditions come together:
* Vela delivers usable privacy infrastructure.
* Developers launch applications that attract real users.
* The Base ecosystem becomes a meaningful source of liquidity and adoption.
* ZEN develops stronger economic utility within its ecosystem.
* The strategic transition is completed without damaging confidence.
If these developments fail to materialize, ZEN could remain a speculative, underperforming asset regardless of how attractive its current price appears.
Our Position at NEXUS ATLAS
We are not interested in buying a token simply because it has fallen 90% or 97%.
We are interested in identifying whether the underlying business, technology, and market demand are improving before the broader market recognizes that change.
For investors considering a long-term position, patience and capital preservation matter more than catching the exact bottom.
Never commit your entire investment capital to a single cryptocurrency. Diversify across different assets, build positions gradually, and keep capital available for unexpected market conditions.
The biggest opportunity is not always the coin that has fallen the most.
Sometimes, it is the project that proves its value while everyone else is distracted by the chart.
NEXUS ATLAS | Follow the Evidence. Not the Hype.
Disclaimer: This publication is for informational and educational purposes only. It is not financial advice or a recommendation to buy or sell ZEN. Cryptocurrency investments carry substantial risk, including the possibility of losing your entire investment.#bnb #zen #TrendingTopic $ZEN
171

ZEN, KITE and STX: Where Momentum, Volatility and Narrative Meet
The current market session is showing three very different setups across ZEN, KITE and STX. While KITE is attracting momentum and stronger intraday participation, ZEN and STX are navigating pullbacks after testing higher levels. The opportunity is not in chasing noise, but in watching whether volume and price structure continue to confirm the move.
ZEN is trading near $4.133, down 2.52% from its 24 hour open of $4.240. The token reached a high of $4.254 and a low of $3.815, creating an intraday range of 11.51%. That range reflects active volatility around Horizen, with more than 595K ZEN traded during the session and approximately $2.42M in quoted turnover.
The key observation for ZEN is that price has remained above the session low despite the pullback from the high. This suggests buyers are still present, but conviction needs to be confirmed through recovery in price and consistent volume. ZEN remains an infrastructure focused asset, so broader market appetite for ecosystem and technology narratives can continue to influence its behavior. If the market regains risk appetite, ZEN could attract renewed attention, but failure to maintain buyer activity may keep volatility elevated.
KITE is currently the standout performer among the three, trading near $0.1371 with an 8.47% gain from its 24 hour open of $0.1264. It reached a high of $0.1393 and a low of $0.1254, producing an 11.08% intraday range. More than 21.86M KITE changed hands, with quoted turnover near $2.88M, showing that the move is supported by visible market participation.
KITE is benefiting from strong attention around the AI narrative and its Launchpool association. The current move is notable because price is trading close to the session high rather than fading sharply after the initial rally. That does not guarantee continuation, but it shows that market participants are still actively engaging with the token. For momentum watchers, the main signal is whether volume remains healthy while price holds near its upper trading zone. A sharp drop in turnover or a rejection from the high could signal that short term enthusiasm is cooling.
STX is trading near $0.2683, down 2.61% from its 24 hour open of $0.2755. The token recorded a high of $0.2761 and a low of $0.2531, creating a 9.09% session range. Trading activity remains substantial, with more than 10.77M STX traded and around $2.85M in quoted turnover.
STX continues to be closely watched because of its connection to the Bitcoin ecosystem and its role in smart contracts and decentralized applications. The current retracement shows that the market is taking a cautious approach after price tested higher levels. However, the ability to remain above the session low is important. If demand returns alongside stronger volume, STX may regain attention from traders monitoring Bitcoin related infrastructure narratives. If selling pressure increases, volatility could remain the dominant theme.
Across all three assets, KITE currently has the strongest short term momentum, while ZEN and STX are displaying corrective price action within active trading ranges. The next phase will likely depend on whether market volume stays consistent and whether broader crypto sentiment supports riskier altcoin activity.
The most important lesson is to track confirmation, not excitement. Strong volume, sustained liquidity, and price stability matter more than a single fast candle. Crypto markets can reverse quickly, especially in assets with active narratives and elevated volatility.
#ZEN #KITE #STX #CryptoMarket #Altcoins
$ZEN
{spot}(ZENUSDT)
$KITE
{spot}(KITEUSDT)
$STX
{spot}(STXUSDT)
ZEN, KITE and STX: Where Momentum, Volatility and Narrative Meet
The current market session is showing three very different setups across ZEN, KITE and STX. While KITE is attracting momentum and stronger intraday participation, ZEN and STX are navigating pullbacks after testing higher levels. The opportunity is not in chasing noise, but in watching whether volume and price structure continue to confirm the move.
ZEN is trading near $4.133, down 2.52% from its 24 hour open of $4.240. The token reached a high of $4.254 and a low of $3.815, creating an intraday range of 11.51%. That range reflects active volatility around Horizen, with more than 595K ZEN traded during the session and approximately $2.42M in quoted turnover.
The key observation for ZEN is that price has remained above the session low despite the pullback from the high. This suggests buyers are still present, but conviction needs to be confirmed through recovery in price and consistent volume. ZEN remains an infrastructure focused asset, so broader market appetite for ecosystem and technology narratives can continue to influence its behavior. If the market regains risk appetite, ZEN could attract renewed attention, but failure to maintain buyer activity may keep volatility elevated.
KITE is currently the standout performer among the three, trading near $0.1371 with an 8.47% gain from its 24 hour open of $0.1264. It reached a high of $0.1393 and a low of $0.1254, producing an 11.08% intraday range. More than 21.86M KITE changed hands, with quoted turnover near $2.88M, showing that the move is supported by visible market participation.
KITE is benefiting from strong attention around the AI narrative and its Launchpool association. The current move is notable because price is trading close to the session high rather than fading sharply after the initial rally. That does not guarantee continuation, but it shows that market participants are still actively engaging with the token. For momentum watchers, the main signal is whether volume remains healthy while price holds near its upper trading zone. A sharp drop in turnover or a rejection from the high could signal that short term enthusiasm is cooling.
STX is trading near $0.2683, down 2.61% from its 24 hour open of $0.2755. The token recorded a high of $0.2761 and a low of $0.2531, creating a 9.09% session range. Trading activity remains substantial, with more than 10.77M STX traded and around $2.85M in quoted turnover.
STX continues to be closely watched because of its connection to the Bitcoin ecosystem and its role in smart contracts and decentralized applications. The current retracement shows that the market is taking a cautious approach after price tested higher levels. However, the ability to remain above the session low is important. If demand returns alongside stronger volume, STX may regain attention from traders monitoring Bitcoin related infrastructure narratives. If selling pressure increases, volatility could remain the dominant theme.
Across all three assets, KITE currently has the strongest short term momentum, while ZEN and STX are displaying corrective price action within active trading ranges. The next phase will likely depend on whether market volume stays consistent and whether broader crypto sentiment supports riskier altcoin activity.
The most important lesson is to track confirmation, not excitement. Strong volume, sustained liquidity, and price stability matter more than a single fast candle. Crypto markets can reverse quickly, especially in assets with active narratives and elevated volatility.
#ZEN #KITE #STX #CryptoMarket #Altcoins
$ZEN
$KITE
$STX
ZEN is trading near $4.133, down 2.52% from its 24 hour open of $4.240. The token reached a high of $4.254 and a low of $3.815, creating an intraday range of 11.51%. That range reflects active volatility around Horizen, with more than 595K ZEN traded during the session and approximately $2.42M in quoted turnover.
The key observation for ZEN is that price has remained above the session low despite the pullback from the high. This suggests buyers are still present, but conviction needs to be confirmed through recovery in price and consistent volume. ZEN remains an infrastructure focused asset, so broader market appetite for ecosystem and technology narratives can continue to influence its behavior. If the market regains risk appetite, ZEN could attract renewed attention, but failure to maintain buyer activity may keep volatility elevated.
KITE is currently the standout performer among the three, trading near $0.1371 with an 8.47% gain from its 24 hour open of $0.1264. It reached a high of $0.1393 and a low of $0.1254, producing an 11.08% intraday range. More than 21.86M KITE changed hands, with quoted turnover near $2.88M, showing that the move is supported by visible market participation.
KITE is benefiting from strong attention around the AI narrative and its Launchpool association. The current move is notable because price is trading close to the session high rather than fading sharply after the initial rally. That does not guarantee continuation, but it shows that market participants are still actively engaging with the token. For momentum watchers, the main signal is whether volume remains healthy while price holds near its upper trading zone. A sharp drop in turnover or a rejection from the high could signal that short term enthusiasm is cooling.
STX is trading near $0.2683, down 2.61% from its 24 hour open of $0.2755. The token recorded a high of $0.2761 and a low of $0.2531, creating a 9.09% session range. Trading activity remains substantial, with more than 10.77M STX traded and around $2.85M in quoted turnover.
STX continues to be closely watched because of its connection to the Bitcoin ecosystem and its role in smart contracts and decentralized applications. The current retracement shows that the market is taking a cautious approach after price tested higher levels. However, the ability to remain above the session low is important. If demand returns alongside stronger volume, STX may regain attention from traders monitoring Bitcoin related infrastructure narratives. If selling pressure increases, volatility could remain the dominant theme.
Across all three assets, KITE currently has the strongest short term momentum, while ZEN and STX are displaying corrective price action within active trading ranges. The next phase will likely depend on whether market volume stays consistent and whether broader crypto sentiment supports riskier altcoin activity.
The most important lesson is to track confirmation, not excitement. Strong volume, sustained liquidity, and price stability matter more than a single fast candle. Crypto markets can reverse quickly, especially in assets with active narratives and elevated volatility.
#ZEN #KITE #STX #CryptoMarket #Altcoins
$ZEN
$KITE
$STX
Moolish:
On TD, $ZEN printed a daily buy 13 on the 13th and a 4H buy 9 this morning, and $STX got its 4H buy 9 a few hours later. Sellers look tired on both.
1
1
26

·
--
Verified
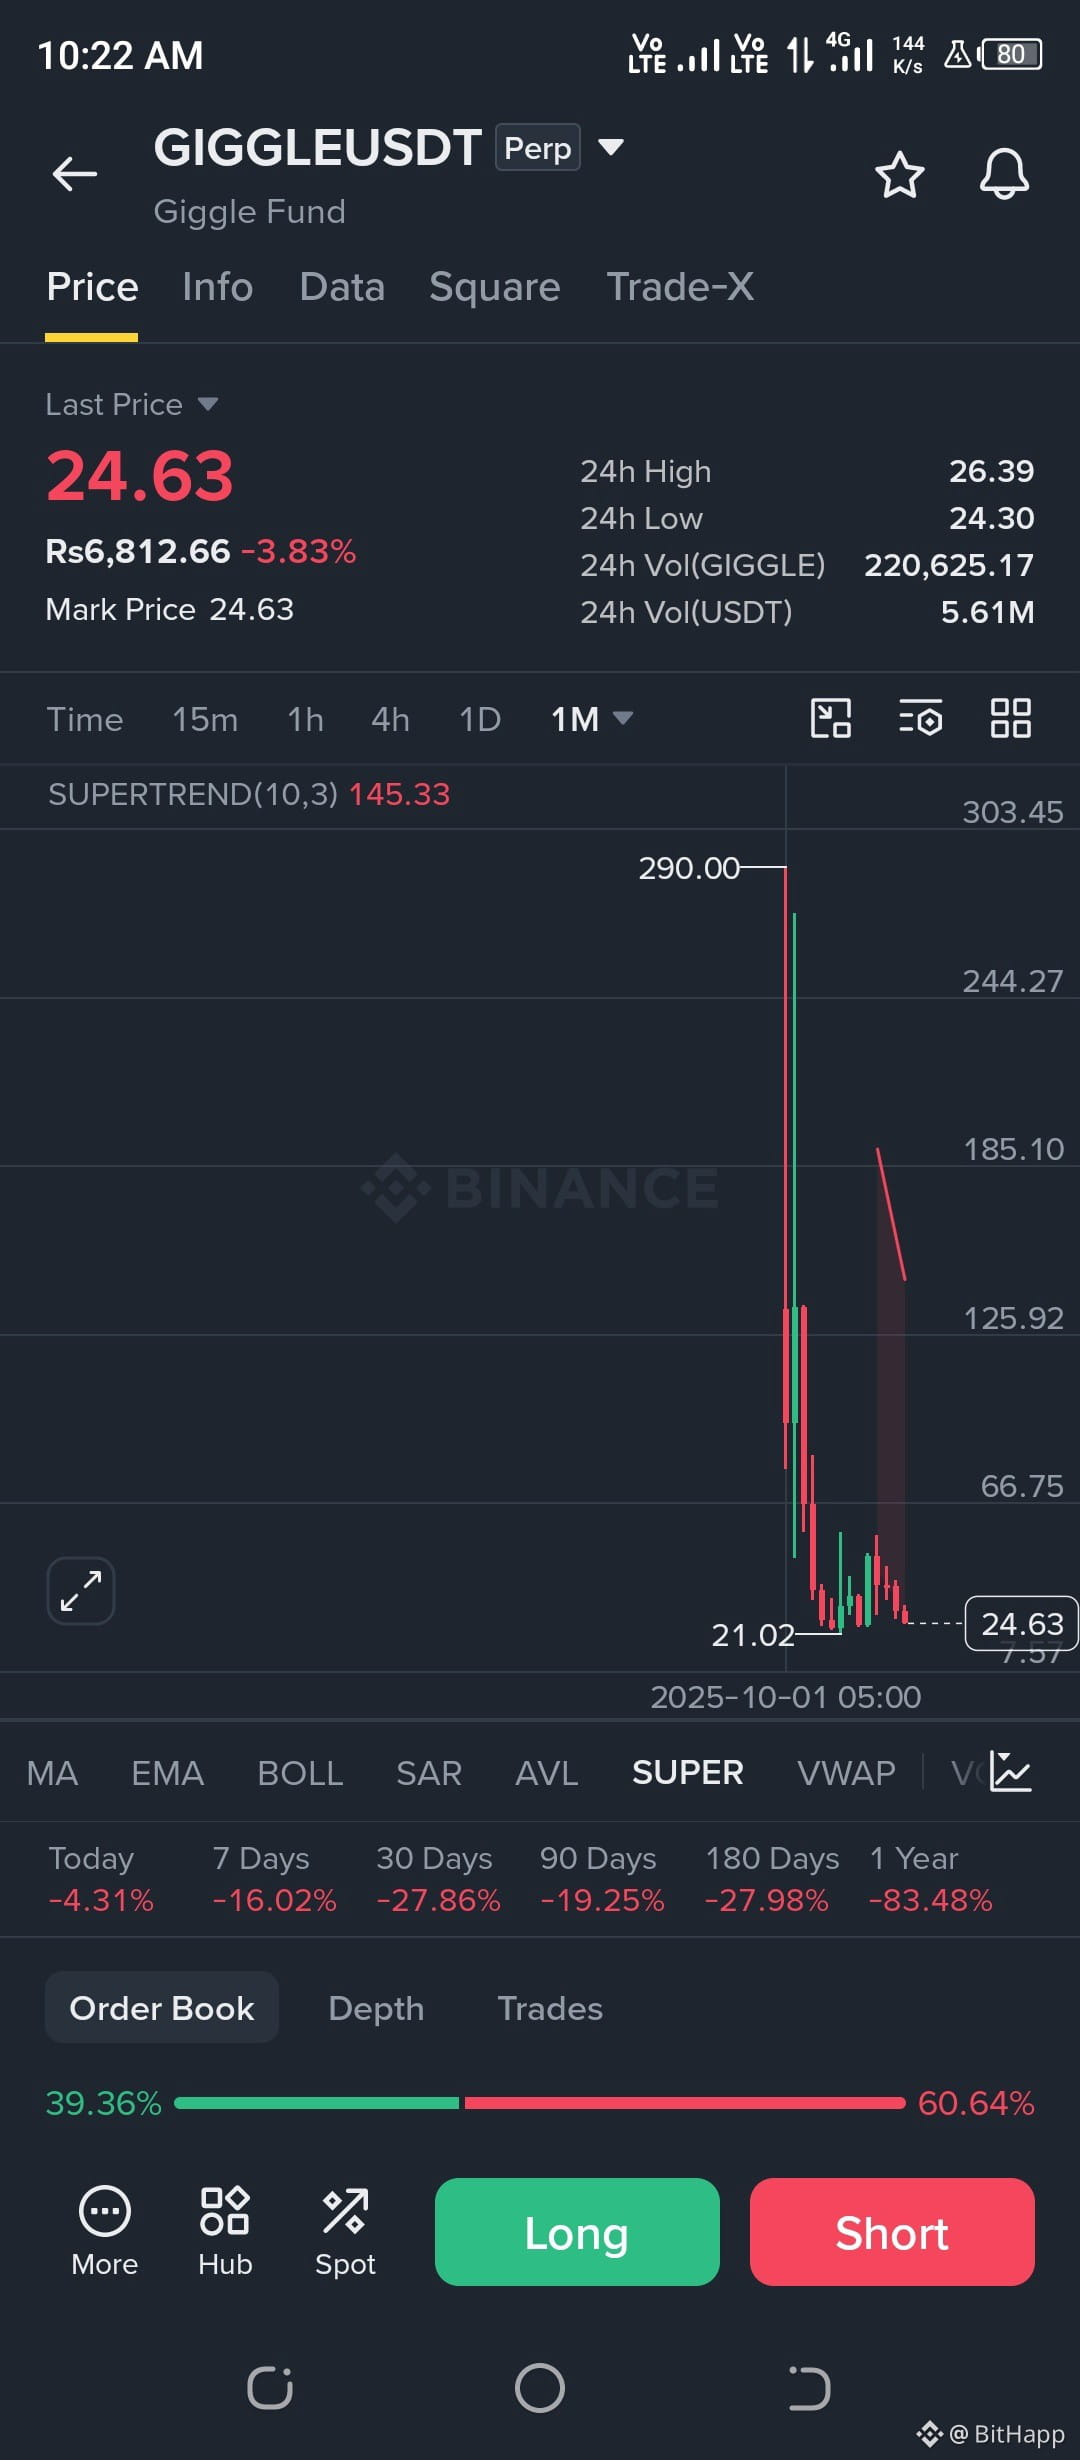
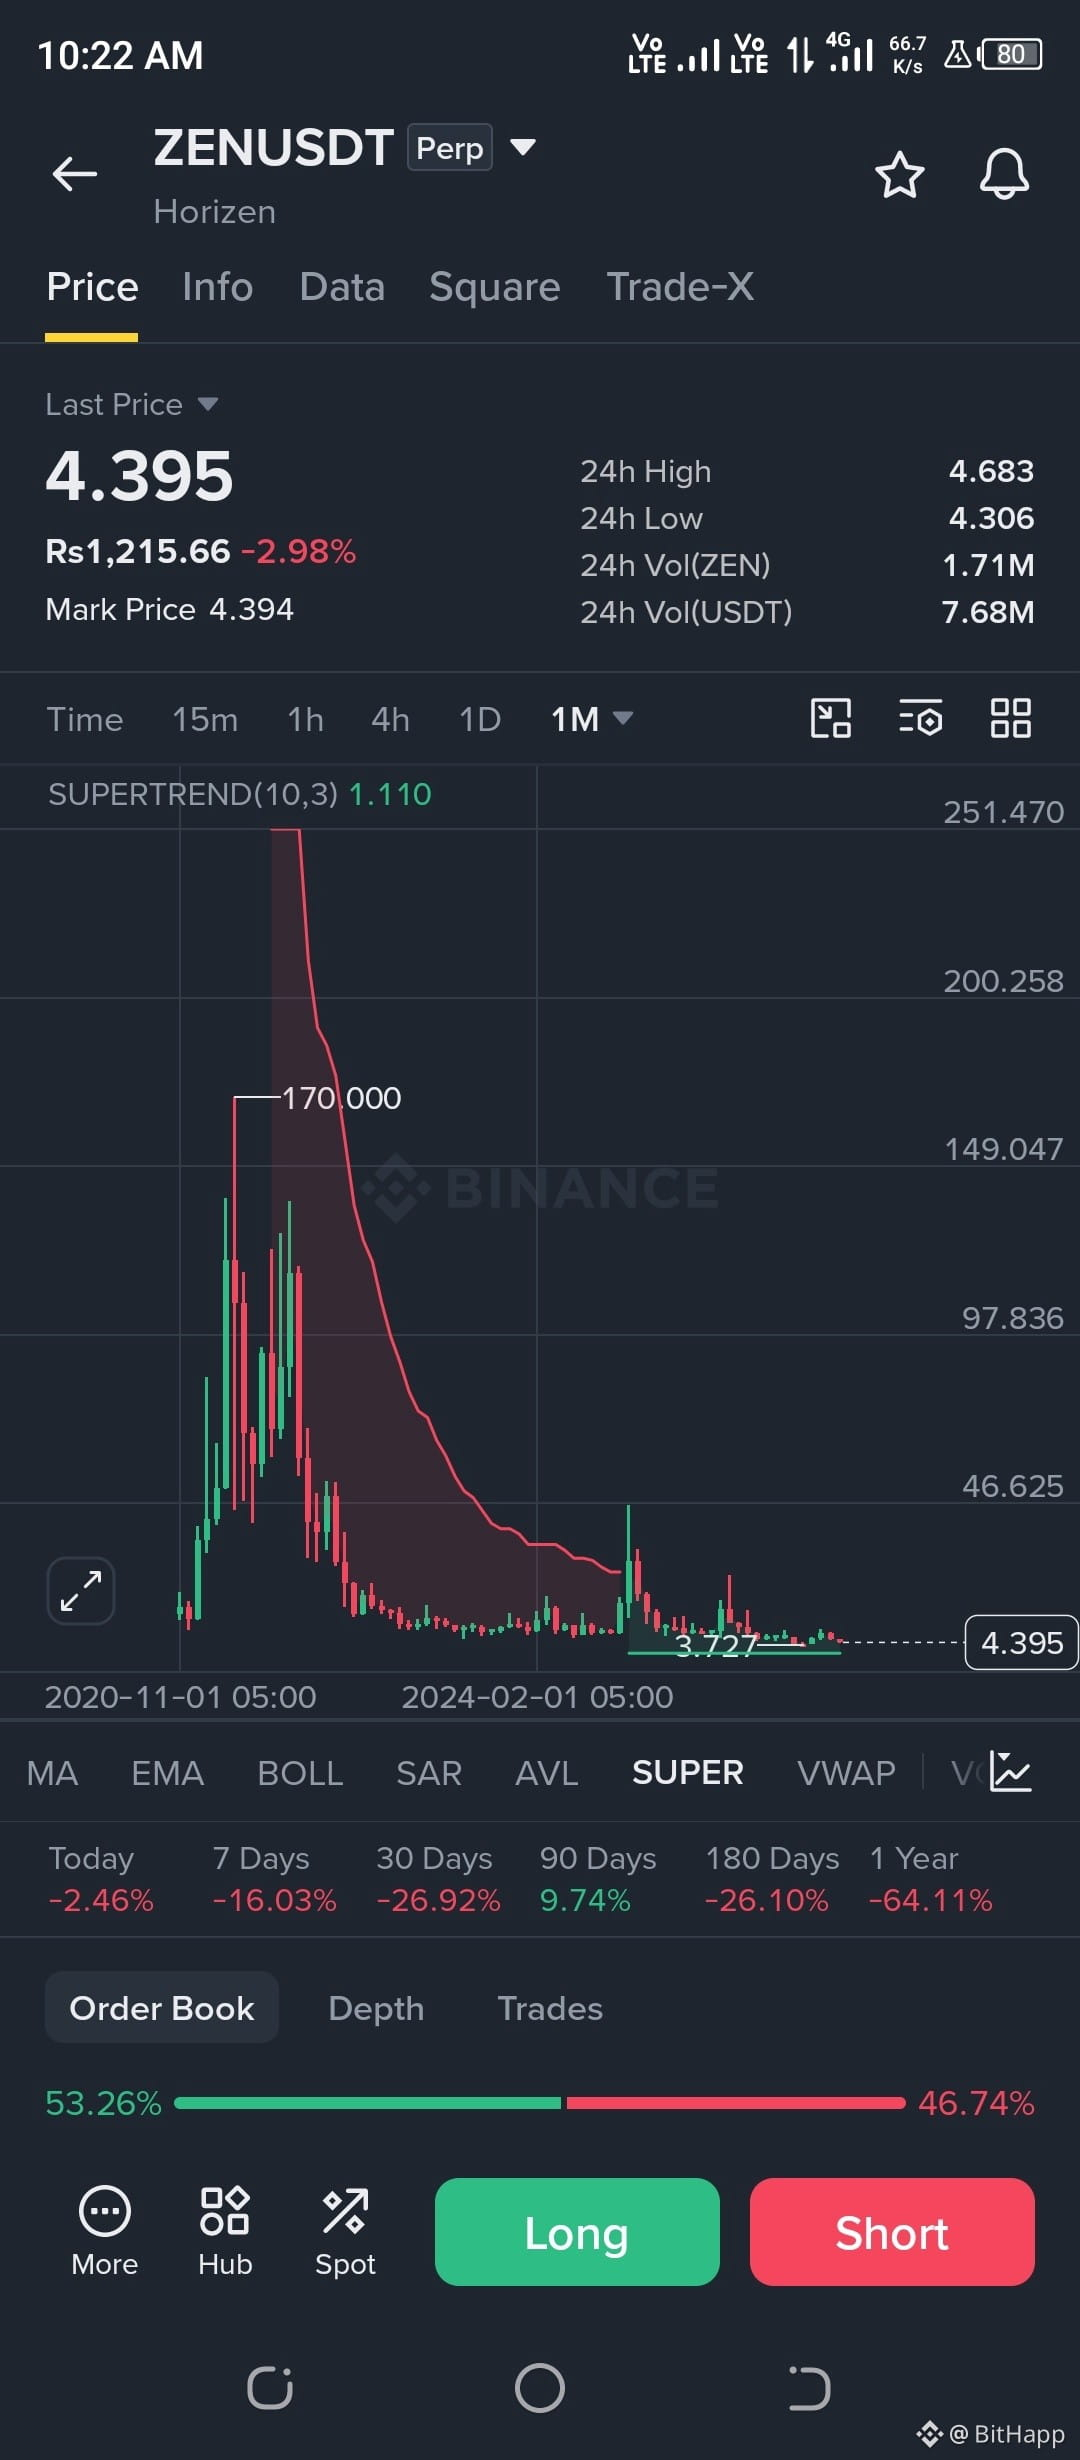
ZEN & GIGGLE – Important Crypto Market Update
Two coins worth keeping on your watchlist. But both have different market stories.
$ZEN (Horizen)
- Horizen is transitioning its ecosystem to Base.
- Its L3 network shutdown was completed on November 5.
- A new ZEN staking program on Base is expected.
- Current focus: Ecosystem development and privacy technology.
$GIGGLE (Giggle Fund)
- A meme-focused token associated with Giggle Academy's charitable mission.
- Maximum supply: approximately 986K tokens.
- Recent market weakness shows that buying pressure needs confirmation.
- No confirmed major new catalyst behind the latest price movement.
My Market View:
ZEN has an important ecosystem transition to watch, while GIGGLE remains a high-risk, sentiment-driven asset.
Don't chase sudden pumps. Watch volume, support levels and Bitcoin's direction before making any spot entry.
Research first. Protect your capital. Trade smart.
#ZEN #GIGGLE #CryptoUpdate #BinanceSquare
ZEN & GIGGLE – Important Crypto Market Update
Two coins worth keeping on your watchlist. But both have different market stories.
$ZEN (Horizen)
- Horizen is transitioning its ecosystem to Base.
- Its L3 network shutdown was completed on November 5.
- A new ZEN staking program on Base is expected.
- Current focus: Ecosystem development and privacy technology.
$GIGGLE (Giggle Fund)
- A meme-focused token associated with Giggle Academy's charitable mission.
- Maximum supply: approximately 986K tokens.
- Recent market weakness shows that buying pressure needs confirmation.
- No confirmed major new catalyst behind the latest price movement.
My Market View:
ZEN has an important ecosystem transition to watch, while GIGGLE remains a high-risk, sentiment-driven asset.
Don't chase sudden pumps. Watch volume, support levels and Bitcoin's direction before making any spot entry.
Research first. Protect your capital. Trade smart.
#ZEN #GIGGLE #CryptoUpdate #BinanceSquare
Two coins worth keeping on your watchlist. But both have different market stories.
$ZEN (Horizen)
- Horizen is transitioning its ecosystem to Base.
- Its L3 network shutdown was completed on November 5.
- A new ZEN staking program on Base is expected.
- Current focus: Ecosystem development and privacy technology.
$GIGGLE (Giggle Fund)
- A meme-focused token associated with Giggle Academy's charitable mission.
- Maximum supply: approximately 986K tokens.
- Recent market weakness shows that buying pressure needs confirmation.
- No confirmed major new catalyst behind the latest price movement.
My Market View:
ZEN has an important ecosystem transition to watch, while GIGGLE remains a high-risk, sentiment-driven asset.
Don't chase sudden pumps. Watch volume, support levels and Bitcoin's direction before making any spot entry.
Research first. Protect your capital. Trade smart.
#ZEN #GIGGLE #CryptoUpdate #BinanceSquare
KYFKON:
JAZAK ALLAH 🌟
1
3
1.4k

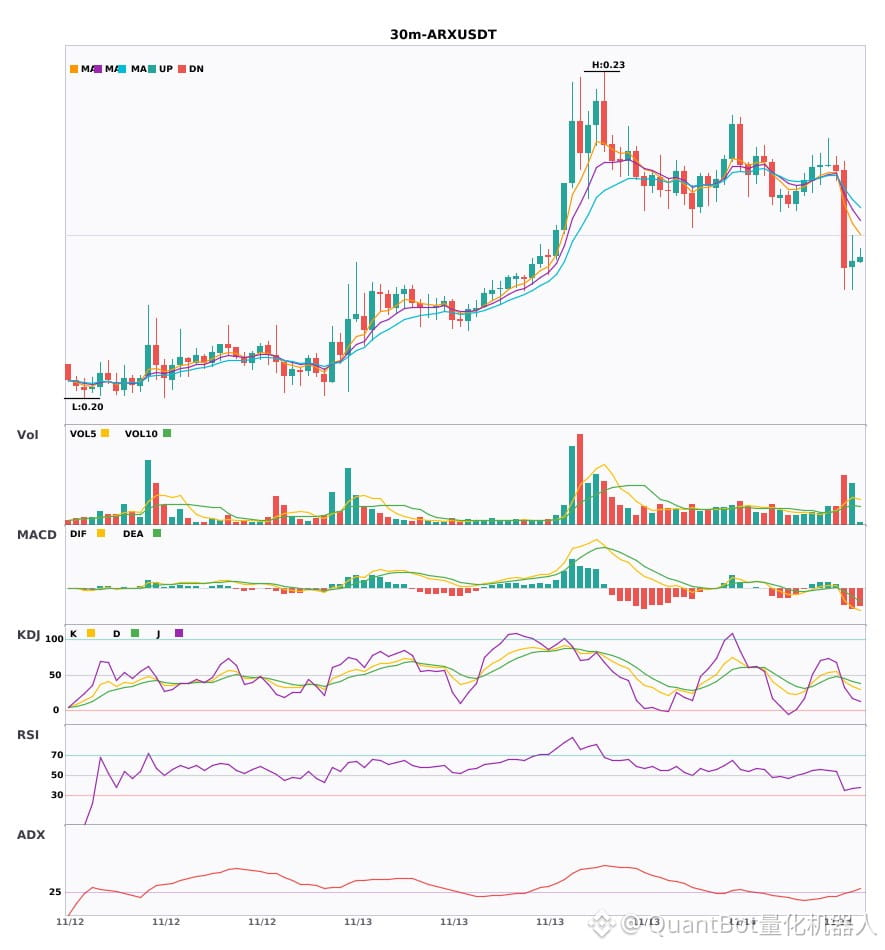
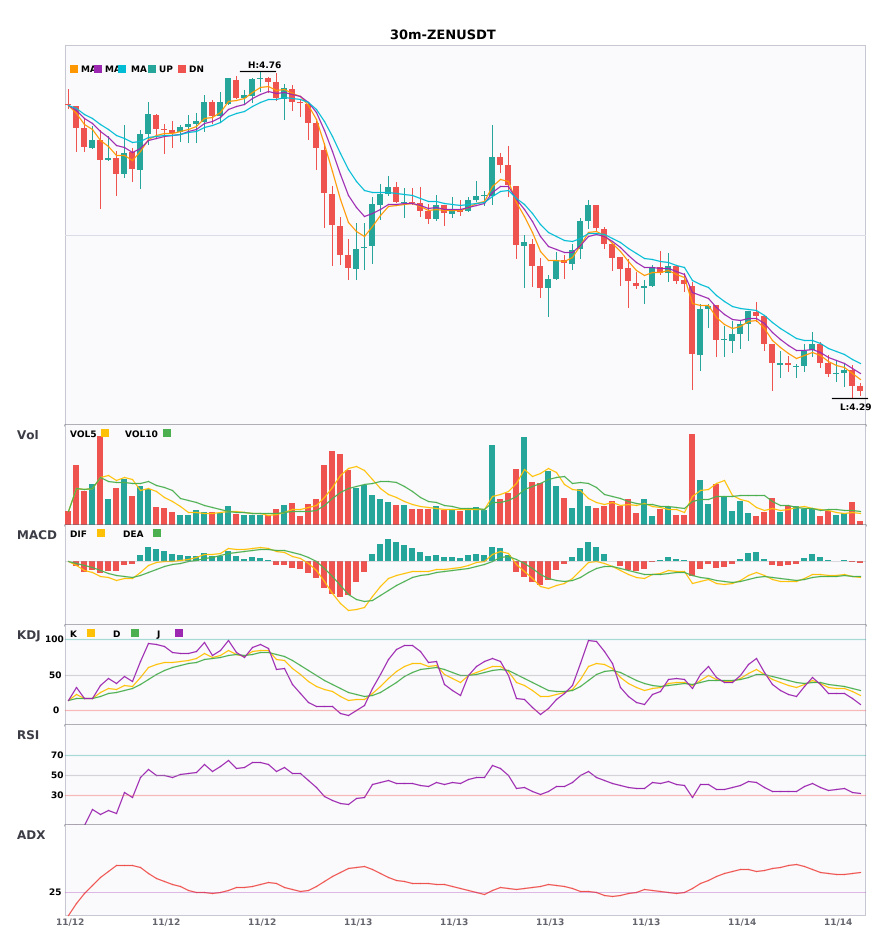
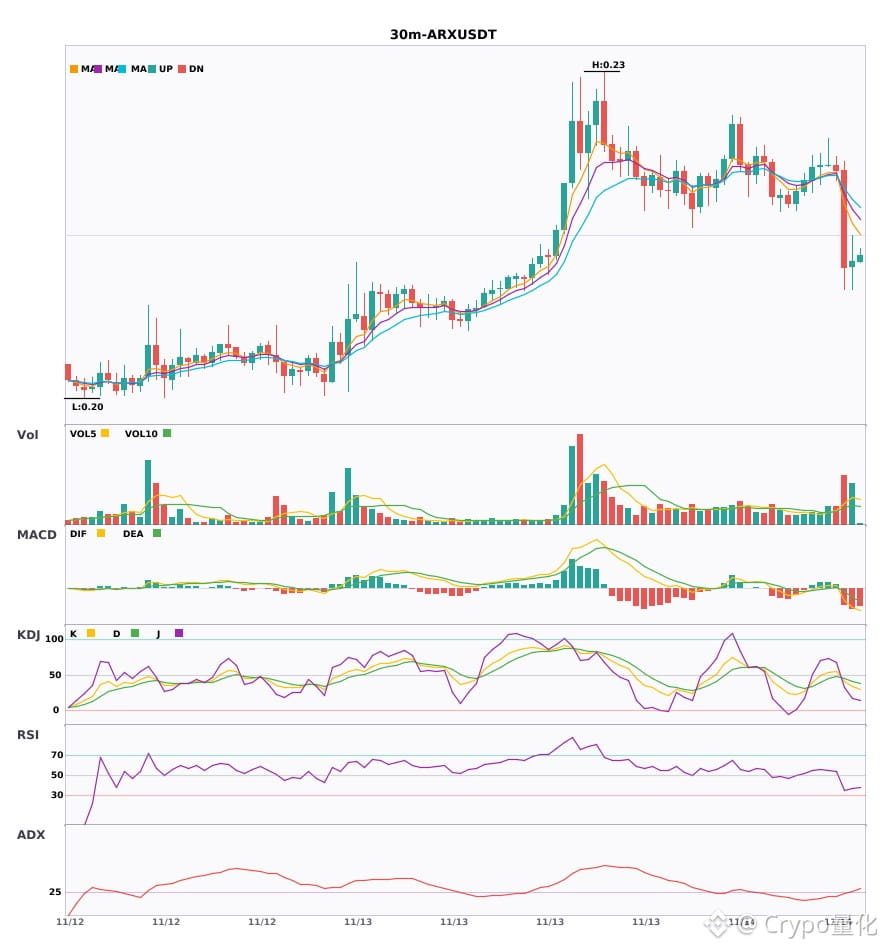
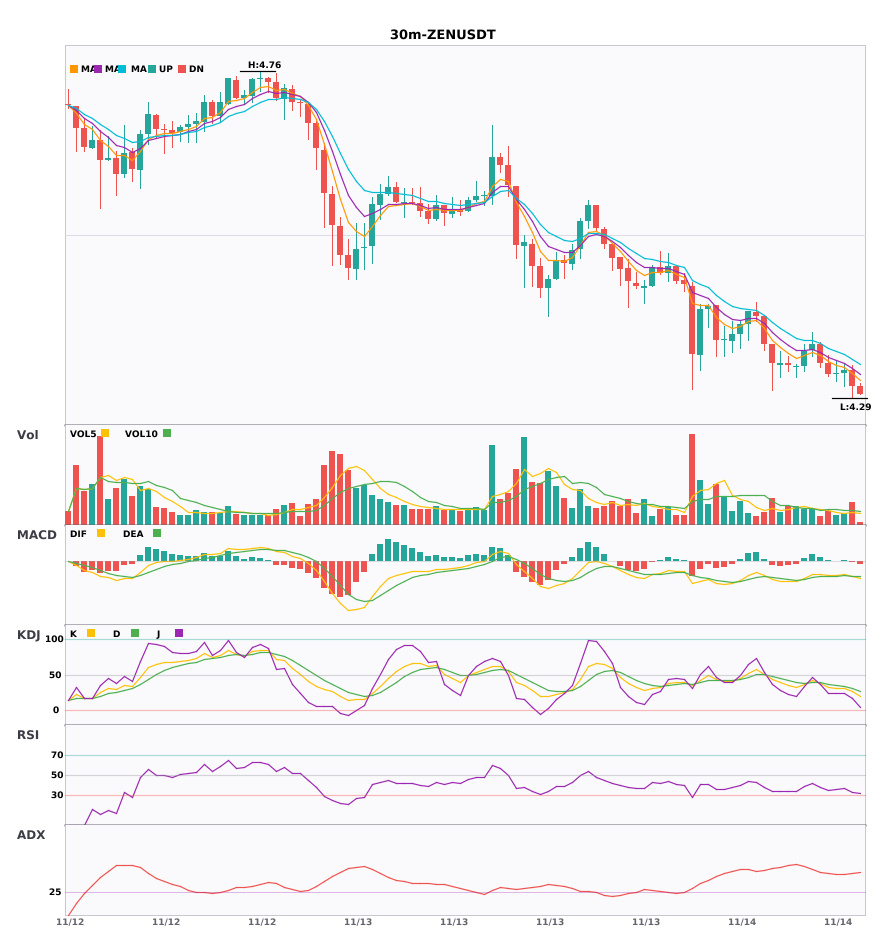
30-minute timeframe dual-coin short alert: $ARX / $ZEN
📉 $ARX | 30-minute short signal
━━━━━━━━━━━━━━━━━━
Technical analysis: ADX(25) trend is starting, creating conditions for participation|MACD bearish crossover below zero, bearish momentum strengthening|EMA5 crosses below EMA8, short-term bearish bias|KDJ bearish crossover (K40.9,D45.5), bearish in the short term|Trading volume up 2.8x
Price change: -5.2100%
📉 $ZEN | 30-minute short signal
━━━━━━━━━━━━━━━━━━
Technical analysis: ADX(45) indicates a strong trend; MACD bearish crossover below the zero line, bearish momentum accelerating; EMA5<EMA8<EMA13 forms a bearish alignment; KDJ weak at low levels (K=26.5 D=31.3), bears have the upper hand; trading volume up 1.5x.
Price change: -0.5300%
━━━━━━━━━━━━━━━━━━
#技术分析 #ARX #ZEN
📌 The above content is for reference only and does not constitute investment advice
30-minute timeframe dual-coin short alert: $ARX / $ZEN
📉 $ARX | 30-minute short signal
━━━━━━━━━━━━━━━━━━
Technical analysis: ADX(25) trend is starting, creating conditions for participation|MACD bearish crossover below zero, bearish momentum strengthening|EMA5 crosses below EMA8, short-term bearish bias|KDJ bearish crossover (K40.9,D45.5), bearish in the short term|Trading volume up 2.8x
Price change: -5.2100%
📉 $ZEN | 30-minute short signal
━━━━━━━━━━━━━━━━━━
Technical analysis: ADX(45) indicates a strong trend; MACD bearish crossover below the zero line, bearish momentum accelerating; EMA5<EMA8<EMA13 forms a bearish alignment; KDJ weak at low levels (K=26.5 D=31.3), bears have the upper hand; trading volume up 1.5x.
Price change: -0.5300%
━━━━━━━━━━━━━━━━━━
#技术分析 #ARX #ZEN
📌 The above content is for reference only and does not constitute investment advice
📉 $ARX | 30-minute short signal
━━━━━━━━━━━━━━━━━━
Technical analysis: ADX(25) trend is starting, creating conditions for participation|MACD bearish crossover below zero, bearish momentum strengthening|EMA5 crosses below EMA8, short-term bearish bias|KDJ bearish crossover (K40.9,D45.5), bearish in the short term|Trading volume up 2.8x
Price change: -5.2100%
📉 $ZEN | 30-minute short signal
━━━━━━━━━━━━━━━━━━
Technical analysis: ADX(45) indicates a strong trend; MACD bearish crossover below the zero line, bearish momentum accelerating; EMA5<EMA8<EMA13 forms a bearish alignment; KDJ weak at low levels (K=26.5 D=31.3), bears have the upper hand; trading volume up 1.5x.
Price change: -0.5300%
━━━━━━━━━━━━━━━━━━
#技术分析 #ARX #ZEN
📌 The above content is for reference only and does not constitute investment advice
26

·
--
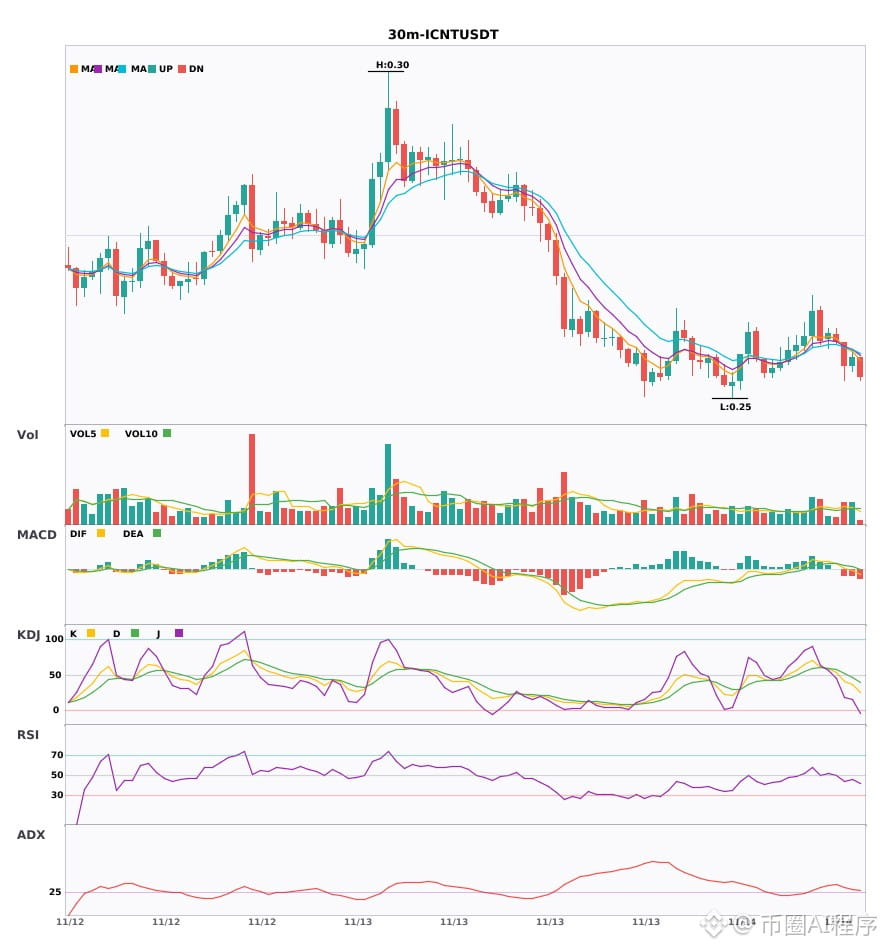
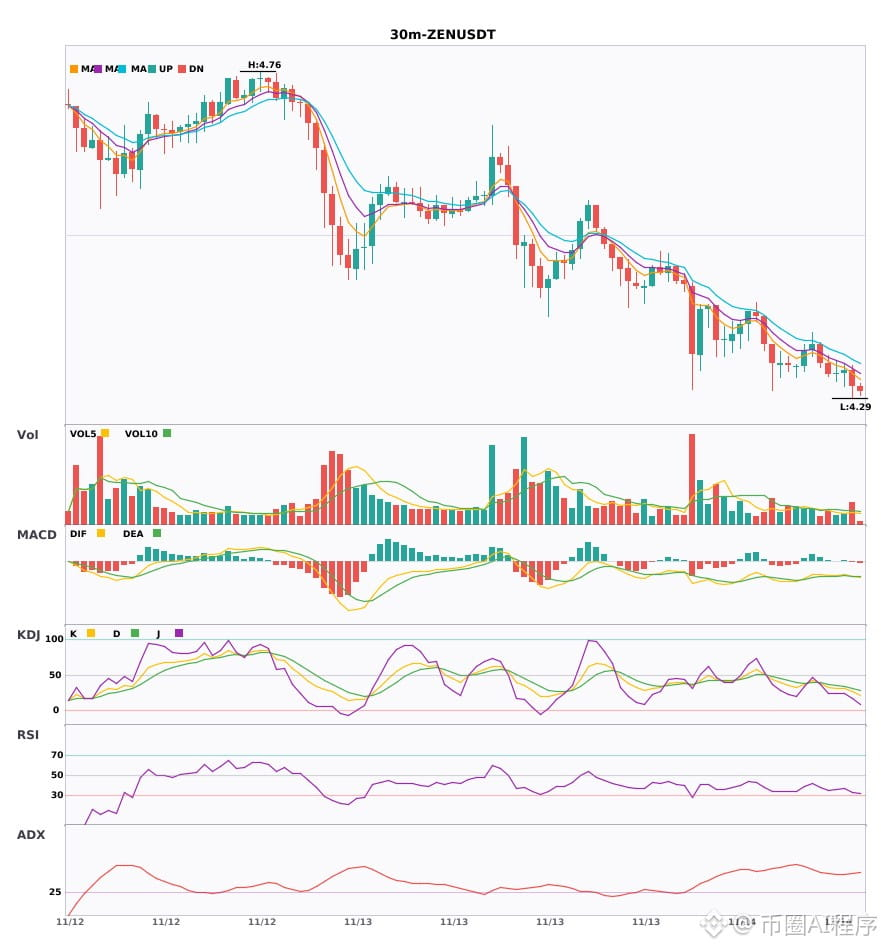
$ICNT/$ZEN 30-minute short signal detected; 4-hour bearish trend confirmed🔥
════════════════════
🟢 $ICNT 30-minute short signal
⚠️Technical analysis: 4-hour and 30-minute bearish confluence, with confirmation across multiple timeframes. MACD bearish crossover breaks below the zero line and the green histogram bars expand; moving averages are bearishly aligned and diverging downward; KDJ K crosses below D, indicating weakness. Bears have the upper hand.
════════════════════
🟢 $ZEN 30-minute short signal
⚠️Technical analysis: 30-minute entry, confirmed by 4-hour bearish confluence. MACD accelerates downward after the bearish crossover; moving averages are bearishly aligned and diverging; KDJ is weak, with bears dominant. Volume expands 1.5x, signaling a confluence short opportunity.
════════════════════
🔔 Follow for first-hand market movement updates 🔔
#多周期共振 #ICNT #ZEN
📌 When trading, pay attention to whether the candlestick pattern meets the criteria
$ICNT /$ZEN 30-minute short signal detected; 4-hour bearish trend confirmed🔥
════════════════════
🟢 $ICNT 30-minute short signal
⚠️Technical analysis: 4-hour and 30-minute bearish confluence, with confirmation across multiple timeframes. MACD bearish crossover breaks below the zero line and the green histogram bars expand; moving averages are bearishly aligned and diverging downward; KDJ K crosses below D, indicating weakness. Bears have the upper hand.
════════════════════
🟢 $ZEN 30-minute short signal
⚠️Technical analysis: 30-minute entry, confirmed by 4-hour bearish confluence. MACD accelerates downward after the bearish crossover; moving averages are bearishly aligned and diverging; KDJ is weak, with bears dominant. Volume expands 1.5x, signaling a confluence short opportunity.
════════════════════
🔔 Follow for first-hand market movement updates 🔔
#多周期共振 #ICNT #ZEN
📌 When trading, pay attention to whether the candlestick pattern meets the criteria
════════════════════
🟢 $ICNT 30-minute short signal
⚠️Technical analysis: 4-hour and 30-minute bearish confluence, with confirmation across multiple timeframes. MACD bearish crossover breaks below the zero line and the green histogram bars expand; moving averages are bearishly aligned and diverging downward; KDJ K crosses below D, indicating weakness. Bears have the upper hand.
════════════════════
🟢 $ZEN 30-minute short signal
⚠️Technical analysis: 30-minute entry, confirmed by 4-hour bearish confluence. MACD accelerates downward after the bearish crossover; moving averages are bearishly aligned and diverging; KDJ is weak, with bears dominant. Volume expands 1.5x, signaling a confluence short opportunity.
════════════════════
🔔 Follow for first-hand market movement updates 🔔
#多周期共振 #ICNT #ZEN
📌 When trading, pay attention to whether the candlestick pattern meets the criteria
40

·
--
2 short alerts on the 30-minute timeframe: $ARX / $ZEN🔥
════════════════════
🟢 $ARX 30-minute short signal
⚠️ Technical analysis: ADX trend is just starting and can be followed; MACD bearish crossover below zero is accelerating; EMA5 crossed below EMA8, turning bearish; KDJ bearish crossover, K40.9 D45.5; volume up 2.8x
════════════════════
🟢 $ZEN 30-minute short signal
⚠️ Technical analysis: ADX indicates a very strong trend; MACD bearish crossover below zero, with bearish momentum accelerating; moving averages are bearishly aligned and diverging downward; KDJ is weak, with K below D; trading volume up 1.5x, bears have the advantage.
════════════════════
🔔 Follow for first-hand market alerts 🔔
#技术分析 #ARX #ZEN
📌 When trading, pay attention to whether the candlestick pattern matches
2 short alerts on the 30-minute timeframe: $ARX / $ZEN 🔥
════════════════════
🟢 $ARX 30-minute short signal
⚠️ Technical analysis: ADX trend is just starting and can be followed; MACD bearish crossover below zero is accelerating; EMA5 crossed below EMA8, turning bearish; KDJ bearish crossover, K40.9 D45.5; volume up 2.8x
════════════════════
🟢 $ZEN 30-minute short signal
⚠️ Technical analysis: ADX indicates a very strong trend; MACD bearish crossover below zero, with bearish momentum accelerating; moving averages are bearishly aligned and diverging downward; KDJ is weak, with K below D; trading volume up 1.5x, bears have the advantage.
════════════════════
🔔 Follow for first-hand market alerts 🔔
#技术分析 #ARX #ZEN
📌 When trading, pay attention to whether the candlestick pattern matches
════════════════════
🟢 $ARX 30-minute short signal
⚠️ Technical analysis: ADX trend is just starting and can be followed; MACD bearish crossover below zero is accelerating; EMA5 crossed below EMA8, turning bearish; KDJ bearish crossover, K40.9 D45.5; volume up 2.8x
════════════════════
🟢 $ZEN 30-minute short signal
⚠️ Technical analysis: ADX indicates a very strong trend; MACD bearish crossover below zero, with bearish momentum accelerating; moving averages are bearishly aligned and diverging downward; KDJ is weak, with K below D; trading volume up 1.5x, bears have the advantage.
════════════════════
🔔 Follow for first-hand market alerts 🔔
#技术分析 #ARX #ZEN
📌 When trading, pay attention to whether the candlestick pattern matches
25
·
--
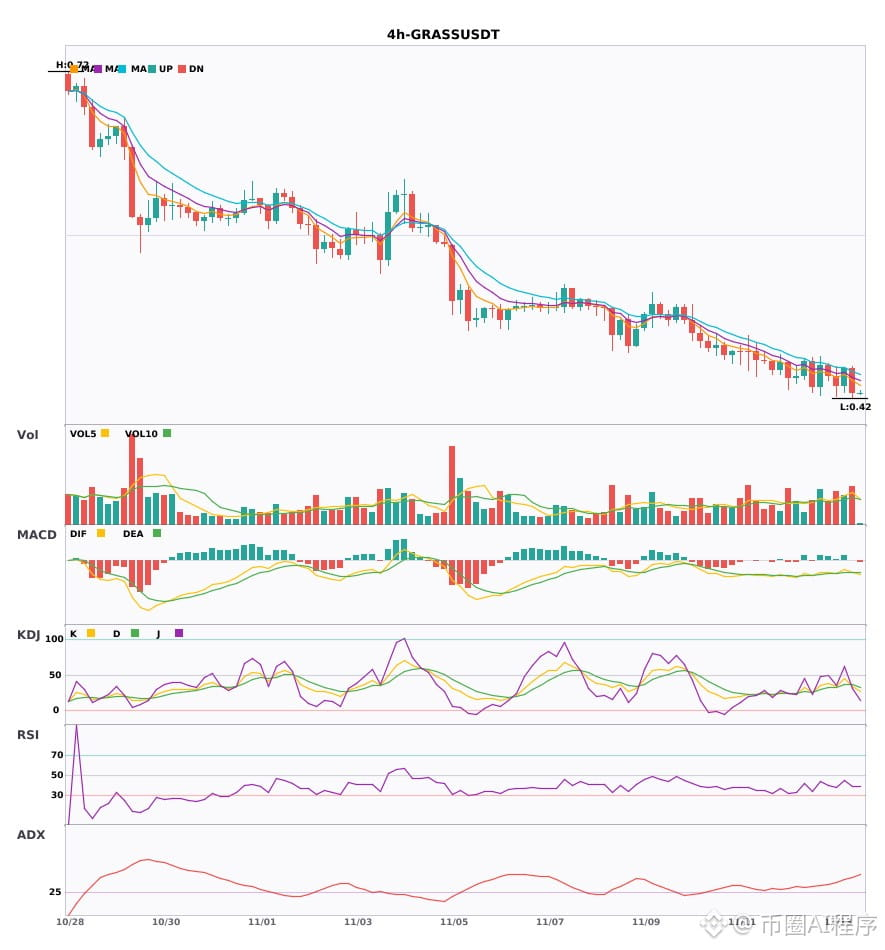
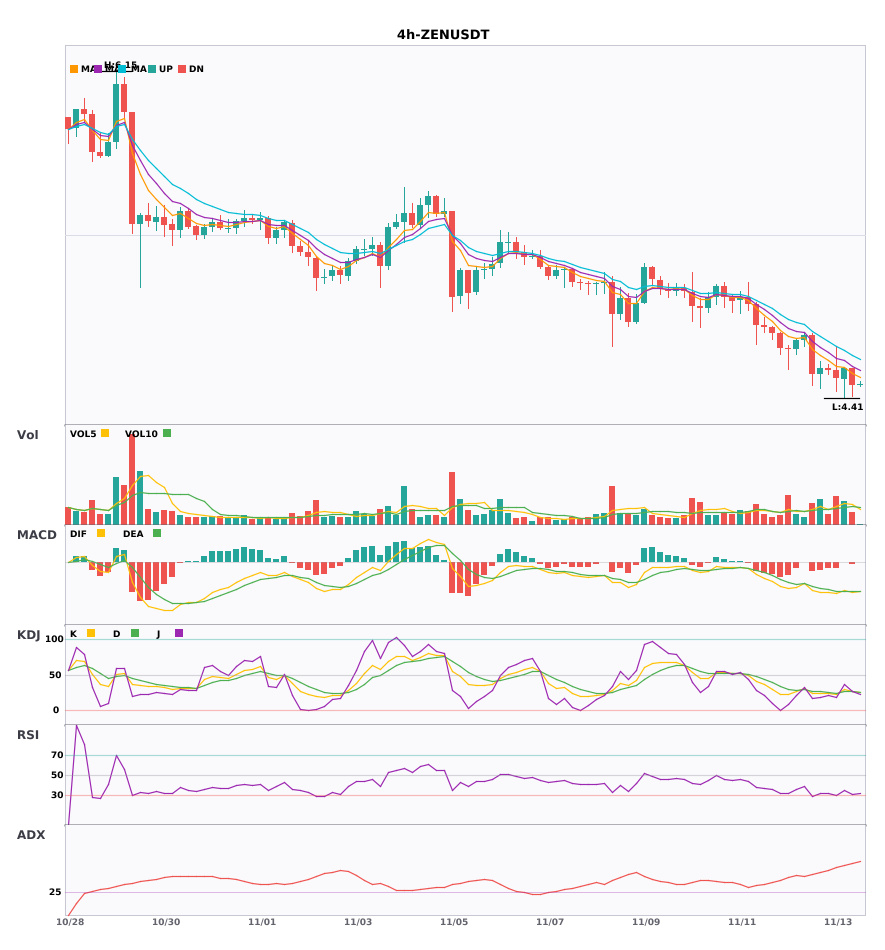
$PEOPLE $GRASS $ZEN The 4-hour and daily charts are bearish, with moving averages diverging downward🔥
════════════════════
🟢 $PEOPLE 4-hour bearish signal
⚠️Technical analysis: Bearish signals on both the 4-hour and daily charts confirm a multi-timeframe confluence! MACD has a bearish crossover below zero, with expanding green bars; moving averages are bearishly aligned and trending downward; KDJ is weak but not oversold; volume is 1.4x.
📢Market update: Amazon says the code for its new cloud testing tool was generated by AI, without being written or reviewed by humans; humans only built development guardrails, and AWS requires application security to be tested in real cloud environments.
════════════════════
🟢 $GRASS 4-hour bearish signal
⚠️Technical analysis: The daily bearish trend and 4-hour entry signal confirm a confluence. MACD has a bearish crossover below zero on increased volume; moving averages are bearishly aligned and diverging downward; KDJ has a bearish crossover but is not oversold. The short-term outlook is bearish.
════════════════════
🟢 $ZEN 4-hour bearish signal
⚠️Technical analysis: Multi-timeframe confluence for a short: the 4-hour entry signal is confirmed by the daily bearish trend! MACD's bearish crossover below zero is accelerating on increased volume; moving averages are bearishly aligned and diverging downward; KDJ is weak, with bears in control.
════════════════════
🔔 Follow for first-hand market alerts 🔔
#多周期共振 #PEOPLE #GRASS #ZEN
📌 When trading, pay attention to whether the candlestick pattern matches
$PEOPLE $GRASS $ZEN The 4-hour and daily charts are bearish, with moving averages diverging downward🔥
════════════════════
🟢 $PEOPLE 4-hour bearish signal
⚠️Technical analysis: Bearish signals on both the 4-hour and daily charts confirm a multi-timeframe confluence! MACD has a bearish crossover below zero, with expanding green bars; moving averages are bearishly aligned and trending downward; KDJ is weak but not oversold; volume is 1.4x.
📢Market update: Amazon says the code for its new cloud testing tool was generated by AI, without being written or reviewed by humans; humans only built development guardrails, and AWS requires application security to be tested in real cloud environments.
════════════════════
🟢 $GRASS 4-hour bearish signal
⚠️Technical analysis: The daily bearish trend and 4-hour entry signal confirm a confluence. MACD has a bearish crossover below zero on increased volume; moving averages are bearishly aligned and diverging downward; KDJ has a bearish crossover but is not oversold. The short-term outlook is bearish.
════════════════════
🟢 $ZEN 4-hour bearish signal
⚠️Technical analysis: Multi-timeframe confluence for a short: the 4-hour entry signal is confirmed by the daily bearish trend! MACD's bearish crossover below zero is accelerating on increased volume; moving averages are bearishly aligned and diverging downward; KDJ is weak, with bears in control.
════════════════════
🔔 Follow for first-hand market alerts 🔔
#多周期共振 #PEOPLE #GRASS #ZEN
📌 When trading, pay attention to whether the candlestick pattern matches
════════════════════
🟢 $PEOPLE 4-hour bearish signal
⚠️Technical analysis: Bearish signals on both the 4-hour and daily charts confirm a multi-timeframe confluence! MACD has a bearish crossover below zero, with expanding green bars; moving averages are bearishly aligned and trending downward; KDJ is weak but not oversold; volume is 1.4x.
📢Market update: Amazon says the code for its new cloud testing tool was generated by AI, without being written or reviewed by humans; humans only built development guardrails, and AWS requires application security to be tested in real cloud environments.
════════════════════
🟢 $GRASS 4-hour bearish signal
⚠️Technical analysis: The daily bearish trend and 4-hour entry signal confirm a confluence. MACD has a bearish crossover below zero on increased volume; moving averages are bearishly aligned and diverging downward; KDJ has a bearish crossover but is not oversold. The short-term outlook is bearish.
════════════════════
🟢 $ZEN 4-hour bearish signal
⚠️Technical analysis: Multi-timeframe confluence for a short: the 4-hour entry signal is confirmed by the daily bearish trend! MACD's bearish crossover below zero is accelerating on increased volume; moving averages are bearishly aligned and diverging downward; KDJ is weak, with bears in control.
════════════════════
🔔 Follow for first-hand market alerts 🔔
#多周期共振 #PEOPLE #GRASS #ZEN
📌 When trading, pay attention to whether the candlestick pattern matches
89
·
--
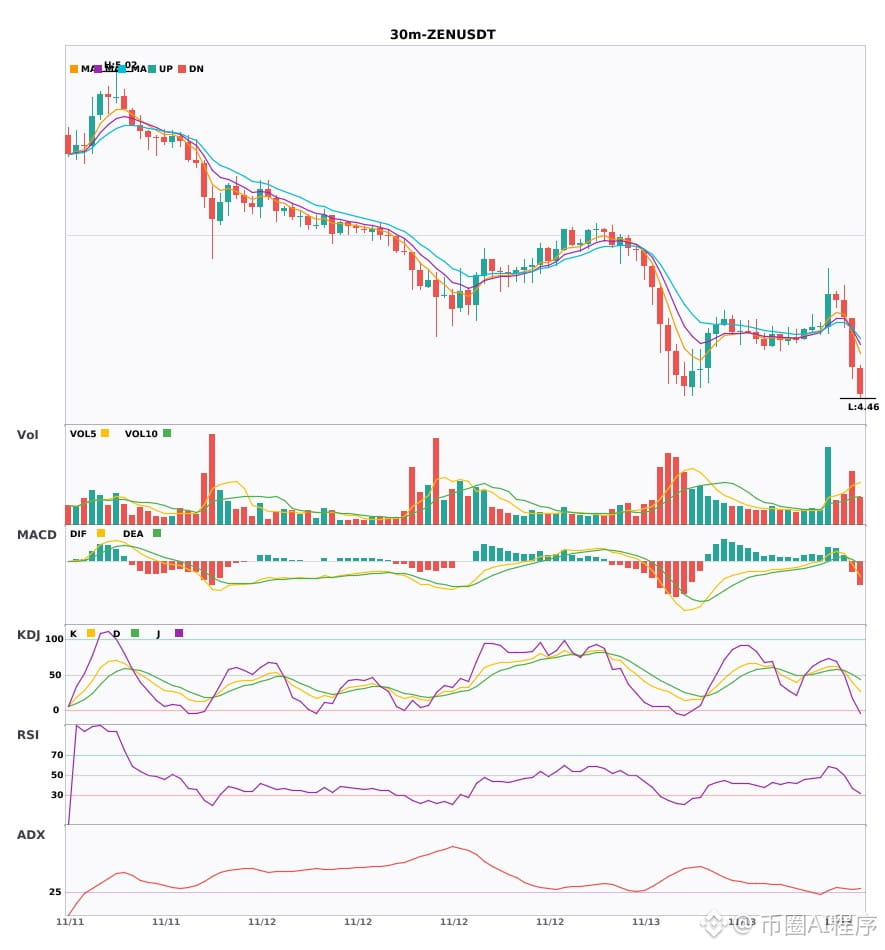
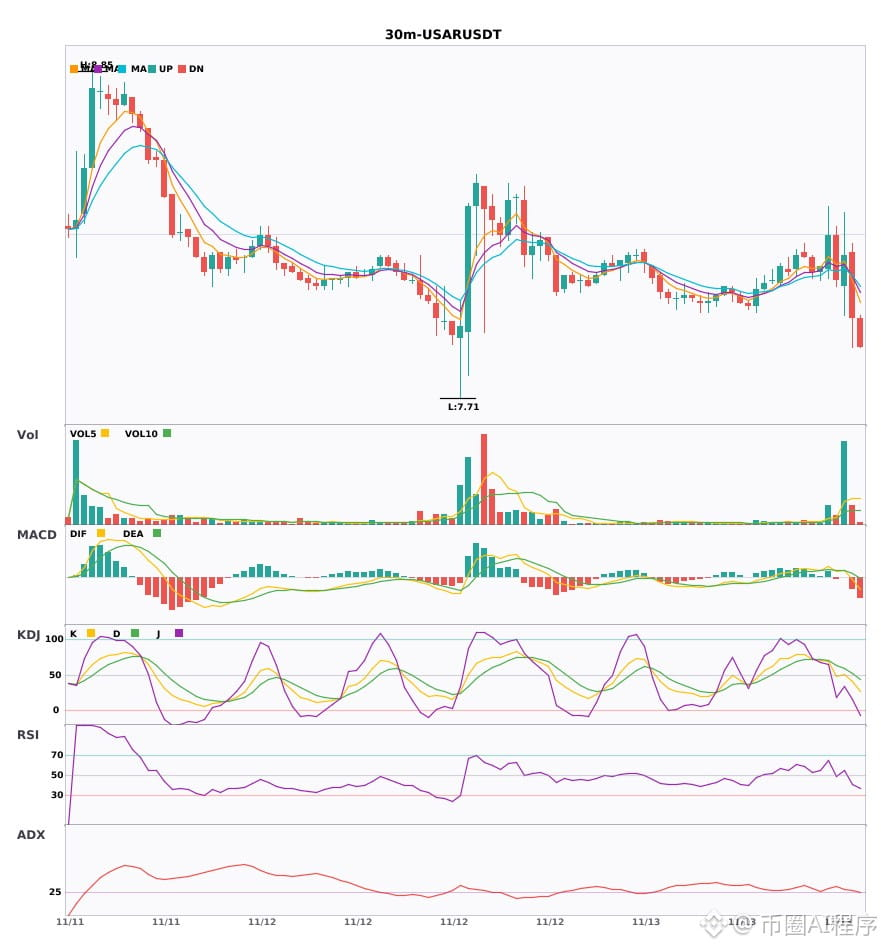
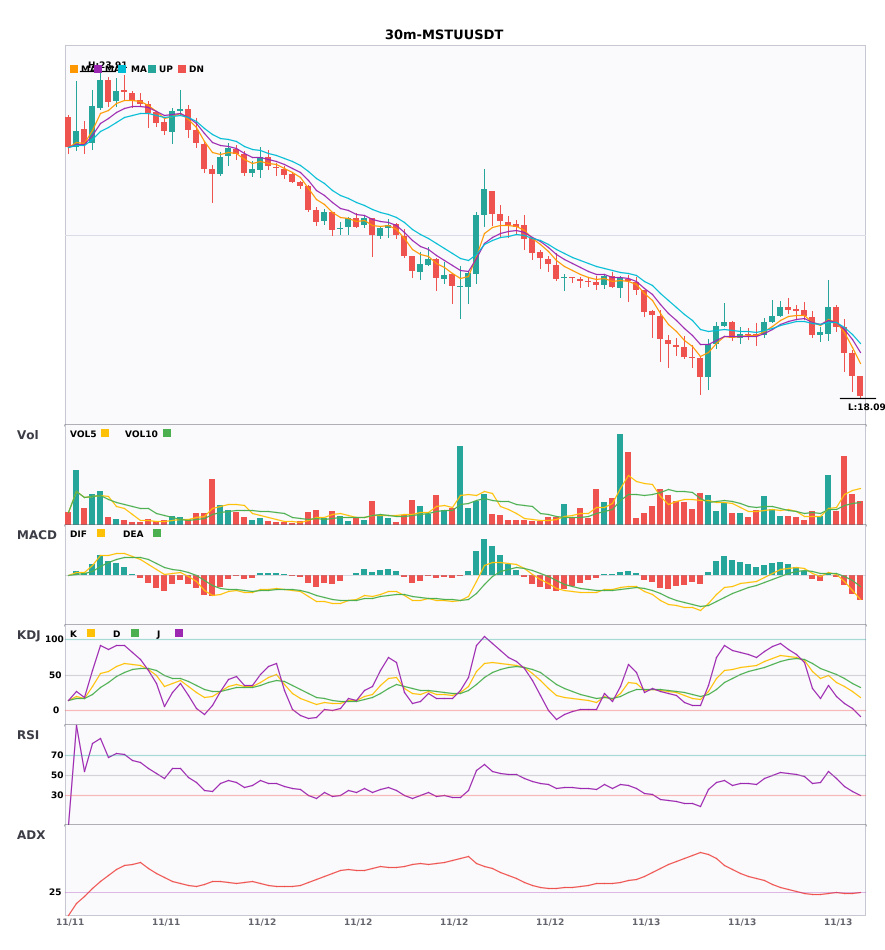
$ZEN $USAR $MSTU 30-minute 4-hour double bearish signal🔥
════════════════════
🟢 $ZEN 30-minute bearish signal
⚠️Technical analysis: 4-hour bearish trend + 30-minute confluence confirmation; MACD bearish crossover with accelerating volume; moving averages bearishly aligned and diverging downward; trading volume doubled
════════════════════
🟢 $USAR 30-minute bearish signal
⚠️Technical analysis: 4-hour bullish trend + daily bullish confluence confirmation; 30-minute MACD bullish crossover with rising volume and red bars continuing to grow; moving averages bullishly aligned and diverging upward; KDJ K crossed above D and has not entered the overbought zone
════════════════════
🟢 $MSTU 30-minute bearish signal
⚠️Technical analysis: 4-hour bearish trend + 30-minute confluence confirmation: MACD bearish crossover broke below the zero line on rising volume; moving averages bearishly aligned and moving downward; KDJ K crossed below D but is not oversold; volume increased 3.4 times
════════════════════
🔔 Follow to get first-hand market updates 🔔
#多周期共振 #ZEN #USAR #MSTU
📌 When trading, pay attention to whether the candlestick pattern aligns
$ZEN $USAR $MSTU 30-minute 4-hour double bearish signal🔥
════════════════════
🟢 $ZEN 30-minute bearish signal
⚠️Technical analysis: 4-hour bearish trend + 30-minute confluence confirmation; MACD bearish crossover with accelerating volume; moving averages bearishly aligned and diverging downward; trading volume doubled
════════════════════
🟢 $USAR 30-minute bearish signal
⚠️Technical analysis: 4-hour bullish trend + daily bullish confluence confirmation; 30-minute MACD bullish crossover with rising volume and red bars continuing to grow; moving averages bullishly aligned and diverging upward; KDJ K crossed above D and has not entered the overbought zone
════════════════════
🟢 $MSTU 30-minute bearish signal
⚠️Technical analysis: 4-hour bearish trend + 30-minute confluence confirmation: MACD bearish crossover broke below the zero line on rising volume; moving averages bearishly aligned and moving downward; KDJ K crossed below D but is not oversold; volume increased 3.4 times
════════════════════
🔔 Follow to get first-hand market updates 🔔
#多周期共振 #ZEN #USAR #MSTU
📌 When trading, pay attention to whether the candlestick pattern aligns
════════════════════
🟢 $ZEN 30-minute bearish signal
⚠️Technical analysis: 4-hour bearish trend + 30-minute confluence confirmation; MACD bearish crossover with accelerating volume; moving averages bearishly aligned and diverging downward; trading volume doubled
════════════════════
🟢 $USAR 30-minute bearish signal
⚠️Technical analysis: 4-hour bullish trend + daily bullish confluence confirmation; 30-minute MACD bullish crossover with rising volume and red bars continuing to grow; moving averages bullishly aligned and diverging upward; KDJ K crossed above D and has not entered the overbought zone
════════════════════
🟢 $MSTU 30-minute bearish signal
⚠️Technical analysis: 4-hour bearish trend + 30-minute confluence confirmation: MACD bearish crossover broke below the zero line on rising volume; moving averages bearishly aligned and moving downward; KDJ K crossed below D but is not oversold; volume increased 3.4 times
════════════════════
🔔 Follow to get first-hand market updates 🔔
#多周期共振 #ZEN #USAR #MSTU
📌 When trading, pay attention to whether the candlestick pattern aligns
41
·
--
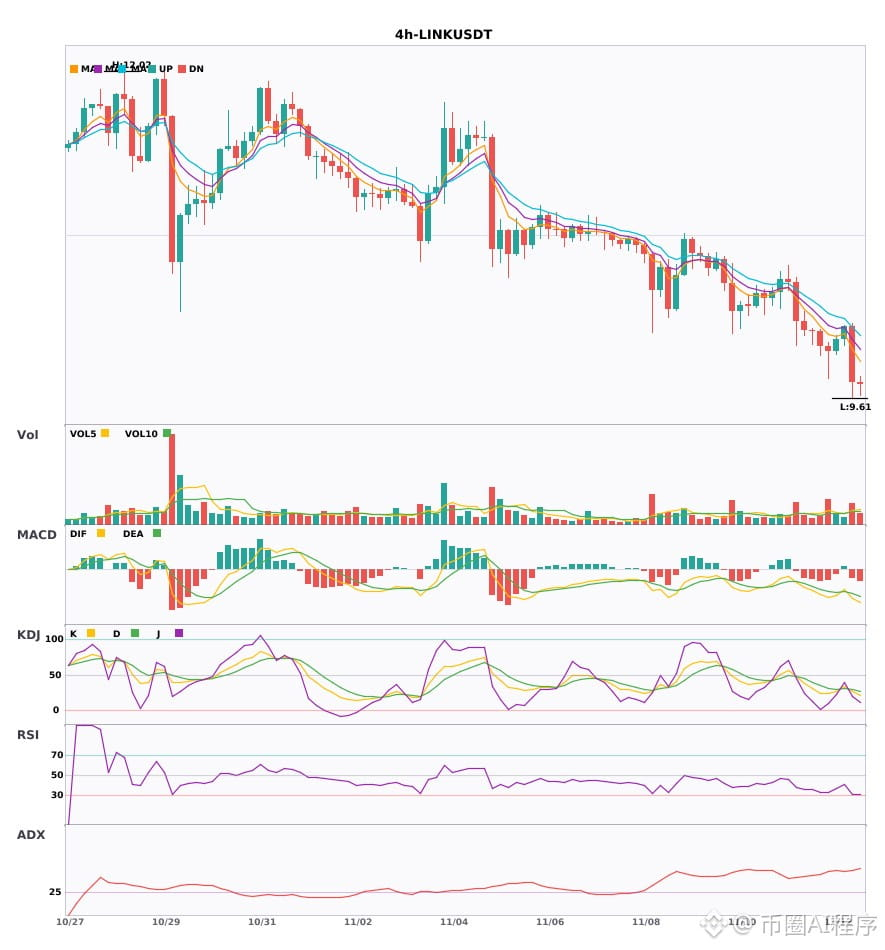
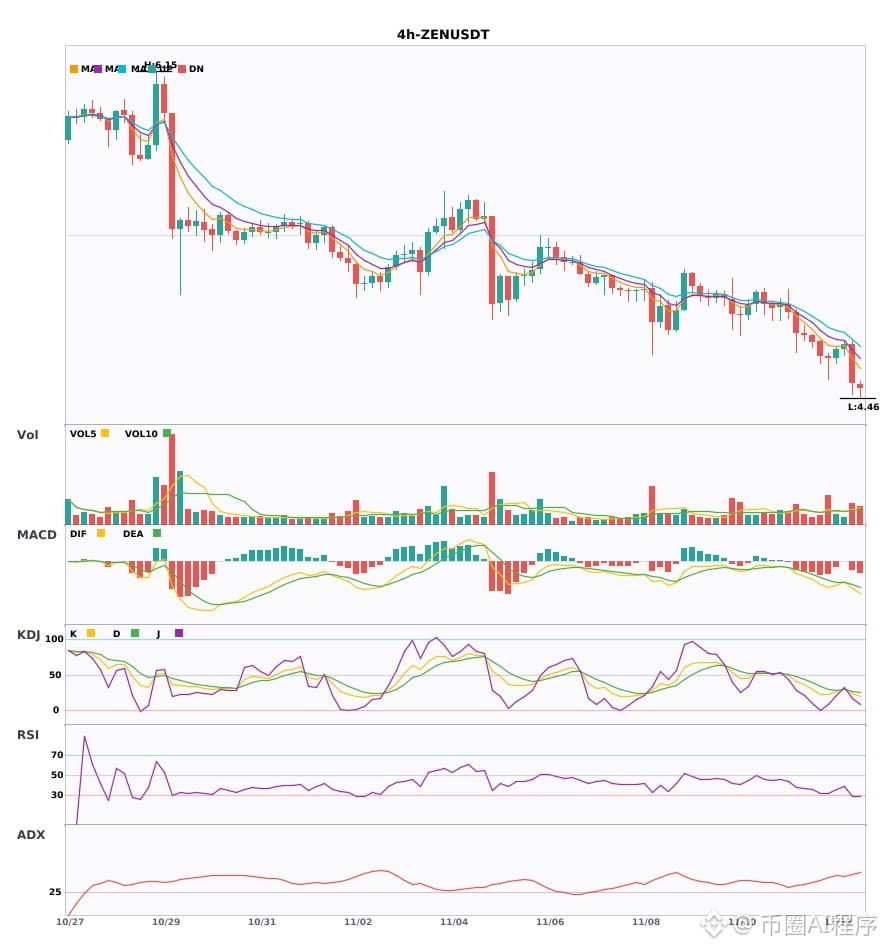
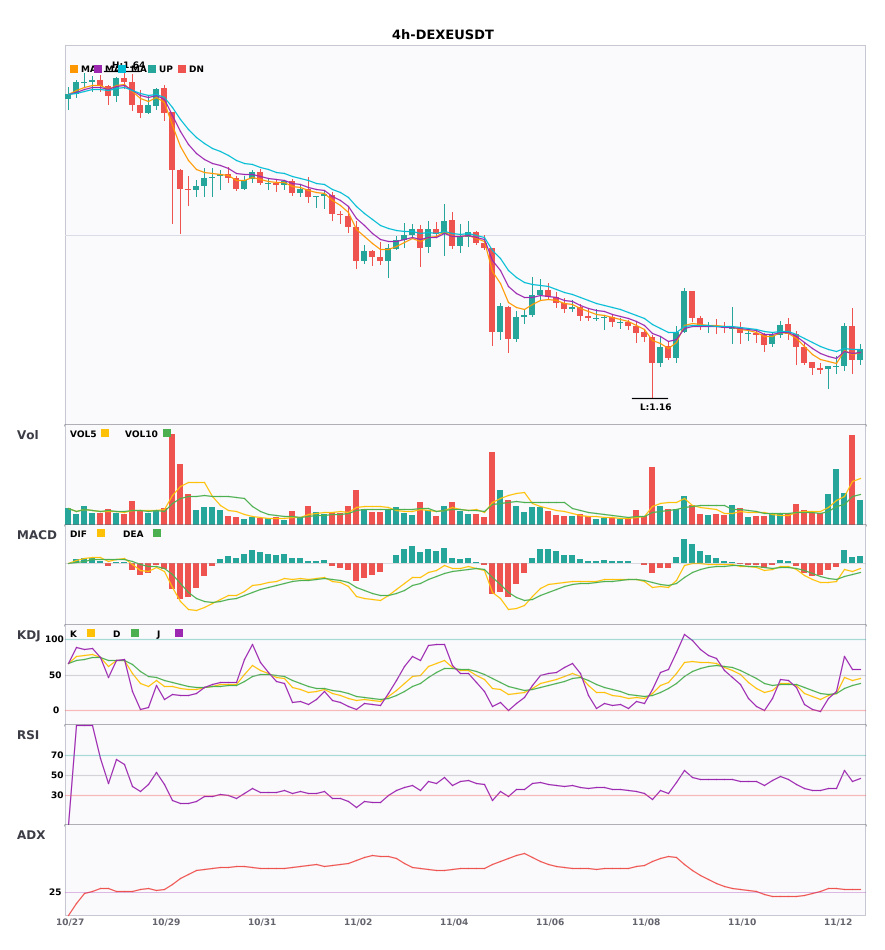
$LINK $ZEN $DEXE Daily bearish alignment diverging downward—go short 🔥
════════════════════
🟢 $LINK 4-hour bearish signal
⚠️ Technicals: 4-hour entry, confirmed by daily bearish confluence. MACD bearish cross below zero; green bars continue to expand. Moving averages are bearishly aligned and diverging downward. KDJ bearish cross, not yet oversold. Volume up 1.6x; short-term outlook is bearish.
════════════════════
🟢 $ZEN 4-hour bearish signal
⚠️ Technicals: Multi-timeframe confluence! 4-hour bearish entry, confirmed by daily bearish confluence. Green bars continue to expand after the MACD bearish cross. Moving averages are bearishly aligned and diverging downward. KDJ bearish cross, not yet oversold; short-term outlook is bearish.
════════════════════
🟢 $DEXE 4-hour bearish signal
⚠️ Technicals: 4-hour EMA5 crossed below EMA8, turning bearish, confirmed by daily bearish confluence! KDJ is weak, with K below D. Trading volume surged 3.1x; bearish confluence is dominant.
════════════════════
🔔 Follow for first-hand market updates 🔔
#多周期共振 #LINK #ZEN #DEXE
📌 When trading, check whether the candlestick pattern confirms the signal
$LINK $ZEN $DEXE Daily bearish alignment diverging downward—go short 🔥
════════════════════
🟢 $LINK 4-hour bearish signal
⚠️ Technicals: 4-hour entry, confirmed by daily bearish confluence. MACD bearish cross below zero; green bars continue to expand. Moving averages are bearishly aligned and diverging downward. KDJ bearish cross, not yet oversold. Volume up 1.6x; short-term outlook is bearish.
════════════════════
🟢 $ZEN 4-hour bearish signal
⚠️ Technicals: Multi-timeframe confluence! 4-hour bearish entry, confirmed by daily bearish confluence. Green bars continue to expand after the MACD bearish cross. Moving averages are bearishly aligned and diverging downward. KDJ bearish cross, not yet oversold; short-term outlook is bearish.
════════════════════
🟢 $DEXE 4-hour bearish signal
⚠️ Technicals: 4-hour EMA5 crossed below EMA8, turning bearish, confirmed by daily bearish confluence! KDJ is weak, with K below D. Trading volume surged 3.1x; bearish confluence is dominant.
════════════════════
🔔 Follow for first-hand market updates 🔔
#多周期共振 #LINK #ZEN #DEXE
📌 When trading, check whether the candlestick pattern confirms the signal
════════════════════
🟢 $LINK 4-hour bearish signal
⚠️ Technicals: 4-hour entry, confirmed by daily bearish confluence. MACD bearish cross below zero; green bars continue to expand. Moving averages are bearishly aligned and diverging downward. KDJ bearish cross, not yet oversold. Volume up 1.6x; short-term outlook is bearish.
════════════════════
🟢 $ZEN 4-hour bearish signal
⚠️ Technicals: Multi-timeframe confluence! 4-hour bearish entry, confirmed by daily bearish confluence. Green bars continue to expand after the MACD bearish cross. Moving averages are bearishly aligned and diverging downward. KDJ bearish cross, not yet oversold; short-term outlook is bearish.
════════════════════
🟢 $DEXE 4-hour bearish signal
⚠️ Technicals: 4-hour EMA5 crossed below EMA8, turning bearish, confirmed by daily bearish confluence! KDJ is weak, with K below D. Trading volume surged 3.1x; bearish confluence is dominant.
════════════════════
🔔 Follow for first-hand market updates 🔔
#多周期共振 #LINK #ZEN #DEXE
📌 When trading, check whether the candlestick pattern confirms the signal
38

·
--
The crypto industry continues to evolve, with new projects emerging every day. However, a project's real identity is built through its technology, development, and long-term vision.
Horizen $ZEN focuses on privacy, security, and decentralized blockchain solutions. Its goal is to develop a digital ecosystem that can contribute to the future of blockchain technology.
WHY KEEP AN EYE ON ZEN?
Privacy-focused blockchain solutions.
Secure and decentralized technology.
Continuous ecosystem development.
Strong focus on blockchain innovation.
Potential opportunities in future market cycles.
ALL EYES ARE NOW ON THE NEXT MARKET MOVE!
Bitcoin's direction and the overall crypto market trend can have a significant impact on altcoins. If bullish momentum returns, ZEN could also attract renewed interest from investors. #horizen #altcoins #zen
{spot}(ZENUSDT)
The crypto industry continues to evolve, with new projects emerging every day. However, a project's real identity is built through its technology, development, and long-term vision.
Horizen $ZEN focuses on privacy, security, and decentralized blockchain solutions. Its goal is to develop a digital ecosystem that can contribute to the future of blockchain technology.
WHY KEEP AN EYE ON ZEN?
Privacy-focused blockchain solutions.
Secure and decentralized technology.
Continuous ecosystem development.
Strong focus on blockchain innovation.
Potential opportunities in future market cycles.
ALL EYES ARE NOW ON THE NEXT MARKET MOVE!
Bitcoin's direction and the overall crypto market trend can have a significant impact on altcoins. If bullish momentum returns, ZEN could also attract renewed interest from investors. #horizen #altcoins #zen
Horizen $ZEN focuses on privacy, security, and decentralized blockchain solutions. Its goal is to develop a digital ecosystem that can contribute to the future of blockchain technology.
WHY KEEP AN EYE ON ZEN?
Privacy-focused blockchain solutions.
Secure and decentralized technology.
Continuous ecosystem development.
Strong focus on blockchain innovation.
Potential opportunities in future market cycles.
ALL EYES ARE NOW ON THE NEXT MARKET MOVE!
Bitcoin's direction and the overall crypto market trend can have a significant impact on altcoins. If bullish momentum returns, ZEN could also attract renewed interest from investors. #horizen #altcoins #zen

3
997

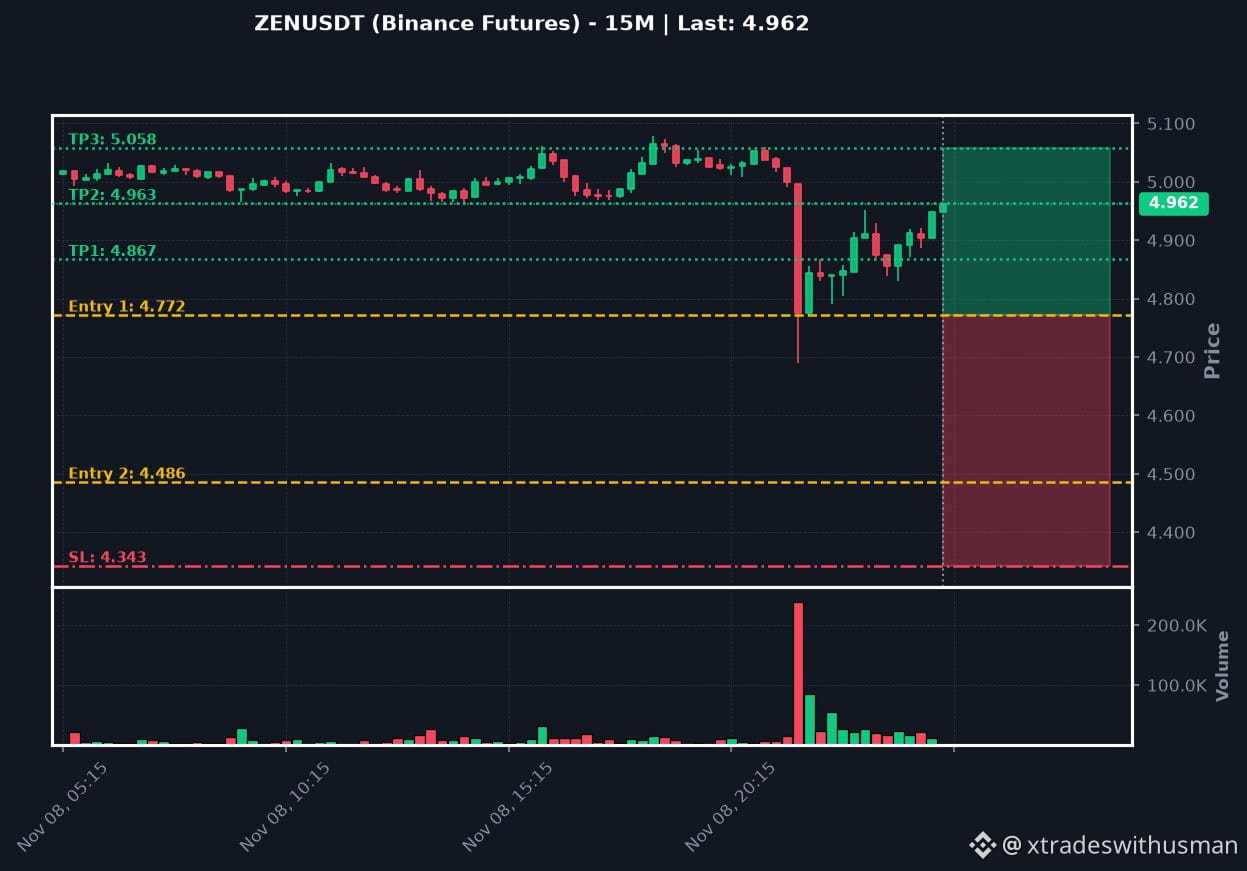
🚨 INSTITUTIONAL SNIPER SETUP 🚨
Family, the big money is moving. Stand shoulder-to-shoulder with us and execute with zero fear.
$ZEN (15m)
📅 STATUS: LONG 🚀
👉 Entry 1: 4.772
👉 Entry 2: 4.486
🎯 TP 1: 4.867
🎯 TP 2: 4.963
🎯 TP 3: 5.058
⛔ Stop Loss: 4.34252
⚡ Leverage: Cross 20x
⚡ Follow the exact targets - no greed allowed!
🔒 Capital protection comes first, massive gains follow naturally. Stay focused with us.
#Write2Earn #Binance #BTC #TrendingTopic #ZEN
🚨 INSTITUTIONAL SNIPER SETUP 🚨
Family, the big money is moving. Stand shoulder-to-shoulder with us and execute with zero fear.
$ZEN (15m)
📅 STATUS: LONG 🚀
👉 Entry 1: 4.772
👉 Entry 2: 4.486
🎯 TP 1: 4.867
🎯 TP 2: 4.963
🎯 TP 3: 5.058
⛔ Stop Loss: 4.34252
⚡ Leverage: Cross 20x
⚡ Follow the exact targets - no greed allowed!
🔒 Capital protection comes first, massive gains follow naturally. Stay focused with us.
#Write2Earn #Binance #BTC #TrendingTopic #ZEN
Family, the big money is moving. Stand shoulder-to-shoulder with us and execute with zero fear.
$ZEN (15m)
📅 STATUS: LONG 🚀
👉 Entry 1: 4.772
👉 Entry 2: 4.486
🎯 TP 1: 4.867
🎯 TP 2: 4.963
🎯 TP 3: 5.058
⛔ Stop Loss: 4.34252
⚡ Leverage: Cross 20x
⚡ Follow the exact targets - no greed allowed!
🔒 Capital protection comes first, massive gains follow naturally. Stay focused with us.
#Write2Earn #Binance #BTC #TrendingTopic #ZEN
37
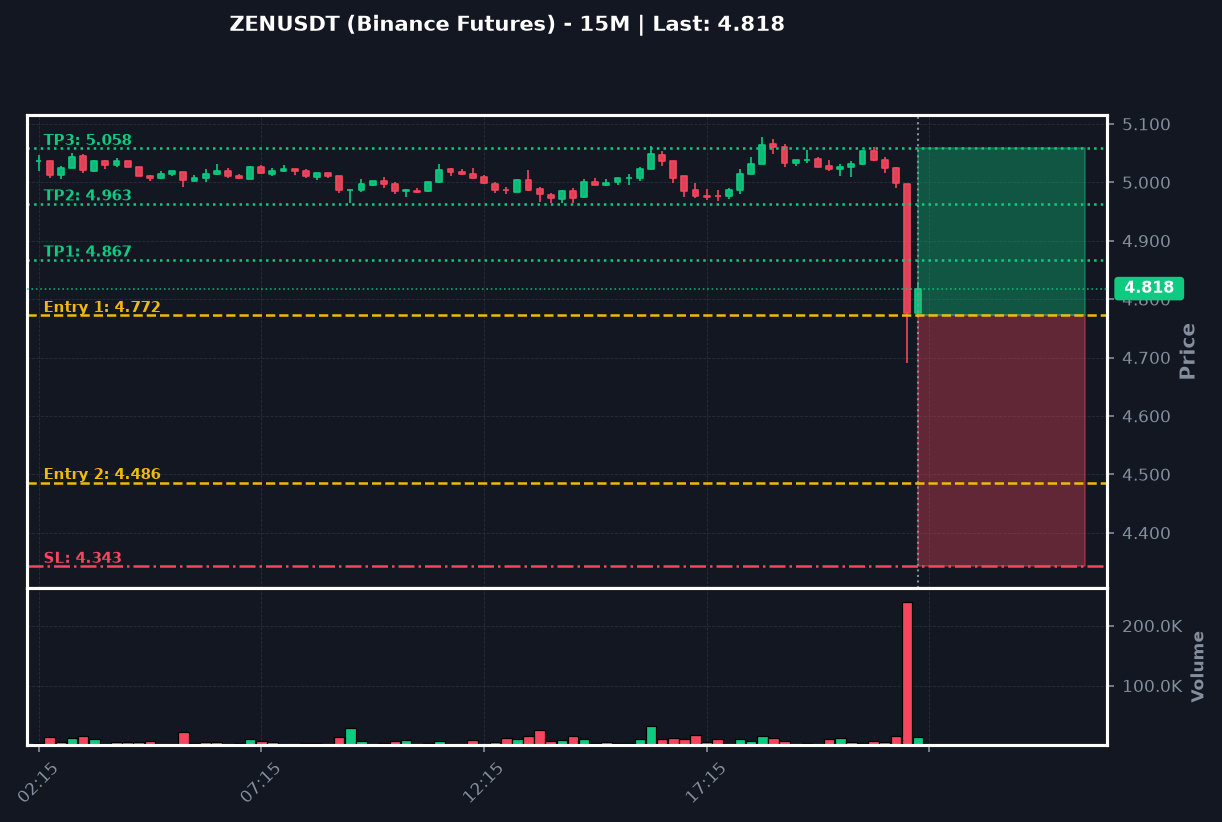
🔥 UNSTOPPABLE MOMENTUM SETUP 🔥
No guesswork, no stress. We spent hours analyzing this so you can trade with 100% peace of mind.
$ZEN (15m)
📅 STATUS: LONG 🚀
👉 Entry 1: 4.772
👉 Entry 2: 4.486
🎯 TP 1: 4.867
🎯 TP 2: 4.963
🎯 TP 3: 5.058
⛔ Stop Loss: 4.34252
⚡ Leverage: Cross 20x
🔥 Lock in the entries and manage your risk!
🏆 Together we win, together we grow. Stay loyal to the system and ignore the market noise.
#Write2Earn #Binance #BTC #TrendingTopic #ZEN
🔥 UNSTOPPABLE MOMENTUM SETUP 🔥
No guesswork, no stress. We spent hours analyzing this so you can trade with 100% peace of mind.
$ZEN (15m)
📅 STATUS: LONG 🚀
👉 Entry 1: 4.772
👉 Entry 2: 4.486
🎯 TP 1: 4.867
🎯 TP 2: 4.963
🎯 TP 3: 5.058
⛔ Stop Loss: 4.34252
⚡ Leverage: Cross 20x
🔥 Lock in the entries and manage your risk!
🏆 Together we win, together we grow. Stay loyal to the system and ignore the market noise.
#Write2Earn #Binance #BTC #TrendingTopic #ZEN
No guesswork, no stress. We spent hours analyzing this so you can trade with 100% peace of mind.
$ZEN (15m)
📅 STATUS: LONG 🚀
👉 Entry 1: 4.772
👉 Entry 2: 4.486
🎯 TP 1: 4.867
🎯 TP 2: 4.963
🎯 TP 3: 5.058
⛔ Stop Loss: 4.34252
⚡ Leverage: Cross 20x
🔥 Lock in the entries and manage your risk!
🏆 Together we win, together we grow. Stay loyal to the system and ignore the market noise.
#Write2Earn #Binance #BTC #TrendingTopic #ZEN
19
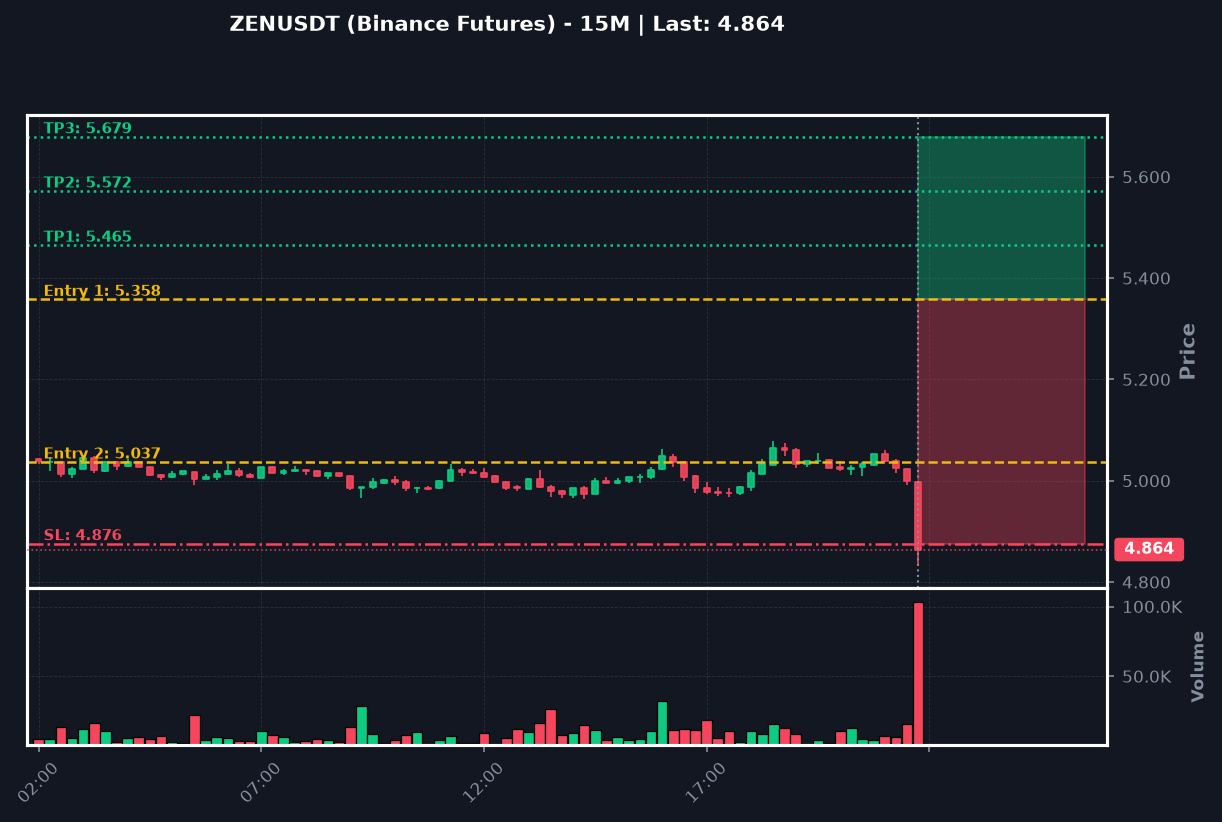
🎯 SURGICAL ACCURACY ZONE 🎯
Do not rush. Wait for our entry, execute cleanly, and let probability do the heavy lifting.
$ZEN (15m)
📅 STATUS: LONG 🚀
👉 Entry 1: 5.358
👉 Entry 2: 5.037
🎯 TP 1: 5.465
🎯 TP 2: 5.572
🎯 TP 3: 5.679
⛔ Stop Loss: 4.87578
⚡ Leverage: Cross 20x
🔥 Lock in the entries and manage your risk!
🤝 Your trust is our greatest asset. Always respect the Stop Loss to protect our community capital.
#Write2Earn #Binance #BTC #TrendingTopic #ZEN
🎯 SURGICAL ACCURACY ZONE 🎯
Do not rush. Wait for our entry, execute cleanly, and let probability do the heavy lifting.
$ZEN (15m)
📅 STATUS: LONG 🚀
👉 Entry 1: 5.358
👉 Entry 2: 5.037
🎯 TP 1: 5.465
🎯 TP 2: 5.572
🎯 TP 3: 5.679
⛔ Stop Loss: 4.87578
⚡ Leverage: Cross 20x
🔥 Lock in the entries and manage your risk!
🤝 Your trust is our greatest asset. Always respect the Stop Loss to protect our community capital.
#Write2Earn #Binance #BTC #TrendingTopic #ZEN
Do not rush. Wait for our entry, execute cleanly, and let probability do the heavy lifting.
$ZEN (15m)
📅 STATUS: LONG 🚀
👉 Entry 1: 5.358
👉 Entry 2: 5.037
🎯 TP 1: 5.465
🎯 TP 2: 5.572
🎯 TP 3: 5.679
⛔ Stop Loss: 4.87578
⚡ Leverage: Cross 20x
🔥 Lock in the entries and manage your risk!
🤝 Your trust is our greatest asset. Always respect the Stop Loss to protect our community capital.
#Write2Earn #Binance #BTC #TrendingTopic #ZEN
14
·
--
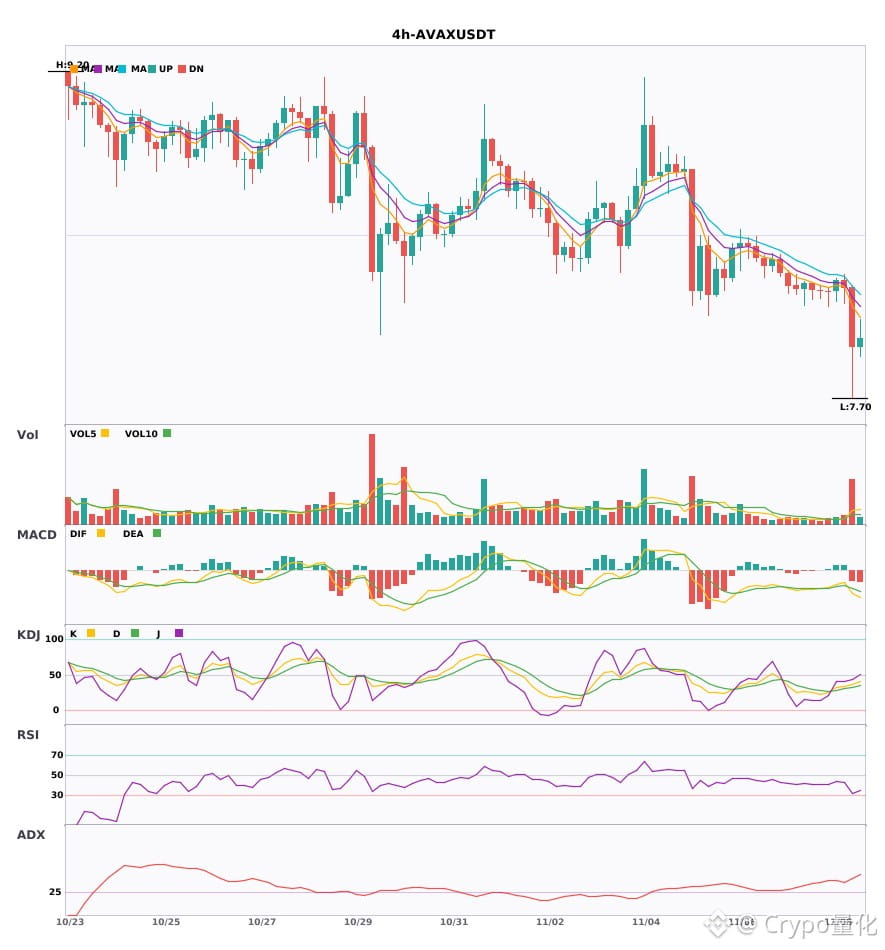
3 4-hour bearish alerts: $ZEN / $AVAX / $HUMA🔥
════════════════════
🟢 $ZEN 4-hour bearish signal
⚠️Technical analysis: ADX(41) indicates a clear trend | MACD bearish crossover below zero, bearish momentum accelerating | EMA5 < EMA8 < EMA13, bearish alignment | KDJ golden cross, short-term bullish (K: 28.4, D: 25.6) | Volume surge (3.6x)
════════════════════
🟢 $AVAX 4-hour bearish signal
⚠️Technical analysis: ADX(45) indicates a clear trend | MACD bearish crossover below zero, bearish momentum accelerating | EMA5 < EMA8 < EMA13, bearish alignment | KDJ trending weakly, bears in control (K: 36.1, D: 32.5) | Volume surge (4.5x)
════════════════════
🟢 $HUMA 4-hour bearish signal
⚠️Technical analysis: ADX(68) indicates a very strong trend (beware of an overheated pullback) | MACD bearish crossover below zero, bearish momentum accelerating | EMA5 < EMA8 < EMA13, bearish alignment | KDJ in oversold territory; watch for a rebound opportunity (K: 6.1, D: 8.6) | Volume increase (1.8x)
════════════════════
🔔 Follow for real-time market developments 🔔
#技术分析 #ZEN #AVAX #HUMA
📌 When trading, pay attention to whether the candlestick pattern confirms the signal
3 4-hour bearish alerts: $ZEN / $AVAX / $HUMA 🔥
════════════════════
🟢 $ZEN 4-hour bearish signal
⚠️Technical analysis: ADX(41) indicates a clear trend | MACD bearish crossover below zero, bearish momentum accelerating | EMA5 < EMA8 < EMA13, bearish alignment | KDJ golden cross, short-term bullish (K: 28.4, D: 25.6) | Volume surge (3.6x)
════════════════════
🟢 $AVAX 4-hour bearish signal
⚠️Technical analysis: ADX(45) indicates a clear trend | MACD bearish crossover below zero, bearish momentum accelerating | EMA5 < EMA8 < EMA13, bearish alignment | KDJ trending weakly, bears in control (K: 36.1, D: 32.5) | Volume surge (4.5x)
════════════════════
🟢 $HUMA 4-hour bearish signal
⚠️Technical analysis: ADX(68) indicates a very strong trend (beware of an overheated pullback) | MACD bearish crossover below zero, bearish momentum accelerating | EMA5 < EMA8 < EMA13, bearish alignment | KDJ in oversold territory; watch for a rebound opportunity (K: 6.1, D: 8.6) | Volume increase (1.8x)
════════════════════
🔔 Follow for real-time market developments 🔔
#技术分析 #ZEN #AVAX #HUMA
📌 When trading, pay attention to whether the candlestick pattern confirms the signal
════════════════════
🟢 $ZEN 4-hour bearish signal
⚠️Technical analysis: ADX(41) indicates a clear trend | MACD bearish crossover below zero, bearish momentum accelerating | EMA5 < EMA8 < EMA13, bearish alignment | KDJ golden cross, short-term bullish (K: 28.4, D: 25.6) | Volume surge (3.6x)
════════════════════
🟢 $AVAX 4-hour bearish signal
⚠️Technical analysis: ADX(45) indicates a clear trend | MACD bearish crossover below zero, bearish momentum accelerating | EMA5 < EMA8 < EMA13, bearish alignment | KDJ trending weakly, bears in control (K: 36.1, D: 32.5) | Volume surge (4.5x)
════════════════════
🟢 $HUMA 4-hour bearish signal
⚠️Technical analysis: ADX(68) indicates a very strong trend (beware of an overheated pullback) | MACD bearish crossover below zero, bearish momentum accelerating | EMA5 < EMA8 < EMA13, bearish alignment | KDJ in oversold territory; watch for a rebound opportunity (K: 6.1, D: 8.6) | Volume increase (1.8x)
════════════════════
🔔 Follow for real-time market developments 🔔
#技术分析 #ZEN #AVAX #HUMA
📌 When trading, pay attention to whether the candlestick pattern confirms the signal
33

·
--
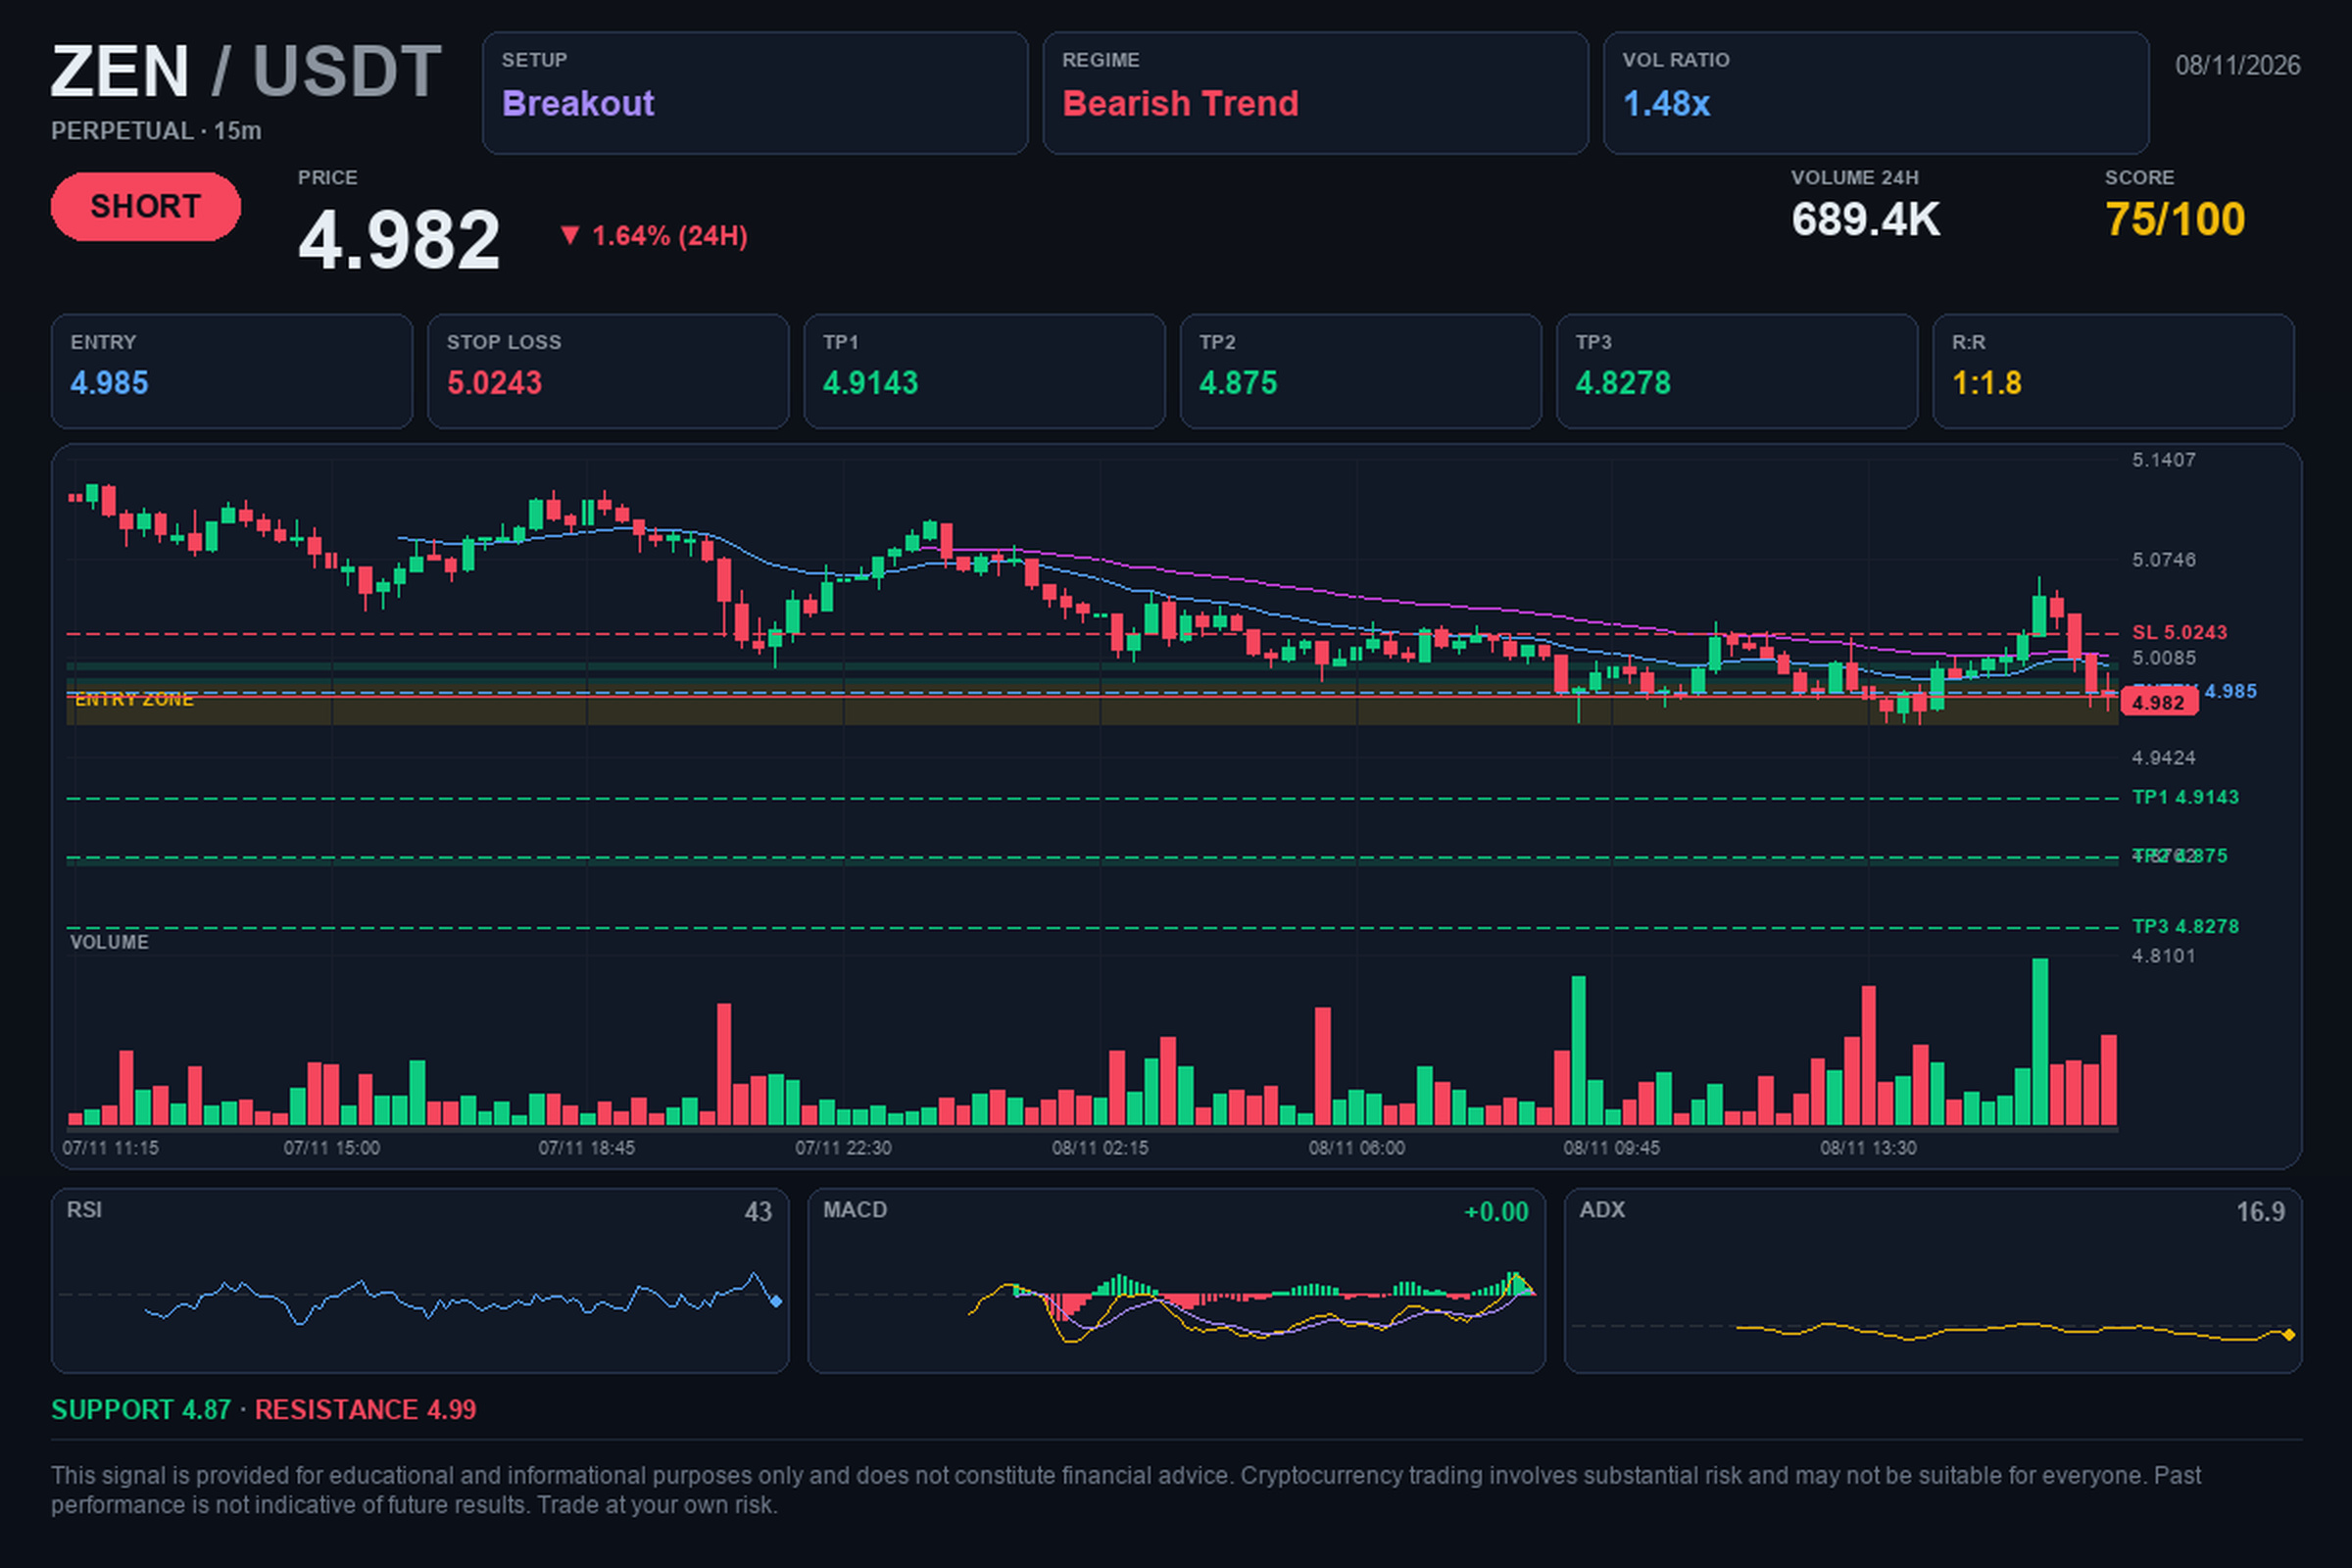
📢 $ZEN / USDT | 🔴 SHORT | ⭐ 76%
🎯 Target: $4.91427033. Will it reach it?
🎯 Trading levels:
🔴 Entry: $4.985
🛑 Stop Loss: $5.0243
🏁 TP1: $4.9143
🏁 TP2: $4.875
🏁 TP3: $4.8278
📈 Analysis:
The current structure shows a clear downtrend across multiple timeframes, confirmed by patterns of lower highs and support breakdowns. We are seeing a notable increase in trading volume, 135.9% above its average, suggesting strong selling pressure in the market. With the price breaking key support levels, the technical outlook favors a downward move under current conditions.
⚖️ Risk/Reward: 1:1.8
⏱️ Timeframe: 15M
💭 A breakout occurs when the price forcefully crosses a support or resistance level, indicating a possible continuation of the current trend.
#crypto #ZEN #trading #Bearish
💡 This analysis is for educational purposes and does not constitute financial advice. Do your own research and make your decision carefully.
📢 $ZEN / USDT | 🔴 SHORT | ⭐ 76%
🎯 Target: $4.91427033. Will it reach it?
🎯 Trading levels:
🔴 Entry: $4.985
🛑 Stop Loss: $5.0243
🏁 TP1: $4.9143
🏁 TP2: $4.875
🏁 TP3: $4.8278
📈 Analysis:
The current structure shows a clear downtrend across multiple timeframes, confirmed by patterns of lower highs and support breakdowns. We are seeing a notable increase in trading volume, 135.9% above its average, suggesting strong selling pressure in the market. With the price breaking key support levels, the technical outlook favors a downward move under current conditions.
⚖️ Risk/Reward: 1:1.8
⏱️ Timeframe: 15M
💭 A breakout occurs when the price forcefully crosses a support or resistance level, indicating a possible continuation of the current trend.
#crypto #ZEN #trading #Bearish
💡 This analysis is for educational purposes and does not constitute financial advice. Do your own research and make your decision carefully.
🎯 Target: $4.91427033. Will it reach it?
🎯 Trading levels:
🔴 Entry: $4.985
🛑 Stop Loss: $5.0243
🏁 TP1: $4.9143
🏁 TP2: $4.875
🏁 TP3: $4.8278
📈 Analysis:
The current structure shows a clear downtrend across multiple timeframes, confirmed by patterns of lower highs and support breakdowns. We are seeing a notable increase in trading volume, 135.9% above its average, suggesting strong selling pressure in the market. With the price breaking key support levels, the technical outlook favors a downward move under current conditions.
⚖️ Risk/Reward: 1:1.8
⏱️ Timeframe: 15M
💭 A breakout occurs when the price forcefully crosses a support or resistance level, indicating a possible continuation of the current trend.
#crypto #ZEN #trading #Bearish
💡 This analysis is for educational purposes and does not constitute financial advice. Do your own research and make your decision carefully.
3

·
--
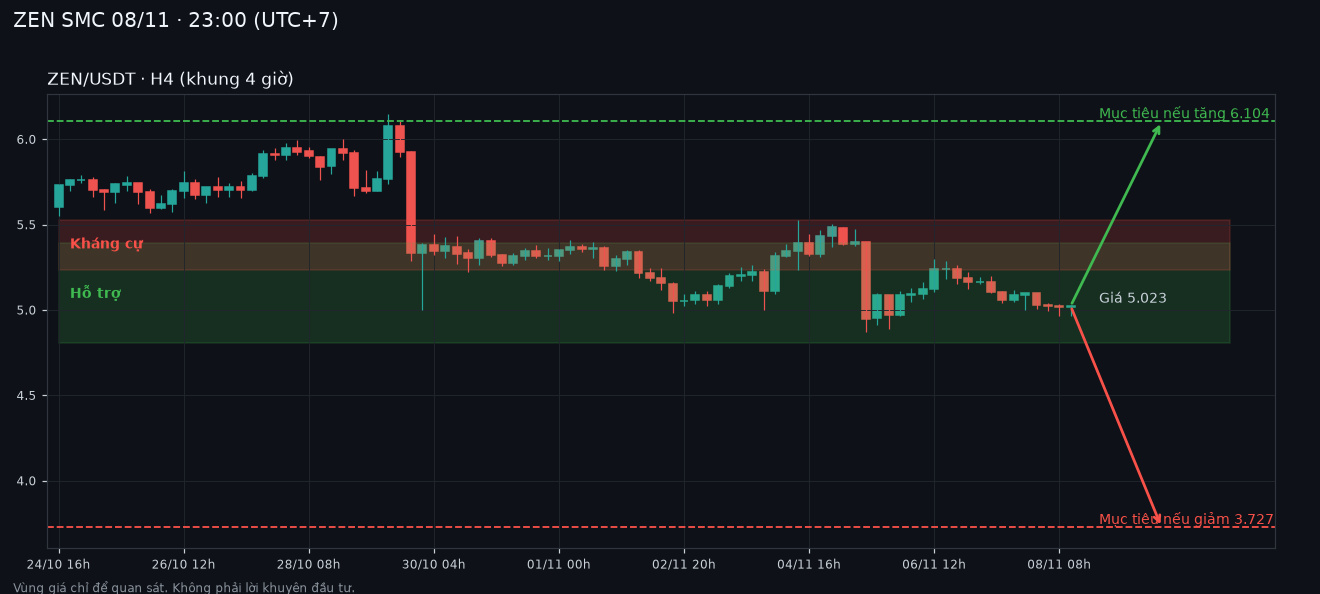
[ZEN SMC 08/11] $ZEN 5.02 USDT | Today: Stay out, wait for confirmation
ZEN is caught between two timeframes, so it’s not the time to rush in.
1. BIG PICTURE
- D1 (daily timeframe): Uptrend, but the short-term move is going in the opposite direction.
- H4 (4-hour timeframe): Trending down.
- My view: Stay out. The daily and 4-hour timeframes are pulling in opposite directions, so wait for price to choose a direction.
2. WHY AM I STAYING OUT?
- The recent high (H4) at 6.54 has not been broken; it is still +30.2% away.
- Price has broken below the recent low (H4) at 5.54.
- Momentum is still weak, but sellers are gradually losing steam: D1 MACD is red, with shrinking bars, while ADX at 32 indicates a clear trend.
3. PRICE ZONES TO WATCH
- Support: 4.81 - 5.39 (demand zone, D1 Order Block).
- Resistance: 5.24 - 5.53 (supply zone, H4 Order Block).
- Potential buy zone: 4.81 - 5.39, only if there is a confirming signal.
- Potential sell zone: 5.24 - 5.53, only if there is a confirming signal.
4. TWO SCENARIOS FOR TODAY
- Bullish: Price needs to hold the 4.81 - 5.39 zone and break above 5.53 to confirm upward momentum. Next target: 6.10.
- Bearish: If price breaks below 4.81 and fails to reclaim this zone, the trend could weaken. Next target: 3.73.
5. WHEN WOULD I BE WRONG?
If an H4 candle closes above 5.53 or below 4.81, the market has chosen a direction and the situation needs to be reassessed.
RISK
- The average daily range is around 7.9% (D1 ATR), so price could easily sweep past these levels before choosing a direction.
- Order Blocks are only zones to watch; price can still break through them. Macroeconomic news can also cause sharp moves and slippage.
Price at the time of writing: 5.02 USDT (23:00 08/11/2026, UTC+7). Markets change quickly; always use a stop-loss.
This is my personal view for reference, not investment advice.
📰 Axion News | @axioncryptonews
💬 Which coins are you watching? Leave a comment below. If you found this post helpful, please like and share 👍
#ZEN #SMC #MarketUpdate #AxionNews
[ZEN SMC 08/11] $ZEN 5.02 USDT | Today: Stay out, wait for confirmation
ZEN is caught between two timeframes, so it’s not the time to rush in.
1. BIG PICTURE
- D1 (daily timeframe): Uptrend, but the short-term move is going in the opposite direction.
- H4 (4-hour timeframe): Trending down.
- My view: Stay out. The daily and 4-hour timeframes are pulling in opposite directions, so wait for price to choose a direction.
2. WHY AM I STAYING OUT?
- The recent high (H4) at 6.54 has not been broken; it is still +30.2% away.
- Price has broken below the recent low (H4) at 5.54.
- Momentum is still weak, but sellers are gradually losing steam: D1 MACD is red, with shrinking bars, while ADX at 32 indicates a clear trend.
3. PRICE ZONES TO WATCH
- Support: 4.81 - 5.39 (demand zone, D1 Order Block).
- Resistance: 5.24 - 5.53 (supply zone, H4 Order Block).
- Potential buy zone: 4.81 - 5.39, only if there is a confirming signal.
- Potential sell zone: 5.24 - 5.53, only if there is a confirming signal.
4. TWO SCENARIOS FOR TODAY
- Bullish: Price needs to hold the 4.81 - 5.39 zone and break above 5.53 to confirm upward momentum. Next target: 6.10.
- Bearish: If price breaks below 4.81 and fails to reclaim this zone, the trend could weaken. Next target: 3.73.
5. WHEN WOULD I BE WRONG?
If an H4 candle closes above 5.53 or below 4.81, the market has chosen a direction and the situation needs to be reassessed.
RISK
- The average daily range is around 7.9% (D1 ATR), so price could easily sweep past these levels before choosing a direction.
- Order Blocks are only zones to watch; price can still break through them. Macroeconomic news can also cause sharp moves and slippage.
Price at the time of writing: 5.02 USDT (23:00 08/11/2026, UTC+7). Markets change quickly; always use a stop-loss.
This is my personal view for reference, not investment advice.
📰 Axion News | @axioncryptonews
💬 Which coins are you watching? Leave a comment below. If you found this post helpful, please like and share 👍
#ZEN #SMC #MarketUpdate #AxionNews
ZEN is caught between two timeframes, so it’s not the time to rush in.
1. BIG PICTURE
- D1 (daily timeframe): Uptrend, but the short-term move is going in the opposite direction.
- H4 (4-hour timeframe): Trending down.
- My view: Stay out. The daily and 4-hour timeframes are pulling in opposite directions, so wait for price to choose a direction.
2. WHY AM I STAYING OUT?
- The recent high (H4) at 6.54 has not been broken; it is still +30.2% away.
- Price has broken below the recent low (H4) at 5.54.
- Momentum is still weak, but sellers are gradually losing steam: D1 MACD is red, with shrinking bars, while ADX at 32 indicates a clear trend.
3. PRICE ZONES TO WATCH
- Support: 4.81 - 5.39 (demand zone, D1 Order Block).
- Resistance: 5.24 - 5.53 (supply zone, H4 Order Block).
- Potential buy zone: 4.81 - 5.39, only if there is a confirming signal.
- Potential sell zone: 5.24 - 5.53, only if there is a confirming signal.
4. TWO SCENARIOS FOR TODAY
- Bullish: Price needs to hold the 4.81 - 5.39 zone and break above 5.53 to confirm upward momentum. Next target: 6.10.
- Bearish: If price breaks below 4.81 and fails to reclaim this zone, the trend could weaken. Next target: 3.73.
5. WHEN WOULD I BE WRONG?
If an H4 candle closes above 5.53 or below 4.81, the market has chosen a direction and the situation needs to be reassessed.
RISK
- The average daily range is around 7.9% (D1 ATR), so price could easily sweep past these levels before choosing a direction.
- Order Blocks are only zones to watch; price can still break through them. Macroeconomic news can also cause sharp moves and slippage.
Price at the time of writing: 5.02 USDT (23:00 08/11/2026, UTC+7). Markets change quickly; always use a stop-loss.
This is my personal view for reference, not investment advice.
📰 Axion News | @axioncryptonews
💬 Which coins are you watching? Leave a comment below. If you found this post helpful, please like and share 👍
#ZEN #SMC #MarketUpdate #AxionNews
2
115

🚨 $ZEN BREAKS OUT OF MASSIVE FALLING WEDGE AS ICHIMOKU CLOUD FLIPS TO SUPPORT! 💥
$ZEN just smashed out of a textbook falling wedge structure, backed by a strong surge in buying volume. 📊 Order flow shows smart money stepping up to bid, locking in confirmation as the Ichimoku cloud transforms from resistance into firm baseline support.
While crowd skeptics fear a temporary cooling off, momentum is aggressively building on the charts. ⚡ Capital rotation into active setups like $ZEN , $ONG , and $HEMI hints at fresh market liquidity moving into high-conviction plays.
💡 Buyer dominance is taking over following this structural reclaim. 💬 Are you bidding this breakout momentum now or waiting for a retest of the cloud? 👇
⚠️ Not financial advice. Always manage your risk. 🛡️
🏷️ #ZEN #Breakout #Crypto #Ichimoku #Altcoins
🚀 ⚡
🚨 $ZEN BREAKS OUT OF MASSIVE FALLING WEDGE AS ICHIMOKU CLOUD FLIPS TO SUPPORT! 💥
$ZEN just smashed out of a textbook falling wedge structure, backed by a strong surge in buying volume. 📊 Order flow shows smart money stepping up to bid, locking in confirmation as the Ichimoku cloud transforms from resistance into firm baseline support.
While crowd skeptics fear a temporary cooling off, momentum is aggressively building on the charts. ⚡ Capital rotation into active setups like $ZEN , $ONG , and $HEMI hints at fresh market liquidity moving into high-conviction plays.
💡 Buyer dominance is taking over following this structural reclaim. 💬 Are you bidding this breakout momentum now or waiting for a retest of the cloud? 👇
⚠️ Not financial advice. Always manage your risk. 🛡️
🏷️ #ZEN #Breakout #Crypto #Ichimoku #Altcoins
🚀 ⚡
$ZEN just smashed out of a textbook falling wedge structure, backed by a strong surge in buying volume. 📊 Order flow shows smart money stepping up to bid, locking in confirmation as the Ichimoku cloud transforms from resistance into firm baseline support.
While crowd skeptics fear a temporary cooling off, momentum is aggressively building on the charts. ⚡ Capital rotation into active setups like $ZEN , $ONG , and $HEMI hints at fresh market liquidity moving into high-conviction plays.
💡 Buyer dominance is taking over following this structural reclaim. 💬 Are you bidding this breakout momentum now or waiting for a retest of the cloud? 👇
⚠️ Not financial advice. Always manage your risk. 🛡️
🏷️ #ZEN #Breakout #Crypto #Ichimoku #Altcoins
🚀 ⚡
35

🦈 $ZEN SWEEPS THE LOWS AND RECLAIMS 5.50 FOR A MASSIVE SHORT SQUEEZE! ⚡
Entry: 5.50 - 5.60 ⚡
Target: 5.90 - 6.40 🚀
Stop Loss: 5.25 ⚠️
Smart money just flushed out weak hands below the range before aggressively reclaiming 5.50 with serious buying velocity. 🌊 As long as price holds above the 5.30 structural floor, this expansion is primed to tear straight through overhead supply and liquidate aggressive short positions into the 6.00 zone. 🎯
Volume is building rapidly on the reclaim, signaling heavy order flow absorption rather than a weak relief bounce. 📊 Catching a clean sweep-and-reclaim setup early keeps risk tight before the real vertical move triggers. 💬 Are you bidding this liquidity reclaim here or waiting to chase the breakout higher? 👇
⚠️ Not financial advice. Always manage your risk. 🛡️
🏷️ #ZEN #LongSetup #Crypto #Altcoins #Breakout
🔥 ⚡
🦈 $ZEN SWEEPS THE LOWS AND RECLAIMS 5.50 FOR A MASSIVE SHORT SQUEEZE! ⚡
Entry: 5.50 - 5.60 ⚡
Target: 5.90 - 6.40 🚀
Stop Loss: 5.25 ⚠️
Smart money just flushed out weak hands below the range before aggressively reclaiming 5.50 with serious buying velocity. 🌊 As long as price holds above the 5.30 structural floor, this expansion is primed to tear straight through overhead supply and liquidate aggressive short positions into the 6.00 zone. 🎯
Volume is building rapidly on the reclaim, signaling heavy order flow absorption rather than a weak relief bounce. 📊 Catching a clean sweep-and-reclaim setup early keeps risk tight before the real vertical move triggers. 💬 Are you bidding this liquidity reclaim here or waiting to chase the breakout higher? 👇
⚠️ Not financial advice. Always manage your risk. 🛡️
🏷️ #ZEN #LongSetup #Crypto #Altcoins #Breakout
🔥 ⚡
Entry: 5.50 - 5.60 ⚡
Target: 5.90 - 6.40 🚀
Stop Loss: 5.25 ⚠️
Smart money just flushed out weak hands below the range before aggressively reclaiming 5.50 with serious buying velocity. 🌊 As long as price holds above the 5.30 structural floor, this expansion is primed to tear straight through overhead supply and liquidate aggressive short positions into the 6.00 zone. 🎯
Volume is building rapidly on the reclaim, signaling heavy order flow absorption rather than a weak relief bounce. 📊 Catching a clean sweep-and-reclaim setup early keeps risk tight before the real vertical move triggers. 💬 Are you bidding this liquidity reclaim here or waiting to chase the breakout higher? 👇
⚠️ Not financial advice. Always manage your risk. 🛡️
🏷️ #ZEN #LongSetup #Crypto #Altcoins #Breakout
🔥 ⚡
15

·
--
Bullish
$ZEN Swing SPOT Update! 🎯
{spot}(ZENUSDT)
Don't chase the pump. Let the price come to us.
📉 Entry Zone: $5.06 - $5.12
⏳ Confirmation: Wait for a 1H candle to CLOSE green above $5.12
🎯 TP1: $5.22 | TP2: $5.40
🛑 SL: $4.94 (Strict)
Spot Buy only. Protect your capital, wait for the confirmation, and let the setup come to you.
#zen #SpotTrading #BinanceSquare #crypto
$ZEN Swing SPOT Update! 🎯
Don't chase the pump. Let the price come to us.
📉 Entry Zone: $5.06 - $5.12
⏳ Confirmation: Wait for a 1H candle to CLOSE green above $5.12
🎯 TP1: $5.22 | TP2: $5.40
🛑 SL: $4.94 (Strict)
Spot Buy only. Protect your capital, wait for the confirmation, and let the setup come to you.
#zen #SpotTrading #BinanceSquare #crypto
Don't chase the pump. Let the price come to us.
📉 Entry Zone: $5.06 - $5.12
⏳ Confirmation: Wait for a 1H candle to CLOSE green above $5.12
🎯 TP1: $5.22 | TP2: $5.40
🛑 SL: $4.94 (Strict)
Spot Buy only. Protect your capital, wait for the confirmation, and let the setup come to you.
#zen #SpotTrading #BinanceSquare #crypto
1
395
·
--
Bullish
⚡ $ZEN Quick Scalp Alert! SPOT ONLY! ⚡
{spot}(ZENUSDT)
Don't chase the top. Waiting for a quick liquidity sweep to snipe the bounce.
🎯 Entry Zone: $5.15 - $5.18
⏳ Trigger: 15m candle CLOSE green above $5.18
📈 TP1: $5.22 | TP2: $5.26
🛑 SL: $5.10 (Strict)
Fast in, fast out. Secure profits at TP1 and protect your capital! 🔥
#zen #ScalpTrading #BinanceSquare #SpotTrading. #crypto
⚡ $ZEN Quick Scalp Alert! SPOT ONLY! ⚡
Don't chase the top. Waiting for a quick liquidity sweep to snipe the bounce.
🎯 Entry Zone: $5.15 - $5.18
⏳ Trigger: 15m candle CLOSE green above $5.18
📈 TP1: $5.22 | TP2: $5.26
🛑 SL: $5.10 (Strict)
Fast in, fast out. Secure profits at TP1 and protect your capital! 🔥
#zen #ScalpTrading #BinanceSquare #SpotTrading. #crypto
Don't chase the top. Waiting for a quick liquidity sweep to snipe the bounce.
🎯 Entry Zone: $5.15 - $5.18
⏳ Trigger: 15m candle CLOSE green above $5.18
📈 TP1: $5.22 | TP2: $5.26
🛑 SL: $5.10 (Strict)
Fast in, fast out. Secure profits at TP1 and protect your capital! 🔥
#zen #ScalpTrading #BinanceSquare #SpotTrading. #crypto
278
Log in to explore more content
Join global crypto users on Binance Square
⚡️ Get latest and useful information about crypto.
💬 Trusted by the world’s largest crypto exchange.
👍 Discover real insights from verified creators.
Email / Phone number
Trending Topics
1
#A Packed Week of Earnings and Data Tests Markets
1,064 views
33 Discussing
2
#HuangReportedlyConsidersReturnToNvidia
9,501 views
165 Discussing
3
#CryptoSelloffTriggersMultipleWhaleLiquidations
258,443 views
2,206 Discussing
4
#BitcoinSpotETFsPost$1.065BOutflowsForThirdStraightWeek
675 views
18 Discussing
5
#About64000BitcoinMiningMachinesReportedlyHijacked
8,599 views
142 Discussing
6
#USSpotXRPETFsSeeLargestWeeklyOutflowIn8Months
210,244 views
1,764 Discussing
7
#WillFOMCMinutesReinforceRateHikeExpectations?
79,086 views
898 Discussing
8
#BitcoinActiveSupplyInProfitDropsBelow45%
284,920 views
2,001 Discussing
9
#TONStrategyReports$23.97MQ3NetLoss
23,960 views
161 Discussing
10
#KavaSaysAbnormalActivityLimitedToKavaLend
188,457 views
1,146 Discussing