
#supportandresistance
supportandresistance
720,560 views
1,391 Discussing
Hot
Latest

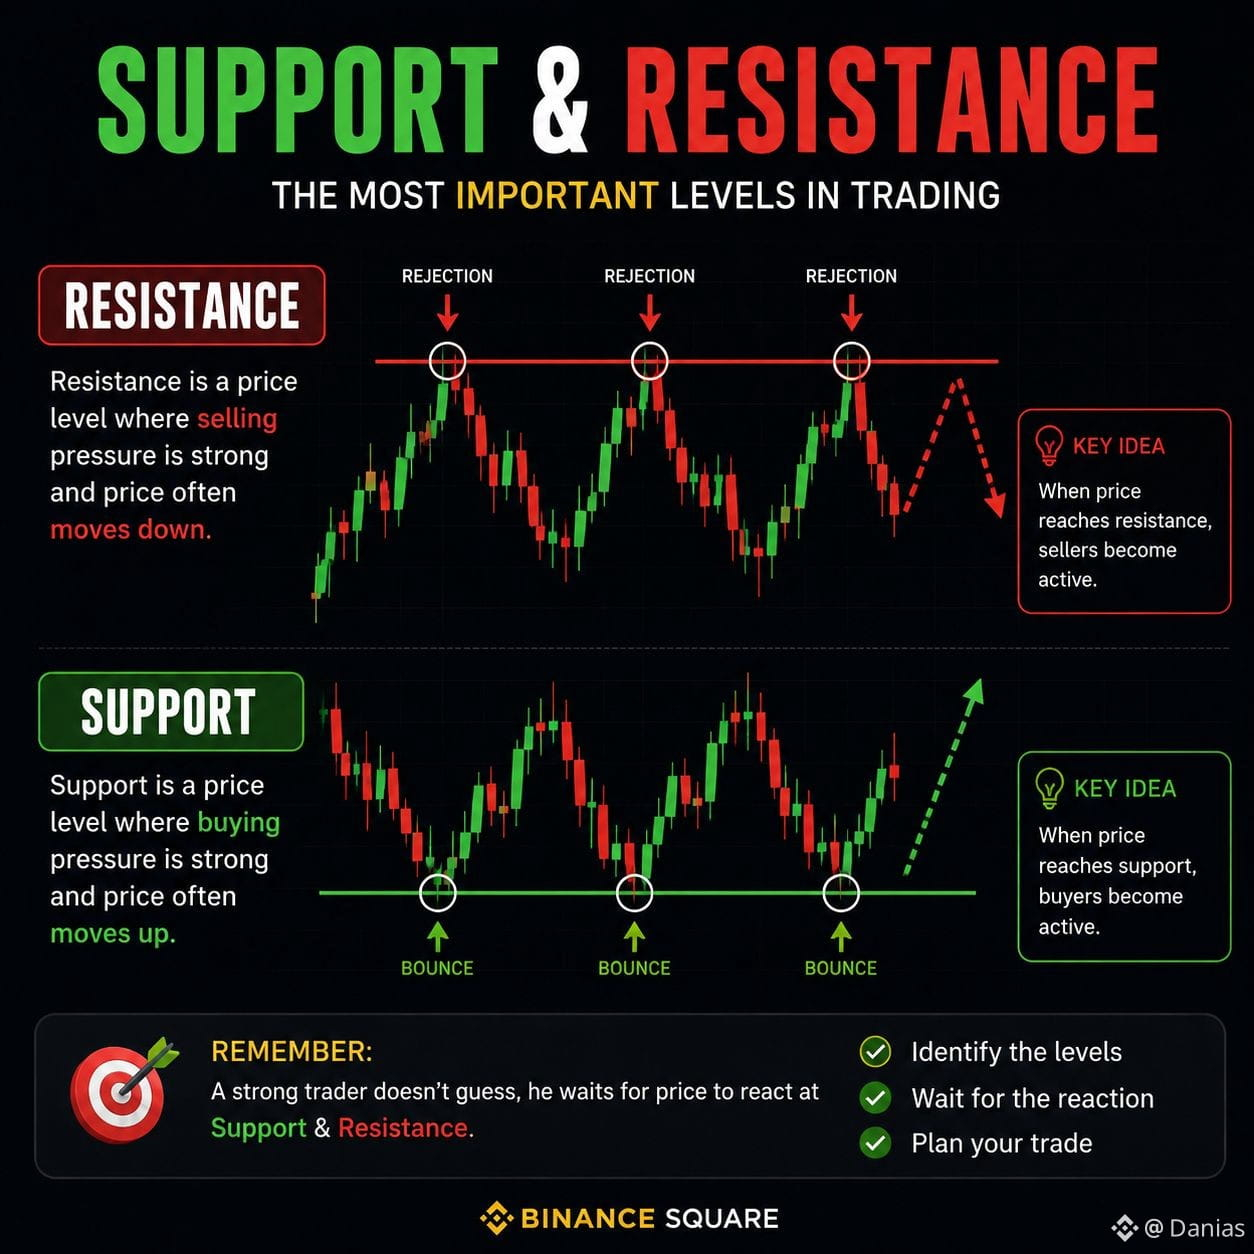
📊 SUPPORT vs RESISTANCE — THE TWO LEVELS EVERY TRADER SHOULD KNOW
Think of the price chart like a battlefield between buyers and sellers. ⚔️
🟢 SUPPORT — Where Buyers Step In
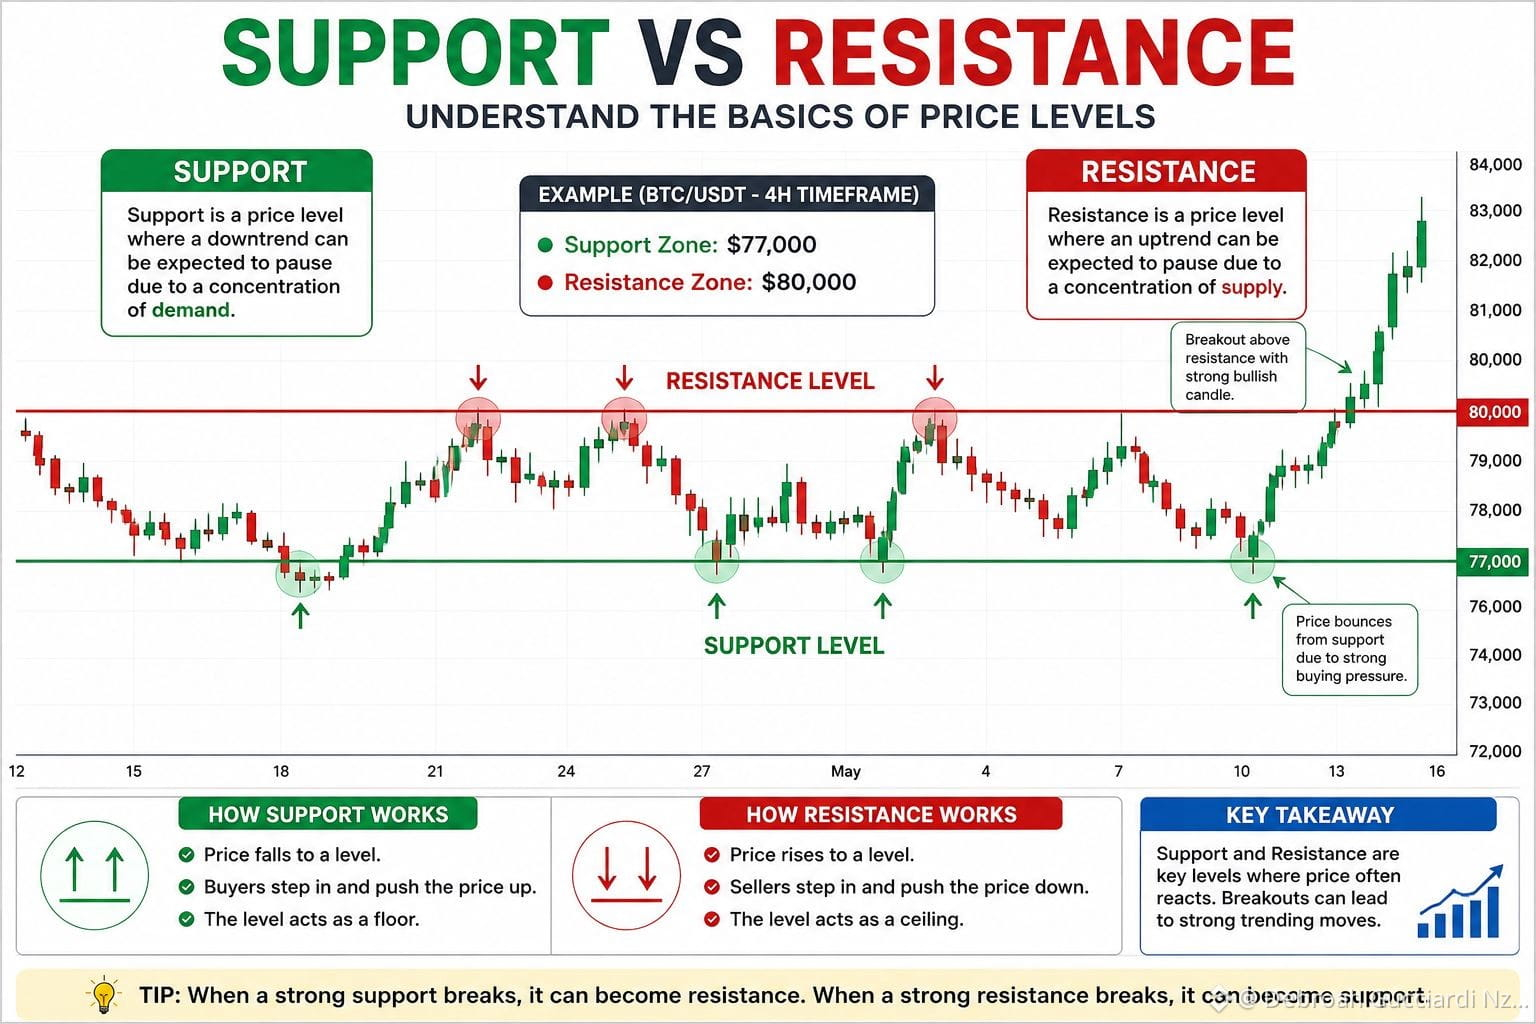
Support is a price zone where buying pressure tends to increase, making it harder for the price to move lower.
👉 When price reaches support, buyers may enter and push the market upward.
Example:
If $BTC repeatedly holds around $77,000, this area may act as support.
🔴 RESISTANCE — Where Sellers Step In
Resistance is a price zone where selling pressure tends to increase, making it harder for the price to move higher.
👉 When price approaches resistance, sellers may become more active and price can face rejection.
Example:
If BTC repeatedly struggles near $80,000, this area may act as resistance.
🔥 THE KEY IDEA
Support = Potential floor 🟢
Resistance = Potential ceiling 🔴
But remember: these are zones, not guaranteed reversal points. A strong breakout or breakdown can turn previous resistance into support—or previous support into resistance.
🎯 TRADER’S CHECKLIST
✔️ Watch price reaction at key levels
✔️ Look for confirmation before making decisions
✔️ Combine support/resistance with volume and trend
✔️ Always manage risk
💡 Simple Rule:
Buyers defend support. Sellers defend resistance.
#Bitcoin #BTC #Crypto #TechnicalAnalysis #SupportAndResistance #Trading #BTCUSDT #Binance
Think of the price chart like a battlefield between buyers and sellers. ⚔️
🟢 SUPPORT — Where Buyers Step In
Support is a price zone where buying pressure tends to increase, making it harder for the price to move lower.
👉 When price reaches support, buyers may enter and push the market upward.
Example:
If $BTC repeatedly holds around $77,000, this area may act as support.
🔴 RESISTANCE — Where Sellers Step In
Resistance is a price zone where selling pressure tends to increase, making it harder for the price to move higher.
👉 When price approaches resistance, sellers may become more active and price can face rejection.
Example:
If BTC repeatedly struggles near $80,000, this area may act as resistance.
🔥 THE KEY IDEA
Support = Potential floor 🟢
Resistance = Potential ceiling 🔴
But remember: these are zones, not guaranteed reversal points. A strong breakout or breakdown can turn previous resistance into support—or previous support into resistance.
🎯 TRADER’S CHECKLIST
✔️ Watch price reaction at key levels
✔️ Look for confirmation before making decisions
✔️ Combine support/resistance with volume and trend
✔️ Always manage risk
💡 Simple Rule:
Buyers defend support. Sellers defend resistance.
#Bitcoin #BTC #Crypto #TechnicalAnalysis #SupportAndResistance #Trading #BTCUSDT #Binance

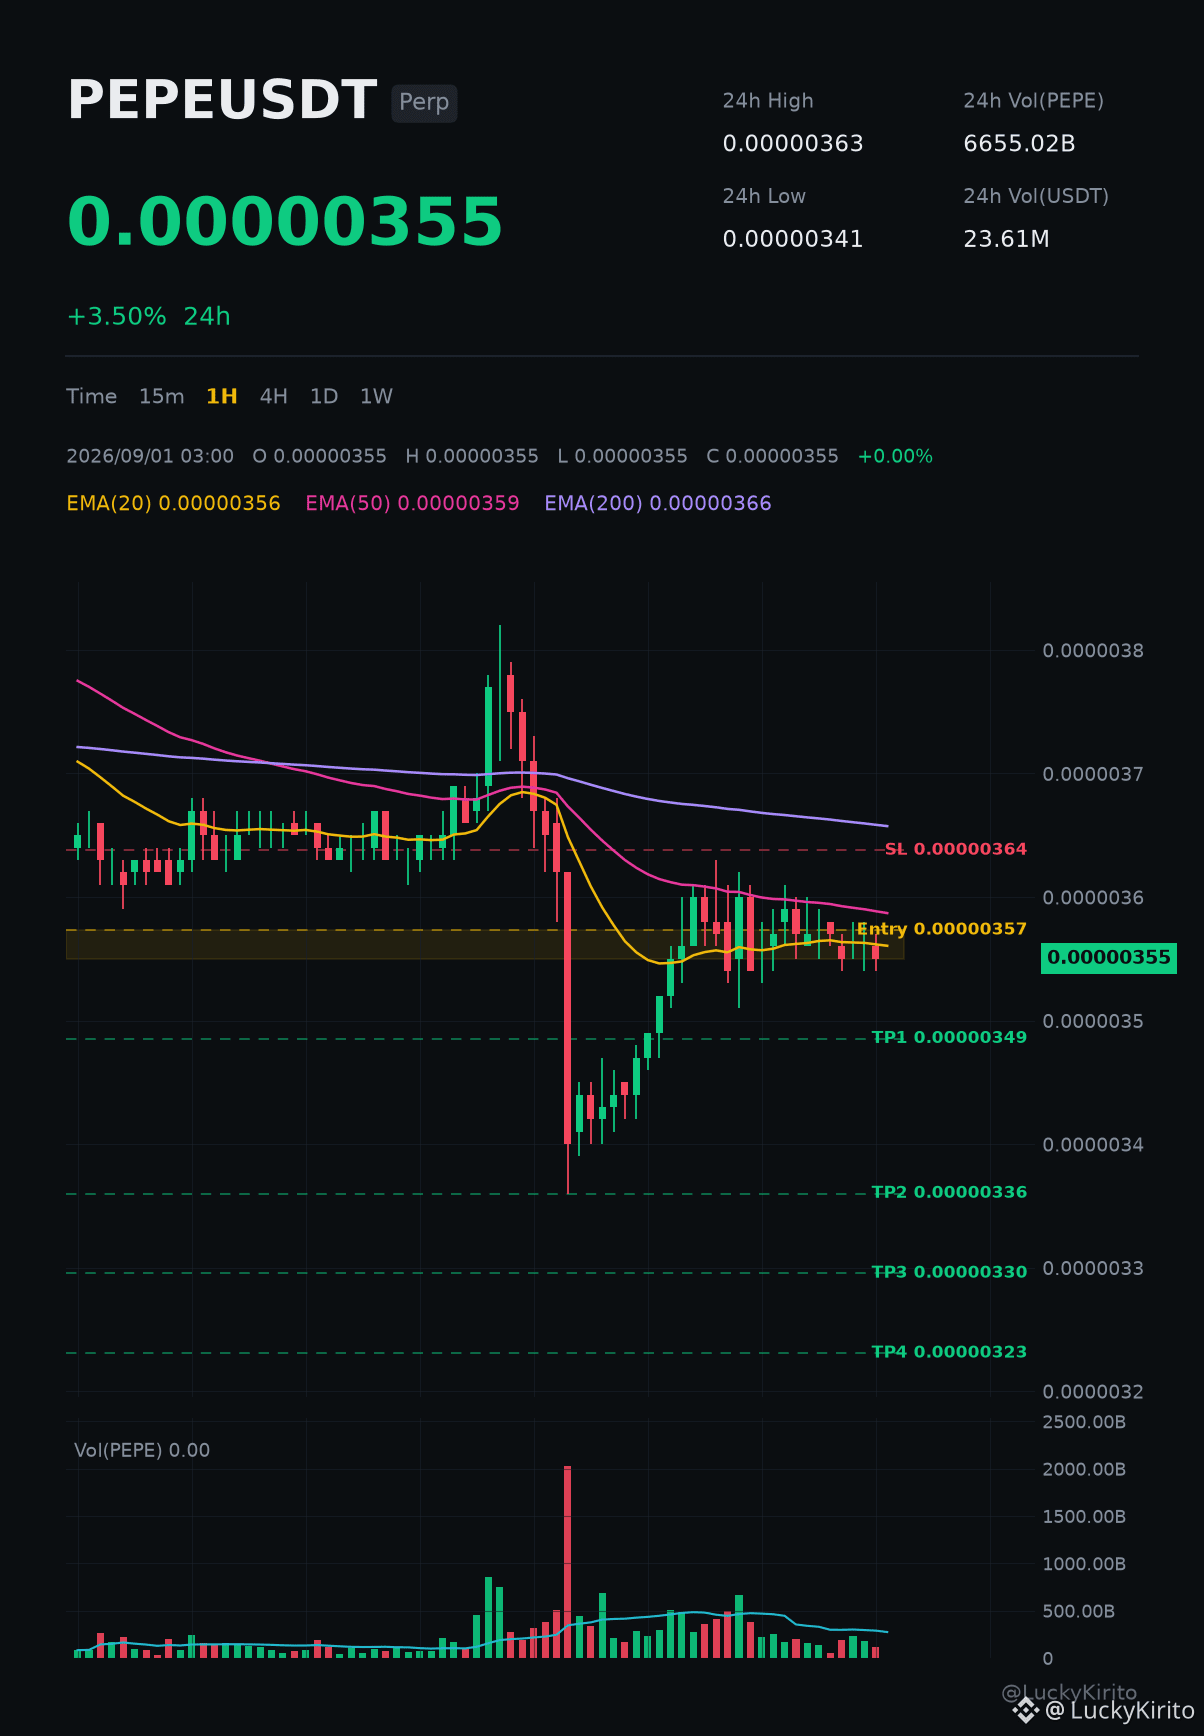
$PEPE 1H structure leaning bearish
$PEPE · SHORT · Conf 75%
Trade Plan:
Entry: 0.00000355 - 0.00000357
SL: 0.00000364
TP1: 0.00000349
TP2: 0.00000336
TP3: 0.00000330
TP4: 0.00000323
R:R about 2.5 to TP2 on the 1H
Conf is how many of our checks agree, not a win rate.
PEPE/USDT 0.00000355, +3.50% over 24h.
Why this setup?
- Price below the 200 EMA, long-term structure bearish
- EMA20 below EMA50, short-term momentum down
- 4H trend leaning down
- RSI(14) at 47.0 with volume x0.38 against the 20-bar average.
- Price is working a symmetrical triangle, which usually resolves sharply.
- Invalidation is unambiguous: through 0.00000364 the idea is simply wrong, so size it so that being wrong is survivable.
Key levels: S 0.00000354 · 0.00000351 · 0.00000336 | R 0.00000361 · 0.00000363 · 0.00000367
Debate:
Does PEPE deserve this drop, or is the market throwing it out with the rest?
Trade PEPE: spot https://www.binance.com/en/trade/PEPE_USDT | futures https://www.binance.com/en/futures/PEPEUSDT
$PEPE #PEPE #Write2Earn #TradingSetup #SupportAndResistance
Automated technical analysis, not financial advice. I am not responsible for your trades. DYOR.
$PEPE · SHORT · Conf 75%
Trade Plan:
Entry: 0.00000355 - 0.00000357
SL: 0.00000364
TP1: 0.00000349
TP2: 0.00000336
TP3: 0.00000330
TP4: 0.00000323
R:R about 2.5 to TP2 on the 1H
Conf is how many of our checks agree, not a win rate.
PEPE/USDT 0.00000355, +3.50% over 24h.
Why this setup?
- Price below the 200 EMA, long-term structure bearish
- EMA20 below EMA50, short-term momentum down
- 4H trend leaning down
- RSI(14) at 47.0 with volume x0.38 against the 20-bar average.
- Price is working a symmetrical triangle, which usually resolves sharply.
- Invalidation is unambiguous: through 0.00000364 the idea is simply wrong, so size it so that being wrong is survivable.
Key levels: S 0.00000354 · 0.00000351 · 0.00000336 | R 0.00000361 · 0.00000363 · 0.00000367
Debate:
Does PEPE deserve this drop, or is the market throwing it out with the rest?
Trade PEPE: spot https://www.binance.com/en/trade/PEPE_USDT | futures https://www.binance.com/en/futures/PEPEUSDT
$PEPE #PEPE #Write2Earn #TradingSetup #SupportAndResistance
Automated technical analysis, not financial advice. I am not responsible for your trades. DYOR.
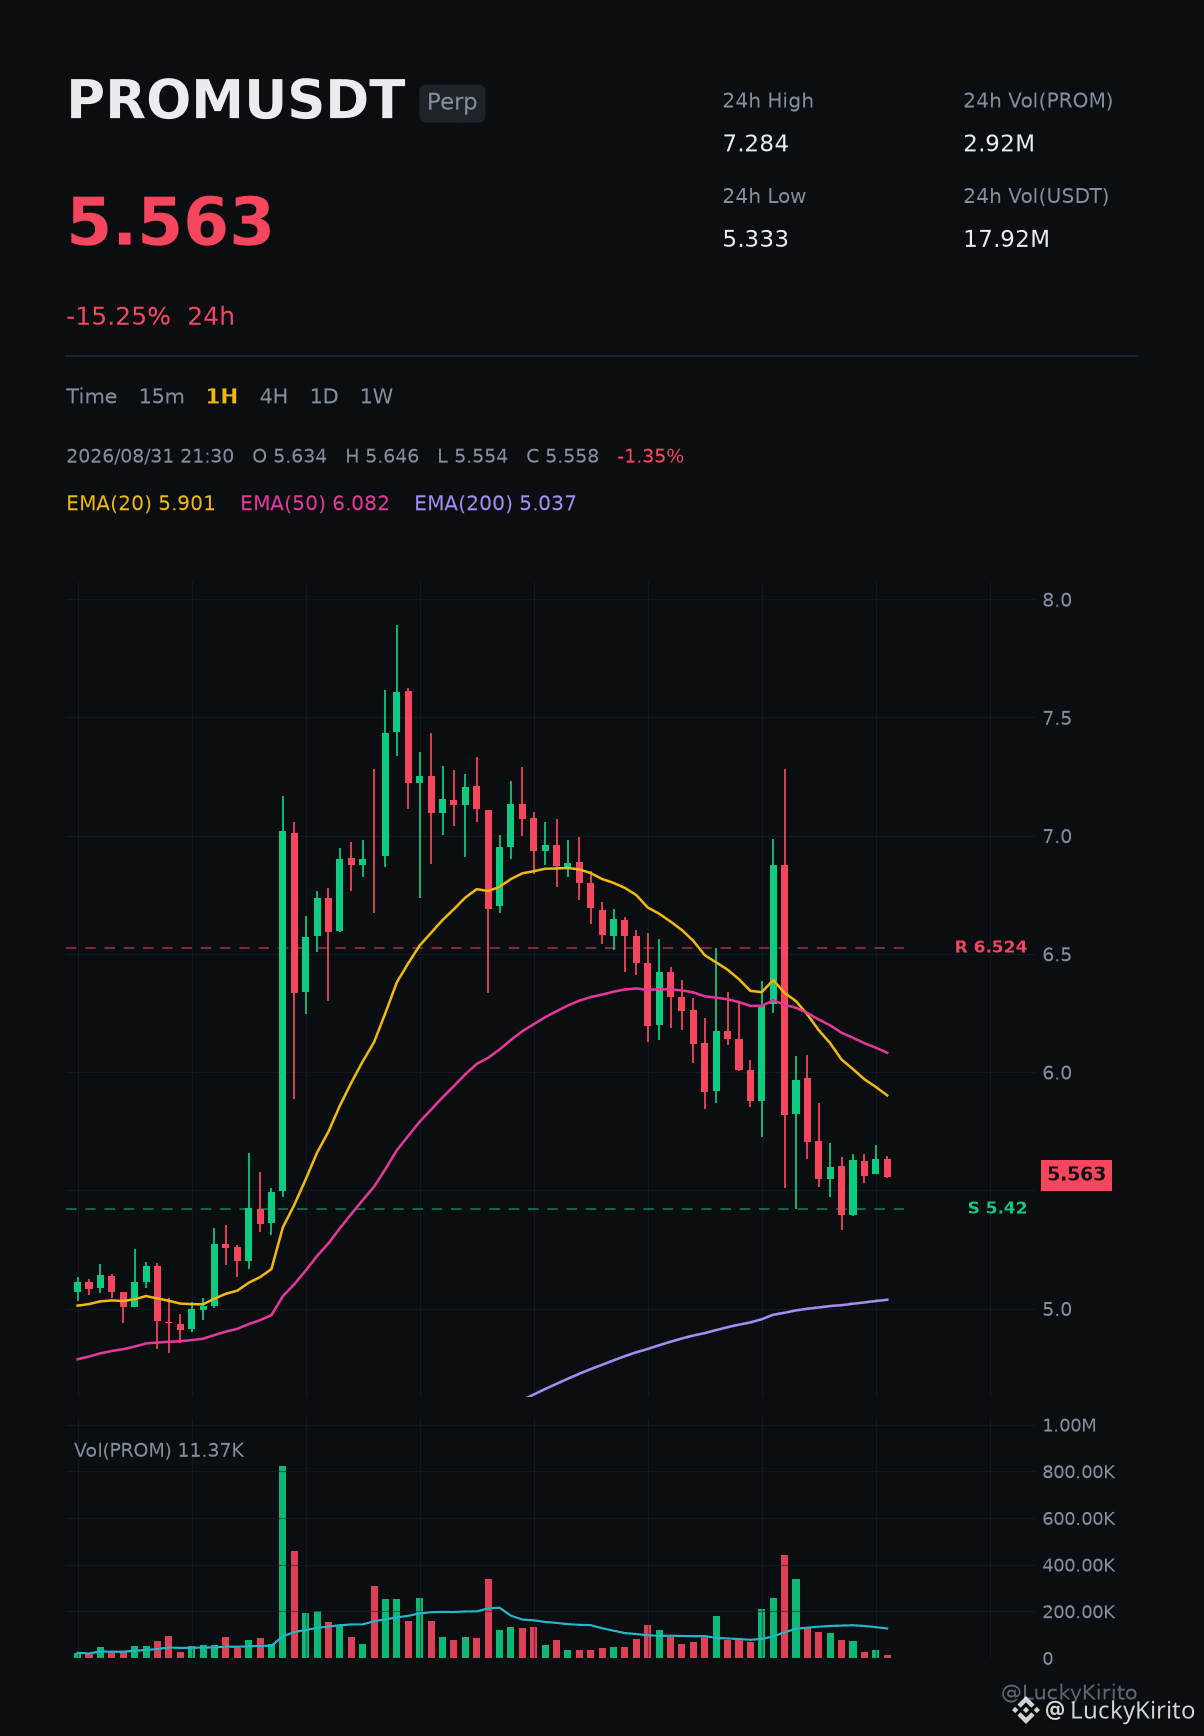
$PROM is waiting, and so should you
Buyers win above: 6.524
Sellers win below: 5.420
Until one of those breaks, doing nothing is a completely fine strategy.
$PROM is at a crossroads. The two numbers that decide it
PROM is trading at 5.558, down 15.2% in the last 24 hours.
The bigger trend is still up, even with the recent chop.
Trade PROM: spot https://www.binance.com/en/trade/PROM_USDT | futures https://www.binance.com/en/futures/PROMUSDT
$PROM #PROM #Write2Earn #MarketOutlook #SupportAndResistance
Automated technical analysis, not financial advice. I am not responsible for your trades. DYOR.
Buyers win above: 6.524
Sellers win below: 5.420
Until one of those breaks, doing nothing is a completely fine strategy.
$PROM is at a crossroads. The two numbers that decide it
PROM is trading at 5.558, down 15.2% in the last 24 hours.
The bigger trend is still up, even with the recent chop.
Trade PROM: spot https://www.binance.com/en/trade/PROM_USDT | futures https://www.binance.com/en/futures/PROMUSDT
$PROM #PROM #Write2Earn #MarketOutlook #SupportAndResistance
Automated technical analysis, not financial advice. I am not responsible for your trades. DYOR.
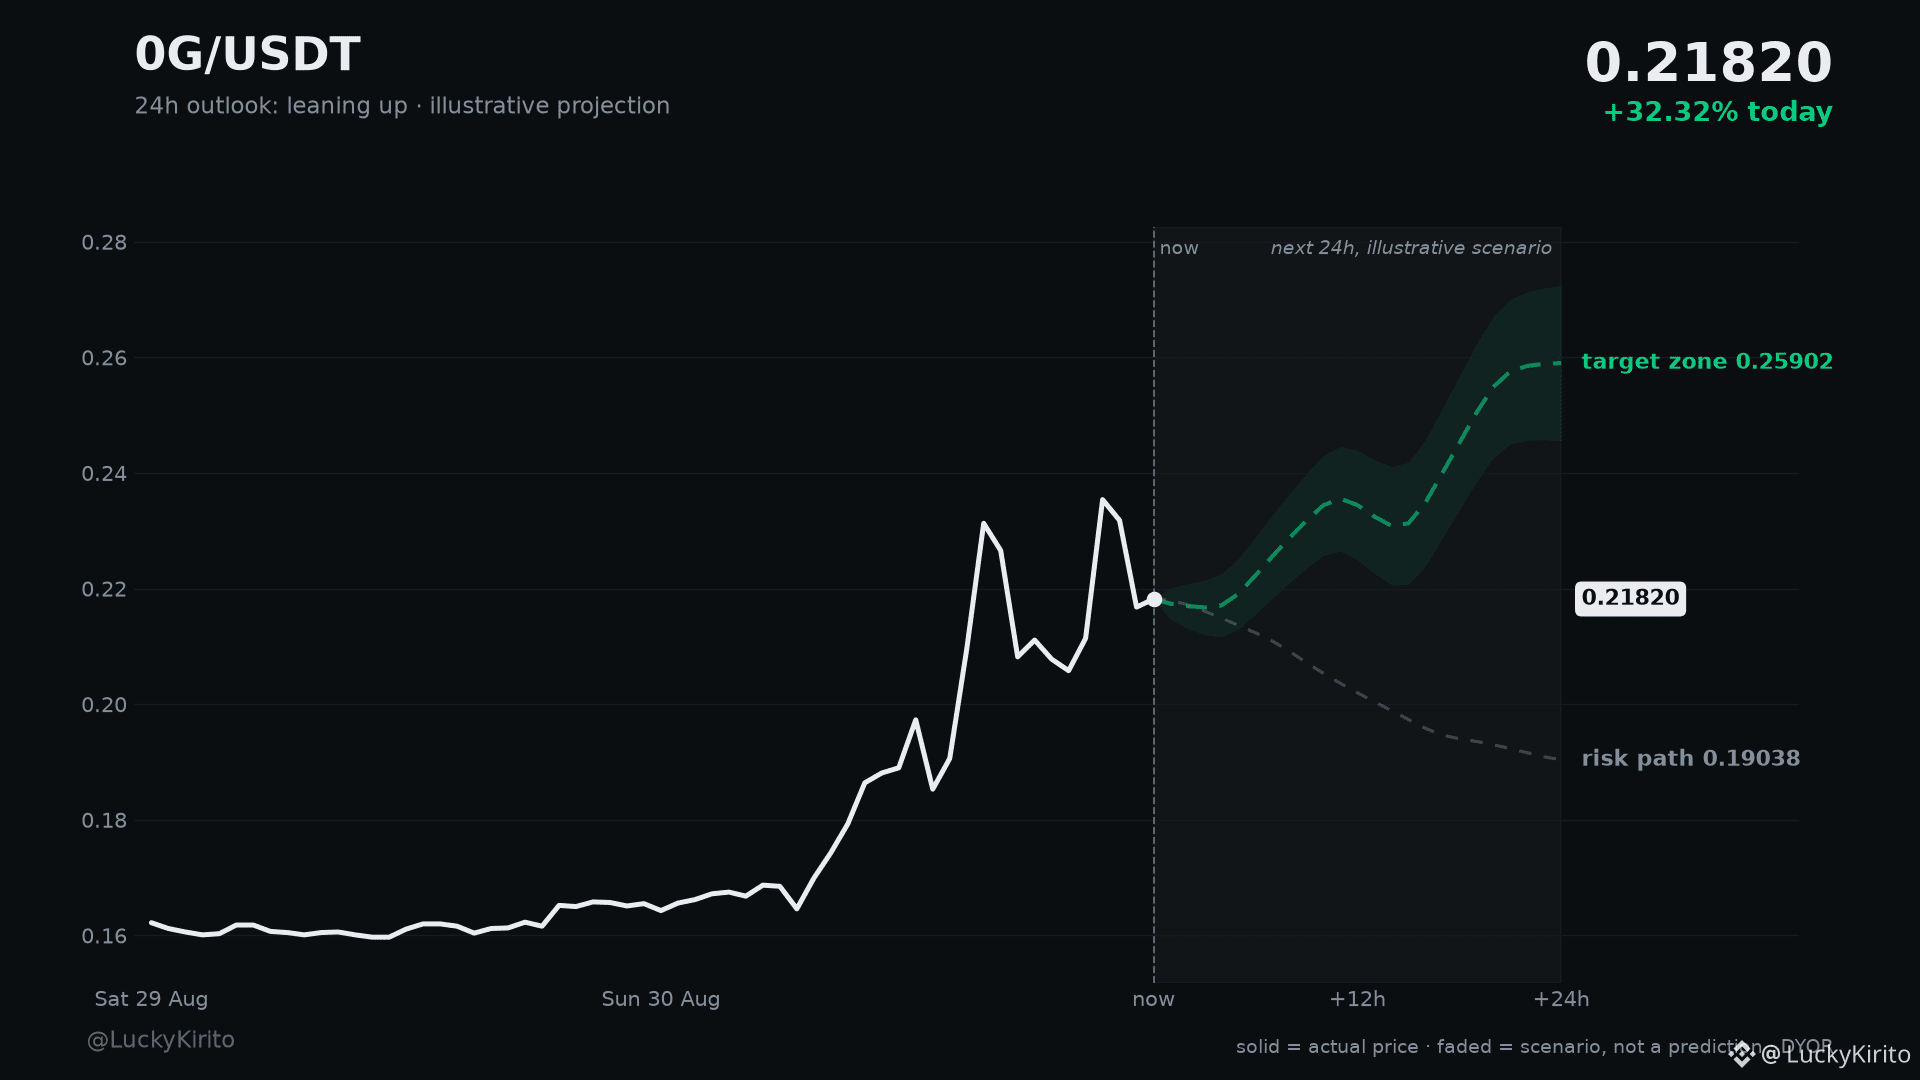
$0G next 24 hours: bullish while support holds
Holds above: 0.21149
Upside path: 0.23760 then 0.25639
Invalidated below: 0.19355
0G, next 24h: the honest version with both paths drawn
0G is at 0.21820, up 32.3% over the last 24 hours.
The trend is up and every dip keeps getting bought.
As long as 0.21149 holds, the path of least resistance points to those targets in the coming hours. Losing 0.19355 flips it and opens the slide lower.
The faded path is one way this could play out. The levels are what you actually trade.
Trade 0G: spot https://www.binance.com/en/trade/0G_USDT | futures https://www.binance.com/en/futures/0GUSDT
$0G #0G #Write2Earn #SupportAndResistance #MarketOutlook
Automated technical analysis, not financial advice. I am not responsible for your trades. DYOR.
Holds above: 0.21149
Upside path: 0.23760 then 0.25639
Invalidated below: 0.19355
0G, next 24h: the honest version with both paths drawn
0G is at 0.21820, up 32.3% over the last 24 hours.
The trend is up and every dip keeps getting bought.
As long as 0.21149 holds, the path of least resistance points to those targets in the coming hours. Losing 0.19355 flips it and opens the slide lower.
The faded path is one way this could play out. The levels are what you actually trade.
Trade 0G: spot https://www.binance.com/en/trade/0G_USDT | futures https://www.binance.com/en/futures/0GUSDT
$0G #0G #Write2Earn #SupportAndResistance #MarketOutlook
Automated technical analysis, not financial advice. I am not responsible for your trades. DYOR.
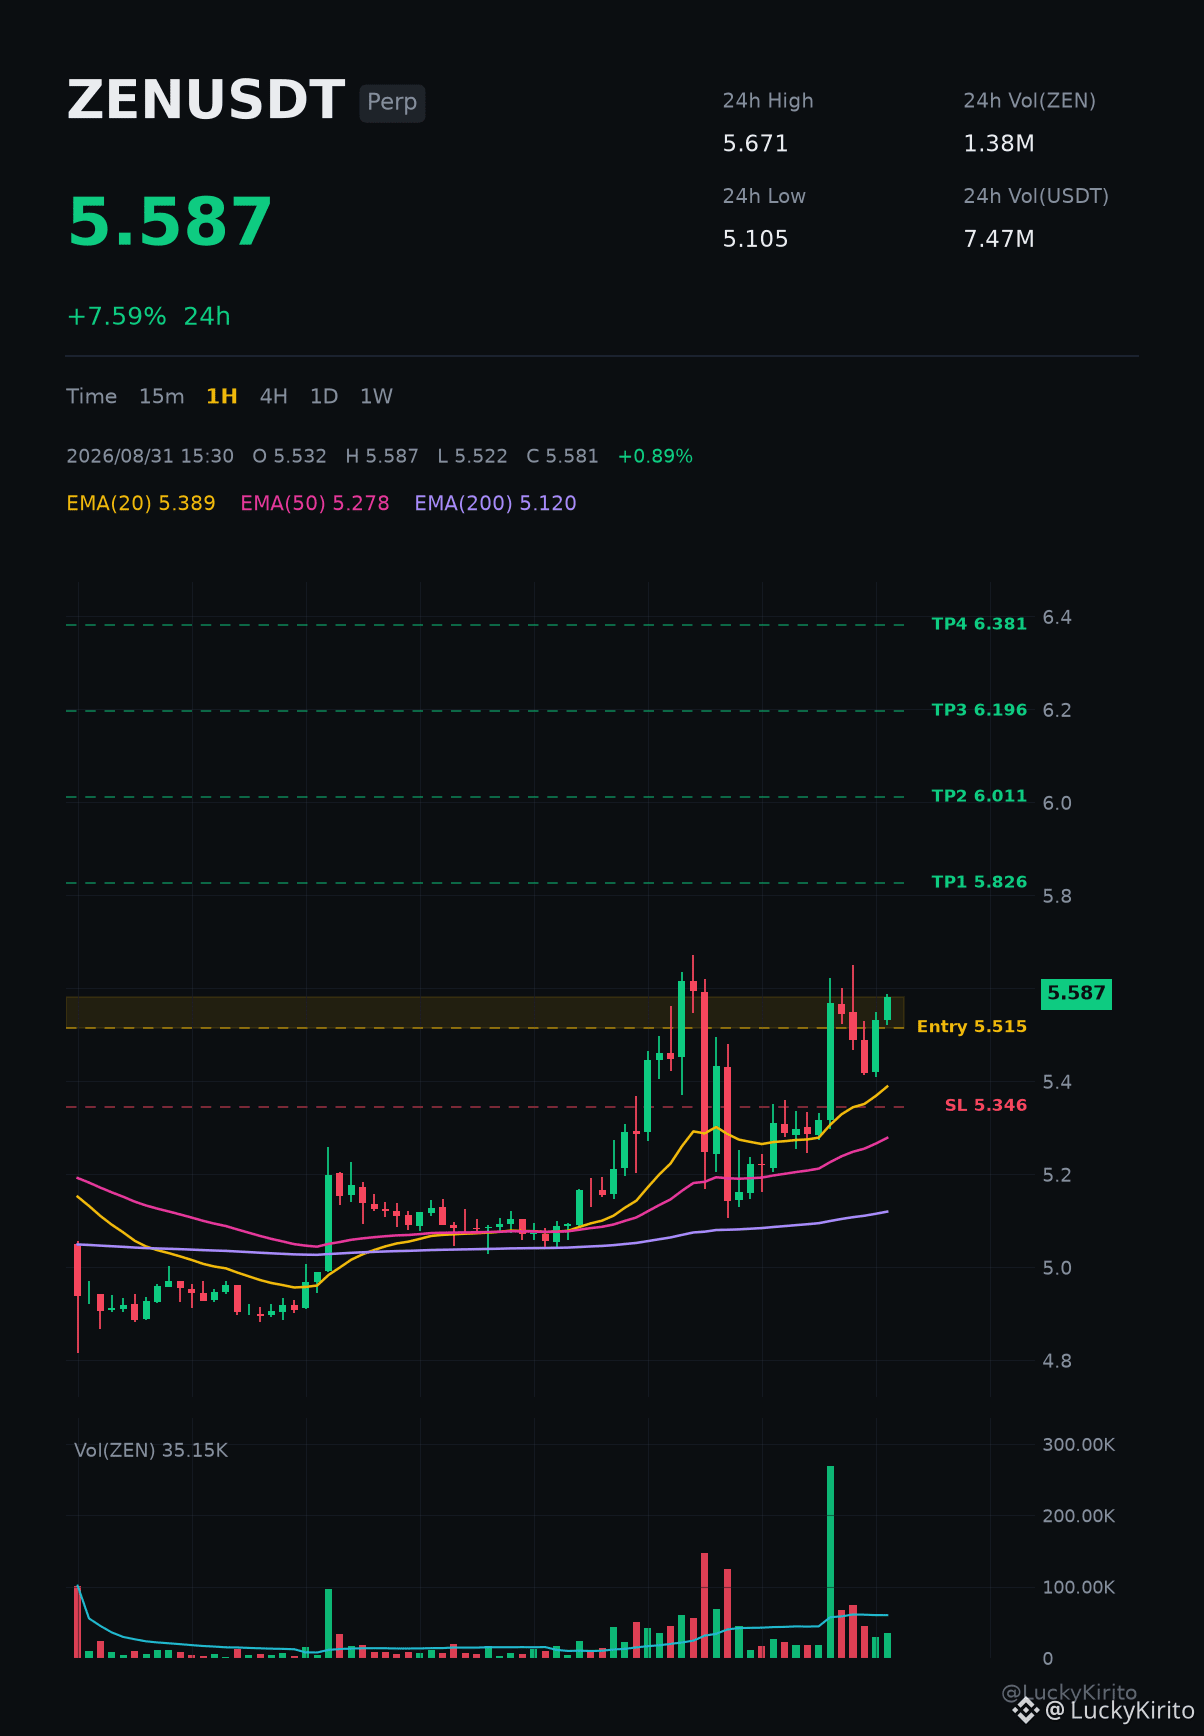
$ZEN looks buyable
Buy zone: 5.515 - 5.581
Take profit: 5.826, then 6.011
Get out if it drops below: 5.346
$ZEN is waking up. A simple plan if you want in
ZEN is trading at 5.581, up 7.6% in the last 24 hours.
The trend is up and every dip keeps getting bought.
Size, stop, exit. Decide those three and the rest is just waiting.
Trade ZEN: spot https://www.binance.com/en/trade/ZEN_USDT | futures https://www.binance.com/en/futures/ZENUSDT
$ZEN #ZEN #Write2Earn #SupportAndResistance #MarketAnalysis
Automated technical analysis, not financial advice. I am not responsible for your trades. DYOR.
Buy zone: 5.515 - 5.581
Take profit: 5.826, then 6.011
Get out if it drops below: 5.346
$ZEN is waking up. A simple plan if you want in
ZEN is trading at 5.581, up 7.6% in the last 24 hours.
The trend is up and every dip keeps getting bought.
Size, stop, exit. Decide those three and the rest is just waiting.
Trade ZEN: spot https://www.binance.com/en/trade/ZEN_USDT | futures https://www.binance.com/en/futures/ZENUSDT
$ZEN #ZEN #Write2Earn #SupportAndResistance #MarketAnalysis
Automated technical analysis, not financial advice. I am not responsible for your trades. DYOR.

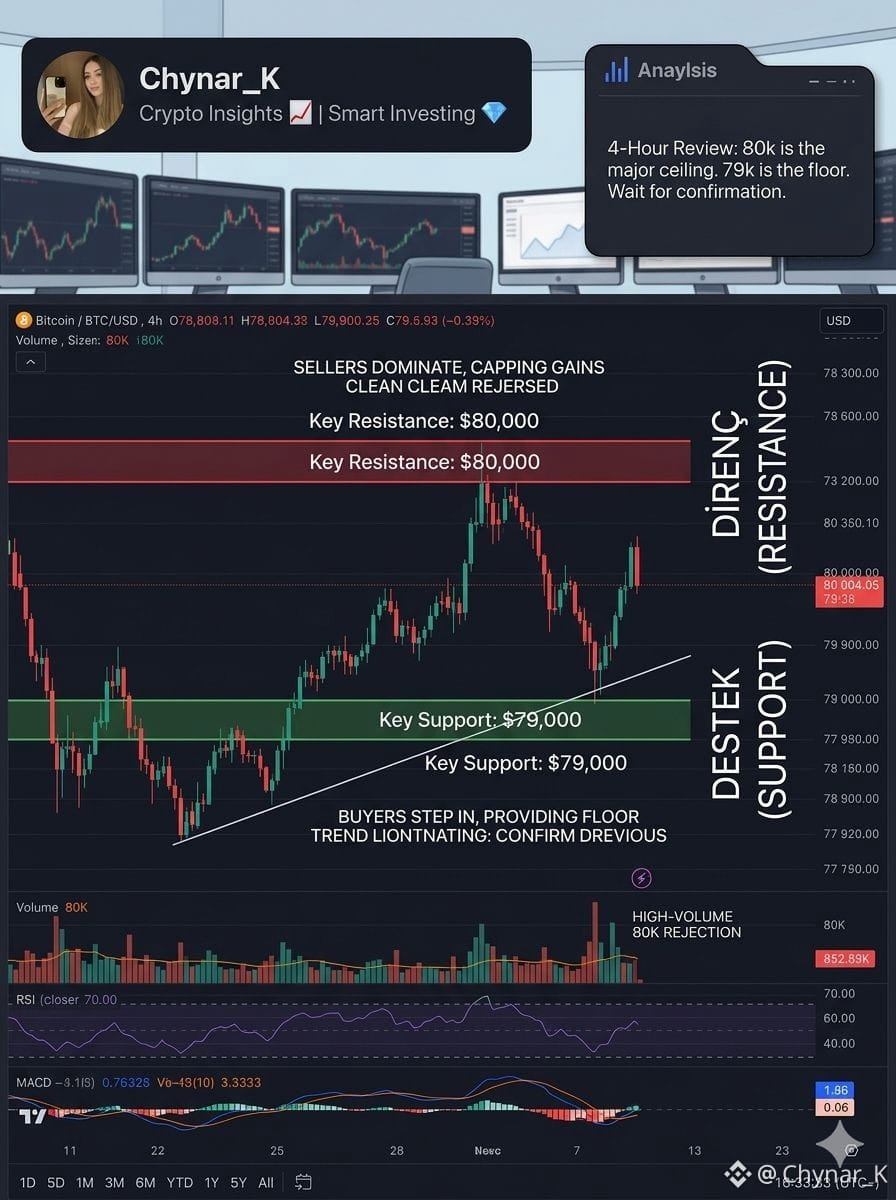
Resistance Held, Correction Followed! But What Are Support and Resistance? 🤔📉
In yesterday’s poll, the majority predicted Bitcoin would break past 80K. However, exactly as anticipated, the market faced strong resistance at the $80,000 level. Prices are currently undergoing a healthy correction (pullback) towards the $79,000 support zone.
But what do these two terms—which you constantly hear in technical analysis—actually mean? Let’s break it down in the simplest way possible:
🛡️ What is SUPPORT?As the price falls, buyers step in thinking, "This asset is now cheap, it's time to buy." This buying pressure acts like a flexible floor, stopping the price from dropping further.
🧱 What is RESISTANCE?As the price rises, sellers step in thinking, "The price is high enough, it's time to take profits." This selling pressure acts like a solid ceiling, making it difficult for the price to break above.
💡 Pro Tip: Support and resistance levels are not exact, millimeter-perfect lines—they are always price zones. Once a resistance level is broken with high volume, it flips and becomes our new support level!
Right now, all eyes are on Bitcoin's strength around $79,000. Do you think this support will hold, or is a deeper correction on the way? 💭 Let me know your thoughts in the comments!
#Bitcoin #TechnicalAnalysis #BTC #CryptoInvesting #FinancialEducation #CryptoInsights #MarketTrends #SmartInvesting #SupportAndResistance
In yesterday’s poll, the majority predicted Bitcoin would break past 80K. However, exactly as anticipated, the market faced strong resistance at the $80,000 level. Prices are currently undergoing a healthy correction (pullback) towards the $79,000 support zone.
But what do these two terms—which you constantly hear in technical analysis—actually mean? Let’s break it down in the simplest way possible:
🛡️ What is SUPPORT?As the price falls, buyers step in thinking, "This asset is now cheap, it's time to buy." This buying pressure acts like a flexible floor, stopping the price from dropping further.
🧱 What is RESISTANCE?As the price rises, sellers step in thinking, "The price is high enough, it's time to take profits." This selling pressure acts like a solid ceiling, making it difficult for the price to break above.
💡 Pro Tip: Support and resistance levels are not exact, millimeter-perfect lines—they are always price zones. Once a resistance level is broken with high volume, it flips and becomes our new support level!
Right now, all eyes are on Bitcoin's strength around $79,000. Do you think this support will hold, or is a deeper correction on the way? 💭 Let me know your thoughts in the comments!
#Bitcoin #TechnicalAnalysis #BTC #CryptoInvesting #FinancialEducation #CryptoInsights #MarketTrends #SmartInvesting #SupportAndResistance
Angel_web3:
le temps nous le dira 🤷🤷

📊 BTC/USDT: Understanding Support & Resistance
Understanding Support and Resistance levels is quite useful when analyzing Bitcoin.
🟢 Support: The price area where buying interest may show up.
🔴 Resistance: The price area where selling pressure may increase.
But it’s not necessary to make a decision by looking at just one level—volume, trend, and market sentiment should also be considered.
📌 In crypto, both knowledge + risk management are important.
#BTC #Bitcoin #CryptoEducation #TechnicalAnalysis #supportandresistance
Understanding Support and Resistance levels is quite useful when analyzing Bitcoin.
🟢 Support: The price area where buying interest may show up.
🔴 Resistance: The price area where selling pressure may increase.
But it’s not necessary to make a decision by looking at just one level—volume, trend, and market sentiment should also be considered.
📌 In crypto, both knowledge + risk management are important.
#BTC #Bitcoin #CryptoEducation #TechnicalAnalysis #supportandresistance
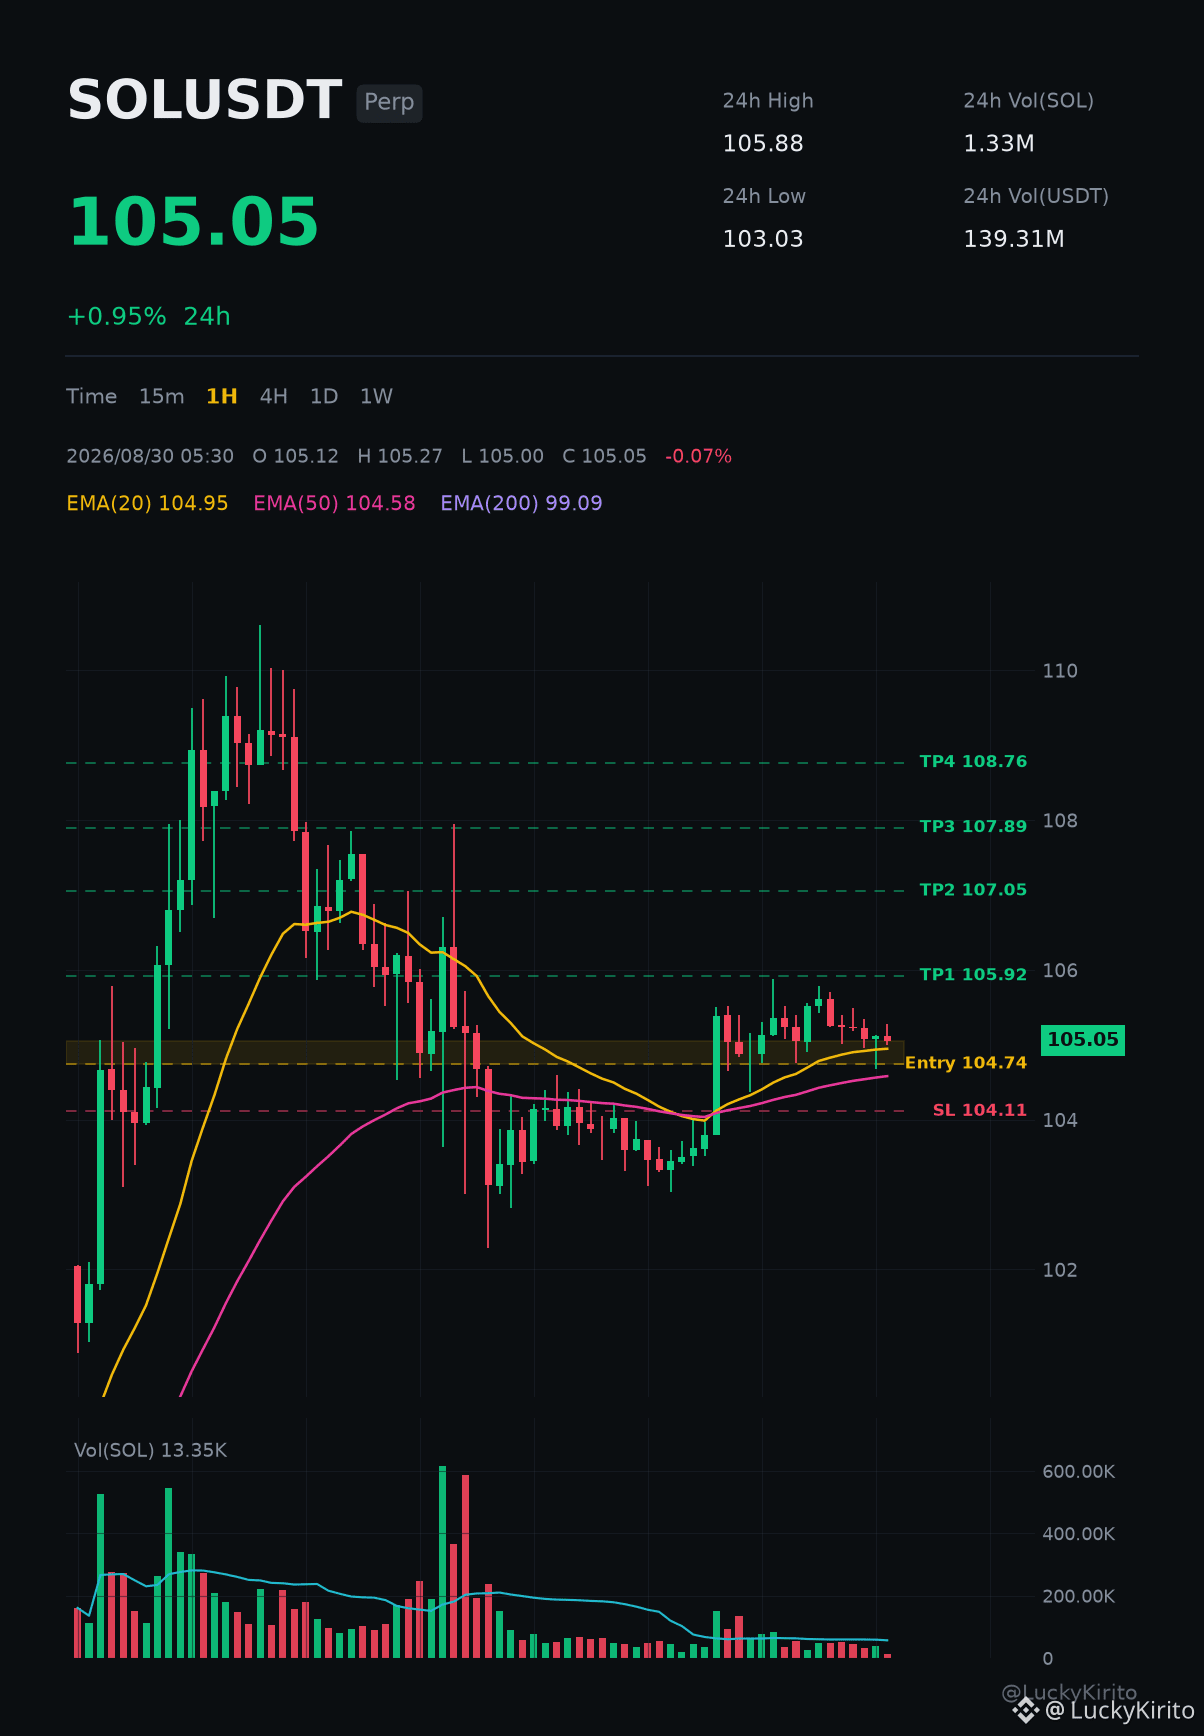
$SOL looks buyable
Buy zone: 104.74 - 105.05
Take profit: 105.92, then 107.05
Get out if it drops below: 104.11
$SOL is looking strong right now. The simple breakdown
SOL is trading at 105.05, up 1.0% in the last 24 hours.
The trend is up and every dip keeps getting bought.
The chart is squeezing into a rising wedge; these usually end with a sharp move.
If you are already in, the job is managing it, not celebrating it.
Trade SOL: spot https://www.binance.com/en/trade/SOL_USDT | futures https://www.binance.com/en/futures/SOLUSDT
$SOL #SOL #Write2Earn #SupportAndResistance #TradingSignals
Automated technical analysis, not financial advice. I am not responsible for your trades. DYOR.
Buy zone: 104.74 - 105.05
Take profit: 105.92, then 107.05
Get out if it drops below: 104.11
$SOL is looking strong right now. The simple breakdown
SOL is trading at 105.05, up 1.0% in the last 24 hours.
The trend is up and every dip keeps getting bought.
The chart is squeezing into a rising wedge; these usually end with a sharp move.
If you are already in, the job is managing it, not celebrating it.
Trade SOL: spot https://www.binance.com/en/trade/SOL_USDT | futures https://www.binance.com/en/futures/SOLUSDT
$SOL #SOL #Write2Earn #SupportAndResistance #TradingSignals
Automated technical analysis, not financial advice. I am not responsible for your trades. DYOR.
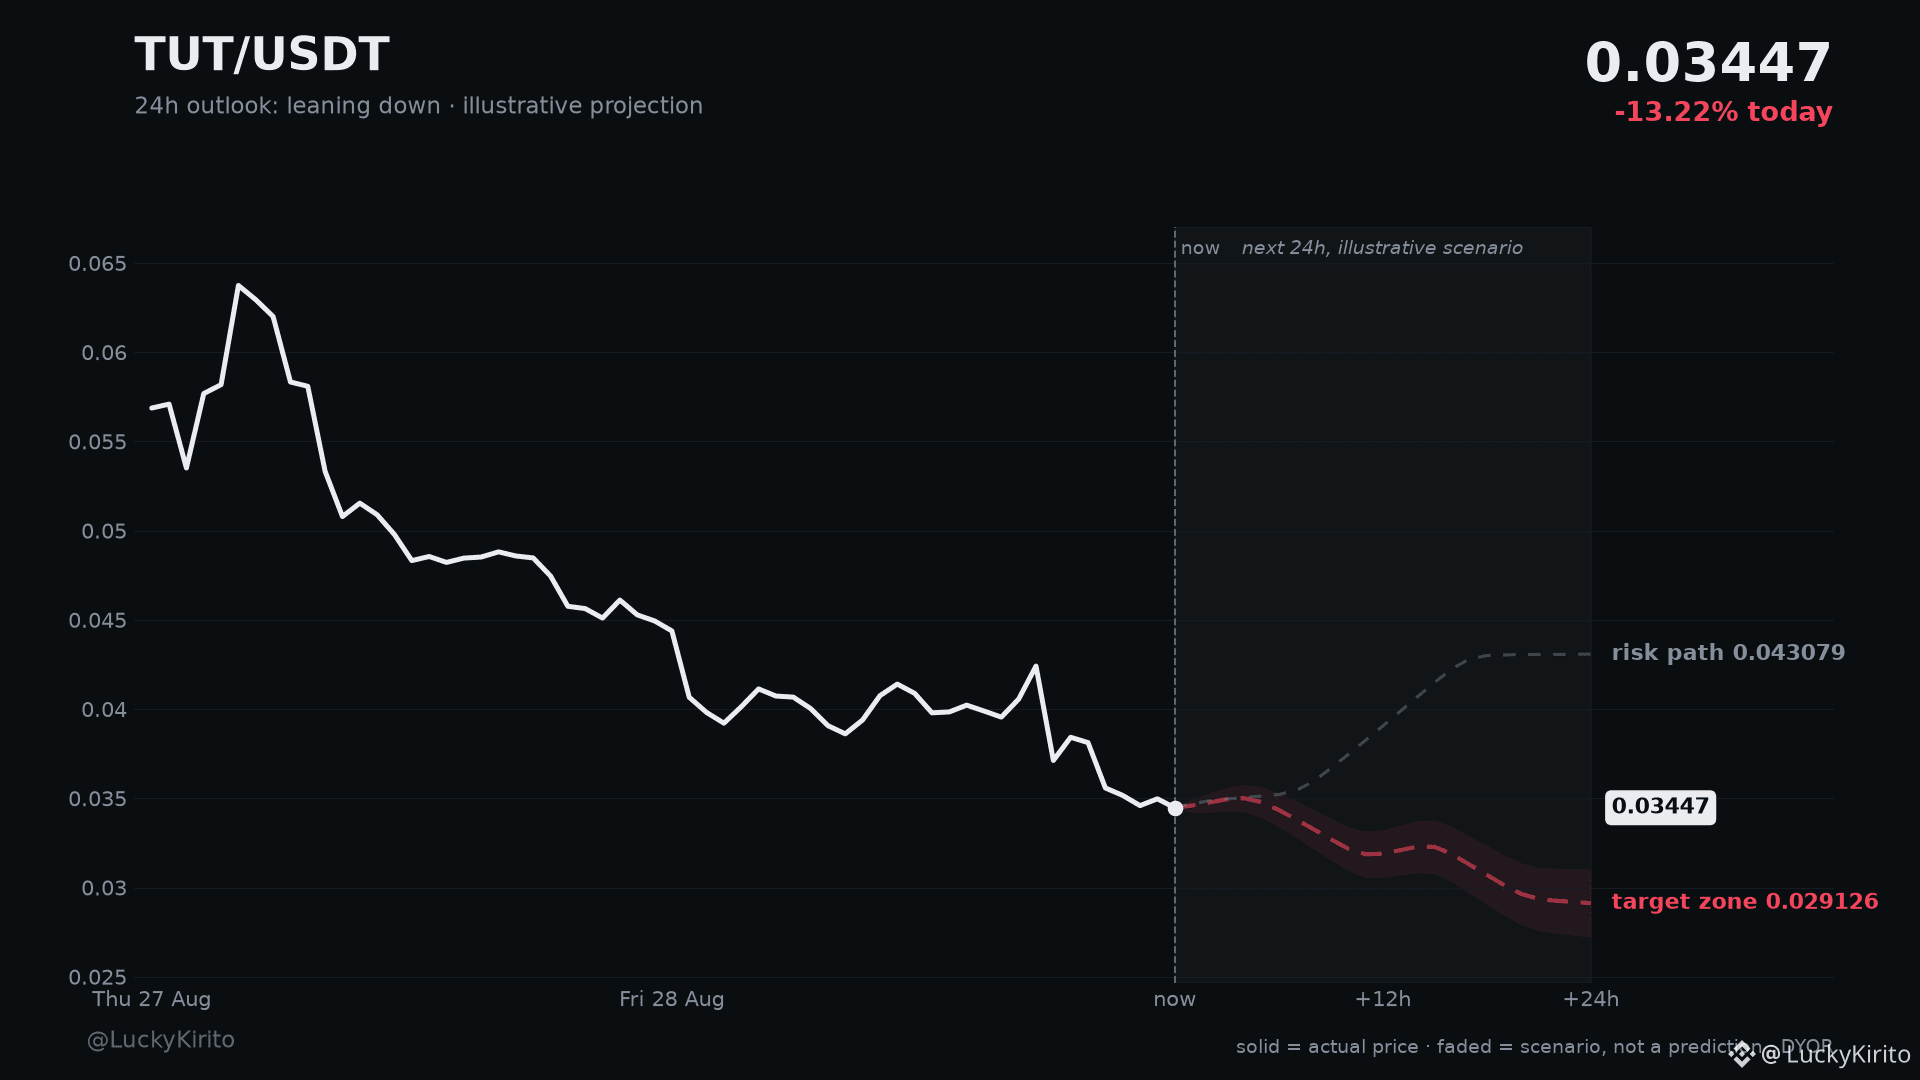
$TUT next 24 hours: heavy while resistance caps it
Capped below: 0.03542
Downside path: 0.03180 then 0.02912
Invalidated above: 0.04281
TUT for the next day: what holds, what folds
TUT is at 0.03447, down 13.2% over the last 24 hours.
The trend is down and bounces keep getting sold.
While 0.03542 caps the bounces, pressure points to those targets. Reclaiming 0.04281 squeezes shorts and flips the picture.
Solid candles are recorded, the faded stretch is a scenario. A map, not a forecast.
Trade TUT: spot https://www.binance.com/en/trade/TUT_USDT | futures https://www.binance.com/en/futures/TUTUSDT
$TUT #TUT #Write2Earn #SupportAndResistance #MarketOutlook
Automated technical analysis, not financial advice. I am not responsible for your trades. DYOR.
Capped below: 0.03542
Downside path: 0.03180 then 0.02912
Invalidated above: 0.04281
TUT for the next day: what holds, what folds
TUT is at 0.03447, down 13.2% over the last 24 hours.
The trend is down and bounces keep getting sold.
While 0.03542 caps the bounces, pressure points to those targets. Reclaiming 0.04281 squeezes shorts and flips the picture.
Solid candles are recorded, the faded stretch is a scenario. A map, not a forecast.
Trade TUT: spot https://www.binance.com/en/trade/TUT_USDT | futures https://www.binance.com/en/futures/TUTUSDT
$TUT #TUT #Write2Earn #SupportAndResistance #MarketOutlook
Automated technical analysis, not financial advice. I am not responsible for your trades. DYOR.

POWR/USDT Testing Crucial Support: Will It Hold? ⚠️
$POWR
The broader crypto market is experiencing high volatility, and POWR/USDT is not immune to the pressure. Looking at the charts, the price is currently retracing and rapidly approaching a major support zone. This area is critical for the bulls to defend if they want to maintain the macro upward structure. If the price fails to hold this support level, we might see an extended downside correction toward the next major demand zone. High volume selling pressure could accelerate this drop. It is wise to wait for a clear reversal sign or a strong bounce before considering any long entries. Stay patient, use tight stop-losses, and do not fight the market trend. Protect your capital first!#POWR: #POWRUSDT #CryptoRiskSignals #BEARISH📉 #supportandresistance
$POWR
The broader crypto market is experiencing high volatility, and POWR/USDT is not immune to the pressure. Looking at the charts, the price is currently retracing and rapidly approaching a major support zone. This area is critical for the bulls to defend if they want to maintain the macro upward structure. If the price fails to hold this support level, we might see an extended downside correction toward the next major demand zone. High volume selling pressure could accelerate this drop. It is wise to wait for a clear reversal sign or a strong bounce before considering any long entries. Stay patient, use tight stop-losses, and do not fight the market trend. Protect your capital first!#POWR: #POWRUSDT #CryptoRiskSignals #BEARISH📉 #supportandresistance


📚 TRADING GUIDE | SUPPORT & RESISTANCE
━━━━━━━━━━━━━━━━━━
TRADE WITH REHMAAN
Read the Market. Respect the Risk.
━━━━━━━━━━━━━━━━━━
🎯 SUPPORT — Where Buyers May Step In
Support is a price area where buying interest has previously been strong enough to slow or reverse a decline.
Look for:
• Previous swing lows
• Repeated price reactions
• Strong rejection wicks
• High-volume areas
• Previous breakout/retest zones
⚠️ Important: Support is a zone, not an exact line. Price can move below it temporarily before reversing — or break it completely.
━━━━━━━━━━━━━━━━━━
🔥 RESISTANCE — Where Sellers May Step In
Resistance is a price area where selling pressure has previously been strong enough to slow or reverse an advance.
Look for:
• Previous swing highs
• Repeated rejections
• Strong bearish reactions
• Previous breakdown/retest zones
• Areas where price repeatedly failed to move higher
⚠️ Resistance is also a zone, not a guaranteed reversal point.
━━━━━━━━━━━━━━━━━━
🧠 THE PROFESSIONAL APPROACH
Don't trade simply because price touches support or resistance.
Instead, wait for confirmation:
✓ Market structure
✓ Candle reaction
✓ Volume
✓ Breakout + retest
✓ Higher-timeframe level
✓ Risk-to-reward
A level is an area of interest — confirmation is what gives the trade its edge.
━━━━━━━━━━━━━━━━━━
💡 REMEMBER
Support can become Resistance after a confirmed breakdown.
Resistance can become Support after a confirmed breakout.
This is commonly called Role Reversal.
📌 Trade the reaction, not the prediction.
Good analysis is not about predicting every move.
It's about identifying important levels, waiting for confirmation, and managing risk when the market proves your idea wrong.
#SupportAndResistance #TechnicalAnalysis #TradingEducation #FuturesTrading #RiskManagement $VELVET $DEXE
━━━━━━━━━━━━━━━━━━
TRADE WITH REHMAAN
Read the Market. Respect the Risk.
━━━━━━━━━━━━━━━━━━
🎯 SUPPORT — Where Buyers May Step In
Support is a price area where buying interest has previously been strong enough to slow or reverse a decline.
Look for:
• Previous swing lows
• Repeated price reactions
• Strong rejection wicks
• High-volume areas
• Previous breakout/retest zones
⚠️ Important: Support is a zone, not an exact line. Price can move below it temporarily before reversing — or break it completely.
━━━━━━━━━━━━━━━━━━
🔥 RESISTANCE — Where Sellers May Step In
Resistance is a price area where selling pressure has previously been strong enough to slow or reverse an advance.
Look for:
• Previous swing highs
• Repeated rejections
• Strong bearish reactions
• Previous breakdown/retest zones
• Areas where price repeatedly failed to move higher
⚠️ Resistance is also a zone, not a guaranteed reversal point.
━━━━━━━━━━━━━━━━━━
🧠 THE PROFESSIONAL APPROACH
Don't trade simply because price touches support or resistance.
Instead, wait for confirmation:
✓ Market structure
✓ Candle reaction
✓ Volume
✓ Breakout + retest
✓ Higher-timeframe level
✓ Risk-to-reward
A level is an area of interest — confirmation is what gives the trade its edge.
━━━━━━━━━━━━━━━━━━
💡 REMEMBER
Support can become Resistance after a confirmed breakdown.
Resistance can become Support after a confirmed breakout.
This is commonly called Role Reversal.
📌 Trade the reaction, not the prediction.
Good analysis is not about predicting every move.
It's about identifying important levels, waiting for confirmation, and managing risk when the market proves your idea wrong.
#SupportAndResistance #TechnicalAnalysis #TradingEducation #FuturesTrading #RiskManagement $VELVET $DEXE

📚 CRYPTO LESSON:
Support vs Resistance
Many new traders make the same mistake: buying or selling without understanding key levels.
🟢 Support = an area where buyers may step in.
🔴 Resistance = an area where sellers may become stronger.
The important part?
👉 A broken resistance can become new support.
👉 A broken support can become new resistance.
Always combine levels with volume + price action + risk management.
#CryptoEducation
#TradingTips
#supportandresistance
Support vs Resistance
Many new traders make the same mistake: buying or selling without understanding key levels.
🟢 Support = an area where buyers may step in.
🔴 Resistance = an area where sellers may become stronger.
The important part?
👉 A broken resistance can become new support.
👉 A broken support can become new resistance.
Always combine levels with volume + price action + risk management.
#CryptoEducation
#TradingTips
#supportandresistance

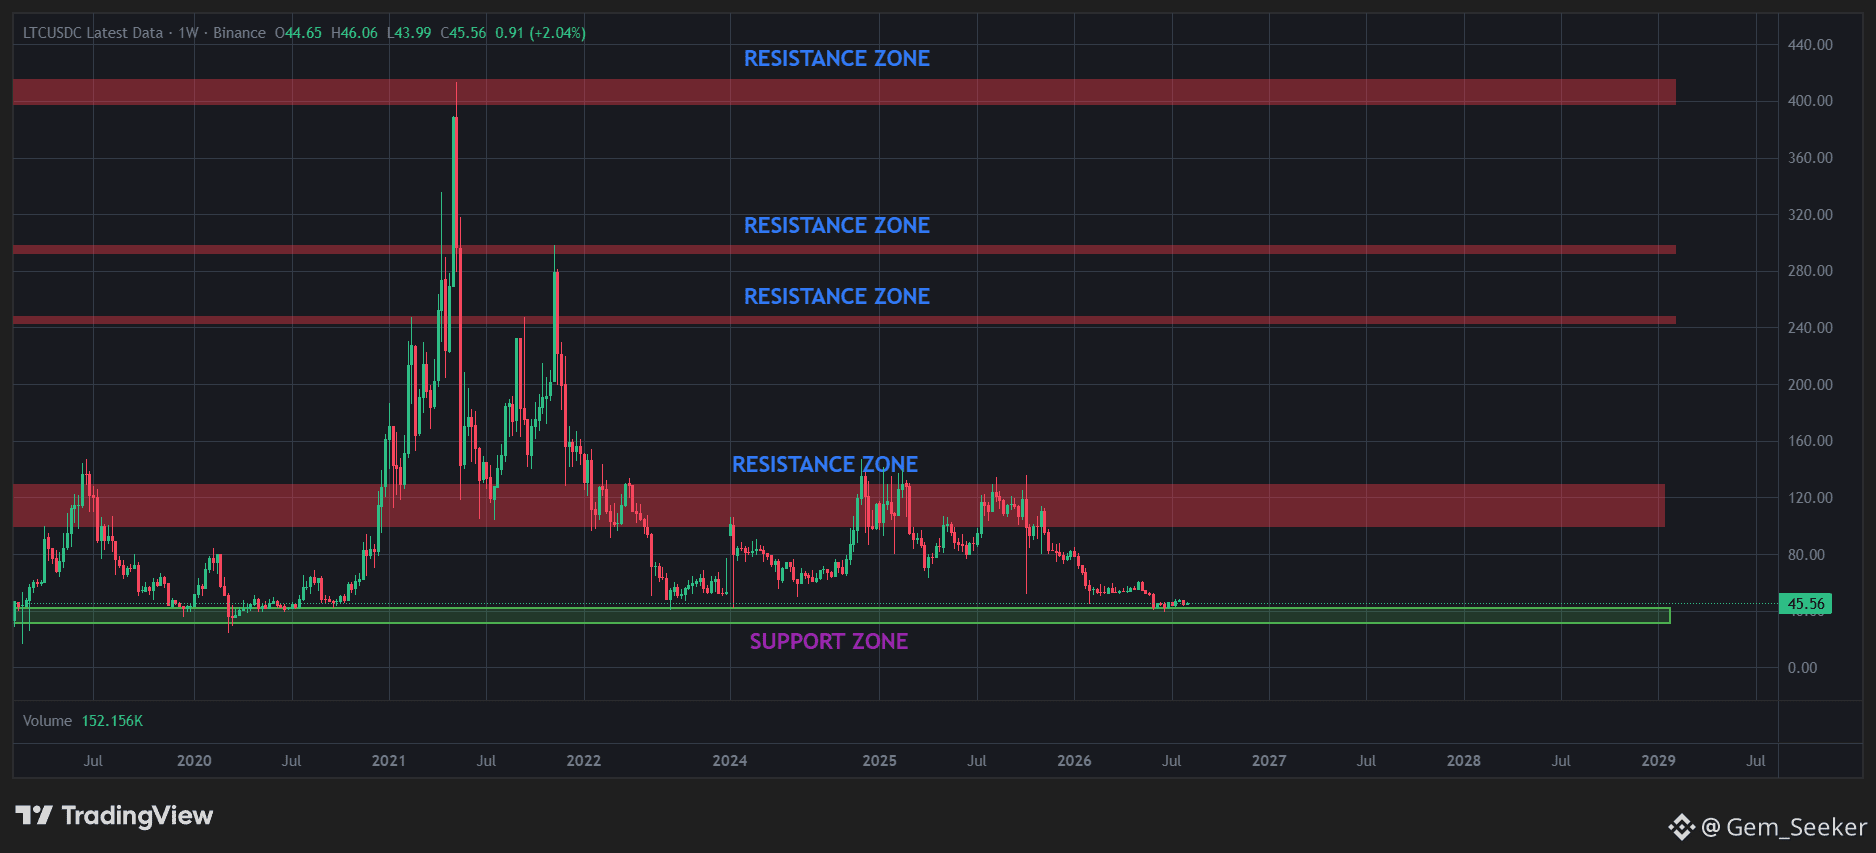
⚡ $LTC UPDATE: Rebuilding Base at Major Support! ⚡
Take a look at this Weekly chart for Litecoin (LTC/USDC). Price action has retraced to one of the most critical historical floors on the chart!
What We Are Seeing
Testing Long-Term Support: $LTC is currently trading right inside the macro SUPPORT ZONE (marked in green, roughly $35–$45). This region has served as a reliable multi-year floor during previous cycle bottoms.
Current Action: LTC is hovering near the upper boundary of this support level at around $45.58, seeking a stable base after a macro pull-back.
The Outlook:
🛡️ Confirmation Needed: For a valid reversal to take shape, price action must firmly maintain weekly closes above the support zone ($35–$45) and show strong buying pressure.
🎯 First Major Resistance: If the support zone holds, the immediate macro upside target lies in the broad RESISTANCE ZONE (marked in red, roughly $100–$130).
🚀 Higher Resistance Levels: A decisive break above $130 would open the door for testing the higher historical resistance bands marked on the chart:
Level 2: ~$240–$250
Level 3: ~$290–$300
Macro Top Zone: ~$400–$410
⚠️ Key Takeaway: As long as LTC maintains closes above the current support floor, the risk-to-reward for a multi-stage recovery remains favorable. A decisive breakdown below $35, however, would invalidate the current base.
What’s your strategy? Are you accumulating and HODLing $LTC near these multi-year support levels or waiting for higher confirmation? 💬
#Litecoin #TechnicalAnalysis #ChartAnalysis #SupportAndResistance
(Note: Always remember that technical analysis is based on historical price action and chart patterns; this is not financial advice. Perform your own research before trading.)
Take a look at this Weekly chart for Litecoin (LTC/USDC). Price action has retraced to one of the most critical historical floors on the chart!
What We Are Seeing
Testing Long-Term Support: $LTC is currently trading right inside the macro SUPPORT ZONE (marked in green, roughly $35–$45). This region has served as a reliable multi-year floor during previous cycle bottoms.
Current Action: LTC is hovering near the upper boundary of this support level at around $45.58, seeking a stable base after a macro pull-back.
The Outlook:
🛡️ Confirmation Needed: For a valid reversal to take shape, price action must firmly maintain weekly closes above the support zone ($35–$45) and show strong buying pressure.
🎯 First Major Resistance: If the support zone holds, the immediate macro upside target lies in the broad RESISTANCE ZONE (marked in red, roughly $100–$130).
🚀 Higher Resistance Levels: A decisive break above $130 would open the door for testing the higher historical resistance bands marked on the chart:
Level 2: ~$240–$250
Level 3: ~$290–$300
Macro Top Zone: ~$400–$410
⚠️ Key Takeaway: As long as LTC maintains closes above the current support floor, the risk-to-reward for a multi-stage recovery remains favorable. A decisive breakdown below $35, however, would invalidate the current base.
What’s your strategy? Are you accumulating and HODLing $LTC near these multi-year support levels or waiting for higher confirmation? 💬
#Litecoin #TechnicalAnalysis #ChartAnalysis #SupportAndResistance
(Note: Always remember that technical analysis is based on historical price action and chart patterns; this is not financial advice. Perform your own research before trading.)

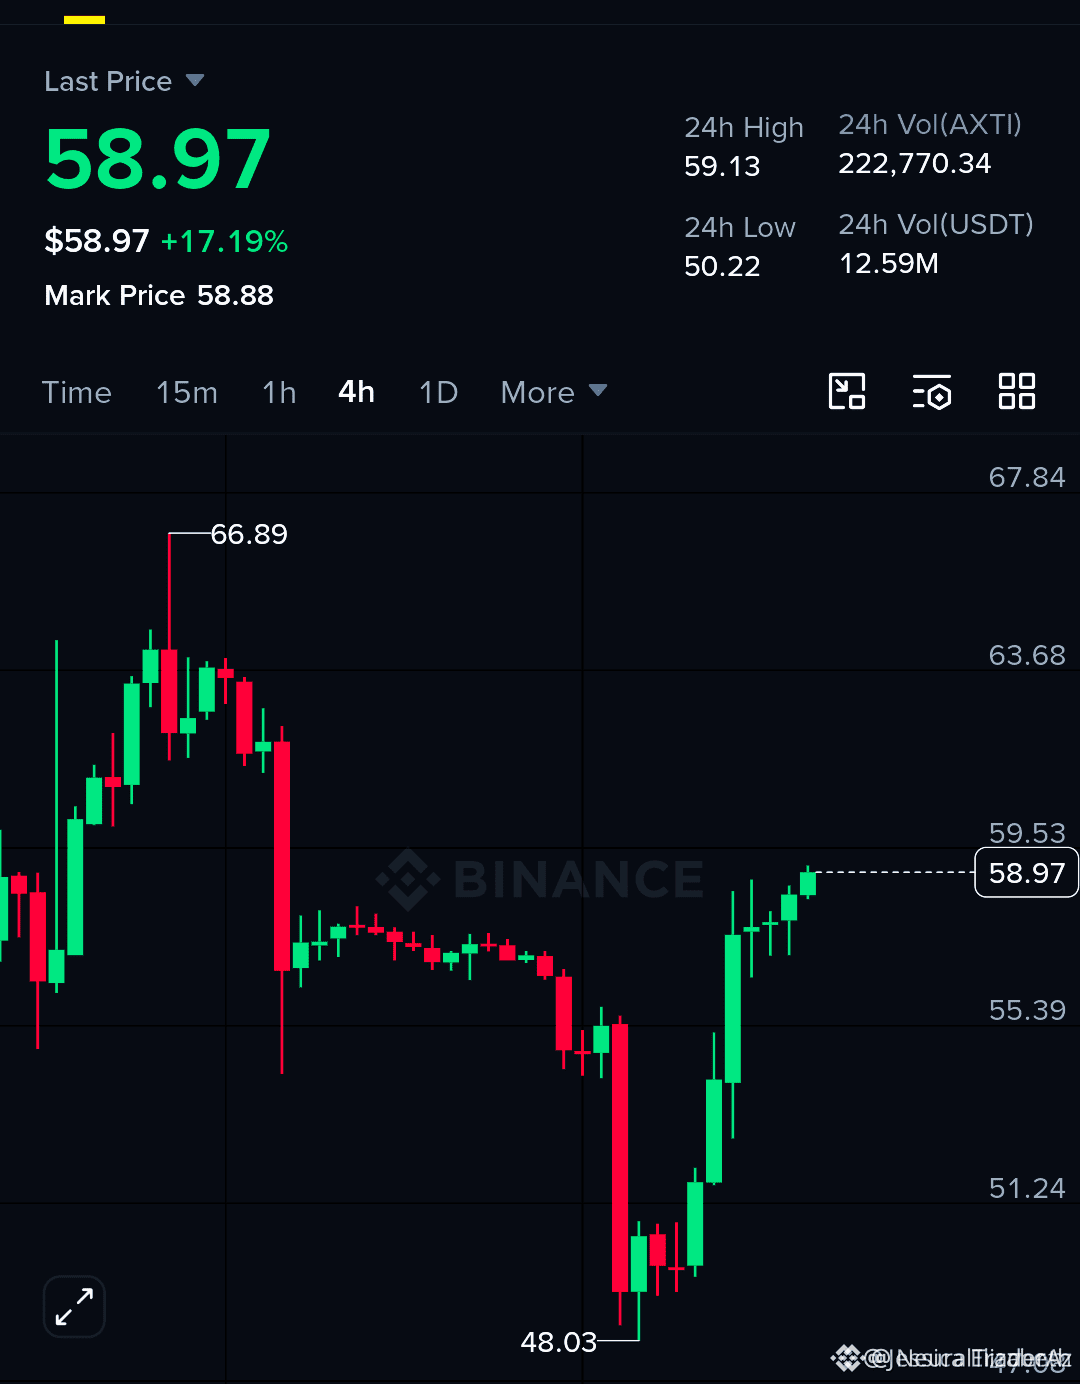
$AXTI LONG WITH SL 50.77 AND TARGETS UP TO 65.23 🚀
Target: 60.12, 62.80, 65.23 🚀
Stop Loss: 50.77 ⚠️
This $AXTI long signal is active with a clear stop at 50.77 and three profit targets up to 65.23. The stop defines your risk precisely — no guesswork. Multiple targets allow for scaling out — a disciplined entry with clear parameters.
The structure is clean: either this support holds or it doesn't. Speed matters when the invalidation is this tight.
Which target are you taking first?
Not financial advice. Always manage your risk.
#AXTI #LongSetup #SupportAndResistance #Crypto
🎯
Target: 60.12, 62.80, 65.23 🚀
Stop Loss: 50.77 ⚠️
This $AXTI long signal is active with a clear stop at 50.77 and three profit targets up to 65.23. The stop defines your risk precisely — no guesswork. Multiple targets allow for scaling out — a disciplined entry with clear parameters.
The structure is clean: either this support holds or it doesn't. Speed matters when the invalidation is this tight.
Which target are you taking first?
Not financial advice. Always manage your risk.
#AXTI #LongSetup #SupportAndResistance #Crypto
🎯

$ADA HAS LOST 94% FROM ITS PEAK – IS THIS A BARGAIN OR A TRAP 🔥
Cardano is up 0.91% to $0.1645, moving with Bitcoin after softer inflation data. But there's zero project-specific news driving this bounce – no upgrades, no partnerships. That makes the move feel more like a market-wide tailwind than real conviction.
The weekly chart shows a completed five-wave decline, with strong resistance stacked at $0.23, $0.35, $0.45, and $0.52. Support sits at $0.09 and deeper at $0.05. At these levels, the debate is fierce: undervalued opportunity or a relic of the last cycle?
Do you see ADA building a base here or do you think the market has already moved on?
Not financial advice. Always manage your risk.
#ADA #Cardano #CryptoAnalysis #SupportAndResistance
⚡
Cardano is up 0.91% to $0.1645, moving with Bitcoin after softer inflation data. But there's zero project-specific news driving this bounce – no upgrades, no partnerships. That makes the move feel more like a market-wide tailwind than real conviction.
The weekly chart shows a completed five-wave decline, with strong resistance stacked at $0.23, $0.35, $0.45, and $0.52. Support sits at $0.09 and deeper at $0.05. At these levels, the debate is fierce: undervalued opportunity or a relic of the last cycle?
Do you see ADA building a base here or do you think the market has already moved on?
Not financial advice. Always manage your risk.
#ADA #Cardano #CryptoAnalysis #SupportAndResistance
⚡

$BTC
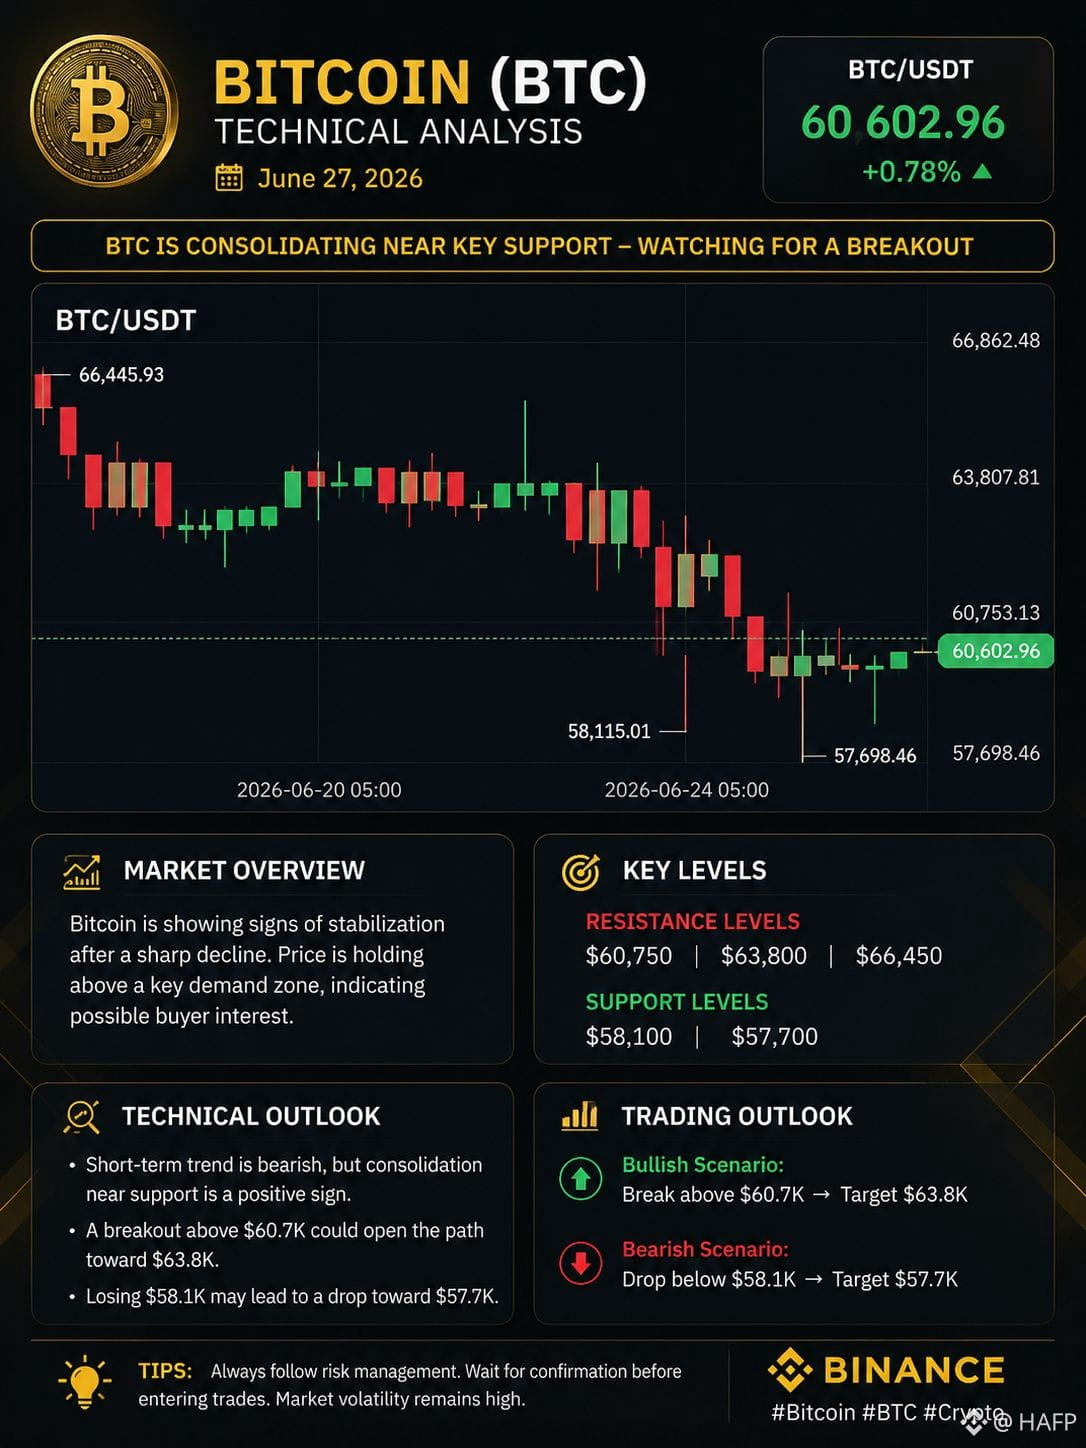
Bitcoin ($BTC ) Technical Analysis | June 27, 2026
BTC is attempting to stabilize after a sharp correction, with buyers defending the $58K–$60K demand zone.
🔍 Technical Overview:
Current Price: ~$60,603
Trend: Short-term bearish, but signs of consolidation are emerging.
Support Zones: $58,100 (major) and $57,700 (strong demand).
Resistance Levels: $60,750, $63,800, and $66,450.
📈 Market Structure: After several consecutive bearish candles, Bitcoin formed small bullish candles near key support, suggesting selling pressure is weakening. However, BTC still needs a strong daily close above $60.7K to confirm a recovery.
💡 Trading Outlook:
A breakout above $60.7K could trigger a move toward $63.8K.
If BTC loses $58.1K, the next downside target could be around $57.7K.
Traders should wait for confirmation before entering aggressive long positions.
#Bitcoin #BTC #Binance #supportandresistance #Dogecoin
Bitcoin ($BTC ) Technical Analysis | June 27, 2026
BTC is attempting to stabilize after a sharp correction, with buyers defending the $58K–$60K demand zone.
🔍 Technical Overview:
Current Price: ~$60,603
Trend: Short-term bearish, but signs of consolidation are emerging.
Support Zones: $58,100 (major) and $57,700 (strong demand).
Resistance Levels: $60,750, $63,800, and $66,450.
📈 Market Structure: After several consecutive bearish candles, Bitcoin formed small bullish candles near key support, suggesting selling pressure is weakening. However, BTC still needs a strong daily close above $60.7K to confirm a recovery.
💡 Trading Outlook:
A breakout above $60.7K could trigger a move toward $63.8K.
If BTC loses $58.1K, the next downside target could be around $57.7K.
Traders should wait for confirmation before entering aggressive long positions.
#Bitcoin #BTC #Binance #supportandresistance #Dogecoin


$SPK has 3.5% bounced yesterday and honestly it felt like a classic oversold recovery. RSI had bottomed out, volume perked up a bit and price nudged above $0.0175 for a moment. A clean little technical setup if you ignore what is actually lurking underneath.
That 9% token unlock changes the whole equation though.
Bounces born from oversold conditions have a habit of crumbling when supply suddenly floods the market. A release that size can turn a tidy support zone into a distant memory within a few hourly candles.
My rough guess had $0.0169 as near term support and $0.0175 as initial resistance but those are just lines drawn on a chart that has not yet absorbed the full brunt of the unlock. Real levels demand real time data, orderbook depth and volume profiles that shift minute by minute.
#spk #CryptoInsights #TokenUnlock #supportandresistance #BinanceSquare
That 9% token unlock changes the whole equation though.
Bounces born from oversold conditions have a habit of crumbling when supply suddenly floods the market. A release that size can turn a tidy support zone into a distant memory within a few hourly candles.
My rough guess had $0.0169 as near term support and $0.0175 as initial resistance but those are just lines drawn on a chart that has not yet absorbed the full brunt of the unlock. Real levels demand real time data, orderbook depth and volume profiles that shift minute by minute.
#spk #CryptoInsights #TokenUnlock #supportandresistance #BinanceSquare

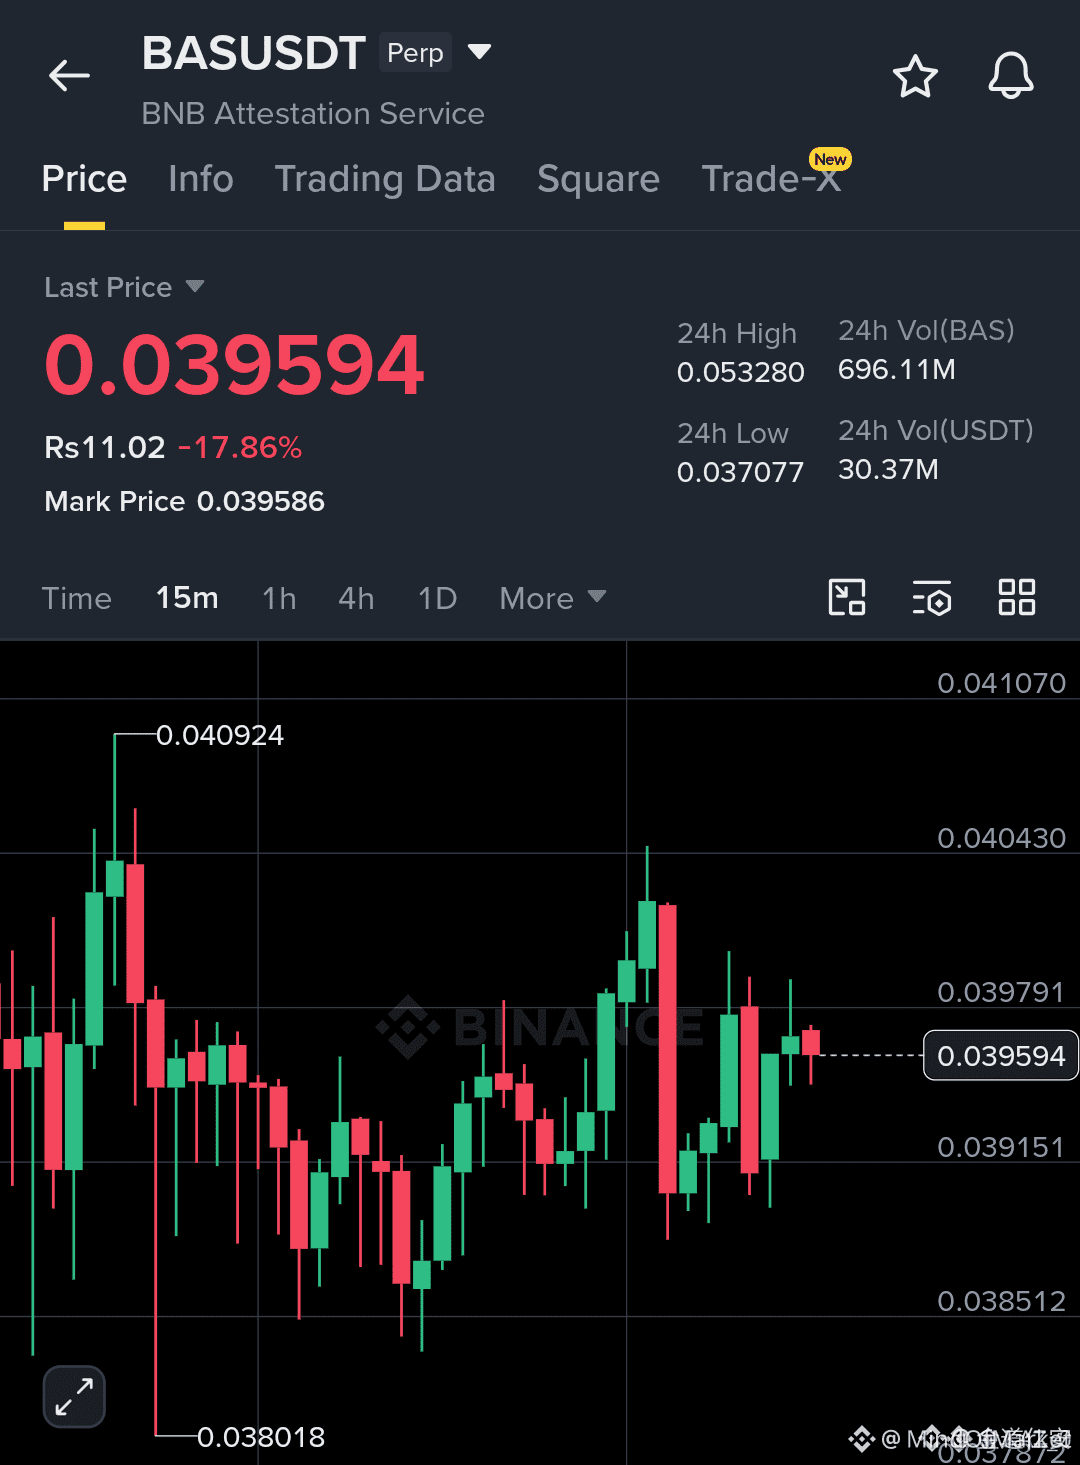
$BAS IS HOLDING ABOVE KEY SUPPORT AFTER A SHARP DECLINE 🔥
Entry: 0.0395 🔥
Target: 0.0404 🚀
Stop Loss: 0.0388 ⚠️
This support zone has attracted bids after the sell-off, but volume remains below average — the lack of conviction keeps the setup in limbo. A clean break above 0.0404 with volume would confirm buyer intent, while a loss of 0.0388 likely triggers a liquidity grab lower.
The risk-reward on the first target is roughly 1:2, but the key is waiting for the trigger. Are you watching this level or already positioned?
Not financial advice. Always manage your risk.
#BAS #SupportAndResistance #ReversalSetup #Crypto
⚡
Entry: 0.0395 🔥
Target: 0.0404 🚀
Stop Loss: 0.0388 ⚠️
This support zone has attracted bids after the sell-off, but volume remains below average — the lack of conviction keeps the setup in limbo. A clean break above 0.0404 with volume would confirm buyer intent, while a loss of 0.0388 likely triggers a liquidity grab lower.
The risk-reward on the first target is roughly 1:2, but the key is waiting for the trigger. Are you watching this level or already positioned?
Not financial advice. Always manage your risk.
#BAS #SupportAndResistance #ReversalSetup #Crypto
⚡

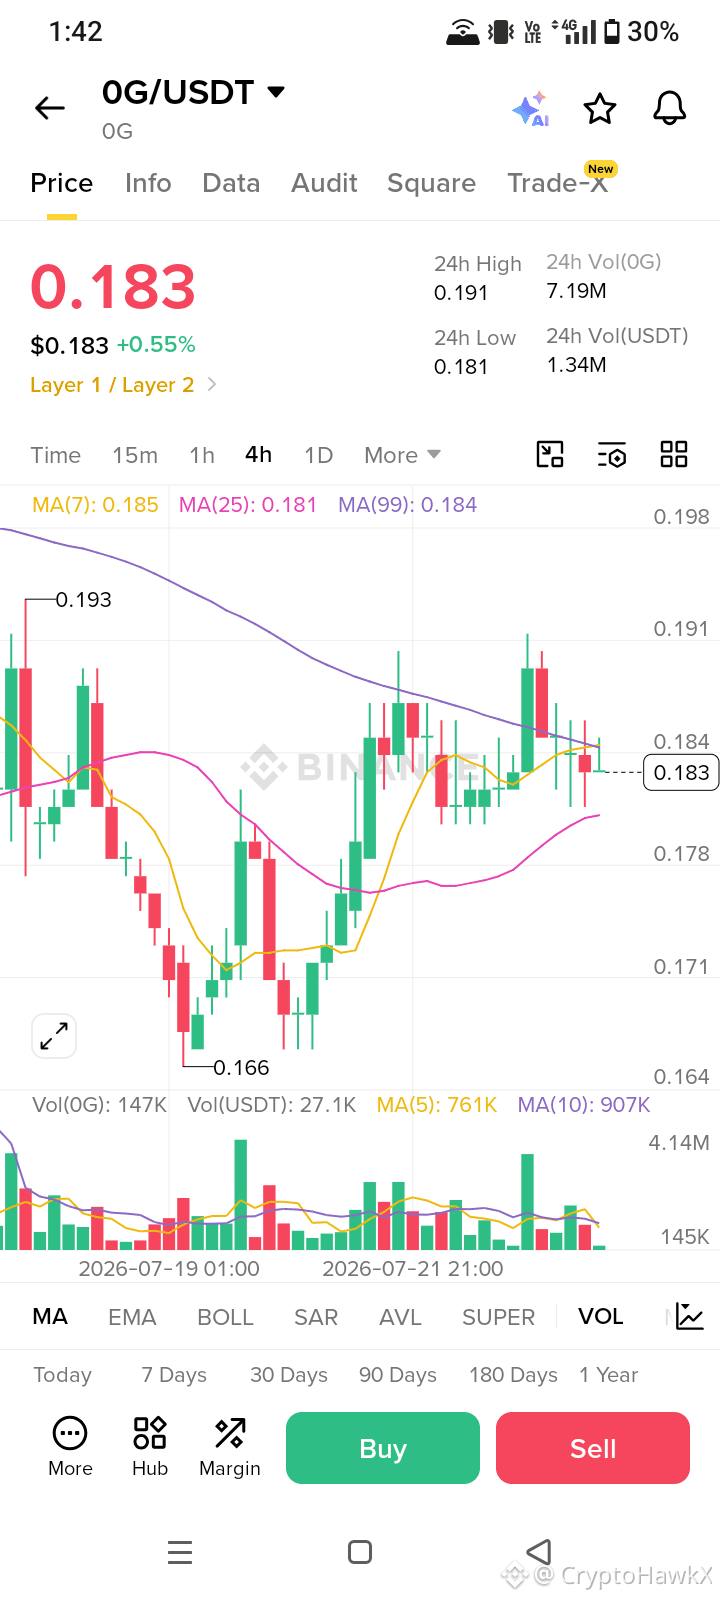
📊 $OG OG/USDT Market Update (4H)
OG/USDT is trading around $0.183, holding within a tight range after recovering from recent lows. Price is hovering near the key moving averages, showing that buyers and sellers are currently in balance. A decisive break above the $0.184–0.191 resistance zone could trigger fresh bullish momentum, while losing the $0.181 support may lead to another pullback.
For now, traders should wait for a confirmed breakout before expecting a stronger directional move. Keep an eye on volume, as it will likely determine the next trend.
Market Sentiment: 🟡 Consolidation
#OG #OGUSDT #Crypto #CryptoTrial rading #Altcoins #supportandresistance ce #Binance nalysis #tradenell ding #SKHynixRisesOver5%Premarket sistance #PriceAction #CryptoMarket #Bullish #Bearish #Consolidation
OG/USDT is trading around $0.183, holding within a tight range after recovering from recent lows. Price is hovering near the key moving averages, showing that buyers and sellers are currently in balance. A decisive break above the $0.184–0.191 resistance zone could trigger fresh bullish momentum, while losing the $0.181 support may lead to another pullback.
For now, traders should wait for a confirmed breakout before expecting a stronger directional move. Keep an eye on volume, as it will likely determine the next trend.
Market Sentiment: 🟡 Consolidation
#OG #OGUSDT #Crypto #CryptoTrial rading #Altcoins #supportandresistance ce #Binance nalysis #tradenell ding #SKHynixRisesOver5%Premarket sistance #PriceAction #CryptoMarket #Bullish #Bearish #Consolidation
Log in to explore more content