
#follow4more
follow4more
2.7M views
8,682 Discussing
Hot
Latest


·
--
Bearish
100

·
--
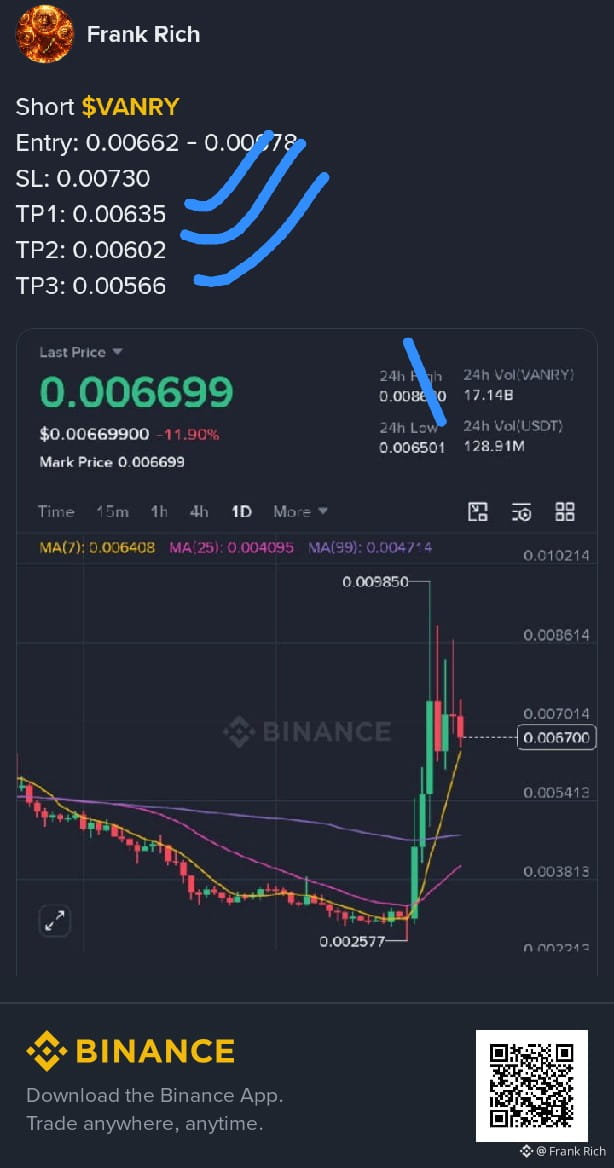
Congratulations to my follows all target 🎯 hitted 🔥💯 #VANRYUSDT $VANRY #Follow4more
Congratulations to my follows all target 🎯 hitted 🔥💯 #VANRYUSDT $VANRY #Follow4more
272

Bitcoin Active Supply in Profit Drops Below 45%#bitcoinactivesupplyinprofitdropsbelow45%
Bitcoin is showing a worrying on-chain signal: less than 45% of its active supply is currently in profit. This means most actively circulating Bitcoin is now held at a loss.
According to data reported on November 14, 2026, analyst Darkfost identified this shift after excluding Bitcoin that had not moved for more than 10 years.
What does this mean?
More holders are underwater: Most active Bitcoin holders have a market value below their last on-chain movement price.Selling pressure may increase: Investors facing losses may sell if prices continue falling.Potential market bottom: Historically, readings below 40% have often coincided with Bitcoin correction lows.Possible accumulation opportunity: Long-term investors may watch these levels for potential buying opportunities.
Important levels to watch
My Bitcoin outlook
Short term: Bearish pressure remains possible.Medium term: A recovery could develop if selling pressure fades.Long term: A reading below 40% could become an interesting accumulation signal, but confirmation is important.
Bottom line: This is a sign of significant market stress, but it does not automatically mean Bitcoin has reached its bottom. Watch the 40% level and combine it with exchange flows, trading volume and price action.
$BTC $ETH #Follow4more #TipsForBeginners
Bitcoin Active Supply in Profit Drops Below 45%
#bitcoinactivesupplyinprofitdropsbelow45%
Bitcoin is showing a worrying on-chain signal: less than 45% of its active supply is currently in profit. This means most actively circulating Bitcoin is now held at a loss.
According to data reported on November 14, 2026, analyst Darkfost identified this shift after excluding Bitcoin that had not moved for more than 10 years.
What does this mean?
More holders are underwater: Most active Bitcoin holders have a market value below their last on-chain movement price.Selling pressure may increase: Investors facing losses may sell if prices continue falling.Potential market bottom: Historically, readings below 40% have often coincided with Bitcoin correction lows.Possible accumulation opportunity: Long-term investors may watch these levels for potential buying opportunities.
Important levels to watch
My Bitcoin outlook
Short term: Bearish pressure remains possible.Medium term: A recovery could develop if selling pressure fades.Long term: A reading below 40% could become an interesting accumulation signal, but confirmation is important.
Bottom line: This is a sign of significant market stress, but it does not automatically mean Bitcoin has reached its bottom. Watch the 40% level and combine it with exchange flows, trading volume and price action.
$BTC $ETH #Follow4more #TipsForBeginners
Bitcoin is showing a worrying on-chain signal: less than 45% of its active supply is currently in profit. This means most actively circulating Bitcoin is now held at a loss.
According to data reported on November 14, 2026, analyst Darkfost identified this shift after excluding Bitcoin that had not moved for more than 10 years.
What does this mean?
More holders are underwater: Most active Bitcoin holders have a market value below their last on-chain movement price.Selling pressure may increase: Investors facing losses may sell if prices continue falling.Potential market bottom: Historically, readings below 40% have often coincided with Bitcoin correction lows.Possible accumulation opportunity: Long-term investors may watch these levels for potential buying opportunities.
Important levels to watch
My Bitcoin outlook
Short term: Bearish pressure remains possible.Medium term: A recovery could develop if selling pressure fades.Long term: A reading below 40% could become an interesting accumulation signal, but confirmation is important.
Bottom line: This is a sign of significant market stress, but it does not automatically mean Bitcoin has reached its bottom. Watch the 40% level and combine it with exchange flows, trading volume and price action.
$BTC $ETH #Follow4more #TipsForBeginners
1
651

·
--
Bullish
$BTC
{future}(BTCUSDT)
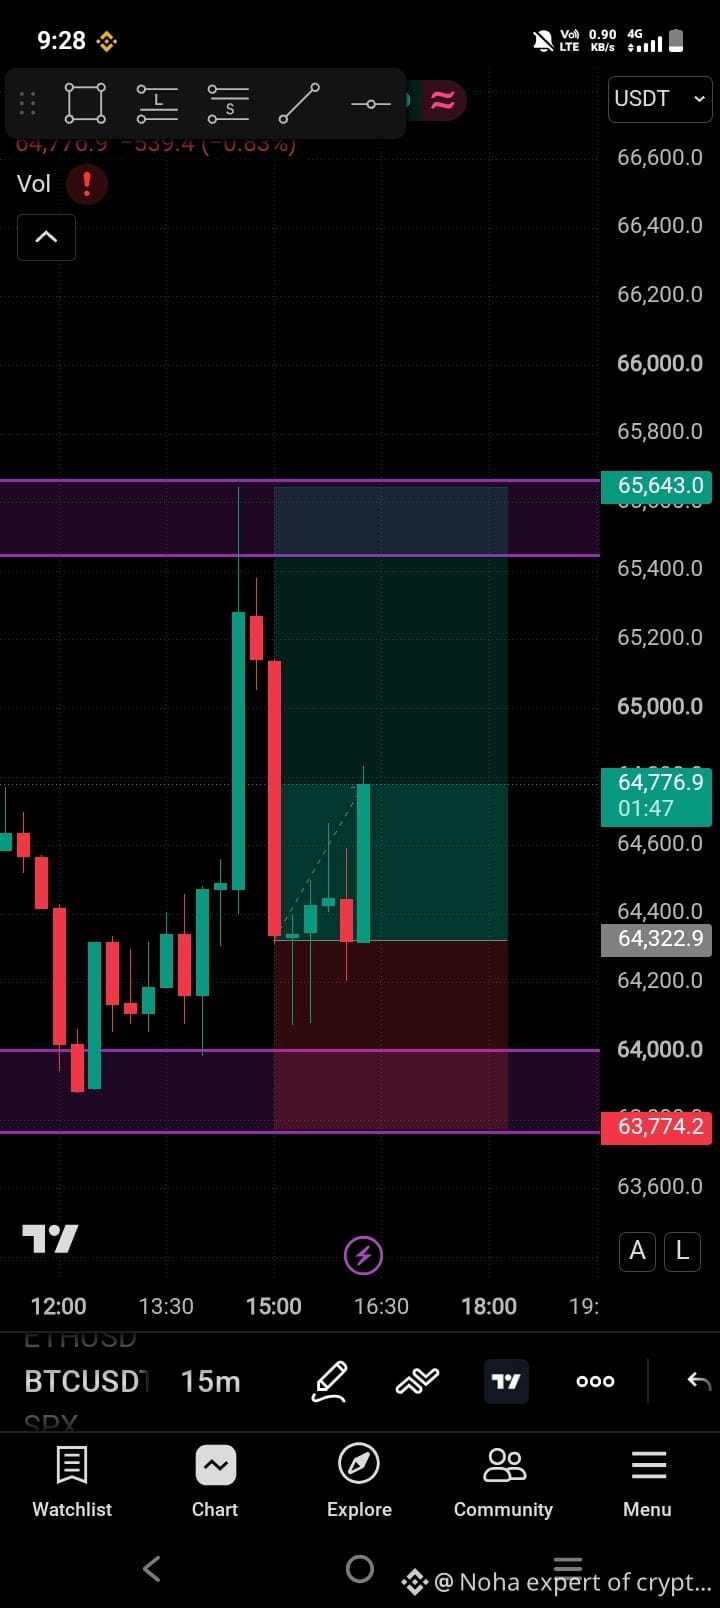
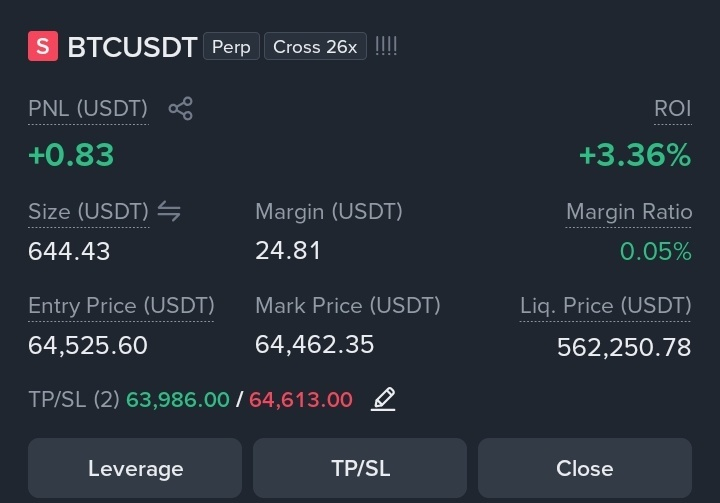
my trades are running too fast accurately 🩶✅😌 alhamdulillah
#TradingTales #signals #Write2Earn
#Follow4more #nohaexpertofcrypto
$BTC
my trades are running too fast accurately 🩶✅😌 alhamdulillah
#TradingTales #signals #Write2Earn
#Follow4more #nohaexpertofcrypto
my trades are running too fast accurately 🩶✅😌 alhamdulillah
#TradingTales #signals #Write2Earn
#Follow4more #nohaexpertofcrypto
65
·
--
Bearish
Trudie Hoefle z5BI:
狗托幸好没听你的
1
367
·
--
Bearish
$BTC
{future}(BTCUSDT)
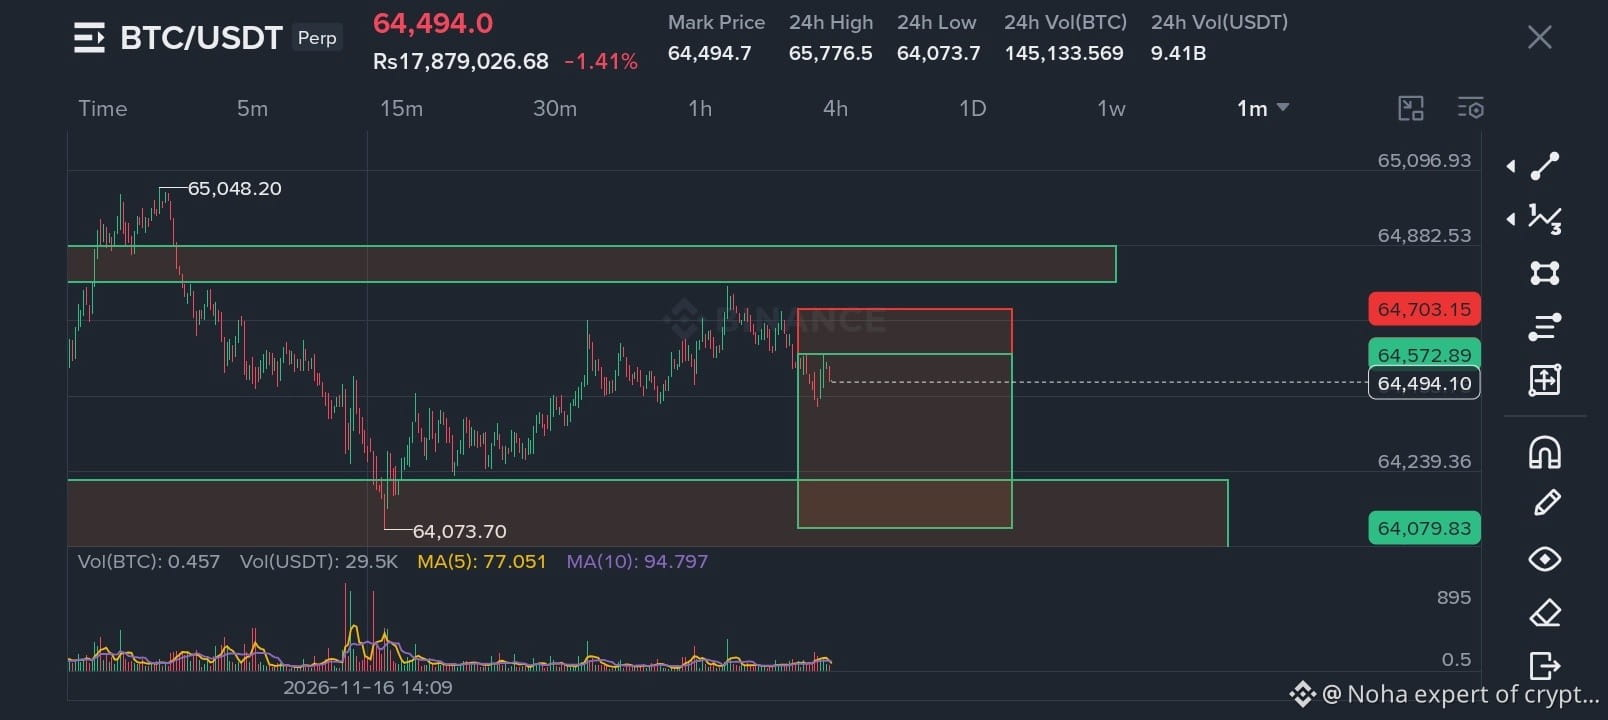
/USDT — SELL SIGNAL 🔴
* Entry: 64,550–64,575
* Stop Loss (SL): 64,720
* Take Profit 1 (TP1): 64,350
* Take Profit 2 (TP2): 64,220
* Take Profit 3 (TP3): 64,080
Confirmation: Wait for bearish rejection on the 5-minute chart before entering.
Risk Management: Do not enter without confirmation.
#TradingTales #signals #Write2Earn
#Follow4more #nohaexpertofcrypto
$BTC
/USDT — SELL SIGNAL 🔴
* Entry: 64,550–64,575
* Stop Loss (SL): 64,720
* Take Profit 1 (TP1): 64,350
* Take Profit 2 (TP2): 64,220
* Take Profit 3 (TP3): 64,080
Confirmation: Wait for bearish rejection on the 5-minute chart before entering.
Risk Management: Do not enter without confirmation.
#TradingTales #signals #Write2Earn
#Follow4more #nohaexpertofcrypto
/USDT — SELL SIGNAL 🔴
* Entry: 64,550–64,575
* Stop Loss (SL): 64,720
* Take Profit 1 (TP1): 64,350
* Take Profit 2 (TP2): 64,220
* Take Profit 3 (TP3): 64,080
Confirmation: Wait for bearish rejection on the 5-minute chart before entering.
Risk Management: Do not enter without confirmation.
#TradingTales #signals #Write2Earn
#Follow4more #nohaexpertofcrypto
1
117

·
--
Bullish
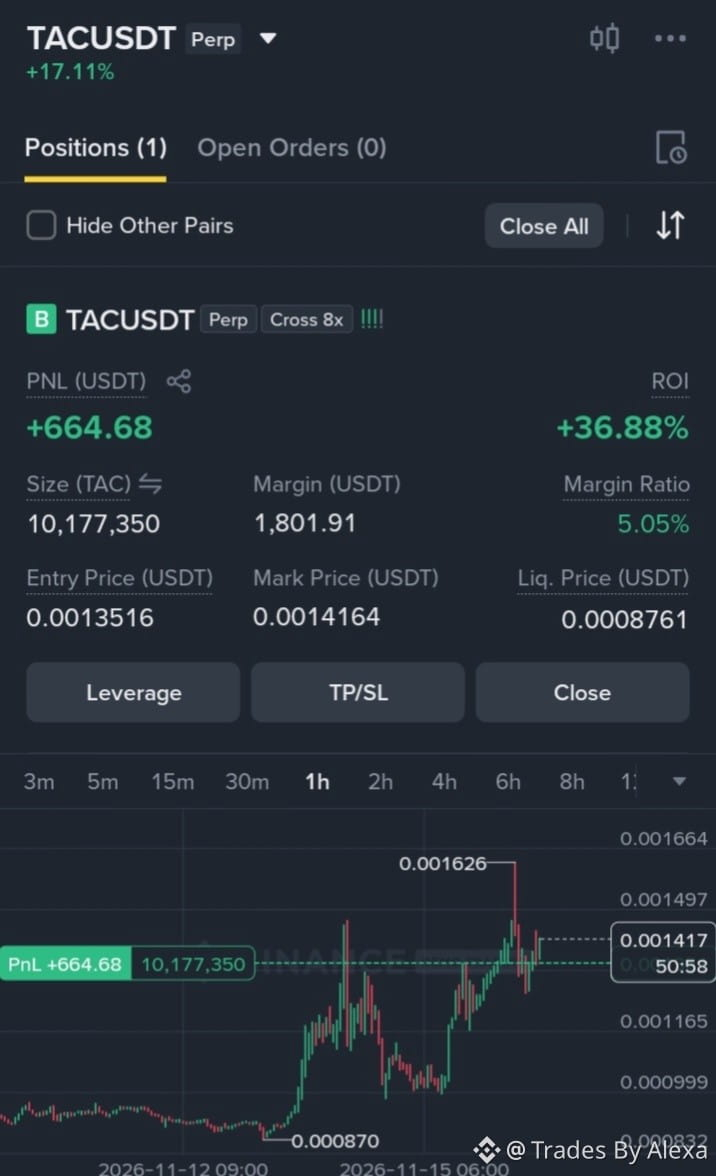
$TAC Congratulations 🎉
In Just one Hour (660$) BOOKED🚀
Follow Us for more updates
#Follow4more #Binance #fomc #TradingSignals #AnthropicIPOTestsInvestorAppetiteForAI
$TAC Congratulations 🎉
In Just one Hour (660$) BOOKED🚀
Follow Us for more updates
#Follow4more #Binance #fomc #TradingSignals #AnthropicIPOTestsInvestorAppetiteForAI
In Just one Hour (660$) BOOKED🚀
Follow Us for more updates
#Follow4more #Binance #fomc #TradingSignals #AnthropicIPOTestsInvestorAppetiteForAI
1
61
·
--
Bullish
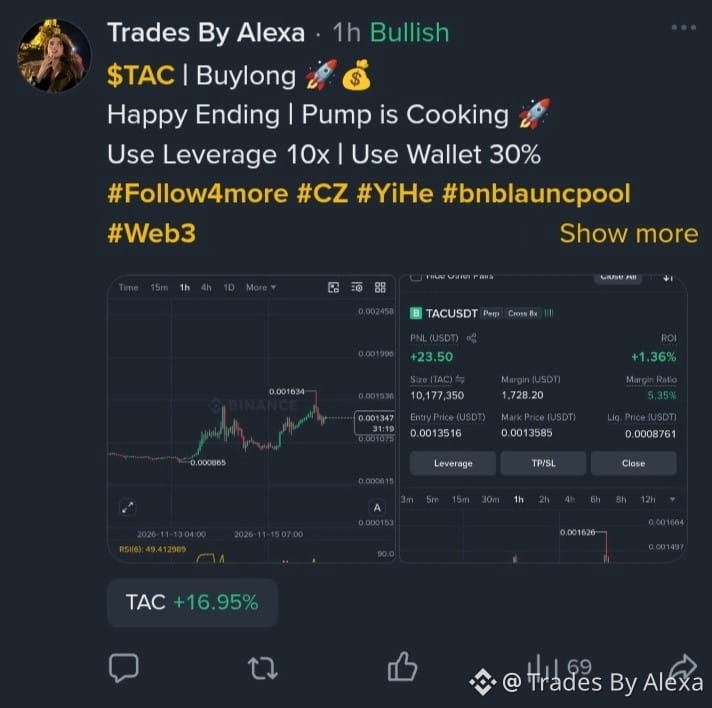
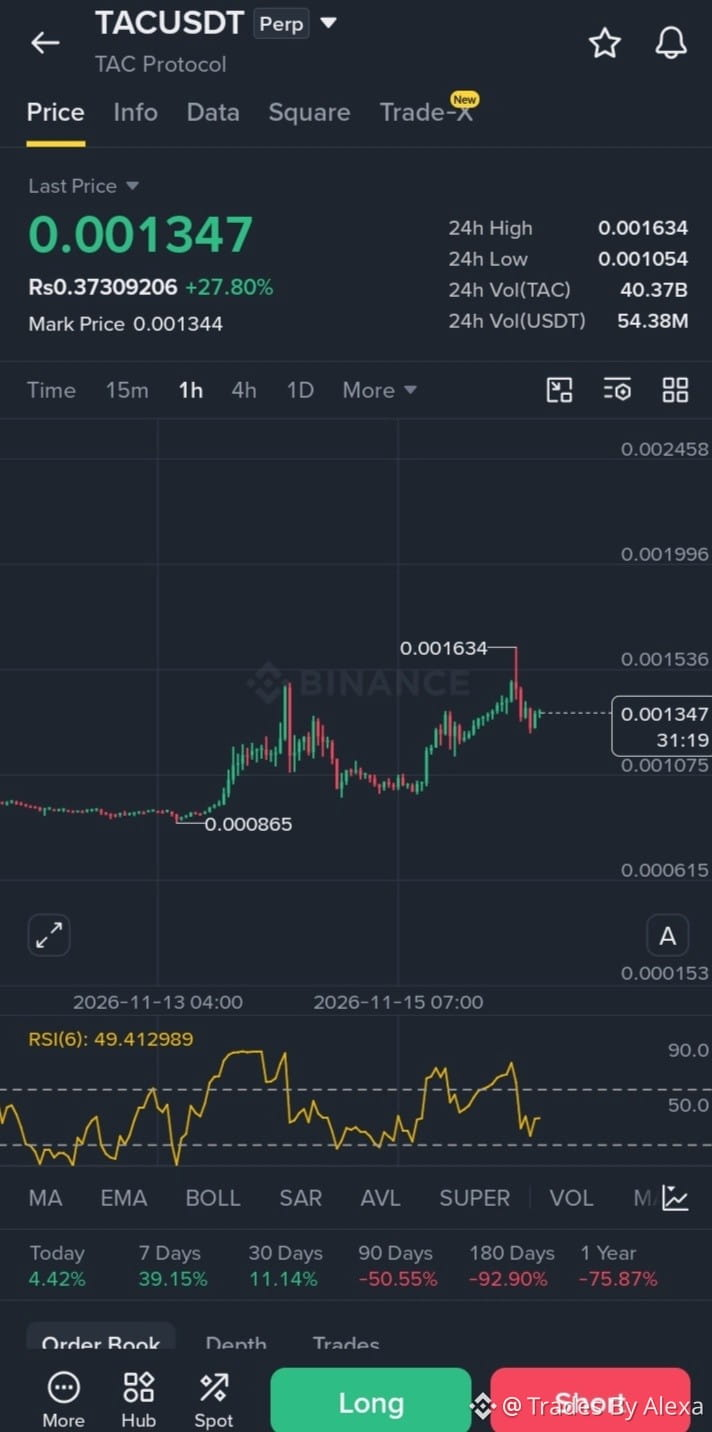
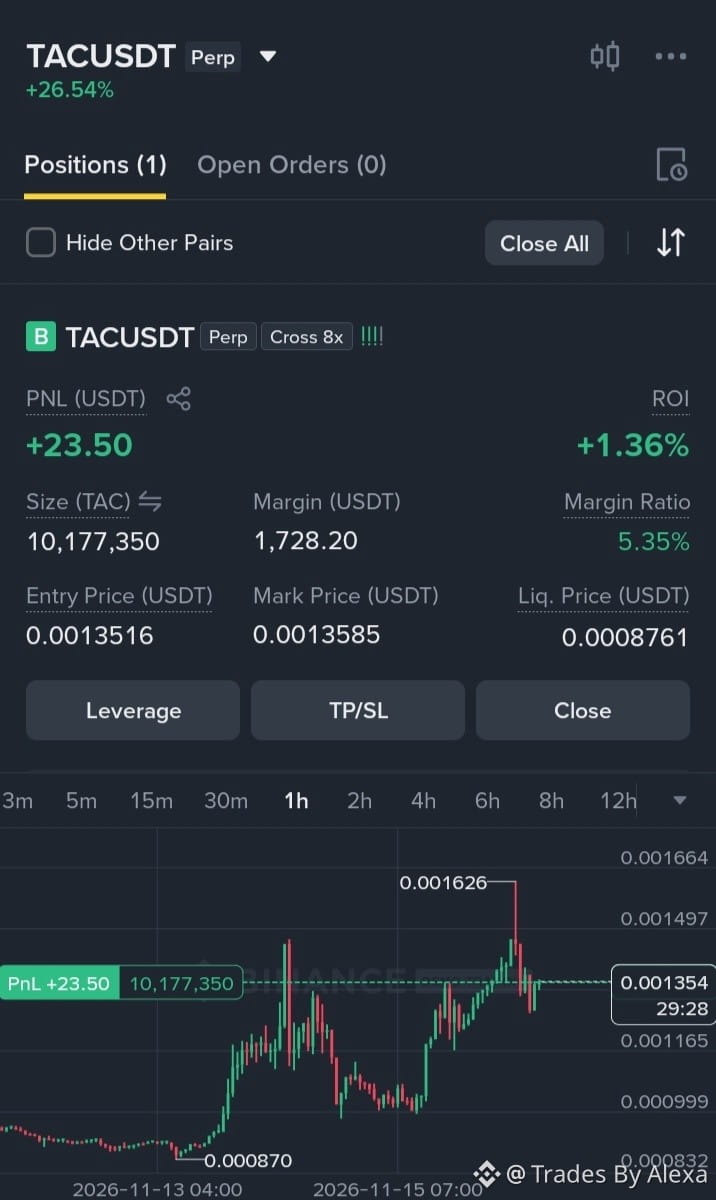
$TAC | Buylong 🚀💰
Happy Ending | Pump is Cooking 🚀
Use Leverage 10x | Use Wallet 30%
#Follow4more #CZ #YiHe #bnblauncpool #Web3
{future}(TACUSDT)
$TAC | Buylong 🚀💰
Happy Ending | Pump is Cooking 🚀
Use Leverage 10x | Use Wallet 30%
#Follow4more #CZ #YiHe #bnblauncpool #Web3
Happy Ending | Pump is Cooking 🚀
Use Leverage 10x | Use Wallet 30%
#Follow4more #CZ #YiHe #bnblauncpool #Web3
1
76
Market Impact Scenarios around NVIDIA EarningsMarket Impact Scenarios around NVIDIA Earnings
1. Positive Beat & Aggressive Guidance (Bullish Rally)
AI Infrastructure Momentum: If Nvidia beats revenue expectations and provides strong Blackwell chip delivery updates, Semiconductors (AMD, Broadcom, TSMC) and Server/Hardware (Super Micro, Dell) will likely see an immediate rally.
Cloud & Hyperscalers Support: Big Tech stocks like Microsoft, Google (Alphabet), Amazon, and Meta will gain relief, confirming that their massive AI Capital Expenditure (Data Center spend) is translating into real revenue growth.
2. Moderate Results or Guidance Shortfall (Sector-Wide Pullback)
High Expectations Pressure: Because market expectations are set extremely high, even a slight weakness in forward revenue guidance could trigger profit-taking across the entire AI ecosystem.
Semiconductors & Hardware Sell-Off: Supply chain partners and chipmakers could experience a sharp short-term pullback ranging from 3% to 8%.
3. High Options Volatility & Index Ripple Effect
Options Implied Move: Options markets typically price in a ±7% to ±10% price swing on earnings day, representing over $200 billion in potential market cap fluctuation.
Nasdaq & S&P 500 Spillover: Due to Nvidia’s heavy weightage in major indexes, its earnings reaction will single-handedly drive momentum for the Nasdaq 100 and S&P 500.
Key Short-Term Signals to Watch
$BTC $NVDA #Follow4more #TipsForBeginners
Market Impact Scenarios around NVIDIA Earnings
Market Impact Scenarios around NVIDIA Earnings
1. Positive Beat & Aggressive Guidance (Bullish Rally)
AI Infrastructure Momentum: If Nvidia beats revenue expectations and provides strong Blackwell chip delivery updates, Semiconductors (AMD, Broadcom, TSMC) and Server/Hardware (Super Micro, Dell) will likely see an immediate rally.
Cloud & Hyperscalers Support: Big Tech stocks like Microsoft, Google (Alphabet), Amazon, and Meta will gain relief, confirming that their massive AI Capital Expenditure (Data Center spend) is translating into real revenue growth.
2. Moderate Results or Guidance Shortfall (Sector-Wide Pullback)
High Expectations Pressure: Because market expectations are set extremely high, even a slight weakness in forward revenue guidance could trigger profit-taking across the entire AI ecosystem.
Semiconductors & Hardware Sell-Off: Supply chain partners and chipmakers could experience a sharp short-term pullback ranging from 3% to 8%.
3. High Options Volatility & Index Ripple Effect
Options Implied Move: Options markets typically price in a ±7% to ±10% price swing on earnings day, representing over $200 billion in potential market cap fluctuation.
Nasdaq & S&P 500 Spillover: Due to Nvidia’s heavy weightage in major indexes, its earnings reaction will single-handedly drive momentum for the Nasdaq 100 and S&P 500.
Key Short-Term Signals to Watch
$BTC $NVDA #Follow4more #TipsForBeginners
1. Positive Beat & Aggressive Guidance (Bullish Rally)
AI Infrastructure Momentum: If Nvidia beats revenue expectations and provides strong Blackwell chip delivery updates, Semiconductors (AMD, Broadcom, TSMC) and Server/Hardware (Super Micro, Dell) will likely see an immediate rally.
Cloud & Hyperscalers Support: Big Tech stocks like Microsoft, Google (Alphabet), Amazon, and Meta will gain relief, confirming that their massive AI Capital Expenditure (Data Center spend) is translating into real revenue growth.
2. Moderate Results or Guidance Shortfall (Sector-Wide Pullback)
High Expectations Pressure: Because market expectations are set extremely high, even a slight weakness in forward revenue guidance could trigger profit-taking across the entire AI ecosystem.
Semiconductors & Hardware Sell-Off: Supply chain partners and chipmakers could experience a sharp short-term pullback ranging from 3% to 8%.
3. High Options Volatility & Index Ripple Effect
Options Implied Move: Options markets typically price in a ±7% to ±10% price swing on earnings day, representing over $200 billion in potential market cap fluctuation.
Nasdaq & S&P 500 Spillover: Due to Nvidia’s heavy weightage in major indexes, its earnings reaction will single-handedly drive momentum for the Nasdaq 100 and S&P 500.
Key Short-Term Signals to Watch
$BTC $NVDA #Follow4more #TipsForBeginners
142
A Packed Week of Earnings and Data Tests MarketsThis means global financial markets are entering a busy week in which major company earnings and important US economic reports could determine the direction of stocks, Bitcoin and other cryptocurrencies.
1. Major events to watch
Other major earnings include Disney, Home Depot, Target, Alibaba and Walmart.
2. Why Nvidia earnings matter
Nvidia (NVDA)
Its earnings will help investors judge AI demand, data-center growth and future semiconductor spending.
3. Impact on Bitcoin and crypto
Bullish scenario: Strong earnings and softer economic data could improve investor confidence and support BTC and ETH.Bearish scenario: Higher inflation, hawkish Fed comments or rising bond yields could pressure Bitcoin and risk assets.High volatility: Investors may wait for Nvidia earnings and Fed minutes before taking large positions.
4. What should crypto investors watch?
My market view: This is an important week for both traditional markets and crypto. Nvidia earnings and the Federal Reserve minutes are two major catalysts. Avoid making trades based only on expectations; wait for actual results and market reaction.
$BTC $NVDAB #Follow4more #TipsForBeginners
A Packed Week of Earnings and Data Tests Markets
This means global financial markets are entering a busy week in which major company earnings and important US economic reports could determine the direction of stocks, Bitcoin and other cryptocurrencies.
1. Major events to watch
Other major earnings include Disney, Home Depot, Target, Alibaba and Walmart.
2. Why Nvidia earnings matter
Nvidia (NVDA)
Its earnings will help investors judge AI demand, data-center growth and future semiconductor spending.
3. Impact on Bitcoin and crypto
Bullish scenario: Strong earnings and softer economic data could improve investor confidence and support BTC and ETH.Bearish scenario: Higher inflation, hawkish Fed comments or rising bond yields could pressure Bitcoin and risk assets.High volatility: Investors may wait for Nvidia earnings and Fed minutes before taking large positions.
4. What should crypto investors watch?
My market view: This is an important week for both traditional markets and crypto. Nvidia earnings and the Federal Reserve minutes are two major catalysts. Avoid making trades based only on expectations; wait for actual results and market reaction.
$BTC $NVDAB #Follow4more #TipsForBeginners
1. Major events to watch
Other major earnings include Disney, Home Depot, Target, Alibaba and Walmart.
2. Why Nvidia earnings matter
Nvidia (NVDA)
Its earnings will help investors judge AI demand, data-center growth and future semiconductor spending.
3. Impact on Bitcoin and crypto
Bullish scenario: Strong earnings and softer economic data could improve investor confidence and support BTC and ETH.Bearish scenario: Higher inflation, hawkish Fed comments or rising bond yields could pressure Bitcoin and risk assets.High volatility: Investors may wait for Nvidia earnings and Fed minutes before taking large positions.
4. What should crypto investors watch?
My market view: This is an important week for both traditional markets and crypto. Nvidia earnings and the Federal Reserve minutes are two major catalysts. Avoid making trades based only on expectations; wait for actual results and market reaction.
$BTC $NVDAB #Follow4more #TipsForBeginners
62
# kavasaysabnormalactivitylimitedtokavalend#kavasaysabnormalactivitylimitedtokavalend
Kava has confirmed unusual on-chain activity involving its lending protocol, Kava Lend, while stating that the incident was isolated to that application and did not involve unlimited token creation.
The incident occurred on November 14, 2026. Here's what happened.
What happened?
Protocol exploit: An attacker exploited a weakness in Kava Lend's nearly inactive BUSD lending market.Tokens drained: Approximately 55.2 million KAVA, worth around $3.76 million before the attack, were borrowed from the lending pool.Cross-chain transfers: Around 49.2 million KAVA were transferred to BNB Chain through Layer Zero.Tokens sold: The attacker sold the transferred tokens for approximately $2.09 million.Market crash: KAVA's price dropped roughly 40% or more during the incident.
Market impact
What does this mean for investors?
Short term: Bearish sentiment and possible additional selling pressure.Medium term: Recovery depends on security fixes and restoring investor confidence.Long term: Kava's broader blockchain may remain operational, but confidence in its DeFi lending ecosystem could suffer.
My verdict
This is a serious security incident, not simply a normal market correction. Kava says the issue is contained within Kava Lend, but investors should wait for the official post-mortem and recovery plan before treating KAVA as a buying opportunity.
$KAVA $NVDAB #Follow4more #TipsForBeginners
# kavasaysabnormalactivitylimitedtokavalend
#kavasaysabnormalactivitylimitedtokavalend
Kava has confirmed unusual on-chain activity involving its lending protocol, Kava Lend, while stating that the incident was isolated to that application and did not involve unlimited token creation.
The incident occurred on November 14, 2026. Here's what happened.
What happened?
Protocol exploit: An attacker exploited a weakness in Kava Lend's nearly inactive BUSD lending market.Tokens drained: Approximately 55.2 million KAVA, worth around $3.76 million before the attack, were borrowed from the lending pool.Cross-chain transfers: Around 49.2 million KAVA were transferred to BNB Chain through Layer Zero.Tokens sold: The attacker sold the transferred tokens for approximately $2.09 million.Market crash: KAVA's price dropped roughly 40% or more during the incident.
Market impact
What does this mean for investors?
Short term: Bearish sentiment and possible additional selling pressure.Medium term: Recovery depends on security fixes and restoring investor confidence.Long term: Kava's broader blockchain may remain operational, but confidence in its DeFi lending ecosystem could suffer.
My verdict
This is a serious security incident, not simply a normal market correction. Kava says the issue is contained within Kava Lend, but investors should wait for the official post-mortem and recovery plan before treating KAVA as a buying opportunity.
$KAVA $NVDAB #Follow4more #TipsForBeginners
Kava has confirmed unusual on-chain activity involving its lending protocol, Kava Lend, while stating that the incident was isolated to that application and did not involve unlimited token creation.
The incident occurred on November 14, 2026. Here's what happened.
What happened?
Protocol exploit: An attacker exploited a weakness in Kava Lend's nearly inactive BUSD lending market.Tokens drained: Approximately 55.2 million KAVA, worth around $3.76 million before the attack, were borrowed from the lending pool.Cross-chain transfers: Around 49.2 million KAVA were transferred to BNB Chain through Layer Zero.Tokens sold: The attacker sold the transferred tokens for approximately $2.09 million.Market crash: KAVA's price dropped roughly 40% or more during the incident.
Market impact
What does this mean for investors?
Short term: Bearish sentiment and possible additional selling pressure.Medium term: Recovery depends on security fixes and restoring investor confidence.Long term: Kava's broader blockchain may remain operational, but confidence in its DeFi lending ecosystem could suffer.
My verdict
This is a serious security incident, not simply a normal market correction. Kava says the issue is contained within Kava Lend, but investors should wait for the official post-mortem and recovery plan before treating KAVA as a buying opportunity.
$KAVA $NVDAB #Follow4more #TipsForBeginners
333
#kavasaysabnormalactivitylimitedtokavalend#kavasaysabnormalactivitylimitedtokavalend
The #KavaSaysAbnormalActivityLimitedToKavaLend statement refers to an official clarification issued by the Kava team on November 14, 2026, following a major security breach and subsequent token price crash.
🚨 What Happened?
The Incident: An attacker exploited Kava Lend (the native lending protocol on the Kava blockchain).The Mechanism: By manipulating an inactive BUSD liquidity pool, the attacker inflated their collateral index by roughly 243,000x. This allowed them to repeatedly borrow ~55.2 million KAVA tokens (valued at ~$3.7M prior to the attack) without providing equivalent real collateral.Cross-Chain Liquidation: The attacker bridged approximately 49.2 million KAVA over to the BNB Chain (BSC) via LayerZero and dumped them on open markets for ~$2.1 million in BNB and USDT.Market Crash: The sudden dumping of tens of millions of KAVA tokens caused the price of KAVA to plunge 40%–50% within hours.
📢 Kava's Official Response
To stem market panic, Kava issued an urgent announcement to clarify two major points:
Not an "Infinite Mint": Kava confirmed that the core blockchain protocol was not compromised and no unlimited token minting occurred at the base chain level.Isolated to Kava Lend: The flaw was strictly an isolated smart-contract manipulation within the Kava Lend dApp, meaning other ecosystem protocols and native wallet balances were not directly drained.
⚠️ Current Status & Impacts
Exchange Measures: Partner exchanges (including Upbit, Coinone, and Binance) temporarily suspended KAVA deposits and withdrawals as a standard precautionary measure. Upbit also placed KAVA on a monitoring/delisting caution list.Lending Pool Damage: While standard wallet holders didn't lose their tokens, the Kava Lend pool itself was severely drained of KAVA liquidity, creating short-term bad debt for the lending app.Bridge Actions: Portions of the stolen funds routed across bridges (like Axelar) were paused/blocked by relayers as security teams traced the
$KAVA $BTC #Follow4more #TipsForBeginners
#kavasaysabnormalactivitylimitedtokavalend
#kavasaysabnormalactivitylimitedtokavalend
The #KavaSaysAbnormalActivityLimitedToKavaLend statement refers to an official clarification issued by the Kava team on November 14, 2026, following a major security breach and subsequent token price crash.
🚨 What Happened?
The Incident: An attacker exploited Kava Lend (the native lending protocol on the Kava blockchain).The Mechanism: By manipulating an inactive BUSD liquidity pool, the attacker inflated their collateral index by roughly 243,000x. This allowed them to repeatedly borrow ~55.2 million KAVA tokens (valued at ~$3.7M prior to the attack) without providing equivalent real collateral.Cross-Chain Liquidation: The attacker bridged approximately 49.2 million KAVA over to the BNB Chain (BSC) via LayerZero and dumped them on open markets for ~$2.1 million in BNB and USDT.Market Crash: The sudden dumping of tens of millions of KAVA tokens caused the price of KAVA to plunge 40%–50% within hours.
📢 Kava's Official Response
To stem market panic, Kava issued an urgent announcement to clarify two major points:
Not an "Infinite Mint": Kava confirmed that the core blockchain protocol was not compromised and no unlimited token minting occurred at the base chain level.Isolated to Kava Lend: The flaw was strictly an isolated smart-contract manipulation within the Kava Lend dApp, meaning other ecosystem protocols and native wallet balances were not directly drained.
⚠️ Current Status & Impacts
Exchange Measures: Partner exchanges (including Upbit, Coinone, and Binance) temporarily suspended KAVA deposits and withdrawals as a standard precautionary measure. Upbit also placed KAVA on a monitoring/delisting caution list.Lending Pool Damage: While standard wallet holders didn't lose their tokens, the Kava Lend pool itself was severely drained of KAVA liquidity, creating short-term bad debt for the lending app.Bridge Actions: Portions of the stolen funds routed across bridges (like Axelar) were paused/blocked by relayers as security teams traced the
$KAVA $BTC #Follow4more #TipsForBeginners
The #KavaSaysAbnormalActivityLimitedToKavaLend statement refers to an official clarification issued by the Kava team on November 14, 2026, following a major security breach and subsequent token price crash.
🚨 What Happened?
The Incident: An attacker exploited Kava Lend (the native lending protocol on the Kava blockchain).The Mechanism: By manipulating an inactive BUSD liquidity pool, the attacker inflated their collateral index by roughly 243,000x. This allowed them to repeatedly borrow ~55.2 million KAVA tokens (valued at ~$3.7M prior to the attack) without providing equivalent real collateral.Cross-Chain Liquidation: The attacker bridged approximately 49.2 million KAVA over to the BNB Chain (BSC) via LayerZero and dumped them on open markets for ~$2.1 million in BNB and USDT.Market Crash: The sudden dumping of tens of millions of KAVA tokens caused the price of KAVA to plunge 40%–50% within hours.
📢 Kava's Official Response
To stem market panic, Kava issued an urgent announcement to clarify two major points:
Not an "Infinite Mint": Kava confirmed that the core blockchain protocol was not compromised and no unlimited token minting occurred at the base chain level.Isolated to Kava Lend: The flaw was strictly an isolated smart-contract manipulation within the Kava Lend dApp, meaning other ecosystem protocols and native wallet balances were not directly drained.
⚠️ Current Status & Impacts
Exchange Measures: Partner exchanges (including Upbit, Coinone, and Binance) temporarily suspended KAVA deposits and withdrawals as a standard precautionary measure. Upbit also placed KAVA on a monitoring/delisting caution list.Lending Pool Damage: While standard wallet holders didn't lose their tokens, the Kava Lend pool itself was severely drained of KAVA liquidity, creating short-term bad debt for the lending app.Bridge Actions: Portions of the stolen funds routed across bridges (like Axelar) were paused/blocked by relayers as security teams traced the
$KAVA $BTC #Follow4more #TipsForBeginners
1
296
TradFi for Beginners – What Is Traditional Finance#tradfiforbeginners
TradFi stands for Traditional Finance. It refers to the conventional financial system that includes banks, stock markets, investment companies, insurance firms and government-regulated financial institutions.
In simple words, TradFi is the financial system people have used for decades, before cryptocurrency and decentralized finance (DeFi) became popular.
1. Examples of TradFi
Banks
Saving accounts, loans, deposits and money transfers.
tock Markets
Buying and selling shares of companies like Apple and Microsoft.
Investment Funds
Mutual funds, ETFs and pension funds.
Insurance Companies
Life, health, vehicle and business insurance.
2. TradFi vs DeFi vs CeFi
3. Why is TradFi entering crypto?
Traditional financial institutions are increasingly exploring cryptocurrency because of:
Bitcoin ETFs and institutional investment.Tokenization of real-world assets.Blockchain-based payments.Stablecoins and digital dollars.Faster international settlements.
4. Important TradFi terms for crypto investors
5. Why should crypto investors understand TradFi?
TradFi has a major influence on cryptocurrency markets.
For example:
When the US Federal Reserve cuts interest rates, risk assets like Bitcoin may benefit.When institutional investors buy Bitcoin ETFs, demand can increase.When stock markets fall sharply, crypto can also experience selling pressure.
My suggestion: If you're following Bitcoin, Ethereum and crypto market news, understanding TradFi, Federal Reserve policy, interest rates and institutional ETF flows will help you understand why crypto prices move.
$BTC $ETH #Follow4more #tipsforbegginers
TradFi for Beginners – What Is Traditional Finance
#tradfiforbeginners
TradFi stands for Traditional Finance. It refers to the conventional financial system that includes banks, stock markets, investment companies, insurance firms and government-regulated financial institutions.
In simple words, TradFi is the financial system people have used for decades, before cryptocurrency and decentralized finance (DeFi) became popular.
1. Examples of TradFi
Banks
Saving accounts, loans, deposits and money transfers.
tock Markets
Buying and selling shares of companies like Apple and Microsoft.
Investment Funds
Mutual funds, ETFs and pension funds.
Insurance Companies
Life, health, vehicle and business insurance.
2. TradFi vs DeFi vs CeFi
3. Why is TradFi entering crypto?
Traditional financial institutions are increasingly exploring cryptocurrency because of:
Bitcoin ETFs and institutional investment.Tokenization of real-world assets.Blockchain-based payments.Stablecoins and digital dollars.Faster international settlements.
4. Important TradFi terms for crypto investors
5. Why should crypto investors understand TradFi?
TradFi has a major influence on cryptocurrency markets.
For example:
When the US Federal Reserve cuts interest rates, risk assets like Bitcoin may benefit.When institutional investors buy Bitcoin ETFs, demand can increase.When stock markets fall sharply, crypto can also experience selling pressure.
My suggestion: If you're following Bitcoin, Ethereum and crypto market news, understanding TradFi, Federal Reserve policy, interest rates and institutional ETF flows will help you understand why crypto prices move.
$BTC $ETH #Follow4more #tipsforbegginers
TradFi stands for Traditional Finance. It refers to the conventional financial system that includes banks, stock markets, investment companies, insurance firms and government-regulated financial institutions.
In simple words, TradFi is the financial system people have used for decades, before cryptocurrency and decentralized finance (DeFi) became popular.
1. Examples of TradFi
Banks
Saving accounts, loans, deposits and money transfers.
tock Markets
Buying and selling shares of companies like Apple and Microsoft.
Investment Funds
Mutual funds, ETFs and pension funds.
Insurance Companies
Life, health, vehicle and business insurance.
2. TradFi vs DeFi vs CeFi
3. Why is TradFi entering crypto?
Traditional financial institutions are increasingly exploring cryptocurrency because of:
Bitcoin ETFs and institutional investment.Tokenization of real-world assets.Blockchain-based payments.Stablecoins and digital dollars.Faster international settlements.
4. Important TradFi terms for crypto investors
5. Why should crypto investors understand TradFi?
TradFi has a major influence on cryptocurrency markets.
For example:
When the US Federal Reserve cuts interest rates, risk assets like Bitcoin may benefit.When institutional investors buy Bitcoin ETFs, demand can increase.When stock markets fall sharply, crypto can also experience selling pressure.
My suggestion: If you're following Bitcoin, Ethereum and crypto market news, understanding TradFi, Federal Reserve policy, interest rates and institutional ETF flows will help you understand why crypto prices move.
$BTC $ETH #Follow4more #tipsforbegginers
42
How do traders structure short setups on post-exploit relief rallies?#kavasaysabnormalactivitylimitedtokavalend
Trading short positions on post-exploit relief rallies (often referred to as a "dead-cat bounce") is a high-reward strategy, but it requires strict discipline. Because these bounces are driven by temporary short-covering, speculative dip-buyers, and low liquidity—rather than fundamental recovery—they eventually run out of steam as trapped holders (bagholders) use the higher prices to exit.
Here is the systematic blueprint traders use to identify, structure, and execute short setups on post-exploit relief rallies:
1. Wait for Technical Resistance & Volume Exhaustion
Never short a relief rally while it is aggressively pumping. Wait for clear signs that the bounce has reached structural resistance and momentum is fading:
Identify Broken Support (Flipped to Supply): Look at the key horizontal support level that broke during the initial crash (e.g., the pre-hack consolidation zone). In a relief rally, price almost always retests this level from below.Overhead EMAs (20-period / 50-period 4H EMA): Exploit crashes drag moving averages down sharply. A rally into the 4-Hour 20-EMA or 50-EMA often provides an ideal technical rejection zone.Volume Divergence: Watch for declining volume as the price rises. A relief rally moving up on shrinking volume indicates a lack of real spot buying power, signaling that the move is purely short-covering.Candle Rejections: Look for upper shadow wicks (shooting stars, bearish engulfing patterns, or long rejection wicks) on the 1-Hour and 4-Hour timeframes around key levels.
2. Execution Setup (Entry, Stop-Loss, and Targets)
Once a clear rejection pattern appears at resistance, structure the trade with a predefined risk-to-reward ratio (ideally 2.5:1 or higher):
Trigger Entry: Enter via limit orders inside the rejection supply belt or market entry upon a 1-Hour candle closing back below the resistance pivot.Stop-Loss (SL): Place the SL strictly above the swing high of the relief wick (typically 3%–5% above entry). If the price closes above the relief high, the thesis is invalidated (e.g., news of returned funds or investor bailout), and you must exit immediately.Take-Profit 1 (TP1): The initial crash low / local bottom. (Take 50% profit here and move SL to breakeven).Take-Profit 2 (TP2): New lower structural lows as Phase 3 fundamental decay takes over.
3. Key Fundamental Checks Before Shorting
Before pressing the short button, verify three critical fundamental conditions:
Check Team/Attacker News: Ensure there are no active white-hat negotiations or announcements of returned funds. Stolen fund returns trigger massive short-squeezes.Monitor Funding Rates: In extreme post-exploit crashes, perpetual funding rates flip heavily negative (shorts pay longs). If funding is excessively negative (e.g., $-0.1\%$ per 8 hours), holding a short position will incur expensive fee drag.Track Exchange Deposit Unlocks: If major central exchanges (CEXs) suspended deposits during the hack, wait to see when they reopen. Reopening deposits often triggers a second severe wave of spot selling, benefiting your short position.
4. Operational Risk Rules
Use Low Leverage (2x – 3x Max): Thin order books post-exploit cause extreme slippage and volatility wicks. High leverage will get liquidated during intraday spikes before the main trend continues downward.Beware of ADL (Auto-Deleveraging): If an exploited token is illiquid on derivatives platforms, exchanges may force-close your profitable short position via ADL if liquidity pools clear out.Risk Allocation: Keep trade risk capped at 1% to 1.5% of overall account equity.
$NVDAB $KAVA #Follow4more #TipsForBeginners
How do traders structure short setups on post-exploit relief rallies?
#kavasaysabnormalactivitylimitedtokavalend
Trading short positions on post-exploit relief rallies (often referred to as a "dead-cat bounce") is a high-reward strategy, but it requires strict discipline. Because these bounces are driven by temporary short-covering, speculative dip-buyers, and low liquidity—rather than fundamental recovery—they eventually run out of steam as trapped holders (bagholders) use the higher prices to exit.
Here is the systematic blueprint traders use to identify, structure, and execute short setups on post-exploit relief rallies:
1. Wait for Technical Resistance & Volume Exhaustion
Never short a relief rally while it is aggressively pumping. Wait for clear signs that the bounce has reached structural resistance and momentum is fading:
Identify Broken Support (Flipped to Supply): Look at the key horizontal support level that broke during the initial crash (e.g., the pre-hack consolidation zone). In a relief rally, price almost always retests this level from below.Overhead EMAs (20-period / 50-period 4H EMA): Exploit crashes drag moving averages down sharply. A rally into the 4-Hour 20-EMA or 50-EMA often provides an ideal technical rejection zone.Volume Divergence: Watch for declining volume as the price rises. A relief rally moving up on shrinking volume indicates a lack of real spot buying power, signaling that the move is purely short-covering.Candle Rejections: Look for upper shadow wicks (shooting stars, bearish engulfing patterns, or long rejection wicks) on the 1-Hour and 4-Hour timeframes around key levels.
2. Execution Setup (Entry, Stop-Loss, and Targets)
Once a clear rejection pattern appears at resistance, structure the trade with a predefined risk-to-reward ratio (ideally 2.5:1 or higher):
Trigger Entry: Enter via limit orders inside the rejection supply belt or market entry upon a 1-Hour candle closing back below the resistance pivot.Stop-Loss (SL): Place the SL strictly above the swing high of the relief wick (typically 3%–5% above entry). If the price closes above the relief high, the thesis is invalidated (e.g., news of returned funds or investor bailout), and you must exit immediately.Take-Profit 1 (TP1): The initial crash low / local bottom. (Take 50% profit here and move SL to breakeven).Take-Profit 2 (TP2): New lower structural lows as Phase 3 fundamental decay takes over.
3. Key Fundamental Checks Before Shorting
Before pressing the short button, verify three critical fundamental conditions:
Check Team/Attacker News: Ensure there are no active white-hat negotiations or announcements of returned funds. Stolen fund returns trigger massive short-squeezes.Monitor Funding Rates: In extreme post-exploit crashes, perpetual funding rates flip heavily negative (shorts pay longs). If funding is excessively negative (e.g., $-0.1\%$ per 8 hours), holding a short position will incur expensive fee drag.Track Exchange Deposit Unlocks: If major central exchanges (CEXs) suspended deposits during the hack, wait to see when they reopen. Reopening deposits often triggers a second severe wave of spot selling, benefiting your short position.
4. Operational Risk Rules
Use Low Leverage (2x – 3x Max): Thin order books post-exploit cause extreme slippage and volatility wicks. High leverage will get liquidated during intraday spikes before the main trend continues downward.Beware of ADL (Auto-Deleveraging): If an exploited token is illiquid on derivatives platforms, exchanges may force-close your profitable short position via ADL if liquidity pools clear out.Risk Allocation: Keep trade risk capped at 1% to 1.5% of overall account equity.
$NVDAB $KAVA #Follow4more #TipsForBeginners
Trading short positions on post-exploit relief rallies (often referred to as a "dead-cat bounce") is a high-reward strategy, but it requires strict discipline. Because these bounces are driven by temporary short-covering, speculative dip-buyers, and low liquidity—rather than fundamental recovery—they eventually run out of steam as trapped holders (bagholders) use the higher prices to exit.
Here is the systematic blueprint traders use to identify, structure, and execute short setups on post-exploit relief rallies:
1. Wait for Technical Resistance & Volume Exhaustion
Never short a relief rally while it is aggressively pumping. Wait for clear signs that the bounce has reached structural resistance and momentum is fading:
Identify Broken Support (Flipped to Supply): Look at the key horizontal support level that broke during the initial crash (e.g., the pre-hack consolidation zone). In a relief rally, price almost always retests this level from below.Overhead EMAs (20-period / 50-period 4H EMA): Exploit crashes drag moving averages down sharply. A rally into the 4-Hour 20-EMA or 50-EMA often provides an ideal technical rejection zone.Volume Divergence: Watch for declining volume as the price rises. A relief rally moving up on shrinking volume indicates a lack of real spot buying power, signaling that the move is purely short-covering.Candle Rejections: Look for upper shadow wicks (shooting stars, bearish engulfing patterns, or long rejection wicks) on the 1-Hour and 4-Hour timeframes around key levels.
2. Execution Setup (Entry, Stop-Loss, and Targets)
Once a clear rejection pattern appears at resistance, structure the trade with a predefined risk-to-reward ratio (ideally 2.5:1 or higher):
Trigger Entry: Enter via limit orders inside the rejection supply belt or market entry upon a 1-Hour candle closing back below the resistance pivot.Stop-Loss (SL): Place the SL strictly above the swing high of the relief wick (typically 3%–5% above entry). If the price closes above the relief high, the thesis is invalidated (e.g., news of returned funds or investor bailout), and you must exit immediately.Take-Profit 1 (TP1): The initial crash low / local bottom. (Take 50% profit here and move SL to breakeven).Take-Profit 2 (TP2): New lower structural lows as Phase 3 fundamental decay takes over.
3. Key Fundamental Checks Before Shorting
Before pressing the short button, verify three critical fundamental conditions:
Check Team/Attacker News: Ensure there are no active white-hat negotiations or announcements of returned funds. Stolen fund returns trigger massive short-squeezes.Monitor Funding Rates: In extreme post-exploit crashes, perpetual funding rates flip heavily negative (shorts pay longs). If funding is excessively negative (e.g., $-0.1\%$ per 8 hours), holding a short position will incur expensive fee drag.Track Exchange Deposit Unlocks: If major central exchanges (CEXs) suspended deposits during the hack, wait to see when they reopen. Reopening deposits often triggers a second severe wave of spot selling, benefiting your short position.
4. Operational Risk Rules
Use Low Leverage (2x – 3x Max): Thin order books post-exploit cause extreme slippage and volatility wicks. High leverage will get liquidated during intraday spikes before the main trend continues downward.Beware of ADL (Auto-Deleveraging): If an exploited token is illiquid on derivatives platforms, exchanges may force-close your profitable short position via ADL if liquidity pools clear out.Risk Allocation: Keep trade risk capped at 1% to 1.5% of overall account equity.
$NVDAB $KAVA #Follow4more #TipsForBeginners
192
#whowillsucceedjensenhuangatnvidia?#whowillsucceedjensenhuangatnvidia?
Following Jensen Huang’s resignation as CEO, President, and Board Member, Colette Kress, Nvidia's long-serving Chief Financial Officer (CFO), is currently serving as interim CEO.
Nvidia’s Board of Directors has formally initiated a search process to select a permanent CEO, considering both internal executives and external industry leaders. The board has also appointed longtime director Harvey C. Jones as its first-ever Board Chair to oversee the transition and executive search.
Primary Contenders Being Considered
1. Internal Candidates (Technical & Operational Insiders)
Colette Kress (Interim CEO & CFO): Having led Nvidia's financial operations since 2013, Kress is Wall Street's most familiar hand. While she offers business stability, analysts note that a long-term CEO for Nvidia may require deep semiconductor engineering credentials, which could lead to a co-leadership setup or an engineer-first hire.
Ian Buck (VP of Hyperscale & High-Performance Computing): Considered a favorite among technical insiders and market speculators, Buck has been with Nvidia for over 20 years. He is best known as the co-creator of CUDA—the parallel computing platform that serves as Nvidia’s software moat in AI.
Debora Shoquist (EVP of Operations): Oversees Nvidia’s global supply chain and foundry relationships. She offers deep operational continuity, though her focus has historically been execution rather than corporate strategy or public leadership.
2. External & Semiconductor Industry Leaders
René Haas (CEO of Arm): Haas spent seven years at Nvidia as Vice President of Computing Products before taking the helm at Arm. His familiarity with Nvidia’s corporate culture paired with proven public CEO experience makes him a top external name.
Johny Srouji (SVP of Hardware Technologies at Apple): Highly regarded across Silicon Valley for building Apple's custom silicon (M-series and A-series chips), Srouji represents a top-tier engineering leader if Nvidia elects to hire from outside.
Key Structural Challenges for the Next CEO
Management Structure: Huang ran Nvidia with a notoriously flat organizational structure, maintaining roughly 60 direct reports. Restructuring this hub-and-spoke model into traditional executive tiers will likely be a first priority for any permanent successor.
Technical Vision vs. Financial Execution: Analysts speculate the board may favor a dual-leadership model or pair an executive-focused CEO (like Kress) with a visionary technical leader (like Buck) to balance Wall Street confidence with product innovation.
$NVDL $USD1 #Follow4more #TipsForBeginners
#whowillsucceedjensenhuangatnvidia?
#whowillsucceedjensenhuangatnvidia?
Following Jensen Huang’s resignation as CEO, President, and Board Member, Colette Kress, Nvidia's long-serving Chief Financial Officer (CFO), is currently serving as interim CEO.
Nvidia’s Board of Directors has formally initiated a search process to select a permanent CEO, considering both internal executives and external industry leaders. The board has also appointed longtime director Harvey C. Jones as its first-ever Board Chair to oversee the transition and executive search.
Primary Contenders Being Considered
1. Internal Candidates (Technical & Operational Insiders)
Colette Kress (Interim CEO & CFO): Having led Nvidia's financial operations since 2013, Kress is Wall Street's most familiar hand. While she offers business stability, analysts note that a long-term CEO for Nvidia may require deep semiconductor engineering credentials, which could lead to a co-leadership setup or an engineer-first hire.
Ian Buck (VP of Hyperscale & High-Performance Computing): Considered a favorite among technical insiders and market speculators, Buck has been with Nvidia for over 20 years. He is best known as the co-creator of CUDA—the parallel computing platform that serves as Nvidia’s software moat in AI.
Debora Shoquist (EVP of Operations): Oversees Nvidia’s global supply chain and foundry relationships. She offers deep operational continuity, though her focus has historically been execution rather than corporate strategy or public leadership.
2. External & Semiconductor Industry Leaders
René Haas (CEO of Arm): Haas spent seven years at Nvidia as Vice President of Computing Products before taking the helm at Arm. His familiarity with Nvidia’s corporate culture paired with proven public CEO experience makes him a top external name.
Johny Srouji (SVP of Hardware Technologies at Apple): Highly regarded across Silicon Valley for building Apple's custom silicon (M-series and A-series chips), Srouji represents a top-tier engineering leader if Nvidia elects to hire from outside.
Key Structural Challenges for the Next CEO
Management Structure: Huang ran Nvidia with a notoriously flat organizational structure, maintaining roughly 60 direct reports. Restructuring this hub-and-spoke model into traditional executive tiers will likely be a first priority for any permanent successor.
Technical Vision vs. Financial Execution: Analysts speculate the board may favor a dual-leadership model or pair an executive-focused CEO (like Kress) with a visionary technical leader (like Buck) to balance Wall Street confidence with product innovation.
$NVDL $USD1 #Follow4more #TipsForBeginners
Following Jensen Huang’s resignation as CEO, President, and Board Member, Colette Kress, Nvidia's long-serving Chief Financial Officer (CFO), is currently serving as interim CEO.
Nvidia’s Board of Directors has formally initiated a search process to select a permanent CEO, considering both internal executives and external industry leaders. The board has also appointed longtime director Harvey C. Jones as its first-ever Board Chair to oversee the transition and executive search.
Primary Contenders Being Considered
1. Internal Candidates (Technical & Operational Insiders)
Colette Kress (Interim CEO & CFO): Having led Nvidia's financial operations since 2013, Kress is Wall Street's most familiar hand. While she offers business stability, analysts note that a long-term CEO for Nvidia may require deep semiconductor engineering credentials, which could lead to a co-leadership setup or an engineer-first hire.
Ian Buck (VP of Hyperscale & High-Performance Computing): Considered a favorite among technical insiders and market speculators, Buck has been with Nvidia for over 20 years. He is best known as the co-creator of CUDA—the parallel computing platform that serves as Nvidia’s software moat in AI.
Debora Shoquist (EVP of Operations): Oversees Nvidia’s global supply chain and foundry relationships. She offers deep operational continuity, though her focus has historically been execution rather than corporate strategy or public leadership.
2. External & Semiconductor Industry Leaders
René Haas (CEO of Arm): Haas spent seven years at Nvidia as Vice President of Computing Products before taking the helm at Arm. His familiarity with Nvidia’s corporate culture paired with proven public CEO experience makes him a top external name.
Johny Srouji (SVP of Hardware Technologies at Apple): Highly regarded across Silicon Valley for building Apple's custom silicon (M-series and A-series chips), Srouji represents a top-tier engineering leader if Nvidia elects to hire from outside.
Key Structural Challenges for the Next CEO
Management Structure: Huang ran Nvidia with a notoriously flat organizational structure, maintaining roughly 60 direct reports. Restructuring this hub-and-spoke model into traditional executive tiers will likely be a first priority for any permanent successor.
Technical Vision vs. Financial Execution: Analysts speculate the board may favor a dual-leadership model or pair an executive-focused CEO (like Kress) with a visionary technical leader (like Buck) to balance Wall Street confidence with product innovation.
$NVDL $USD1 #Follow4more #TipsForBeginners
86
What are the current technical chart levels and support zones for KAVA after the crash?#kavasaysabnormalactivitylimitedtokavalend
Following the 40%–50% flash crash triggered by the Kava Lend protocol exploit on November 14, 2026, KAVA/USDT has broken out of its multi-month market structure, entering a high-volatility price discovery zone to the downside.
Because the collapse was driven by fundamental sell-side saturation (the attacker dumping ~49.2 million bridged KAVA tokens onto BNB Smart Chain) rather than standard technical price action, historical moving averages have been invalidated. The market is currently attempting to build a temporary stabilization base.
1. Key Technical Chart Level Map
2. Detailed Technical Breakdown
A. Resistance Barriers (Upside Reclaim Targets)
$0.042 – $0.045 (Immediate Resistance): This zone represents the initial hourly relief bounce high following the crash. To signal short-term technical recovery, KAVA must register a daily candle close above $0.042. Until then, any intraday upward moves remain vulnerable to relief-rally shorting.$0.068 – $0.070 (Major Resistance Wall): The pre-attack support area now acts as dense overhead supply. Overcoming this level would require full fundamental resolution (e.g., compensation plans for affected pools and restoration of exchange deposits).
B. Support Zones & Liquidity Base
$0.035 – $0.037 (Immediate Local Support): KAVA tested a low near $0.037 during the initial sell-off and is attempting to construct a tight consolidation range between $0.035 and $0.038.$0.028 – $0.030 (Crucial Line in the Sand): Analysts point to $0.028 as the key lower macro support floor. Holding above $0.028 keeps the door open for a gradual accumulation phase. A daily breakdown below $0.028 would risk another wave of capitulation.
C. Momentum Indicators
Relative Strength Index (RSI): The 14-period daily RSI dropped heavily into deeply oversold territory (~20–30). While oversold conditions often invite short-term tactical relief bounces, RSI divergence alone is insufficient for a reversal signal without volume absorption.Exchange Restraints: With major exchanges like Upbit, Bithumb, and Coinone temporarily pausing deposits/withdrawals, overall spot market order books remain thin, amplifying price slippage in both directions.
💡 Tactical Execution Guidance
Avoid High Leverage: High volatility and thin order-book liquidity mean high risk of liquidation wicks in both directions.Monitor Exchange Status: Track official exchange announcements regarding the reopening of KAVA deposits/withdrawals, as sudden deposit unlocks could trigger secondary sell pressure.Wait for Structural Confirmation: Conservative traders typically wait for a daily close back above $0.042 before considering spot re-entry positions.
$KAVA $ETH #Follow4more #TipsForBeginners
What are the current technical chart levels and support zones for KAVA after the crash?
#kavasaysabnormalactivitylimitedtokavalend
Following the 40%–50% flash crash triggered by the Kava Lend protocol exploit on November 14, 2026, KAVA/USDT has broken out of its multi-month market structure, entering a high-volatility price discovery zone to the downside.
Because the collapse was driven by fundamental sell-side saturation (the attacker dumping ~49.2 million bridged KAVA tokens onto BNB Smart Chain) rather than standard technical price action, historical moving averages have been invalidated. The market is currently attempting to build a temporary stabilization base.
1. Key Technical Chart Level Map
2. Detailed Technical Breakdown
A. Resistance Barriers (Upside Reclaim Targets)
$0.042 – $0.045 (Immediate Resistance): This zone represents the initial hourly relief bounce high following the crash. To signal short-term technical recovery, KAVA must register a daily candle close above $0.042. Until then, any intraday upward moves remain vulnerable to relief-rally shorting.$0.068 – $0.070 (Major Resistance Wall): The pre-attack support area now acts as dense overhead supply. Overcoming this level would require full fundamental resolution (e.g., compensation plans for affected pools and restoration of exchange deposits).
B. Support Zones & Liquidity Base
$0.035 – $0.037 (Immediate Local Support): KAVA tested a low near $0.037 during the initial sell-off and is attempting to construct a tight consolidation range between $0.035 and $0.038.$0.028 – $0.030 (Crucial Line in the Sand): Analysts point to $0.028 as the key lower macro support floor. Holding above $0.028 keeps the door open for a gradual accumulation phase. A daily breakdown below $0.028 would risk another wave of capitulation.
C. Momentum Indicators
Relative Strength Index (RSI): The 14-period daily RSI dropped heavily into deeply oversold territory (~20–30). While oversold conditions often invite short-term tactical relief bounces, RSI divergence alone is insufficient for a reversal signal without volume absorption.Exchange Restraints: With major exchanges like Upbit, Bithumb, and Coinone temporarily pausing deposits/withdrawals, overall spot market order books remain thin, amplifying price slippage in both directions.
💡 Tactical Execution Guidance
Avoid High Leverage: High volatility and thin order-book liquidity mean high risk of liquidation wicks in both directions.Monitor Exchange Status: Track official exchange announcements regarding the reopening of KAVA deposits/withdrawals, as sudden deposit unlocks could trigger secondary sell pressure.Wait for Structural Confirmation: Conservative traders typically wait for a daily close back above $0.042 before considering spot re-entry positions.
$KAVA $ETH #Follow4more #TipsForBeginners
Following the 40%–50% flash crash triggered by the Kava Lend protocol exploit on November 14, 2026, KAVA/USDT has broken out of its multi-month market structure, entering a high-volatility price discovery zone to the downside.
Because the collapse was driven by fundamental sell-side saturation (the attacker dumping ~49.2 million bridged KAVA tokens onto BNB Smart Chain) rather than standard technical price action, historical moving averages have been invalidated. The market is currently attempting to build a temporary stabilization base.
1. Key Technical Chart Level Map
2. Detailed Technical Breakdown
A. Resistance Barriers (Upside Reclaim Targets)
$0.042 – $0.045 (Immediate Resistance): This zone represents the initial hourly relief bounce high following the crash. To signal short-term technical recovery, KAVA must register a daily candle close above $0.042. Until then, any intraday upward moves remain vulnerable to relief-rally shorting.$0.068 – $0.070 (Major Resistance Wall): The pre-attack support area now acts as dense overhead supply. Overcoming this level would require full fundamental resolution (e.g., compensation plans for affected pools and restoration of exchange deposits).
B. Support Zones & Liquidity Base
$0.035 – $0.037 (Immediate Local Support): KAVA tested a low near $0.037 during the initial sell-off and is attempting to construct a tight consolidation range between $0.035 and $0.038.$0.028 – $0.030 (Crucial Line in the Sand): Analysts point to $0.028 as the key lower macro support floor. Holding above $0.028 keeps the door open for a gradual accumulation phase. A daily breakdown below $0.028 would risk another wave of capitulation.
C. Momentum Indicators
Relative Strength Index (RSI): The 14-period daily RSI dropped heavily into deeply oversold territory (~20–30). While oversold conditions often invite short-term tactical relief bounces, RSI divergence alone is insufficient for a reversal signal without volume absorption.Exchange Restraints: With major exchanges like Upbit, Bithumb, and Coinone temporarily pausing deposits/withdrawals, overall spot market order books remain thin, amplifying price slippage in both directions.
💡 Tactical Execution Guidance
Avoid High Leverage: High volatility and thin order-book liquidity mean high risk of liquidation wicks in both directions.Monitor Exchange Status: Track official exchange announcements regarding the reopening of KAVA deposits/withdrawals, as sudden deposit unlocks could trigger secondary sell pressure.Wait for Structural Confirmation: Conservative traders typically wait for a daily close back above $0.042 before considering spot re-entry positions.
$KAVA $ETH #Follow4more #TipsForBeginners
130
Who Will Succeed Jensen Huang at Nvidia#whowillsucceedjensenhuangatnvidia?
Jensen Huang is the co-founder, president and CEO of Nvidia. The question of his successor is becoming increasingly important as Nvidia grows into one of the world's most influential AI and semiconductor companies.
The key point: Nvidia has not publicly announced a confirmed successor to Jensen Huang. Any names discussed as potential successors should be treated as speculation unless officially confirmed.
Leading candidates
1. Ian Buck
Strong internal contender
Helped develop CUDA.Leads important AI computing operations.Strong technical background.
2. Colette Kress
Interim CEO
Nvidia's longtime CFO.Deep knowledge of company operations.Already appointed interim CEO.
3. René Haas
Former Nvidia executive.Experienced semiconductor industry leader.Potential external candidate.
4. Lisa Su
CEO of AMD, Nvidia's major competitor.Strong semiconductor leadership experience.An unlikely move away from AMD.
What happened at Nvidia?
According to Nvidia's November 12, 2026 announcement, Jensen Huang resigned as CEO, Colette Kress became interim CEO, and the board began searching for a permanent replacement.
My assessment: Ian Buck is an interesting long-term internal candidate, while Colette Kress is currently leading the company on an interim basis. No permanent successor has been confirmed.
$NVDAB $BTC #Follow4more #TipsForBeginners
Who Will Succeed Jensen Huang at Nvidia
#whowillsucceedjensenhuangatnvidia?
Jensen Huang is the co-founder, president and CEO of Nvidia. The question of his successor is becoming increasingly important as Nvidia grows into one of the world's most influential AI and semiconductor companies.
The key point: Nvidia has not publicly announced a confirmed successor to Jensen Huang. Any names discussed as potential successors should be treated as speculation unless officially confirmed.
Leading candidates
1. Ian Buck
Strong internal contender
Helped develop CUDA.Leads important AI computing operations.Strong technical background.
2. Colette Kress
Interim CEO
Nvidia's longtime CFO.Deep knowledge of company operations.Already appointed interim CEO.
3. René Haas
Former Nvidia executive.Experienced semiconductor industry leader.Potential external candidate.
4. Lisa Su
CEO of AMD, Nvidia's major competitor.Strong semiconductor leadership experience.An unlikely move away from AMD.
What happened at Nvidia?
According to Nvidia's November 12, 2026 announcement, Jensen Huang resigned as CEO, Colette Kress became interim CEO, and the board began searching for a permanent replacement.
My assessment: Ian Buck is an interesting long-term internal candidate, while Colette Kress is currently leading the company on an interim basis. No permanent successor has been confirmed.
$NVDAB $BTC #Follow4more #TipsForBeginners
Jensen Huang is the co-founder, president and CEO of Nvidia. The question of his successor is becoming increasingly important as Nvidia grows into one of the world's most influential AI and semiconductor companies.
The key point: Nvidia has not publicly announced a confirmed successor to Jensen Huang. Any names discussed as potential successors should be treated as speculation unless officially confirmed.
Leading candidates
1. Ian Buck
Strong internal contender
Helped develop CUDA.Leads important AI computing operations.Strong technical background.
2. Colette Kress
Interim CEO
Nvidia's longtime CFO.Deep knowledge of company operations.Already appointed interim CEO.
3. René Haas
Former Nvidia executive.Experienced semiconductor industry leader.Potential external candidate.
4. Lisa Su
CEO of AMD, Nvidia's major competitor.Strong semiconductor leadership experience.An unlikely move away from AMD.
What happened at Nvidia?
According to Nvidia's November 12, 2026 announcement, Jensen Huang resigned as CEO, Colette Kress became interim CEO, and the board began searching for a permanent replacement.
My assessment: Ian Buck is an interesting long-term internal candidate, while Colette Kress is currently leading the company on an interim basis. No permanent successor has been confirmed.
$NVDAB $BTC #Follow4more #TipsForBeginners
102
crytpo update on 16-11-26The crypto market enters November 16, 2026 facing persistent sell pressure following a turbulent multi-week correction. Market sentiment has fallen deep into extreme fear (Fear & Greed Index at 13), largely driven by continuous ETF net redemptions, technical breakdowns below key moving averages, and institutional rotation ahead of major macro events.
1. Market Overview & Major Asset Prices
Bitcoin (BTC): Trading in the $63,000 – $64,800 range down ~17% over the past month. The breakdown below the crucial 200-week simple moving average (~$67,800) has shifted short-term control back to the bears.Ethereum (ETH): Following broader market weakness, ETH is testing support near the $3,100 – $3,250 zone with heightened short-term derivative volatility.Altcoin Sector: Major Layer 1 assets show mixed, choppy price action. Select DeFi protocols (e.g., AAVE +4.2%) show isolated buyer interest, while broader high-beta altcoins continue to bleed market share back into cash and stablecoins.
2. Core Market Drivers
3. Key Technical Levels to Watch
Primary Resistance: $67,800 (200-week SMA floor recently flipped to overhead resistance) and $70,000 (psychological round level).Immediate Support: $62,000 – $63,000 (recent local swing low zone).Major Bear Target / Safety Floor: $58,570 (the 12-month low set back on July 1, 2026).
$BTC #Follow4more #SupportCreators #TipsForBeginners
crytpo update on 16-11-26
The crypto market enters November 16, 2026 facing persistent sell pressure following a turbulent multi-week correction. Market sentiment has fallen deep into extreme fear (Fear & Greed Index at 13), largely driven by continuous ETF net redemptions, technical breakdowns below key moving averages, and institutional rotation ahead of major macro events.
1. Market Overview & Major Asset Prices
Bitcoin (BTC): Trading in the $63,000 – $64,800 range down ~17% over the past month. The breakdown below the crucial 200-week simple moving average (~$67,800) has shifted short-term control back to the bears.Ethereum (ETH): Following broader market weakness, ETH is testing support near the $3,100 – $3,250 zone with heightened short-term derivative volatility.Altcoin Sector: Major Layer 1 assets show mixed, choppy price action. Select DeFi protocols (e.g., AAVE +4.2%) show isolated buyer interest, while broader high-beta altcoins continue to bleed market share back into cash and stablecoins.
2. Core Market Drivers
3. Key Technical Levels to Watch
Primary Resistance: $67,800 (200-week SMA floor recently flipped to overhead resistance) and $70,000 (psychological round level).Immediate Support: $62,000 – $63,000 (recent local swing low zone).Major Bear Target / Safety Floor: $58,570 (the 12-month low set back on July 1, 2026).
$BTC #Follow4more #SupportCreators #TipsForBeginners
1. Market Overview & Major Asset Prices
Bitcoin (BTC): Trading in the $63,000 – $64,800 range down ~17% over the past month. The breakdown below the crucial 200-week simple moving average (~$67,800) has shifted short-term control back to the bears.Ethereum (ETH): Following broader market weakness, ETH is testing support near the $3,100 – $3,250 zone with heightened short-term derivative volatility.Altcoin Sector: Major Layer 1 assets show mixed, choppy price action. Select DeFi protocols (e.g., AAVE +4.2%) show isolated buyer interest, while broader high-beta altcoins continue to bleed market share back into cash and stablecoins.
2. Core Market Drivers
3. Key Technical Levels to Watch
Primary Resistance: $67,800 (200-week SMA floor recently flipped to overhead resistance) and $70,000 (psychological round level).Immediate Support: $62,000 – $63,000 (recent local swing low zone).Major Bear Target / Safety Floor: $58,570 (the 12-month low set back on July 1, 2026).
$BTC #Follow4more #SupportCreators #TipsForBeginners
62
Log in to explore more content
Join global crypto users on Binance Square
⚡️ Get latest and useful information about crypto.
💬 Trusted by the world’s largest crypto exchange.
👍 Discover real insights from verified creators.
Email / Phone number
Trending Topics
1
#A Packed Week of Earnings and Data Tests Markets
45,840 views
318 Discussing
2
#AnthropicIPOTestsInvestorAppetiteForAI
67,640 views
1,090 Discussing
3
#BitcoinExtendsLosingStreakToSixWeeks
30,313 views
438 Discussing
4
#XRPFallsTo$0.89LowestSinceNovember2024
6,792 views
42 Discussing
5
#HuangReportedlyConsidersReturnToNvidia
88,035 views
1,039 Discussing
6
#SP500AndNasdaqFuturesHitQuarterlyLows
8,848 views
134 Discussing
7
#CaliforniaVotersBackProp42BarringNewCryptoTaxes
6,757 views
139 Discussing
8
#HKPlansDigitalAssetRegulatoryBillByYearEnd
6,495 views
103 Discussing
9
#MUFGSMFGMizuhoPlanYenBackedStablecoin
19,779 views
223 Discussing
10
#HKMAAndSwiftExploreTokenizedDepositInteroperability
951 views
15 Discussing